Embed Size (px)
Citation preview
Loughborough UniversityInstitutional Repository
Resource Accessibility andVulnerability in AndhraPradesh: Caste andNon-Caste Influences
This item was submitted to Loughborough University's Institutional Repositoryby the/an author.
Citation: BOSHER, L.S., PENNING-ROWSELL, E. and TAPSELL, S., 2007.Resource Accessibility and Vulnerability in Andhra Pradesh: Caste and Non-Caste Influences. Development and Change, 38 (4), pp. 615 - 640
Additional Information:
• This article was published in the journal, Development and Change[ c© Blackwell Publishing]. The definitive version is available atwww.blackwell-synergy.com
Metadata Record: https://dspace.lboro.ac.uk/2134/4246
Version: Accepted for publication
Publisher: c© Blackwell Publishing Ltd
Please cite the published version.
This item was submitted to Loughborough’s Institutional Repository (https://dspace.lboro.ac.uk/) by the author and is made available under the
following Creative Commons Licence conditions.
For the full text of this licence, please go to: http://creativecommons.org/licenses/by-nc-nd/2.5/
Resource Accessibility and Vulnerability in Andhra Pradesh:
Caste and Non-Caste Influences Lee Bosher, Edmund Penning-Rowsell and Sue Tapsell
ABSTRACT
Coastal Andhra Pradesh in southern India is prone to tropical cyclones. Access
to key resources can reduce the vulnerability of the local population to both
large-scale disasters, such as cyclones, and to the sort of small-scale crises that
affect their everyday lives. This article uses primary fieldwork to present a
resource accessibility vulnerability index for over 300 respondents. The index
indicates that caste is the key factor in determining who has assets, who can
access public facilities, who has political connections and who has supportive
social networks. The ‘lower’ castes (which tend to be the poorest) are
marginalized to the extent that they lack access to assets, public facilities and
opportunities to improve their plight. However, the research also indicates that
the poor and powerless lower castes are able to utilize informal social
networks to bolster their resilience, typically by women’s participation with
CBOs and NGOs. Nevertheless it is doubtful whether this extra social capital
counterbalances the overall results which show that — despite decades of
counteractions by government — caste remains a dominant variable affecting
the vulnerability of the people of coastal Andhra Pradesh to the hazards that
they face. ----------------------- (First, unnumbered footnote) The authors are grateful to Middlesex University for financing this research and to Peter
Winchester, Sarah Bradshaw and the anonymous reviewers of the journal for their advice. In
addition, we would like to thank the individuals and organizations that provided valuable
assistance during data collection in Andhra Pradesh. Most importantly, we would like to
express our gratitude to all the villagers involved in this study for their time, patience, and
generous hospitality.
2
INTRODUCTION
Disaster management has moved away from relief and disaster preparedness, towards a
more sustainable approach involving the management of risks (Coles and Buckle,
2004), incorporating strategies for both hazard mitigation and vulnerability reduction.
The multi-disciplinary range of modern disaster management strategies is also based
on long-term social, economic and environmental adaptations that draw upon
assessments of risk, vulnerability and resilience of the individual and the ‘community’1
(ibid.).
The pragmatic underpinning of these trends is that when governmental
resources are limited or stretched, in-built community level survival strategies such as
neighbourly help can augment individual, family and community resilience, and
government assistance. However, the ability of an individual, family or community to
prepare for, withstand and respond to a hazard or crisis can be constrained by a number
of factors such as social status, wealth or poverty, ethnicity, age and gender (Wisner et
al., 2004). This article attempts to enhance awareness of the myriad types of human
vulnerability — in this case, to cyclone impacts — in the context of rural coastal south
India. This is done by assessing ‘potential resilience’ through a focus upon villagers’
access to key socio-economic resources, such as public facilities, assets and social and
political networks. An underlying hypothesis is that social capital in the form of these
social and political networks might be a substitute for the economic capital that we
know enhances resilience (Agarwal, 1990; Davies and Hossain, 1997; Winchester,
1992).
The Context
Andhra Pradesh is the third largest state in India, covering 275,000 km², bordering the
Bay of Bengal. It is also one of the most cyclone-prone regions of the world.
1 The word ‘community’ has a number of different meanings which are context specific (Marsh and Buckle, 2001). In the research from which this article originates, 94 per cent of respondents based their concept of community on caste categories, which may (in a single caste village) or may not (in a multi-caste village) equate to the whole village geographically (Bosher, 2005).
3
Historically, tropical cyclones have been the cause of large-scale losses of human life,
livestock, crops, property and infrastructure in Andhra Pradesh, with serious adverse
effects on the local and regional economies. Despite the threat of cyclones and floods
to the livelihoods and lives of millions of people, many inhabitants remain in the area,
through poverty and lack of choices, striving to live in regions dominated by mangrove
swamps, brackish rivulets, aquaculture tanks and paddy fields (Reddy et al., 2000).
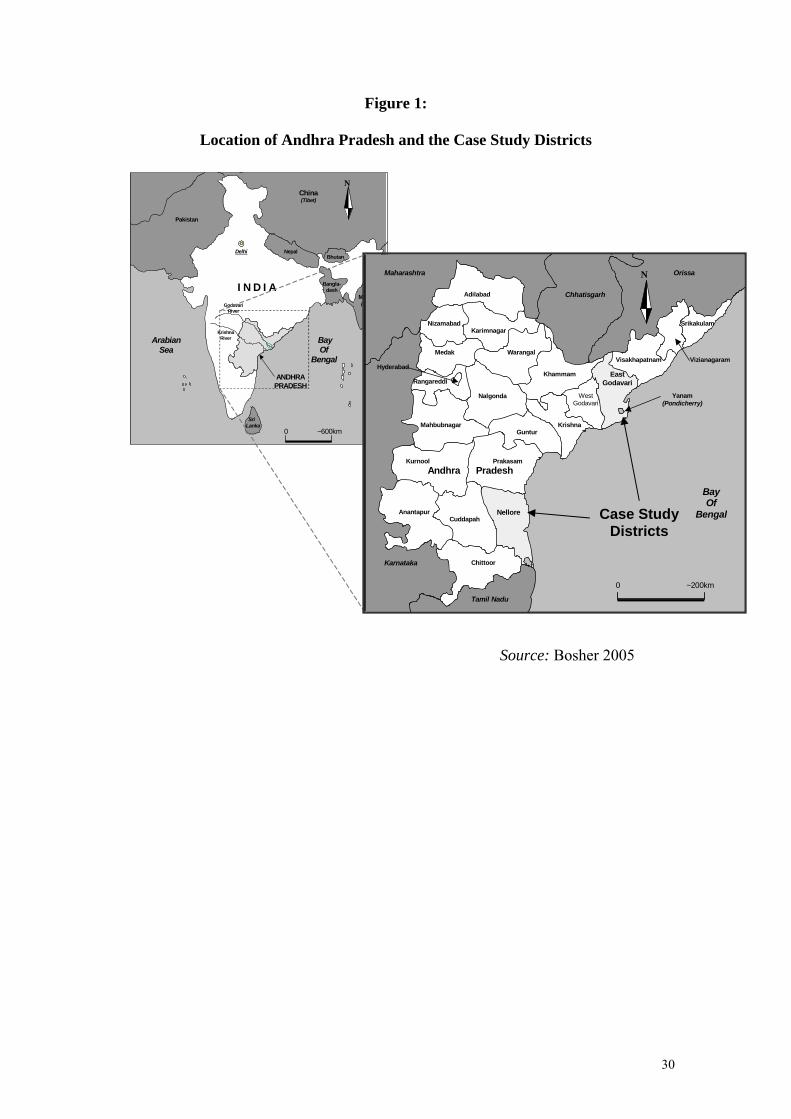
For the purposes of this study, two regions were selected for research (see
Figure 1). East Godavari was chosen because of the relatively recent cyclone disaster
that affected the area in November 1996, and the subsequent vulnerability reduction
initiatives undertaken by the Andhra Pradesh State Government and local NGOs.
These vulnerability reduction initiatives included the construction of community
cyclone shelters, storm warning systems, improved evacuation measures, hazard
mapping and enhanced community preparedness through education programmes in
cyclone-prone areas (Parasuramam and Unnikrishnan, 2000; Reddy et al., 2000). A
second region, Nellore, was chosen because of its long history of cyclone disasters,
being the most cyclone-affected district in coastal Andhra Pradesh (Reddy et al.,
2000).
(Figure 1 about here)
Methodology
The research reported here was conducted in eight coastal villages in East Godavari
district and four coastal villages in Nellore district between February and November
2002 (for more details, see Bosher, 2005, 2007). Emphasis was placed upon the
combined use of qualitative and quantitative research methods and the use of
triangulation to facilitate rigorous data collection and to allow cross-checking of data
during analysis. The respondents were selected using a stratified random sampling
technique based on five types of housing2 found in the case study villages.
2 Categories of housing used in this study were: Large Pukka (framed concrete housing); Basic Pukka (basic concrete housing, usually constructed with financial assistance of government and/or NGOs); Traditional style tiled housing (typically constructed of mud brick with clay tile roofs); Kutcha houses (basic houses with wood and mud brick walls with thatched roofs); and
4
Questionnaire surveys3 using open and closed questions were undertaken with
respondents from the villages, local non-governmental organizations (NGOs) and
members of local (Zilla Parishad) and mandal4 level government administrations.
Detailed cartographic and demographic surveys of the villages were undertaken and
sociograms were used (ibid.) to assess individual relationships with social institutions,
while key respondents provided qualitative data through semi-structured interviews.
The 342 questionnaires completed in this investigation contributed towards
understanding the structure of vulnerability and its interrelations, while the qualitative
data obtained from the 308 sociograms and 34 semi-structured interviews provided
depth and meaning. An adaptation of the sociogram was developed during the
fieldwork to assess individual social networks, with 308 sociograms being completed
in relation to an ‘everyday’ scenario (ibid.). In addition, 294 sociograms were
undertaken with the same respondents related to a ‘crisis’ scenario such as the
November 1996 cyclone that affected the East Godavari district, but also ‘crisis’ events
defined by the respondents.
The caste of a respondent was self-defined during the questionnaire surveys; in
all cases the respondents named their caste and their ‘caste classification’ as they
perceived it.5 In the multi-caste villages it was possible to verify the information
provided by the respondents regarding their caste because these villages were typically
segmented geographically into ‘communities’ defined by caste classification.
Kutcha huts (basic mud and bamboo huts with no/minimal load bearing walls and thatched roofs). 3 Particular attention was paid to the phrasing of questions in the questionnaire in an attempt to avoid ambiguities in the subsequent translation into Telugu. Any remaining ambiguities in the questionnaire were addressed once it was possible to consult a qualified English/Telugu translator in India. The translated version of the questionnaire was checked by an independent translator for grammar and meaning which was an essential consideration to allow for local and colloquial requirements. 4 A mandal is an administrative section of a District; there are 1104 in Andhra Pradesh. It is sometimes also referred to as Taluk or Taluka. 5 The authors appreciate that the classification of castes is not without controversy. However, it was deemed that if the classifications cited by the respondents were the accepted nomenclature then it would make ‘caste classification’ an interesting analytical variable. In addition, the information obtained from questionnaire surveys and interviews made it clear that the ‘caste classifications’ accepted by the village level respondents were also those used by the local and state level government respondents.
5
WHAT CONSTITUTES AND DETERMINES VULNERABILITY?
Research over the last twenty years has shown that an understanding of the social and
economic forces that shape societies should be given the same weight in our
assessments of vulnerability as understanding the physical hazard-generating processes
(Wisner et al., 2004). Vulnerability is a contested concept but Warmington (1995: 1)
provides a useful definition: ‘[a] condition or set of conditions which adversely affect
people’s ability to prepare for, withstand and/or respond to a hazard’.
In-built community level survival strategies, such as neighbourly assistance,
can provide a level of resilience, but without support from civil society the plight of
the rural poor may never improve. This is the philosophy behind contemporary
initiatives targeting the most vulnerable members of vulnerable communities (Boyce,
2000; Buckle et al., 2000; DFID, 1999; Hearn Morrow, 1999; World Bank, 1999). But
the extent to which an individual or a community has the ability to prepare for,
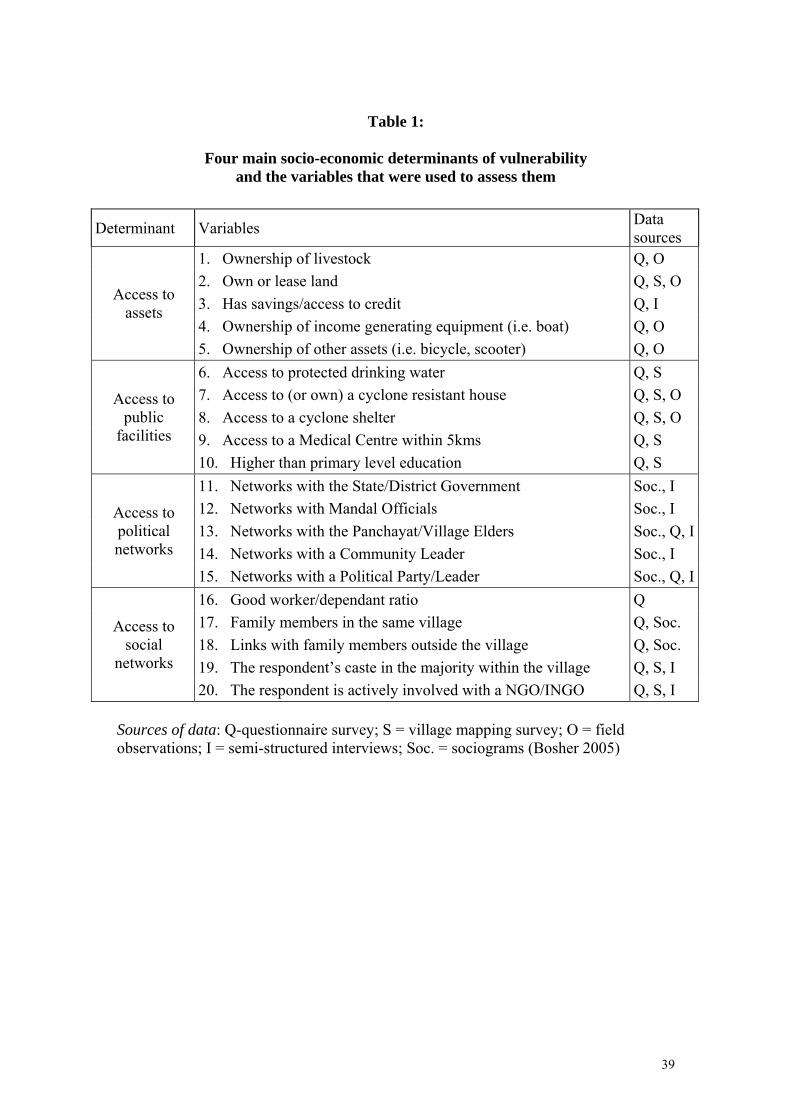
withstand and respond to a hazard or crisis will typically be context-specific. We
believe that in coastal rural India, it can be assessed by looking at four key
determinants of vulnerability: people’s access to assets, to facilities, to political
networks and to social networks (details are given in Table 1).
Thus the most vulnerable people and communities typically have few assets
and little choice about where they live and how they live (Sen, 1981; Winchester,
1992; World Bank, 1990). Contextually, key assets in coastal Andhra Pradesh are land
ownership, income generating equipment and savings. Access to facilities is likely to
be strongly influenced by social institutions and networks, which can enable or
constrain an individual’s ability to access potentially protective public facilities. These
facilities can aid resilience by sheltering the vulnerable and by providing them with
core public services that supplement their meagre financial resources in the form of a
‘social wage’. This determinant has been assessed in terms of access to safe drinking
water, medical care, education, community cyclone shelters and/or ownership of a
cyclone resistant house.
Inequalities in vulnerability are also influenced by institutions that in some
cases have been accused of corruption and nepotism (Kohli, 1990; Kothari, 1986;
Narayanasamy et al., 2000; Robbins, 2000). Notwithstanding this, access to key socio-
political institutions may enable some people or whole communities to obtain
vulnerability-reducing resources that are not available to their neighbours. This is a
6
complex area, and we have assessed this determinant of vulnerability in terms of
access to the organs of the State/District government, the Mandal officials, and the
local Panchayat.
The types of social institutions and the strength of social networks may also
influence a person’s survival strategies, in terms of ‘drawing upon communal
resources’ and ‘drawing on social relationships’ (Agarwal, 1990). Such relationships
may be important in providing vulnerability-reducing resources, particularly when
government mechanisms are unavailable or people have been deliberately or otherwise
marginalized. This determinant has been assessed in our research in terms of access to
social networks with NGOs and with community-based organizations (CBOs), and
also with family members within and outside each respondent’s village.
THE RESOURCE ACCESSIBILITY VULNERABILITY INDEX (RAVI)
Interviews were conducted and other sources used to explore the different strengths of
these determinants of vulnerability. The original data-set was based on a range of open
and closed questions that provided nominal, categorical and interval scale quantitative
data, and also detailed textual qualitative data. These data were then reduced to a basic
binary level that consisted of ‘yes’ and ‘no’ responses to the variables listed in Table 1,
providing the foundation for the development of a ‘Resource Accessibility
Vulnerability Index’ (RAVI). This Index was designed during the research to
summarize a respondent’s or a community’s ‘potential resilience’ or vulnerability
(Bosher, 2005). The RAVI was developed in ‘the field’ due to the lack of a suitable
vulnerability index that was appropriate to the context and the subject of the research.
(Table 1 about here)
In the absence of any good basis for weighting the variables differently, this
index simply sums scores on each of the twenty variables listed in Table 1. If a
respondent had access to all the factors he/she would score a maximum of 20 points on
the index, and is therefore likely to be much less vulnerable to the effects of cyclones
than those with lower scores: their ability to prepare for, withstand and/or respond to a
hazard would be proportionately greater. More complex statistical procedures were
7
attempted, to develop a more sophisticated index, but this proved not to add clarity to
the analysis (Bosher, 2005).
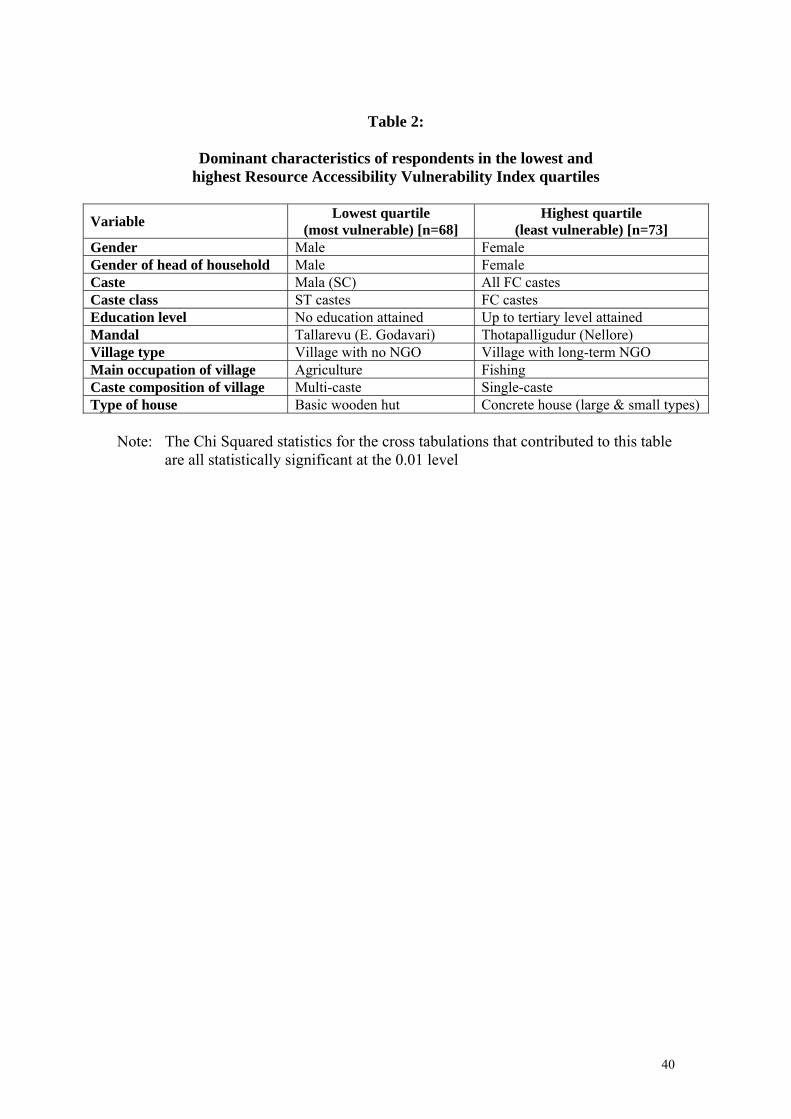
The mean score on the index is 8.0, and its distribution is usefully near-normal,
as indeed are the distributions of its components (Figure 2). To gain an insight into
which respondents and communities were potentially the most and the least vulnerable
we first examined the lowest and highest quartiles of the RAVI scores across the total
sample for both case study areas. The predominant variables and demographic
characteristics in the lowest and highest quartiles are summarized in Table 2. Several
of the differences here obviously reflect results familiar in literature on socio-
economic vulnerability (Agarwal, 1991, 2001; DFID, 1999; Winchester, 1992; Wisner
et al., 2004) in that the most vulnerable people have a combination of low levels of
education, poor housing and a lack of involvement with NGOs (particularly NGOs
concerned with disaster-related education and preparedness).
(Figure 2 about here)
However, it became clear to us that there are other significant factors that have
not been extensively reported or studied before, such as the caste composition of a
village and the predominant occupation of the village (Table 2). These variables are
typically influenced by key overarching factors, such as the respondent’s caste and
gender, thereby affecting what type of occupation a person undertakes, what type of
village they inhabit, what CBOs they can participate in, and the levels and quality of
education they receive. Therefore, even at this very basic level of analysis we can see
that caste and gender are key influences upon who is most vulnerable and who is not.
(Table 2 about here)
This led us to look at the different elements of the RAVI and how they are
correlated, initially focusing on caste. However, the way in which the index has been
constructed means that variables will partly be cross-tabulated with themselves. For
example, when the RAVI as a measure of vulnerability is correlated with ‘levels of
education’, to determine whether the least educated are the most vulnerable, there is a
danger of being confused by a higher than ‘true’ correlation, because one of the twenty
variables that constitute the RAVI is whether the respondent has attained more than a
8
primary level of education. What is important to recognize is that the RAVI is a
summary index, that there will inevitably be influences and factors that overlap or are
obscured, and that the causality of the variable interrelationships is never completely
clear. The RAVI attempts to measure vulnerability by deliberately not looking at each
individual variable, but this means that the correlation analysis described below has
had to be interpreted with some caution.
VULNERABILITY AND CASTE
A number of studies have raised concerns about the influence of the hierarchical caste
system in creating and perpetuating socio-economic disparities throughout India and
particularly in rural India.6 The hierarchy of caste classifications were defined by the
respondents, with the ‘Forward Castes’ (FC) then the ‘Backwards Castes’ (BC) at the
top, and the ‘Scheduled Castes’ (SC) and ‘Scheduled Tribes’ (ST) at the bottom of the
hierarchy.7 Our results suggest that these studies may indeed be correct: 50 per cent of
the highest caste classification (FC) respondents are in the highest RAVI quartile, and
none are in the lowest RAVI quartile; while 44 per cent and 52 per cent of the SC and
ST caste members respectively are concentrated in the lower two quartiles of our
vulnerability index (see Table 3). The pattern is complex, however, with 56 per cent of
the ST caste members in the high average quartile, whereas all other castes are more or
less evenly spread between the middle two quartiles. This ST-related anomaly will be
discussed in more depth later in this paper.
(Table 3 about here)
6 These studies include Agrawal (2004); Deshpande (2003); DFID (1999); Kabeer (2002); Mencher (1991); Robbins (2000); Searle-Chatterjee and Sharma (1994); Sen Sharma (2000); Venkateswarlu (1986) and reports of human rights institutions, such as Amnesty International (2002) and the Minority Rights Group International (2004). 7 We acknowledge that ‘caste’ is a contested and complex concept and that some commentators will be at odds with the relatively simple version of the ‘caste hierarchy’ presented here (i.e. not including the influence of jatis or sub-castes). Nonetheless, we believe that it was an important aspect of the project to ground the concepts that were to be used on the perspectives of the respondents, not the researchers. If this perspective of caste turns out to be at odds with other research on caste issues, it should not be viewed as simplistic, but as evidence that the real life manifestations of the caste hierarchy can be extremely different from one location to another.
9
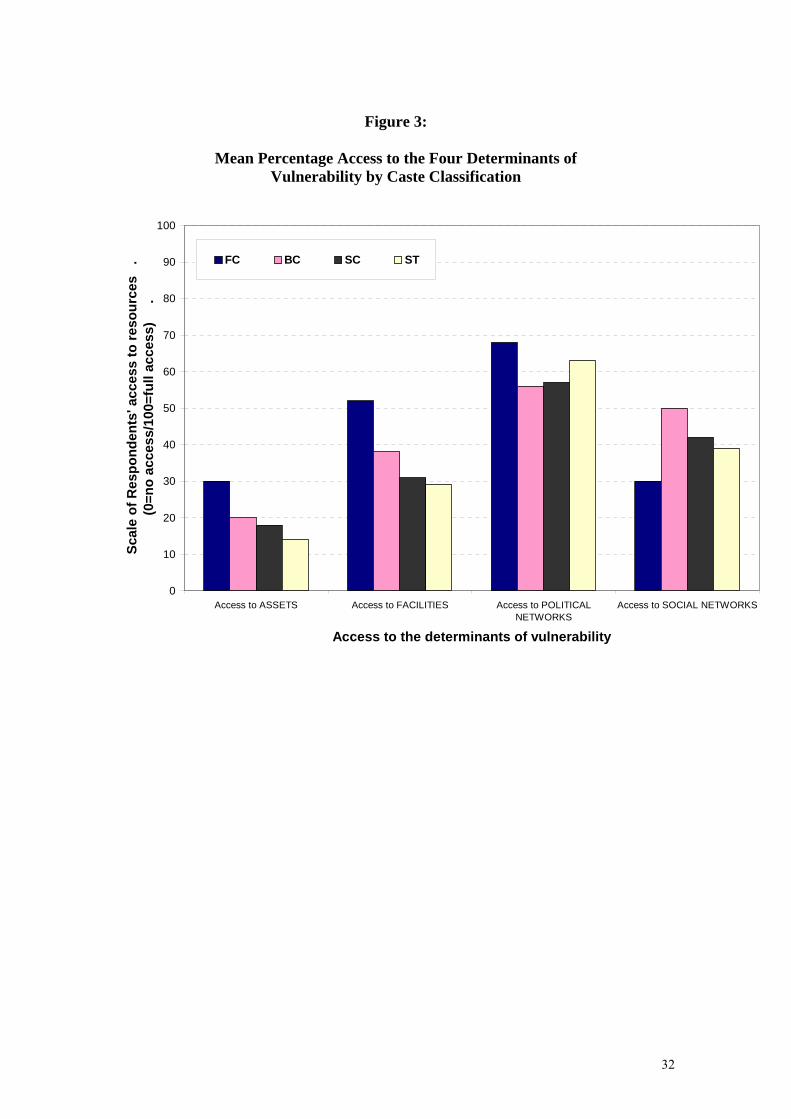
By disaggregating the RAVI data into its four components (shown in Table 1),
Figure 3 shows that the mean percentages of access to assets and public facilities
largely match the caste hierarchy, as one might expect. Indeed the pattern is striking
and simple: the lower the caste, the less access to assets and facilities that the members
have. But the patterns of access to political and social networks and caste classification
are much more complex (and perhaps somewhat counter-intuitive): the four
components and their five constituent variables that constitute the RAVI are therefore
examined in more detail below to establish more clearly the nature of caste related
vulnerability disparities.
(Figure 3 about here)
Caste and Access to Assets
We attempted in our pilot surveys to investigate respondents’ daily (and typically
informal) income, but the results were unreliable — a problem experienced in many
surveys (see Deaton, 2001; Reddy and Pogge, 2002 and the response by Ravallion,
2002, for an extended debate on this topic). For example, a number of landowners
living in large pukka (well-built) houses admitted to possessing extensive landholdings
and income-generating equipment (such as water pumps, ploughs and auto rickshaws).
But they also stated that they typically earned 50 rupees per day (approximately
US$1), the same as an agricultural labourer or fisherman. Since wealth or access to
assets can also be difficult to measure objectively, for this study it was assessed in
terms of access to key assets such as land and livestock ownership, income-generating
equipment and savings, thereby providing a ‘triangulated’ perspective of asset
ownership in that the data were obtained by more than one method, from more than
one source and over a period of time.
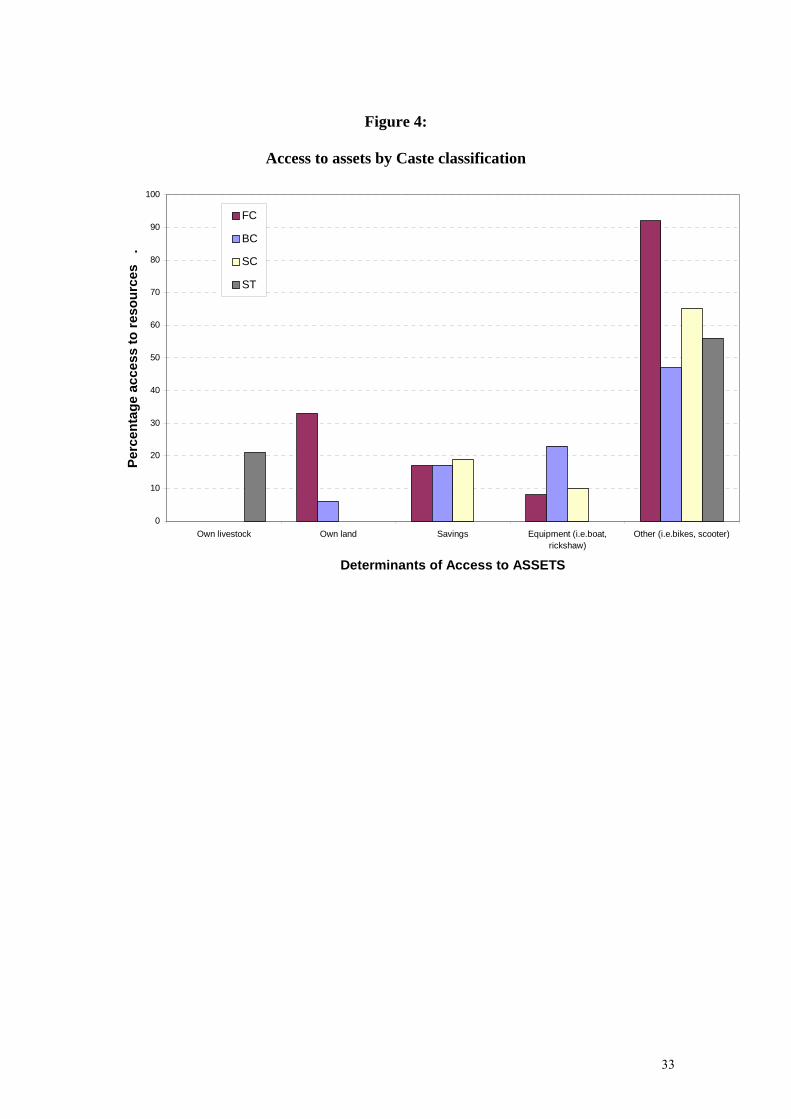
Whilst Figure 3 shows a clear pattern of assets and caste, Figure 4 illustrates
the complexity underlying this simplicity, with marked differences occurring between
caste classifications. Assets can be influenced by a respondent’s occupation, which is
also intrinsically linked to caste (Deliége, 1992, 1999; FAO, 2000; Kinsley, 1993).
While the STs appear to exclusively own livestock (due to the traditional role of tribes
such as the Erukala in rearing pigs), one third of the FCs own land that is used for the
10
cultivation of crops. Nearly one in five ST respondents admitted to possessing some
savings while a slightly lower proportion of BC and SC castes stated that they too had
savings. None of the FC respondents admitted to having any savings. However — as
with income — data regarding savings can be notoriously difficult to obtain and
therefore this factor may be unreliable.
(Figure 4 about here)
Fishing castes such as the Agnikulakshatriya and Pattapu fishing communities
constitute nearly 80 per cent of the BC sample, which explains why our BC villagers
own income-generating assets such as fishing boats and nets (the necessary tools of
their occupation). ‘Other assets’ that are not necessarily used to generate an income,
such as motorbikes, televisions and satellite dishes, could be considered to be non-
essential or ‘luxury’ items and are most likely to be owned by the FC castes. The caste
hierarchy thus appears to exert a sizeable influence over access to assets, but with
specific — and important — local variations.
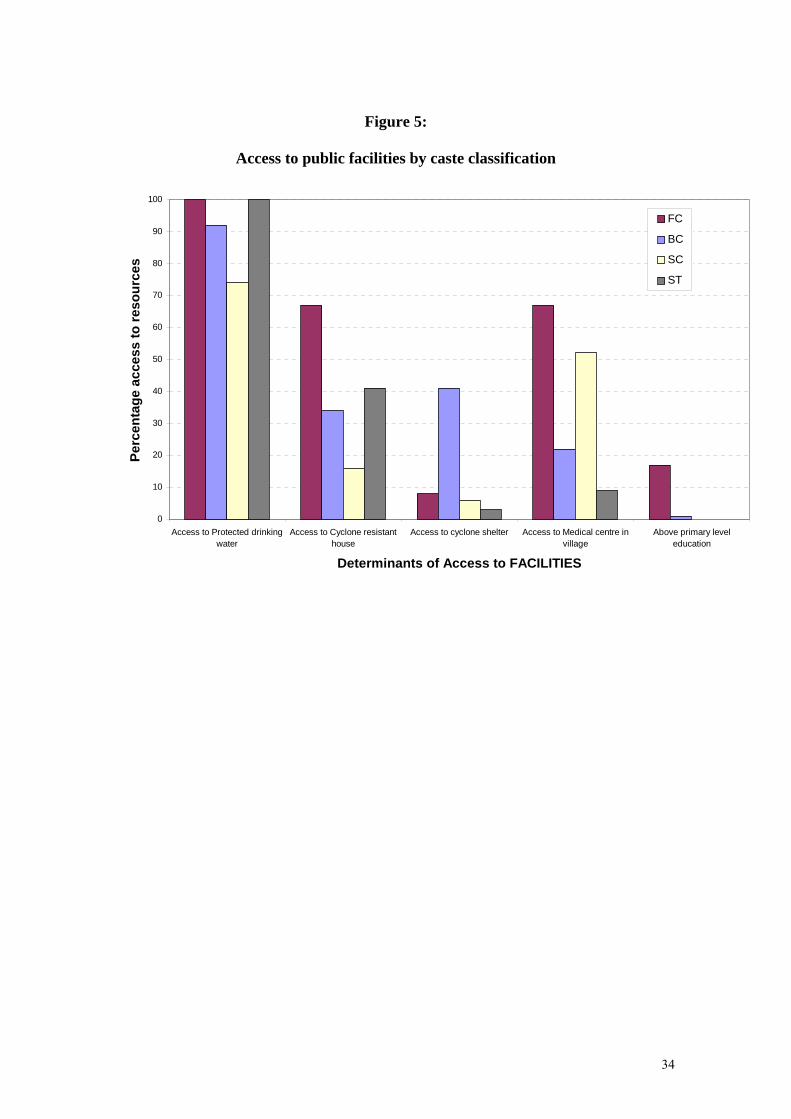
Caste and Access to Public Facilities
Ability to access potentially protective public facilities that can promote resilience
could be strongly influenced by social institutions and networks. Figure 5 indicates
that while the overall relation of caste to public facilities matches the caste hierarchy
shown in Figure 3, there are again marked disparities between caste classifications as
to who has access to public facilities and who is, therefore, arguably better protected
and better prepared to cope with and recover from a disaster. One reason for this is
geography: fishing communities are most likely to have access to cyclone shelters
because they live nearest to the coast and this is where the shelters have been located.
However, many agricultural communities we surveyed live within 5–10 km of the
coast and are therefore only marginally less exposed to the impact of a tropical cyclone
than the fishing communities.
(Figure 5 about here)
11
The FC castes are most likely to have access to a medical centre, above-
primary level education and (along with STs) to a protected drinking water supply. The
only facility to which they do not have the best or equal access is cyclone shelters, for
the reasons mentioned above. None of our respondents from the two lowest caste
classifications had received any education above basic primary level. However, the
STs we surveyed do not have the lowest levels of access to all public facilities. This
may be partially explained by the sampling that we necessarily undertook: 70 per cent
of the ST respondents involved in this study were located in Nellore district. Nellore
has a higher proportion of Scheduled Tribes than other Andhra Pradesh districts
(Government of Andhra Pradesh, 2003) and has consequently made concerted efforts
to increase the levels of facilities in single caste ST villages. For example, one single
caste ST village located in Thotapalligudur mandal in Nellore (see also Table 2) was
established in the 1980s specifically for ST families that had been marginalized in
multi-caste villages dominated by BC castes. The village had been given a protected
drinking water supply, a primary medical centre and many cyclone resistant houses
(although twenty years of sea air had taken its toll on the quality of the housing when
the research was conducted in 2002). This is an example of ‘positive discrimination’
creating circumstances in which vulnerability has been reduced locally by government
intervention.
We can thus see that the simple picture presented by Figure 3 is important, but
is not the whole story. Access to public facilities contains caste-associated nuances,
which may influence vulnerability. For example, as illustrated above, some ST
respondents have received ‘special treatment’; they live in a purpose-built single caste
ST village and have access to facilities such as protected drinking water and cyclone
resistant housing. But other ST respondents live in multi-caste villages that are
dominated politically (though not necessarily numerically) by FC and BC castes; in
these cases, the ST respondents may not have access to a medical centre or school,
even though these facilities are located within the village.
Such complexities imply that, if levels of vulnerability are to be accurately
assessed, it is necessary to probe deeply, spending time in the villages and gaining
insight into the power relationships that are manifest in rural Indian communities. Our
research suggests that, overall, access to public facilities follows the same pattern as
access to assets: the caste hierarchy has an influence in levels of access but differences
12
are less marked towards the bottom of the hierarchy, not least because of past
government interventions.
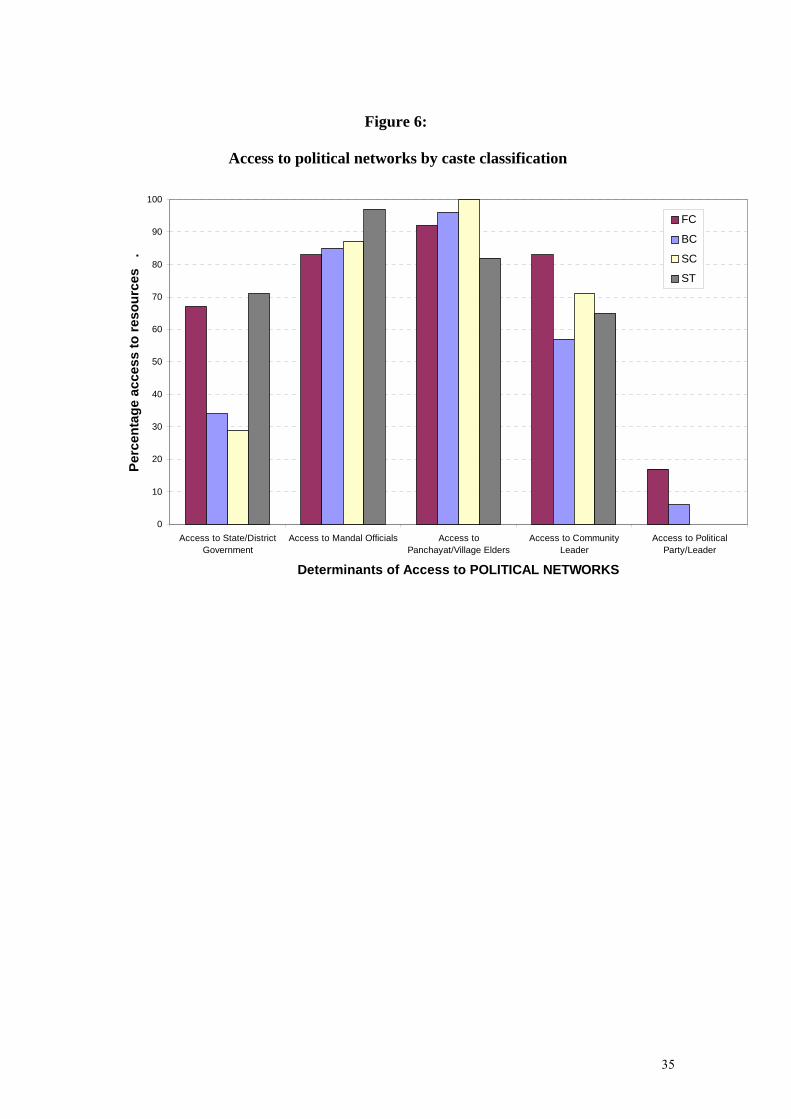
Caste and Access to Political Networks
Access to key socio-political institutions can enable some people or groups to access
vulnerability-reducing resources on a privileged basis. Figure 3 showed that access to
these networks generally is fairly uniform across caste groups. However, Figure 6
shows that while FC castes have the most access to political networks overall, the ST
classification have the greatest access to networks at State, District and Mandal
government levels, despite being at the bottom of the caste hierarchy. This again may
be result of the ‘positive discrimination’ in districts such as Nellore, with their high
proportion of STs. So local geography can influence (and to some degree determine)
social and political processes.
(Figure 6 about here)
On the other hand, access to networks with potentially influential political
leaders are very clearly stratified by caste, with only the highest caste classifications of
FC and BC having access to politicians and political leaders. During crisis events,
none of the respondents, irrespective of gender or caste, could boast relationships with
political leaders. However, this situation may change if a crisis event occurs in the run
up to an election, where political involvement in the assistance of communities may be
more visible, if not necessarily well directed (Reddy and Sastry, 1992). The castes with
the lowest levels of state/government political networks are likely to compensate for
this by utilizing local networks with the Panchayat and community leaders, to which
they appear to have the greatest access (Figure 6).
Relationships with Mandal officials are potentially important for coping in a
crisis scenario because these officials are, on a local scale, influential and powerful
decision makers and distributors of resources (Reddy et al., 1996). We enquired about
the resilience of these networks; significantly, only 13 per cent of relationships with
Mandal officials are lost during a crisis event such as the 1996 cyclone, which reflects
13
well on the involvement of Mandal officials in such situations. Access to Mandal
officials in our samples was not significantly affected by caste, social status or gender.
Since Panchayat committees and village elders are key institutions responsible
for the distribution of village level resources in a crisis (Reddy et al., 1996), it is
crucial that these institutions should be unbiased in the ways that resources are
distributed, to avoid nepotism and corruption (Narayanasamy et al., 2000). That this is
often not the case was highlighted by one respondent: ‘The village elders and other
rich men distributed rice for selected people only and not for all the villagers; they
only assisted influential people. The village elders were only interested in helping the
rich people because they didn't distribute the relief supplies equally’ (Female, BC,
from a single caste village). Consequently, it may be very important for villagers to
maintain good relationships with village elders, even in the relatively homogeneous
single caste villages. For example, one woman explained that her husband died during
the 1996 cyclone but she did not receive the compensation to which she was entitled
because of long-running disputes with her village elders:
The village elders didn't send my husband’s name to the appropriate government
department. Previously, we had some clashes with the village elders, particularly
with the ration dealer in my village. The ration dealer is involved with some
corruption in my village and my husband had witnessed some of that corruption.
My husband then went and complained to some government people and as a
consequence my husband became the village elder’s enemy. That is why I did
not receive compensation for my husband’s death. If I go to the village elders for
help, they will not help me. (Female, BC, from a single caste village)
We thus begin to see another level of complexity hidden within the data. It is
clearly important to possess social networks with potentially influential political
institutions, but it is just as important to be on ‘good terms’ with these institutions over
long periods: the network itself is just the starting point. When resources are finite and
the government’s policies and/or mechanisms are ineffective (through lack of
interaction with stakeholders and recipients of development projects or simply due to
corruption and nepotism) those without good political connections will miss out and
will be more vulnerable to the hazards that they face.
14
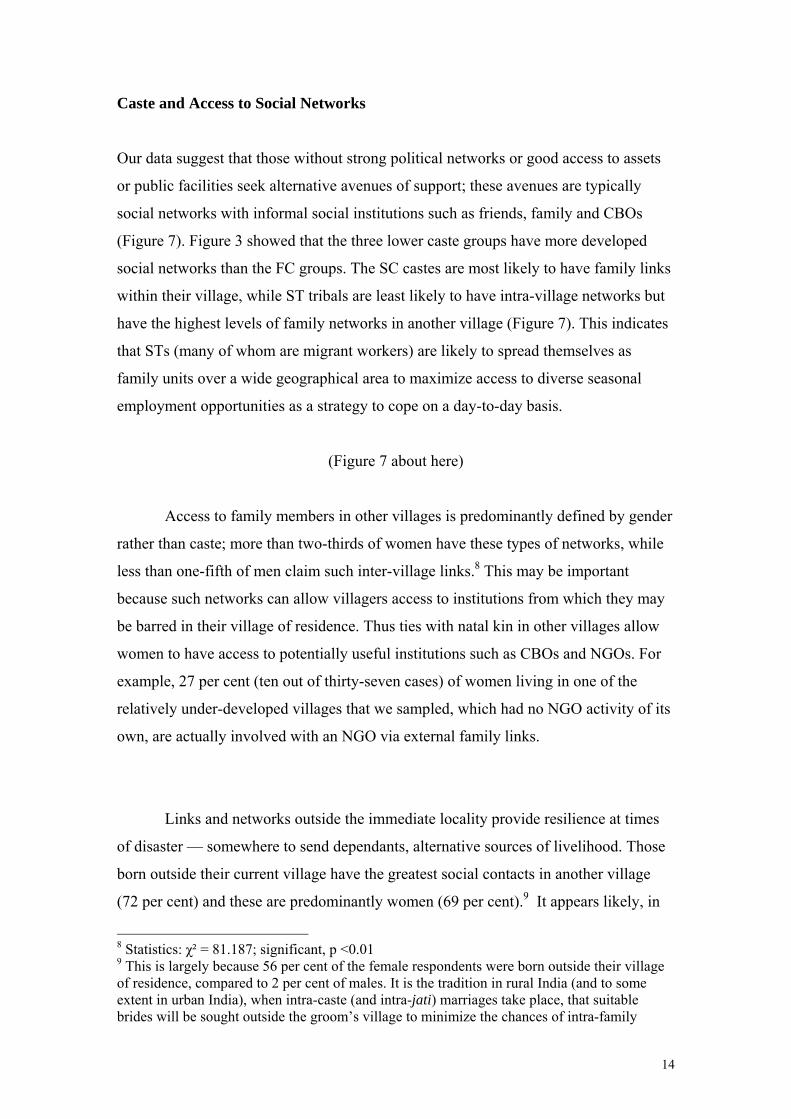
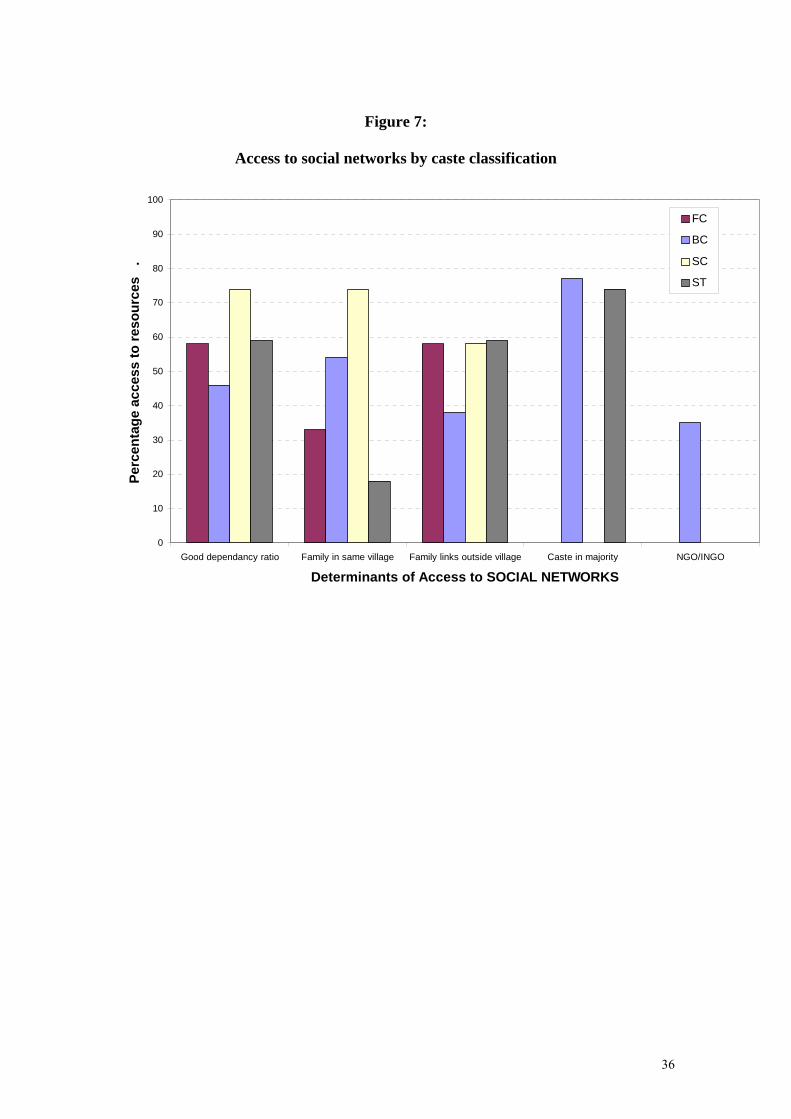
Caste and Access to Social Networks
Our data suggest that those without strong political networks or good access to assets
or public facilities seek alternative avenues of support; these avenues are typically
social networks with informal social institutions such as friends, family and CBOs
(Figure 7). Figure 3 showed that the three lower caste groups have more developed
social networks than the FC groups. The SC castes are most likely to have family links
within their village, while ST tribals are least likely to have intra-village networks but
have the highest levels of family networks in another village (Figure 7). This indicates
that STs (many of whom are migrant workers) are likely to spread themselves as
family units over a wide geographical area to maximize access to diverse seasonal
employment opportunities as a strategy to cope on a day-to-day basis.
(Figure 7 about here)
Access to family members in other villages is predominantly defined by gender
rather than caste; more than two-thirds of women have these types of networks, while
less than one-fifth of men claim such inter-village links.8 This may be important
because such networks can allow villagers access to institutions from which they may
be barred in their village of residence. Thus ties with natal kin in other villages allow
women to have access to potentially useful institutions such as CBOs and NGOs. For
example, 27 per cent (ten out of thirty-seven cases) of women living in one of the
relatively under-developed villages that we sampled, which had no NGO activity of its
own, are actually involved with an NGO via external family links.
Links and networks outside the immediate locality provide resilience at times
of disaster — somewhere to send dependants, alternative sources of livelihood. Those
born outside their current village have the greatest social contacts in another village
(72 per cent) and these are predominantly women (69 per cent).9 It appears likely, in
8 Statistics: χ² = 81.187; significant, p <0.01 9 This is largely because 56 per cent of the female respondents were born outside their village of residence, compared to 2 per cent of males. It is the tradition in rural India (and to some extent in urban India), when intra-caste (and intra-jati) marriages take place, that suitable brides will be sought outside the groom’s village to minimize the chances of intra-family
15
parallel with these results, that villagers’ involvement with NGOs and CBOs — which
is caste related — could be a direct result of greater awareness of entitlements through
contact with family members in other villages that have increased resources through
access to these organizations.
In our case study areas, we found that NGOs only operate in single caste
fishing villages. The BCs and STs that typically live in single caste villages are thus
more likely to benefit from the assistance of NGOs in a pre-disaster scenario and in
disasters themselves, as the NGOs tend to focus relief efforts on villages in which they
already operate. Social networks can thus represent an important resource, and their
distribution has a strong gender correlation: there is also a caste dimension, but not a
strong one. When the poor and powerless lower castes are marginalized they are forced
to utilize their social networks, which tend to be informal. These informal social
networks are typically accessed by women via their direct or indirect membership and
involvement with CBOs and NGOs.
VULNERABILITY AND NON-CASTE VARIABLES
It is almost impossible to discuss caste without including variables that are apparently
not caste related such as gender, village type and networks with NGOs. However, it is
also nearly impossible to discuss non-caste variables without reference to the influence
of caste, because caste and all other aspects of rural Indian society are so intertwined.
In this sense, it is surprising that the role of caste is underplayed by many authors, such
as Bhalla and Lapeyre (1997), Das (2004), Gaiha et al. (2001), John (2000), and in
many World Bank publications (such as World Bank 1997, 1999 and 2001). Indeed, an
extensive review of literature in sociology, gender studies, social exclusion, rural
development, socio-politics, disaster management and caste in India suggested a
decline in caste-referenced discussion since the 1990s. This may reflect a view that
caste is of diminishing significance in rural India, but our results appear to be at
variance with that perspective.
marriages. After such a marriage the bride will typically live in the village of her husband’s family.
16
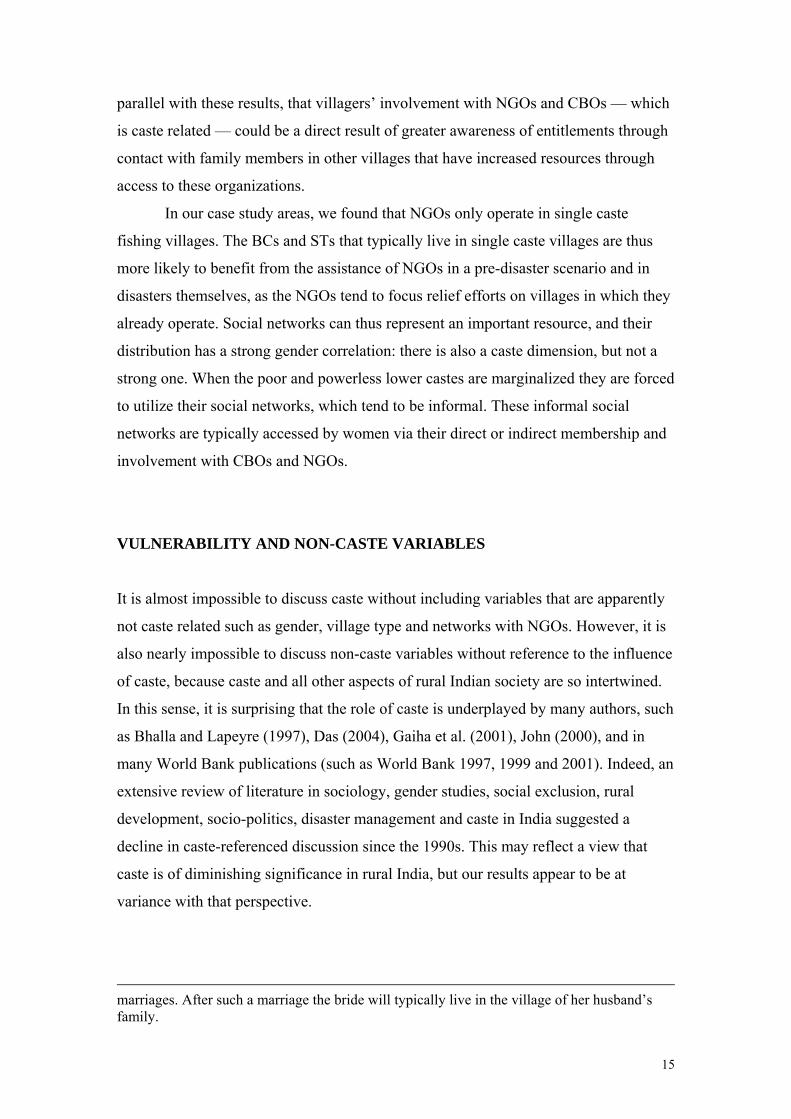
Gender, NGOs and Vulnerability
Much of the Indian sociological literature suggests that women in rural India are
hindered by constraints on their social status and potential opportunities (Agarwal,
1990, 1997, 2001; Gupta, 1991; Martin and Lemon, 2001; Moore, 1998). Typically,
gender inequalities have meant that women take on the burden of family life as a result
of traditionally determined roles in household and village affairs. Relatively
unrepresentative levels of women in the Panchayat (Moore, 1998), and the exclusion
of women from traditional institutions (Agarwal, 2001; Beck, 1995; Moore, 1998;
Robbins, 2000), and even from the newly created participatory institutions (Agarwal,
1997; Deepa et al., 2000), have all contributed to maintaining the role of women as
‘second class citizens’ in rural village life.
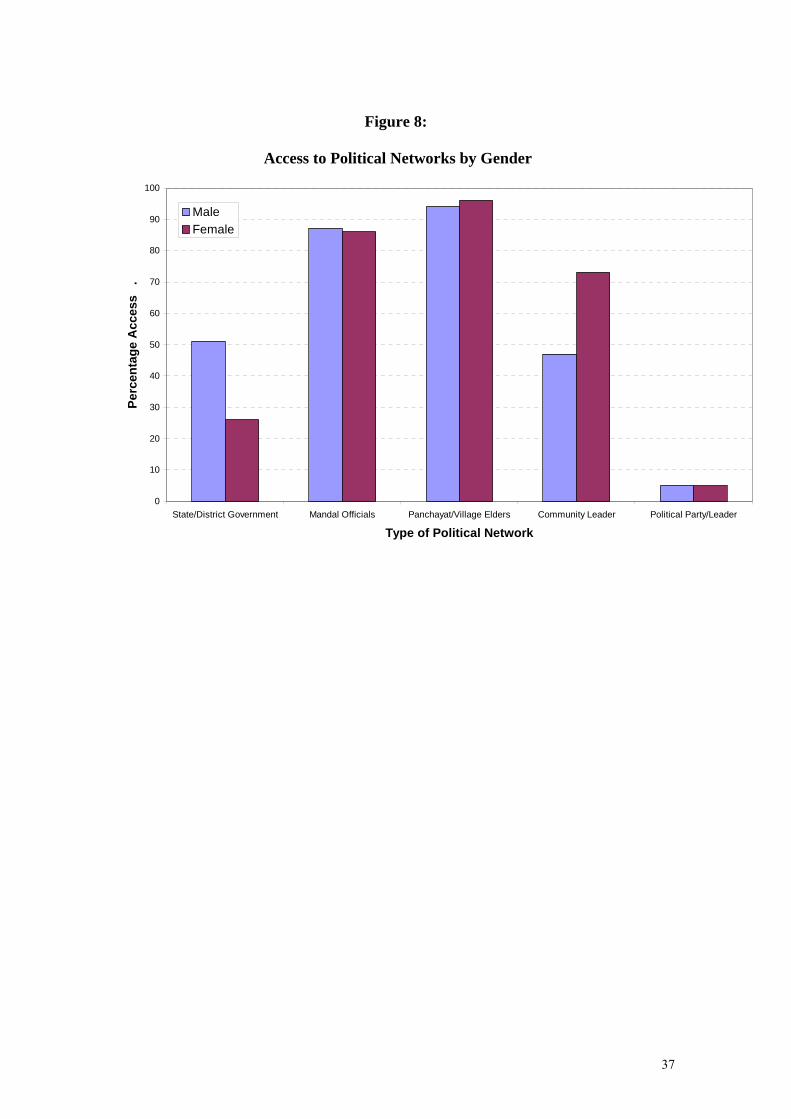
These assertions are generally substantiated by our results (Figure 8). Men are
twice as likely as women to possess networks with high level government officials,
although women have more networks with local community leaders than men, possibly
as a substitute. The surveys included in Bosher (2005) indicate that women rely on
intermediary social networks with institutions such as CBOs, women’s groups and
community leaders to access high level government officials. Men, in contrast, were
more likely to interact with government officials directly.
(Figure 8 about here)
As suggested above, other social networks can also be important to women in
reducing vulnerability, primarily through informal networks with family, participatory
institutions and NGOs (Agarwal, 1991; Enarson, 2000; Moore, 1998; Moore, 1990).
Our data suggest that when women are involved with organizations such as NGOs and
CBOs they can significantly improve their personal resilience and the resilience of
their family through the adoption of income diversification strategies (such as fish
pickling and chutney making), by access to credit and savings, and through support for
small business ventures. When NGOs are operating in villages, women are four times
more likely than men to be involved with NGO activities. This is because many NGO
programmes are targeted at females, through the foundation of women’s groups
(mahila sanghas) focused on providing women with improved education and general
knowledge, and increasing their access to formal financial services such as credit and
17
savings schemes. Men are less likely to participate with NGOs due to scepticism
towards participatory, ‘pro-women’ projects that fundamentally challenge traditional
power structures. One in five males in our surveys said that ‘problems’ occurred when
women became involved with NGO and CBO activities because, for example, ‘women
become so busy that they neglect their household and child care duties’. Some 8 per
cent of females also recognized ‘problems’, largely because attending meetings meant
that they missed opportunities for paid and unpaid work.
Men are also less aware of NGO activities when they are operating in their
village. For example, 61 per cent of the men we interviewed in villages with recent
NGO activity were not aware of these activities, while 80 per cent of females
interviewed in the same villages were aware of NGO activities, even if they did not
participate. Our data show, therefore, that gender can play an important role in
reducing vulnerability, and that women are gaining resilience as a result of a range of
social and economic processes, largely operating at a very local level.
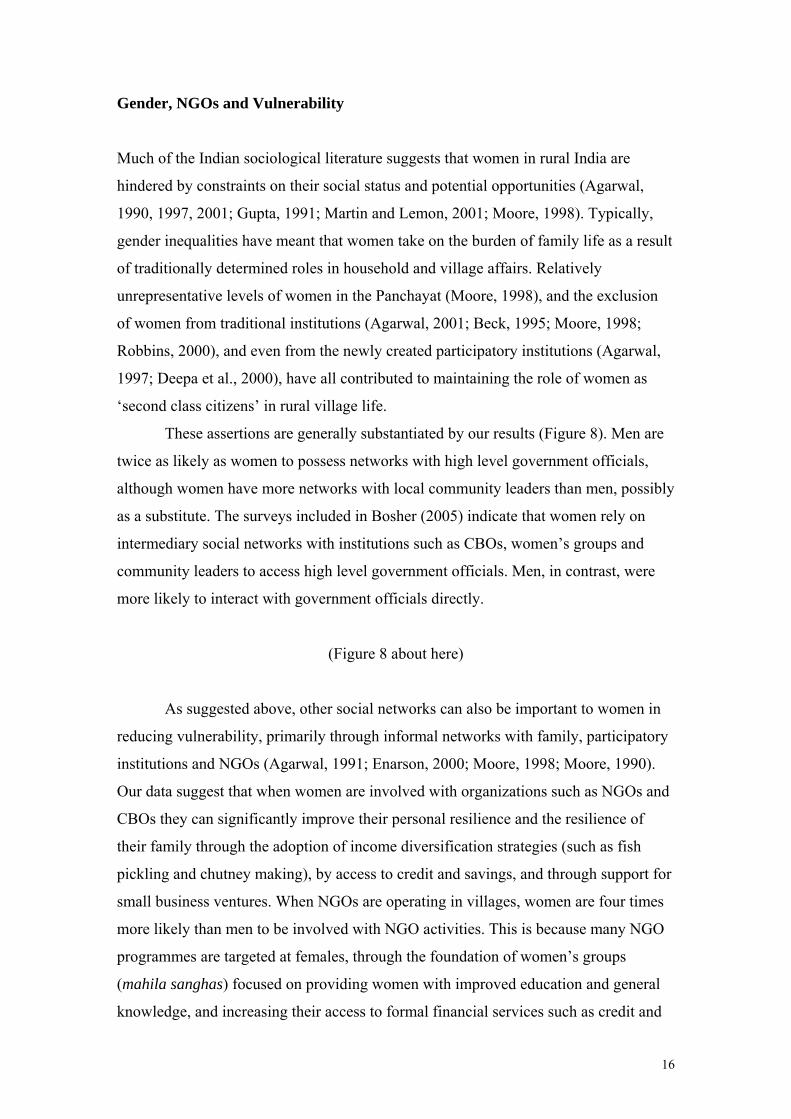
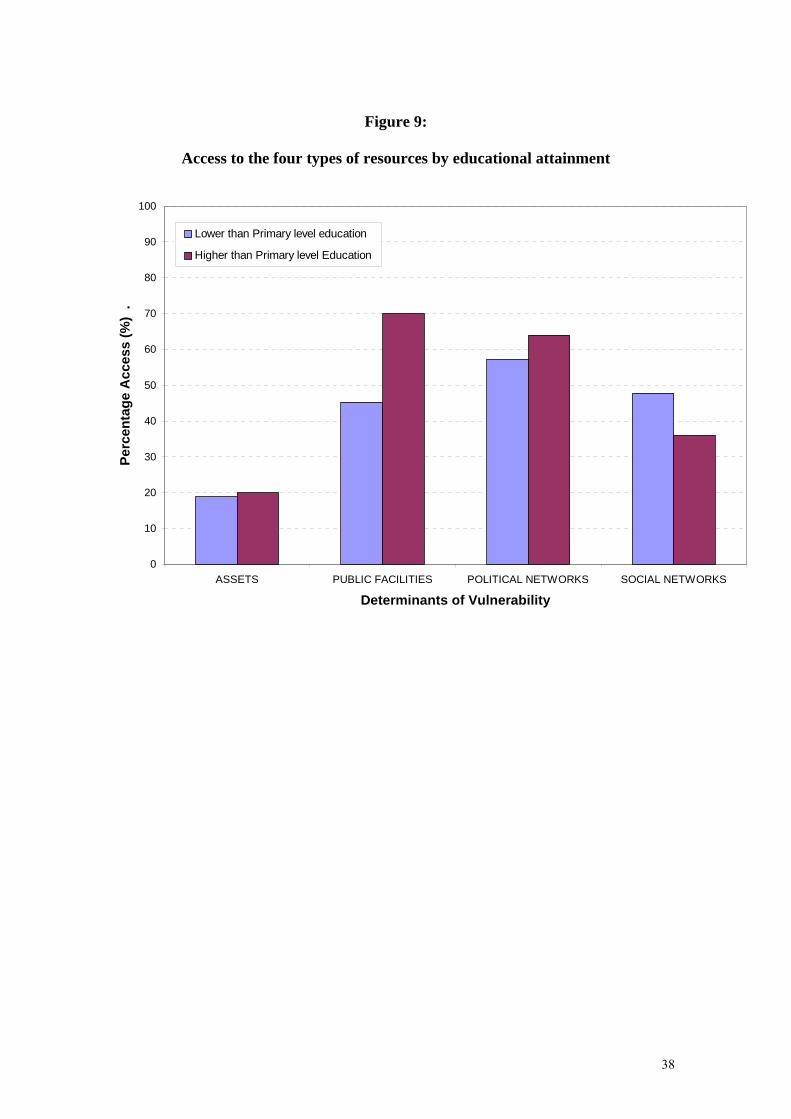
Education, Caste and Vulnerability
More education generally leads to increased resilience (Menon-Sen and Shiva Kumar,
2001). Our data show that villagers with higher than primary level education have
substantially greater access to public facilities and political networks (Table 1) than
respondents with less than primary level education (Figure 9). Those with low levels of
education (predominantly the lower caste groups) have proportionately more social
networks, possibly in an attempt to compensate for their lack of access to the other
resources such as public facilities and political networks.
(Figure 9 and Table 4 about here)
Other significant disparities regarding levels of education are again associated
with caste (Table 4). On average, 61 per cent of the villagers we surveyed have
received no education of any kind; however, this applies to only 18 per cent of the FC
respondents. None of those belonging to the lowest caste classifications had attained
18
more than a primary level education. The vast majority of the SC and ST respondents
(thirty-seven out of thirty-eight cases) had never been to school or had only completed
‘a few’ years of primary education.
These results suggest that the central and state governments’ attempts to reduce
illiteracy in rural India have so far been ineffective, and they also indicate how
everyday pressures on the poorest families in these communities force them to
continue to send their uneducated children to earn a wage rather than to obtain any
education. The situation is different for the highest caste classification (FC), where 19
per cent of our sample had been educated to secondary school level or above, and 9 per
cent had received college or university education.
Despite uncertainties about the reasons for these disparities one thing is
apparent: levels of educational attainment are significantly influenced by a
respondent’s caste classification. This in turn can influence the types of resources to
which a rural villager has access, because villagers with the higher levels of education
are more likely to have access to public facilities, political networks and material
assets, all of which significantly reduce their vulnerability. More government effort in
educating lower caste groups must be a priority, so that the benefits of reductions in
vulnerability reach those who need them the most.
Age and Vulnerability
A number of studies (Guillette, 1991; O’Riordon, 1986; UNICEF, 1989) have
concluded that the young and the old are among the most vulnerable to any hazards
faced by their communities. Our data does not support this in any clear way: there is
no significant difference in the age profile of those in the lowest RAVI quartile (the
most vulnerable) and those in the highest quartile (the least vulnerable) (Table 5). Of
the villagers studied, 54 per cent of those over sixty years old were still working to
earn a wage, with 29 per cent employed in manual labour (of the non-workers, 25 per
cent were retired and 21 per cent undertook unpaid housework10). Although our data
indicate that age is not a significant factor in determining a respondent’s access to the
key resources listed in Table 1, we found that respondents aged fifty years and over
10 Statistics: χ² = 105.180; significant, p < 0.01
19
were the least likely to seek assistance from the government or aid agencies during and
after a crisis, irrespective of caste or socio-economic status (Bosher, 2005). So there
may well be an age effect on vulnerability that is more subtle than can be detected in
the kind of analysis presented here.
(Table 5 about here)
On the other hand, when researching Indian society it is difficult to disentangle
the individual from the household because ‘the Indian social structure is non-
individualistic, basically collective, never free of the intricate linkages with others’
(Gangrade, 1998: 131). It is therefore possible that the similar profiles in Table 5
reflect this, with the extended family living arrangements leading to the pooling of
access to assets, facilities and networks across age groups.
CONCLUSIONS
The influence of caste on access to resources and hence vulnerability is likely to be
different from one region/state/district to the next and the results from this research are
not necessarily applicable across the whole of India. This study merely provides a
vignette of the complexities in Indian society within the context of coastal Andhra
Pradesh.
Nonetheless, the findings of this context-specific research indicate that caste
appears to be a key factor influencing who is vulnerable to the many hazards faced in
coastal Andhra Pradesh: it influences who owns assets, who can access public
facilities, who has specific political connections and who has particular supportive
social networks. Previous studies (Rashid, 2000; Winchester, 1992; World Bank,
2001) have looked at asset ownership, and seen that this affects vulnerability, as we
have also found. But we can now see that this factor should not be seen in isolation
from the many other drivers of vulnerability. Access to public facilities and to political
and social networks can provide, firstly, the vehicles through which caste-related
inequalities persist and, secondly, the ‘social capital’ assets themselves that can
enhance resilience and reduce vulnerability in a number of important ways, not least
for the lowest caste groups.
20
The lower castes appear to be more vulnerable because they lack access to
important public resources and opportunities to reduce their vulnerability and improve
their plight. These castes can additionally be marginalized and made more vulnerable
when they live in multi-caste villages where higher castes dominate the decision-
making processes to the extent that the vested interests of the powerful and wealthy
higher castes can be perpetuated. Indeed, it has been observed that in India it is not
exclusion from society that effects poverty, but rather inclusion in a society based on
strict hierarchical structures (IILS, 1996).
Typically, the poorest villagers we studied have low access to assets precisely
because they are low caste; this has proved contentious in past studies on this topic
(Abercrombie et al., 2000). The correlation found in this study between caste status
and economic status has been suggested before (DFID, 1999; Mencher, 1974, 1991;
Robbins, 2000; Searle-Chatterjee and Sharma,1994), but there have been few studies
that have supported their claims via sound or contemporary empirical evidence. This
issue of the lack of evidence has been raised by the Minority Rights Group
International (2004), who argue that organizations such as the World Bank, United
Nations and ILO have seriously understated the socio-economic problems associated
with caste disparities in rural India. Our findings suggest that caste does indeed
influence socio-economic disparities in coastal Andhra Pradesh, and consequently
influences levels of vulnerability and the ‘potential resilience’ of these individuals to
large-scale disasters and small-scale crises.
The poor and powerless lower castes (those with poor access to political
networks) are marginalized, and fall back on their social networks. These latter
networks are typically accessed by women via their involvement with CBOs and
NGOs. This observation highlights the importance of women’s labour (Moser and
McIlwaine. 1997) and social networks (Agarwal, 1990; Moore, 1990) in the process of
vulnerability reduction but it also points to issues concerning the poor rural male and
whether they need the kind of extra assistance that women have now attracted.
Geography is also important. The caste situation appears to be different in
single-caste villages. Here people who are low on the Varna hierarchy, such as STs,
can obtain relatively better access to public facilities and political networks than STs
who inhabit multi-caste villages. The disparities observed between single-caste and
multi-caste villages can be exacerbated when NGOs are reticent to operate in the
perceived social complexity of multi-caste villages.
21
According to our study, caste appears to have a significant influence on who
does and who does not have access to the resources that can reduce levels of
vulnerability and increase resilience to major disasters such as cyclones, but also to the
everyday crises that continually disrupt the lives of people in rural coastal India. Of
course it is not caste per se that has these effects, but the stigma, status and social
processes that inevitably accompany it. What can be done to mitigate this situation is
far from clear, but at least our diagnosis may help others to find some new and better
solutions to this age-old problem.
22
REFERENCES
Abercrombie N., S. Hill and B. S. Turner (2000), The Penguin Dictionary of Sociology
London, Penguin Books (4th edn).
Agarwal, B. (1990) ‘Social Security and the Family in Rural India: Coping with
Seasonality and Calamity’, Journal of Peasant Studies 17(3): 341–412.
Agarwal, B. (1991) ‘Social Security and the Family: Coping with Seasonality and
Calamity in Rural India’, in E. Ahmed, J. Dreze, J. Hills and A. Sen (eds) Social
Security in Developing Countries, 171-244. Oxford, Clarendon Press.
Agarwal, B. (1997) ‘Environmental Action, Gender Equity and Women’s
Participation’, Development and Change 28(1): 1–44.
Agarwal, B. (2001) ‘Participatory Exclusions, Community Forestry, and Gender: An
Analysis for South Asia and a Conceptual Framework’, World Development 29(10):
1623–48.
Agrawal, A. (2004) ‘The Bedias are Rajputs: Caste Consciousness of a Marginal
Community’, Contributions to Indian Sociology (n.s.) 38(1–2): 221–46.
Amnesty International (2002) ‘Amnesty International Report: India’. POL
10/001/2002. Available online:
http://web.amnesty.org/web/ar2002.nsf/asa/india!Open#bottom
(accessed 26 December 2004).
Beck, T. (1995) ‘The Green Revolution and Poverty in India: A Case Study of West
Bengal’, Applied Geography 15(2): 161–81.
Bhalla, A. and F. Lapeyre (1997) ‘Social Exclusion: Towards an Analytical and
Operational Framework’, Development and Change 28(3): 413–33.
23
Bosher, L.S. (2005) ‘“The Divine Hierarchy”: The Social and Institutional Elements of
Vulnerability in South India’. PhD Thesis, Middlesex University, London.
Bosher, L.S. (2007) Social and Institutional Elements of Disaster Vulnerability: The
Case of South India. Academica Press, Bethesda.
Boyce, J. K. (2000) ‘Let Them Eat Risk? Wealth, Rights and Disaster Vulnerability’,
Disasters 24(3): 254–61.
Buckle, P., G. Marsh and S. Smale (2000) ‘New Approaches to Assessing
Vulnerability and Resilience’, Australian Journal of Emergency Management 15(2):
8–14.
Coles, E. and P. Buckle (2004) ‘Developing Community Resilience as a Foundation
for Effective Disaster Recovery’, Australian Journal of Emergency Management
19(4): 6-15.
Das, R. (2004) ‘Social Capital and Poverty of the Wage-labour Class: Problems with
the Social Capital Theory’, Transactions of the Institute of British Geographers 29(1):
27–45.
Davies, S. and M. Hossain (1997) ‘Livelihood Adaptation, Public Action and Civil
Society: A Review of the Literature’. IDS Working Paper 57. Brighton: Institute of
Development Studies, University of Sussex.
Deaton, A. (2001) ‘Counting the World’s Poor: Problems and Possible Solution’,
World Bank Research Observer 16(2): 125–47.
Deepa, N., K. Schafft, A. Rademacher and S. Koch-Schulte (2000) Voices of the Poor:
Can Anyone Hear Us? New York, Oxford University Press.
Deliége, R. (1992) ‘Replication and Consensus: Untouchability, Caste and Ideology in
India’, Man (n.s.) 27(1): 155–73.
24
Deliége, R. (1999) The Untouchables of India. Oxford: Berg.
Deshpande, S. (2003) Contemporary India: A Sociological View. New Delhi: Penguin
Books.
DFID (1999) ‘India: Country Strategy Paper 1999’. London: Department for
International Development.
Enarson, E. (2000) ‘Gender and Natural Disasters’. ILO Infocus Programme on Crisis
Response and Reconstruction Working Paper No 1. Geneva: International Labour
Organization.
FAO (2000) ‘Report of the Government of India/Government of Andhra Pradesh/
FAO Workshop on Measures to Reduce Loss of Life during Cyclones,
Vishakapatnam, Andhra Pradesh, India, 4–6 March 1999’. FAO Fisheries Report No
622. Rome: Food and Agriculture Organization of the United Nations.
Gaiha, R., I. Katsushi and P. D. Kaushik (2001) ‘On the Targeting and Cost-
Effectiveness of Anti-Poverty Programmes in Rural India’, Development and Change
32(2): 309–42.
Gangrade, K. D. (1998) ‘Social Networks and Crisis Management in Indian Families:
A Personal Account’, in A. M. Shah, B. S. Baviskar and E. A. Ramaswamy (eds)
Social Structure and Change, Volume 5: Social Structure and Change – Religion and
Kinship, 111-134. New Delhi: Sage.
Government of Andhra Pradesh (2003) ‘Literacy Rates by Residence and Sex: State,
District and Mandal, 2001’. AP 2001 Census Figures: Paper 2, Table 5. Government of
Andhra Pradesh, Hyderabad
Guillette, E. A. (1991) ‘The Impact of Recurrent Disaster on the Aged of Botswana’.
Paper presented at the 50th Annual Meeting of the Society for Applied Anthropology,
Charleston, South Carolina, 13-16 March.
25
Gupta, D. (1991) ‘Hierarchy and Difference: An Introduction’, in D. Gupta (ed.)
Social Stratification, 1–21. Delhi: Oxford University Press.
Hearn Morrow, B. (1999) ‘Identifying and Mapping Community Vulnerability’,
Disasters 23(1): 1–18.
IILS (1996) Social Exclusion and Anti-Poverty Strategies. Geneva: International
Institute for Labour Studies.
John, V. (2000) ‘Political and Cultural causes of Corruption’, in N. Narayanasamy, M.
P. Boraian and M. A. Jeyaraju (eds) Corruption at the Grassroots: The Shades and
Shadows, 61-69. New Delhi: Concept Publishing.
Kabeer, N. (2002) ‘Safety Nets and Opportunity Ladders: Addressing Vulnerability
and Enhancing Productivity in South Asia’, Development Policy Review 20(5): 589-
614
Kinsley, D. R. (1993) Hinduism: A Cultural Perspective. Upper Saddle River, NJ:
Prentice-Hall (2nd edn).
Kohli, A. (1990) Democracy and Discontent: India’s Growing Crisis of Governability.
Cambridge: Cambridge University Press.
Kothari, R. (ed.) (1986) Caste in Indian Politics. London: Sangam Books.
Marsh, G. and P. Buckle (2001) ‘The Concept of Community in Emergency
Management’, Australian Journal of Emergency Management 16(1): 5-7
Martin, A. and M. Lemon (2001) ‘Insights and Applications: Challenges for
Participatory Institutions: The Case of Village Forest Committees in Karnataka, South
India’, Society and Natural Resources 14(7): 585–97.
26
Mencher, J. (1991) ‘The Caste System Upside Down’ in D. Gupta (ed.) Social
Stratification, 84–92. Delhi: Oxford University Press.
Mencher J., (1974), “The Caste System Upside Down, or The Not-so-Mysterious
East”, Current Anthropology 15:469-93
Menon-Sen, K. and A. K. Shiva Kumar (2001) ‘Women in India: How Free? How
Equal?’. Report Commissioned by the Office of the Resident Co-ordinator in India.
New Delhi: United Nations.
Minority Rights Group International (2004) ‘Discrimination on the Grounds of Work
and Descent: Sub-Commission on the Promotion and Protection of Human Rights:
53rd Session’. Available online:
http://www.minorityrights.org/International/int_stat_detail.asp?ID=1 (accessed on 15
July 2004).
Moore, E. (1998) Gender, Law and Resistance in India. Tucson, AZ: University of
Arizona Press.
Moore, G. (1990) ‘Structural Determinants of Men’s and Women’s Personal
Networks’, American Sociological Review 55 (5): 726-735
Moser, C. and C. McIlwaine (1997) Household Responses to Poverty and
Vulnerability. Volume 3: Confronting Crisis in Commonwealth, Metro Manila, the
Philippines. Urban Management Programme Publication No 23. Washington, DC: The
World Bank.
Narayanasamy, N., M. P. Boraian and M. A. Jeyaraju (eds) (2000) Corruption at the
Grassroots: The Shades and Shadows. New Delhi: Concept Publishing.
O’Riordon, T. (1986)’Coping with Environmental Hazards’, in R. Kates and I. Burton
(eds) Geography, Resources and Environment, Vol. 2, pp. 272–309. Chicago, IL:
University of Chicago.
27
Parasuramam, S. and P. V. Unnikrishnan (eds) (2000) India Disasters Report:
Towards a Policy Initiative. New Delhi: Oxford University Press.
Rashid, S. F. (2000) ‘The Urban Poor in Dhaka City: Their Struggles and Coping
Strategies during the Floods of 1998’, Disasters 24(3): 240–53.
Ravallion, M. (2002) ‘How Not to Count the Poor? A Reply to Reddy and Pogge’.
Available online: http://www.columbia.edu/~sr793/wbreply.pdf
Reddy, S. G. and T. W. Pogge (2002) ‘How Not to Count the Poor’ (Version 3.0). New
York: Barnard College (mimeo).
Reddy, A. V. S. and K. R. Sastry (1992) ‘The Politics of Disaster: Public Pressure and
State Response to Cyclone Relief in Andhra Pradesh’, Journal of Disaster
Management 4(3): 123–30.
Reddy, A. V. S., V. K. Sharma and M. Chittoor (2000) Cyclones in Andhra Pradesh: A
multidisciplinary study to profile cyclone response in coastal Andhra Pradesh, India.
Hyderabad: Bookline.
Reddy, A. V. S., B. K. Thapliyal and K. R. Sastry (1996) ‘Disaster Mitigation through
People’s Participation: Role of Local Self Government Institutions’, Asia-Pacific
Journal of Rural Development 6(2): 15–34.
Robbins, P. (2000) ‘The Rotten Institution: Corruption in Natural Resource
Management’, Political Geography 19(4): 423–43.
Searle-Chatterjee, M. and U. Sharma (eds) (1994) Contextualising Caste: Post-
Dumontian Approaches. Sociological Review Monographs. Oxford: Blackwell.
Sen, A. (1981) Poverty and Famines: An Essay on Entitlement and Deprivation.
Oxford: Clarendon Press.
28
Sen Sharma, D. (2000) ‘Hindu Values’, in J. Cauquelin, P. Lim and B. Mayer-König
(eds) Asian Values: Encounters with Diversity, pp. 106–17. Richmond, UK: Curzon.
UNICEF (1989) Children on the Frontline: The Impact of Apartheid, Destabilisation
and Warfare on Children in Southern and South Africa. New York: UNICEF.
Venkateswarlu, D. (1986) ‘Socio-Economic Differences between Harijans, Middle-
Castes and Upper-Castes: A Comparative Study of Six Villages in Andhra Pradesh’,
The Eastern Anthropologist 39(3): 210–23.
Warmington, V. (1995) ‘Disaster Reduction: A Review of Disaster Prevention,
Mitigation and Preparedness’. Ottowa: Reconstruction and Rehabilitation Fund of the
Canadian Council for International Co-operation.
Winchester, P. (1992) Power, Choice and Vulnerability: A Case Study in Disaster
Mismanagement in South India, 1977–1988. London: James and James Science
Publishers.
Wisner, B., P. Blaikie, T. Cannon and I. Davis (2004) At Risk: Natural Hazards,
People’s Vulnerability, and Disasters: Second Edition. London: Routledge.
World Bank (1990) World Development Report 1990. Washington, DC: The World
Bank.
World Bank (1997) ‘Emergency Cyclone Recovery Project Will Help Andhra Pradesh
Rebuild and Stave off Future Destruction’. World Bank Official Press Release, 7 May.
Available online:
http://lnweb18.worldbank.org/sar/sa.nsf/6062ad876fb8c066852567d7005d648a/85a78
ca451f90d6d852568fd0066c918?OpenDocument (accessed 5 March 2003).
World Bank (1999) ‘Consultations with the Poor: India 1999’. A study commissioned
by Poverty Reduction and Economic Management Network of the World Bank,
PRAXIS-Institute for Participatory Practices, Patna
29
World Bank (2001) World Development Report 2000/20001: Attacking Poverty.
Oxford: Oxford University Press.
Lee Bosher, Department of Civil and Building Engineering, Loughborough
University, Leicestershire, LE11 3TU, UK (e-mail: [email protected] )
Current research is focused on improving the resilience of the built environment to
extreme natural and human-induced hazards through the involvement of end users and
key stakeholders. Forthcoming books include; the 'Social and Institutional Elements of
Disaster Vulnerability: The Case of South India', and 'Hazards and the Built
Environment: Attaining Built-in Resilience'.
Edmund Penning-Rowsell, Flood Hazard Research Centre, Middlesex University,
UK (e-mail: [email protected] )
30 years of research that has focused on the impacts of floods, optimising policy
responses to floods, the funding of flood defence investment, and the role of
emergency services during major hazard events.
Sue Tapsell, Flood Hazard Research Centre, Middlesex University, UK (e-mail:
Recent research has focused on the human 'intangible' health and social impacts of
flooding, the social performance of flood warning systems, community resilience to
flooding, and stakeholder communication and engagement in flood risk management.
30
Figure 1:
Location of Andhra Pradesh and the Case Study Districts
Source: Bosher 2005
Pakistan
China (Tibet)
Bangla-desh
Bhutan
Myanmar(Burma)
Sri Lanka
I N D I A
Delhi
Arabian Sea
Bay Of
Bengal
GodavariRiver
KrishnaRiver
0 ~600km
ANDHRA PRADESH
Nepal
N
East Godavari
Nellore
Guntur
Prakasam
Krishna
West Godavari
Visakhapatnam Vizianagaram
Srikakulam
Cuddapah
Chittoor
Anantapur
Kurnool
Mahbubnagar
Nalgonda
Khammam
Warangal
Karimnagar
Adilabad
Nizamabad
Medak
Rangareddi
Hyderabad
Maharashtra
Chhatisgarh
Orissa
Karnataka
Tamil Nadu
Andhra Pradesh
BayOf
Bengal
0 ~200km
Yanam(Pondicherry)
N
Case Study Districts
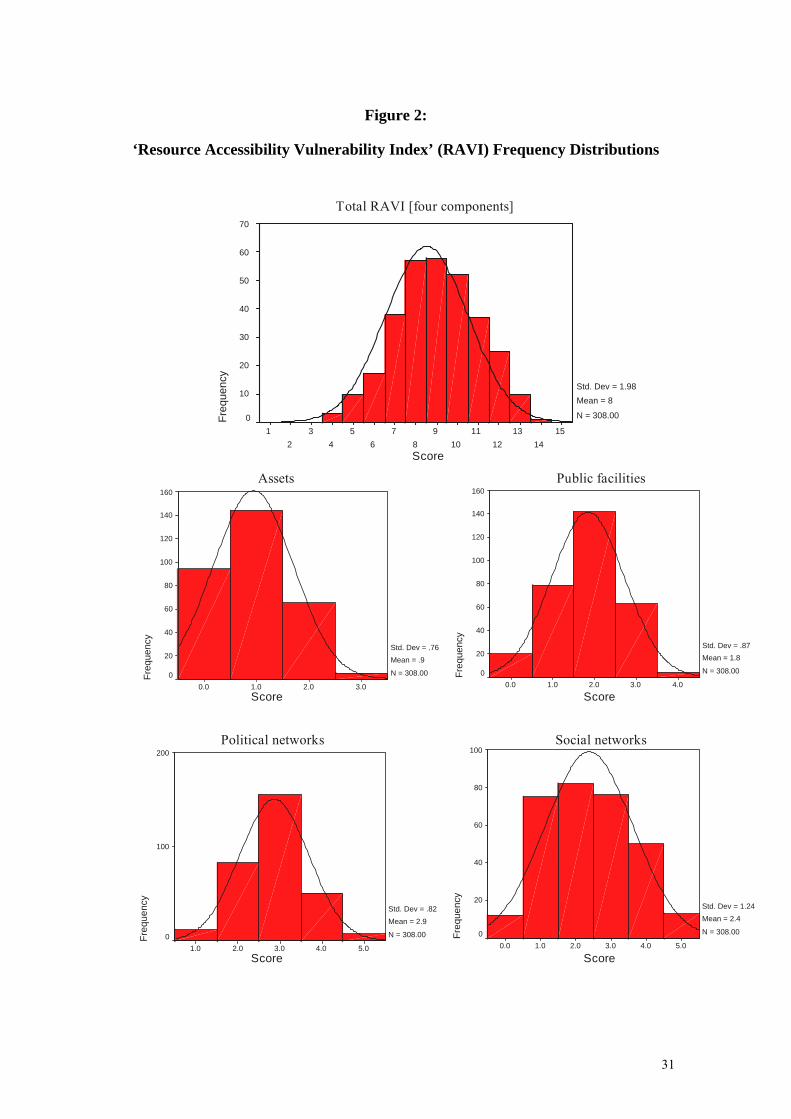
31
Figure 2:
‘Resource Accessibility Vulnerability Index’ (RAVI) Frequency Distributions
1514
1312
1110
98
76
54
32
1
Freq
uenc
y70
60
50
40
30
20
10
0
Std. Dev = 1.98 Mean = 8
N = 308.00
3.02.01.00.0
Freq
uenc
y
160
140
120
100
80
60
40
20
0
Std. Dev = .76 Mean = .9
N = 308.004.03.02.01.00.0
Freq
uenc
y
160
140
120
100
80
60
40
20
0
Std. Dev = .87 Mean = 1.8
N = 308.00
5.04.03.02.01.0
y
Freq
uenc
y
200
100
0
Std. Dev = .82 Mean = 2.9
N = 308.005.04.03.02.01.00.0
Freq
uenc
y
100
80
60
40
20
0
Std. Dev = 1.24 Mean = 2.4
N = 308.00
Total RAVI [four components]
Assets Public facilities
Political networks Social networks
Score
Score Score
Score Score
32
Figure 3:
Mean Percentage Access to the Four Determinants of
Vulnerability by Caste Classification
0
10
20
30
40
50
60
70
80
90
100
Access to ASSETS Access to FACILITIES Access to POLITICALNETWORKS
Access to SOCIAL NETWORKS
Access to the determinants of vulnerability
Scal
e of
Res
pond
ents
' acc
ess
to re
sour
ces
.
(0=n
o ac
cess
/100
=ful
l acc
ess)
.
FC BC SC ST
33
Figure 4:
Access to assets by Caste classification
0
10
20
30
40
50
60
70
80
90
100
Own livestock Own land Savings Equipment (i.e.boat,rickshaw)
Other (i.e.bikes, scooter)
Determinants of Access to ASSETS
Perc
enta
ge a
cces
s to
reso
urce
s .
FC
BC
SC
ST
34
Figure 5:
Access to public facilities by caste classification
0
10
20
30
40
50
60
70
80
90
100
Access to Protected drinkingwater
Access to Cyclone resistanthouse
Access to cyclone shelter Access to Medical centre invillage
Above primary leveleducation
Determinants of Access to FACILITIES
Perc
enta
ge a
cces
s to
reso
urce
s
FC
BC
SC
ST
35
Figure 6:
Access to political networks by caste classification
0
10
20
30
40
50
60
70
80
90
100
Access to State/DistrictGovernment
Access to Mandal Officials Access toPanchayat/Village Elders
Access to CommunityLeader
Access to PoliticalParty/Leader
Determinants of Access to POLITICAL NETWORKS
Perc
enta
ge a
cces
s to
reso
urce
s .
FC
BC
SC
ST
36
Figure 7:
Access to social networks by caste classification
0
10
20
30
40
50
60
70
80
90
100
Good dependancy ratio Family in same village Family links outside village Caste in majority NGO/INGO
Determinants of Access to SOCIAL NETWORKS
Perc
enta
ge a
cces
s to
reso
urce
s .
FC
BC
SC
ST
37
Figure 8:
Access to Political Networks by Gender
0
10
20
30
40
50
60
70
80
90
100
State/District Government Mandal Officials Panchayat/Village Elders Community Leader Political Party/Leader
Type of Political Network
Perc
enta
ge A
cces
s .
MaleFemale
38
Figure 9:
Access to the four types of resources by educational attainment
0
10
20
30
40
50
60
70
80
90
100
ASSETS PUBLIC FACILITIES POLITICAL NETWORKS SOCIAL NETWORKS
Determinants of Vulnerability
Perc
enta
ge A
cces
s (%
) .
Lower than Primary level education
Higher than Primary level Education
39
Table 1:
Four main socio-economic determinants of vulnerability
and the variables that were used to assess them
Sources of data: Q-questionnaire survey; S = village mapping survey; O = field observations; I = semi-structured interviews; Soc. = sociograms (Bosher 2005)
Determinant Variables Data sources
1. Ownership of livestock Q, O 2. Own or lease land Q, S, O 3. Has savings/access to credit Q, I 4. Ownership of income generating equipment (i.e. boat) Q, O
Access to assets
5. Ownership of other assets (i.e. bicycle, scooter) Q, O 6. Access to protected drinking water Q, S 7. Access to (or own) a cyclone resistant house Q, S, O 8. Access to a cyclone shelter Q, S, O 9. Access to a Medical Centre within 5kms Q, S
Access to public
facilities
10. Higher than primary level education Q, S 11. Networks with the State/District Government Soc., I 12. Networks with Mandal Officials Soc., I 13. Networks with the Panchayat/Village Elders Soc., Q, I14. Networks with a Community Leader Soc., I
Access to political networks
15. Networks with a Political Party/Leader Soc., Q, I16. Good worker/dependant ratio Q 17. Family members in the same village Q, Soc. 18. Links with family members outside the village Q, Soc. 19. The respondent’s caste in the majority within the village Q, S, I
Access to social
networks
20. The respondent is actively involved with a NGO/INGO Q, S, I
40
Table 2:
Dominant characteristics of respondents in the lowest and
highest Resource Accessibility Vulnerability Index quartiles
Variable Lowest quartile (most vulnerable) [n=68]
Highest quartile (least vulnerable) [n=73]
Gender Male Female Gender of head of household Male Female Caste Mala (SC) All FC castes Caste class ST castes FC castes Education level No education attained Up to tertiary level attained Mandal Tallarevu (E. Godavari) Thotapalligudur (Nellore) Village type Village with no NGO Village with long-term NGO Main occupation of village Agriculture Fishing Caste composition of village Multi-caste Single-caste Type of house Basic wooden hut Concrete house (large & small types)
Note: The Chi Squared statistics for the cross tabulations that contributed to this table
are all statistically significant at the 0.01 level
41
Table 3:
The proportions of respondents in each quartile
of the Resource Accessibility Vulnerability Index by caste classification
Caste Classification Quartile FC BC SC ST Lowest quartile 0% 21% 29% 32% Low average quartile 25% 19% 23% 12% High average quartile 25% 32% 38% 56% Highest quartile 50% 28% 10% 0%
Table 4
The levels of education attained by caste classification
Caste classification Level of education FC BC SC ST Average No education 18% 62% 62% 50% 61% A ‘few years’ at primary level 45% 33% 35% 50% 36% Completed primary only 18% 3% 3% 0% 1% Secondary 10% 0% 0% 0% 1% Tertiary 9% 2% 0% 0% 1%
Statistics: χ² = 54.284; significant p <0.01
Table 5:
Highest and lowest Resource Accessibility
Vulnerability Index quartiles for different age categories
Percentage of respondents in the lowest and highest quartiles of the Resource Accessibility Vulnerability Index
Age Category Lowest quartile Highest quartile 20-30 years old (n=43) 28% 26% 30-40 years old (n=95) 21% 19% 40-50 years old (n=107) 21% 22% 50-60 years old (n=32) 18% 41% Over 60 years old (n=28) 29% 14% Average (n=305) 22% 23%
Statistics: χ² = 9.768; p > 0.05 (not significant)


![Untitled-1 [] · Nagarjuna Sagar Dam õ3NãgerjunasagaóSite Jammar . ANDHRA AUTHORITY . ANDHRA AUTHORITY . ANDHRA AUTHORITY . ANDHRA AUTHORITY . ANDHRA AUTHORITY . ANDHRA AUTHORITY](https://img.pdfslide.net/doc/110x75/5fa86894420206628339e79d/untitled-1-nagarjuna-sagar-dam-3ngerjunasagasite-jammar-andhra-authority.jpg)