Embed Size (px)
Citation preview
MANUFACTURING & SERVICE OPERATIONS MANAGEMENTVol. 15, No. 3, Summer 2013, pp. 361–377issn 1523-4614 |eissn 1526-5498 |13 |0000 |0001
INFORMSdoi 10.1287/msom.1120.0426
c© 2013 INFORMS
Resource-Based Patient Prioritization inMass-Casualty Incidents
Alex F. MillsOperations and Decision Technologies, Kelley School of Business, Indiana University, Bloomington, IN 47405,
Nilay Tanık Argon, Serhan ZiyaDepartment of Statistics and Operations Research, University of North Carolina at Chapel Hill, Chapel Hill, NC 27599,
[email protected], [email protected]
The most widely used standard for mass-casualty triage, START, relies on a fixed-priority ordering amongdifferent classes of patients, and does not explicitly consider resource limitations or the changes in survivalprobabilities with respect to time. We construct a fluid model of patient triage in a mass-casualty incidentthat incorporates these factors and characterize its optimal policy. We use this characterization to obtainuseful insights about the type of simple policies that have a good chance to perform well in practice, and wedemonstrate how one could develop such a policy. Using a realistic simulation model and data from emergencymedicine literature, we show that the policy we developed based on our fluid formulation outperforms STARTin all scenarios considered — sometimes substantially.
Key words : health operations, emergency response, triage
1. IntroductionTriage is the process of classifying patients according to their medical conditions and injury charac-teristics and then determining the order in which they will be treated or transported to a hospital.Triage is a common practice in emergency departments for daily emergencies but it is particularlyimportant in the aftermath of a mass-casualty incident (MCI). Mass-casualty incidents such astransportation accidents and terrorist bombings may create a sudden spike in demand for the emer-gency response resources within an area. As a result, even patients who are in critical conditionmay not have immediate access to these resources that are essential for their survival. In such anenvironment, it is thus crucial to allocate the limited resources to the patients in the most effectivemanner. Depending on the type of the incident, it might be necessary to make different types ofresource allocation decisions at different stages of the response effort, such as on the site or at thehospital. Although these decision problems have many common features, this article is particularlyconcerned with the on-site prioritization of patients for transportation to the hospital.According to the current practice, resource allocation decisions at the site of an MCI are made
in a very simple way: the triage class of a patient automatically determines the patient’s priority.For example, consider the most widely adopted triage protocol in the U.S., namely START, whichstands for Simple Triage and Rapid Treatment (Lerner 2008). START classifies patients into fourdifferent classes. Minor patients are those who are capable of walking away from the scene; delayedpatients are those with severe but not immediately life-threatening injuries; immediate patientsare those with severe and immediately life-threatening injuries, who can benefit from receivingtreatment; and expectant patients are those whose injuries are so severe that they are expectedto die even if substantial care is given. After the patients are classified, START gives the highestpriority to patients in the immediate class, then to those in the delayed class. Once the incidentsite is cleared of patients in these time-critical classes, resources may be used for those in the minorand expectant classes.
1
Mills, Argon, and Ziya: Resource-Based Patient Prioritization in Mass-Casualty Incidents
2 Manufacturing & Service Operations Management 15(3), pp. 361–377, c© 2013 INFORMS
There is a clear benefit from adopting a static, predetermined prioritization scheme that dependssolely on patients’ triage classes: it is simple and thus easy to implement. However, a number ofrecent articles in the emergency medicine literature have questioned the wisdom of this practice,primarily because it completely ignores resource limitations (Garner et al. 2001, Frykberg 2005,Jenkins et al. 2008). The main argument is that the priority levels of the patients should dependon the availability of resources relative to demand; in particular, in some cases it might be moresensible to give priority to patients who are in the delayed class as opposed to those in the immediateclass. For example, there may be so many immediate patients that there is insufficient time to getto the delayed patients within a time frame that would give them a good chance to survive. In thatcase, it might be better to give priority to the delayed patients first or to switch priority from theimmediate patients to the delayed patients at some point during the response effort.At an intuitive level, it may not be difficult to believe that taking resource limitations into
account could improve the outcome of triage at an MCI. However, it is not clear exactly how thistask should be carried out. Prior work has considered mainly two different approaches. (For adetailed review of these studies, see Argon et al. (2011).) One stream of work, which has mostlycome out of the emergency medicine literature, aimed to develop policies that are computed in realtime. In particular, W. J. Sacco and his co-authors (Sacco et al. 2005, 2007) proposed the SaccoTriage Method (STM), which essentially solves a linear program immediately after the incidentto determine the order in which the patients should be transported to the hospital. STM requirescollecting a significant amount of data after the incident, entering these data into a computer,and solving the associated linear program to determine the policy, all in a chaotic environment.Moreover, the examples provided in Sacco et al. (2005) show that the resulting priority policy canbe quite complex, requiring switches from one priority class to another several times during thecourse of the response effort. Primarily due to these perceived impracticalities, STM has not beenwell received by the medical community (Cone and MacMillan 2005).The second approach has been using mathematical modeling and analysis, mainly to generate
insights and identify basic principles that would lead to practical resource-based prioritizationpolicies. The most relevant work that followed this approach is due to Argon et al. (2008) and UzunJacobson et al. (2012). In this line of work, the authors formulated a stochastic clearing model witha finite number of patients that are categorized into different criticality classes. In this model, eachpatient has a random lifetime whose probability distribution depends on the class of the patient. Ifa patient is not served before her lifetime, she dies; otherwise, she either definitely survives (Argonet al. 2008) or survives with a probability that depends on the class of the patient (Uzun Jacobsonet al. 2012). In one respect, the way in which the cost of delay is captured by this formulation is verydirect and realistic. However, an implicit assumption is that the survival probability of a patientstays at the same positive value as long as the patient is alive and drops to zero instantaneouslywhen the patient dies. This assumed structure for the survival probability does not fit well withwhat is reported in the emergency medicine literature, see, e.g., Sacco et al. (2005).In this paper, our main goal is not to propose a real-time solution method but rather to carry
out mathematical and numerical analysis to generate insights that would be useful in the designof effective yet simple prioritization policies. In that respect, our approach is closer to the secondapproach discussed above. Specifically, we aim to provide answers to some of the questions that theemergency response community may face in the process of developing resource-based prioritizationpolicies. For example, is it possible to develop policies that are simple enough to be implemented inpractice yet have substantial benefits over standard policies that do not consider resource limita-tions? If so, what are the main characteristics of these policies, and in what kind of mass-casualtyincidents are they likely to be more beneficial?Even though this article is closer to the second line of work discussed above, our model is
completely different from that of Argon et al. (2008) and Uzun Jacobson et al. (2012). More
Mills, Argon, and Ziya: Resource-Based Patient Prioritization in Mass-Casualty Incidents
Manufacturing & Service Operations Management 15(3), pp. 361–377, c© 2013 INFORMS 3
specifically, we develop a fluid model in which patients deteriorate over time according to a survivalprobability function. Thus, criticality is modeled through a diminishing reward function rather thanthrough abandonments. We provide details of our model in Section 2. Using our fluid formulation,we first obtain an analytical characterization of the optimal policy, which helps us generate newinsights into “good” patient prioritization policies (see Sections 3 and 4). We also use the optimalsolution to our fluid formulation to design two simple resource-based prioritization policies thatare compatible with START and other similar triage classifications, which have two time-criticalpatient classes (see Section 5). In Section 6, using a stochastic discrete-event simulator and datafrom the emergency medicine literature, we test the performance of our resource-based policies andgain further insights into the problem under more realistic conditions than those reflected by ourfluid model. Finally, in Section 7, we explain how our policies can be adapted to potential changeson the field as a result of delays in the availability of patients, misclassifications during triage, andthe practice of repeating triage in the midst of the response effort (which is usually called retriage),and we test the performance of these adaptive policies by another simulation study.Before we proceed, it is important to note that the objective that we consider in this paper, i.e.,
the maximization of the expected number of survivors, is consistent with the widely accepted andpracticed emergency response principle of doing the greatest good for the greatest number (Kennedyet al. 1996, Frykberg 2005). However, triage has always been a somewhat contentious practice asit essentially entails favoring certain individuals over others. There is a long line of discussion andresearch on the ethical dimensions of triage and what its objective “should” be. For more on thisissue, which is beyond the scope of this paper, we refer the reader to Winslow (1982), Baker andStrosberg (1992), and references therein.
2. Model DescriptionWe consider a scenario where there are many injured patients who need to be transported to ahospital. In particular, we consider the case where ambulances or other transportation resourcesare limited in supply so that at least some of the patients will have to wait for some time beforebeing transported. We assume that at time zero the patients have already been separated into Nclasses based on their injury characteristics and medical conditions, and moved to a single areaof the site where they are given basic treatment and prepared for loading onto the ambulances.According to our formulation, there will be no new patient arrivals after time zero. Thus, our modelis a better fit for incidents where a significant percentage of the patients are quickly accountedfor and thus the response effort does not necessitate a time-consuming search and rescue activity.Nevertheless, in Section 7.2, we consider cases where some of the patients arrive with some delay bymeans of a simulation study. We denote the set of classes by I = {0,1, . . . ,N − 1} and the numberof patients in class i by ni, where ni > 0. We also assume that all patients need to be transportedto the same hospital via the same transportation mode (e.g., via ground transportation) so thatthe transportation time of a patient does not depend on the patient’s class. For simplicity, we willfrequently use the word “service” to refer to the process of transporting a patient to the hospital.We approach this problem from the perspective of the emergency response coordinator, who
decides the order in which patients should be transported, with the objective of maximizing theoverall expected reward or gain from the system. To this end, we assume that each class i has anassociated non-negative reward function fi(t), which is the expected reward earned by the systemif a class i patient is served at time t. To capture the fact that no patient would benefit from a delayin service, we assume that fi(t) is monotone non-increasing in t for each i ∈ I. For mathematicaltractability, we further assume that the first-order derivative of fi(t) with respect to t exists foreach i ∈ I, and is denoted by f ′
i(t). The function fi(t) can be interpreted as the probability thata patient of class i ultimately survives if taken into service at time t. With this interpretation,maximizing the total expected reward is then equivalent to maximizing the expected number of
Mills, Argon, and Ziya: Resource-Based Patient Prioritization in Mass-Casualty Incidents
4 Manufacturing & Service Operations Management 15(3), pp. 361–377, c© 2013 INFORMS
survivors. Note that we do not explicitly model patients who die and leave the system. Instead,we implicitly model death through the survival probability. Since our objective is to maximize theexpected number of survivors (more generally, the total expected reward), the optimal policy wouldbe always such that patients with zero survival probability (dead patients) are the last patients toreceive service. Thus, our formulation achieves some mathematical simplicity without sacrificingrealism in any crucial way.Our goal is to develop a model that captures the essential features of the patient prioritization
problem but is simple enough to allow mathematical analysis and development of easy-to-implementpolicies that are expected to perform well in practice. Towards that end, we propose a fluid formu-lation where different classes of patients in the system correspond to different classes of fluid andservice of those patients corresponds to a flow of the respective fluid out of the system. Withoutloss of generality, we assume that the service rate is one patient per unit time; therefore, whenpatients of only class i are flowing out of the system at time t, reward is earned at a rate of fi(t).Define a set of decision functions r(t)≡ {ri(t) : [0,∞)→ [0,1], i ∈ I}, where ri(t) is the rate at
which we choose to serve class i patients or the fraction of the total service capacity allocated toclass i patients at time t≥ 0. We restrict ourselves to decision functions that have finitely manydiscontinuities, which is needed to obtain solutions that switch priorities only finitely many timesand hence are applicable in practice. We now state our optimization problem as follows:
maxr(t),t∈[0,∞)
N−1∑
i=0
∫ ∞
0
ri(s)fi(s)ds (P1)
subject toN−1∑
i=0
ri(t)≤ 1, ∀t∈ [0,∞)
∫ ∞
0
ri(t)dt= ni, ∀i∈ I.
We first note that, as one would expect, it is suboptimal to leave any of the available capacityunused as long as there is fluid in the system. (The proof is omitted as it immediately follows fromthe assumptions that the reward functions fi(t) are non-increasing in t and there are no furtherarrivals.) The practical implication of this result is that in the rest of this article we do not needto consider solutions that involve idling. Since the service rate is one patient per unit time, undernon-idling policies the fluid will be cleared from the system, i.e., transportation of the patients willbe complete, at time T =
∑
i∈Ini. Thus, we can restrict ourselves to the time interval [0, T ].
Our fluid formulation allows the total service capacity to be allocated to more than one patientclass at any particular point in time. The practical interpretation of such an allocation can beproblematic because transportation vehicles cannot be allocated in a continuous manner. Thiswould especially be difficult to deal with when there are few vehicles to allocate. However, thefollowing proposition resolves this concern. (Proofs of Proposition 1 and all other propositions andtheorems are provided in the Online Supplement.)
Proposition 1. There exists an optimal solution to (P1) where only one class of patient isserved at any given time.
Proposition 1 implies that we can restrict the set of policies we consider to those which serveonly one patient class at any point in time. For practice, this result suggests that at any point intime, there is only one highest-priority class and all transportation resources available should beallocated to that class unless the number of such patients is less than the number of resources.Proposition 1 is also useful technically as it allows us to consider a formulation that is equivalent
to but easier to analyze than (P1). Define the set-valued decision variable W = {W (i) : i ∈ I},

Mills, Argon, and Ziya: Resource-Based Patient Prioritization in Mass-Casualty Incidents
Manufacturing & Service Operations Management 15(3), pp. 361–377, c© 2013 INFORMS 5
where W (i) is the set of time points during which class i is served. Then, we can rewrite ouroptimization problem in the following way:
maxW
N−1∑
i=0
∫
W (i)
fi(t)dt (P2)
subject to µ (W (i)) = ni, ∀i∈ I,N−1⋃
i=0
W (i) = [0, T ],
W (i)∩W (j) = ∅, ∀i 6= j,
where µ(W (i)) is the total amount of time spent serving class i patients. In the rest of our analyticalwork, we will focus on this formulation. For both practical and technical reasons, we restrictourselves to solutions W such that for each i∈ I, W (i) can be partitioned into finitely many openintervals and possibly a set of zero measure.
3. A Simple Condition for Fixed-Priority OrderingMany triage methods that are used in practice, such as START, assign a fixed priority to eachclass of patients. To be more precise, in a fixed-priority method, the triage class of each patientdetermines his or her priority level, which does not change with time throughout the response effort.Although several examples show that in general, the optimal policy to (P2) is not a fixed-prioritypolicy, i.e., the optimal policy is such that the priority ordering of the patient classes changes withtime, due to the simplicity of fixed-priority policies, it is still important to investigate conditionsunder which the optimality of a such a policy is guaranteed.It turns out that one condition that ensures an optimal fixed-priority relationship between two
classes of patients is an ordering between the derivatives of their respective reward functions.
Proposition 2. Suppose that there exist two classes, i and j, which have the property that
f ′j(t)≤ f ′
i(t) ∀t∈ [0, T ]. (1)
Given a feasible solution to (P2), where some class i patients are served before some class j patients,there exists another solution where
(i) no class i patients are served before class j patients, and(ii) the expected total reward obtained under the new solution is at least as large as the expected
total reward obtained under the existing solution.
Proposition 2 implies that if class j patients deteriorate at least as fast as class i patients over[0, T ], then there exists an optimal solution where class j has priority over class i at all times. Inorder to intuitively understand Proposition 2, it helps to think about the “opportunity cost” ofdelaying service to each class for a period of time. If the expected reward function of class j alwaysdecreases faster than that of class i, we will forego more expected reward by delaying the serviceof class j than we would by delaying the service of class i, for any arbitrary amount of time. Theoptimal policy is to delay the service of the class for which there is less to lose with time.There are a few important points worth emphasizing regarding Proposition 2. First, the proposi-
tion does not assume an ordering between fi(·) and fj(·). This means that the deterioration rates,not the nominal values of the expected rewards (e.g., survival probabilities), determine dominance.For example, it is possible for class i patients to have lower survival probabilities than class jpatients at all times and yet be assigned a lower priority than class j patients if their health condi-tions do not deteriorate as fast. Second, it is crucial to ensure that the ordering in (1) holds for allt ∈ [0, T ]. One might expect that if f ′
j(t)≤ f ′i(t)∀t∈ [0, t0] for some t0 < T , then we could at least
Mills, Argon, and Ziya: Resource-Based Patient Prioritization in Mass-Casualty Incidents
6 Manufacturing & Service Operations Management 15(3), pp. 361–377, c© 2013 INFORMS
apply the result of the proposition for the time period [0, t0]. Nonetheless, we can easily constructexamples where this intuition does not hold. And third, it might seem at first that Condition (1)does not depend on the scale of the mass-casualty incident, i.e., the number of patients of variousclasses, transportation capacity, etc. However, recall that T is the time the response effort is over,hence T increases with the number of patients and the response time per patient. This means thatas the scale of the incident gets larger, T becomes larger and as a result it becomes increasinglyless likely for (1) to hold.Proposition 2 directly leads to the complete characterization of an optimal policy when all classes
can be ordered according to Condition (1):
Corollary 1. Suppose that
f ′N−1(t)≤ f ′
N−2(t)≤ · · · ≤ f ′0(t) ∀t∈ [0, T ]. (2)
Then there exists an optimal policy under which there is a fixed-priority ordering (N − 1,N −2, . . . ,0) among the patients so that for any i ∈ {N − 2,N − 3, . . . ,0}, class i + 1 patients havepriority over class i patients.
The policy prescribed by Corollary 1 is very simple and practical. Since the priority ordering isfixed, there is less room for mistakes during implementation. However, the optimality of the policyis only guaranteed under a relatively strong condition. Therefore, it is important to investigatewhat the optimal policy would be like when Condition (2) does not hold.We pursue this question in the following section where we focus on the case with only two patient
classes. There are two main reasons why we consider this particular scenario. First, characterizationof the optimal policy—except under Condition (2)—appears to be very difficult when there aremore than two patient classes. However, more importantly, the two-class case fits perfectly wellwith the widely adopted triage classification used in START. As we described in Section 1, eventhough START puts patients into four classes, patients who are in the expectant class have almostno chance to survive and those with minor injuries do not carry a risk of dying from their injuries.Therefore, the success of the response effort depends almost entirely on how priority decisions forpatients in the immediate and delayed classes are handled. Hence, our analysis of the two-classcase in the next section will help us explore how START can be expanded to include resourcelimitations using our formulation.
4. Priority Decisions for Two Classes of PatientsSuppose that there are only two patient classes, which we name class I (immediate) and class D(delayed). By letting g(t)≡ fD(t)− fI(t), we can rewrite the optimization problem (P2) as
maxW (D)
∫
W (D)
g(t)dt+C (P3)
subject to µ(W (D))= nD
W (D)⊆ [0, T ],
where C ≡∫ T
0fI(t)dt is a constant.
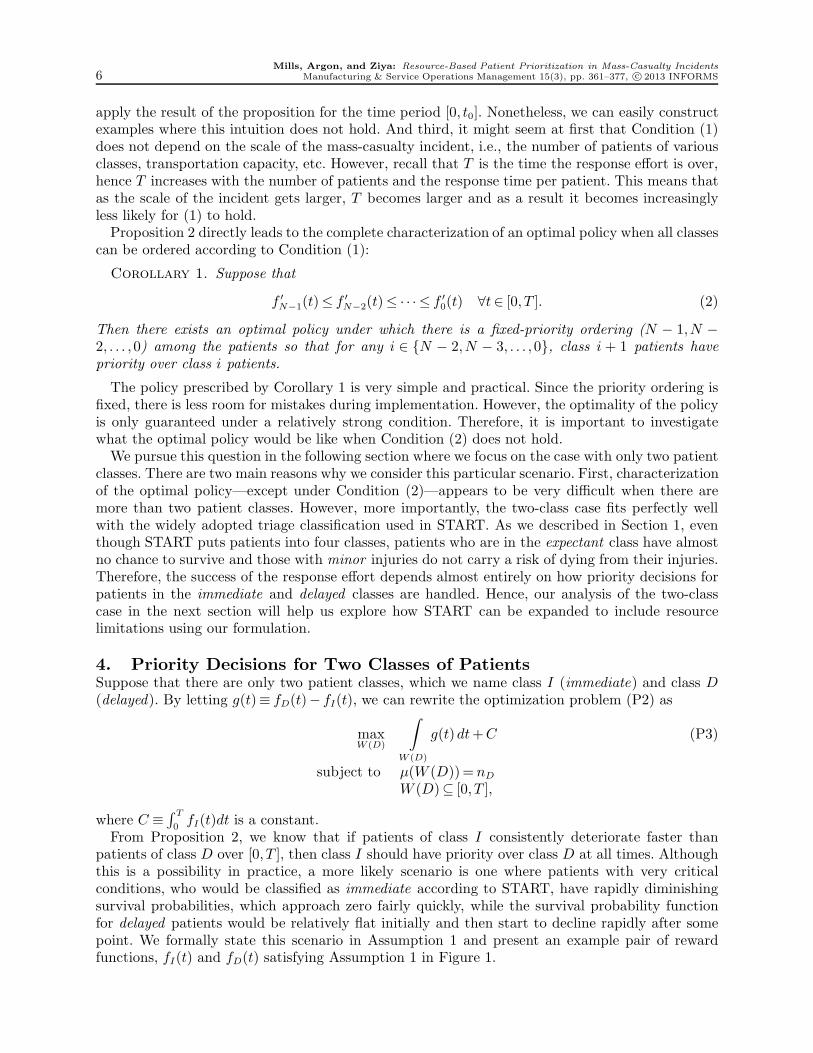
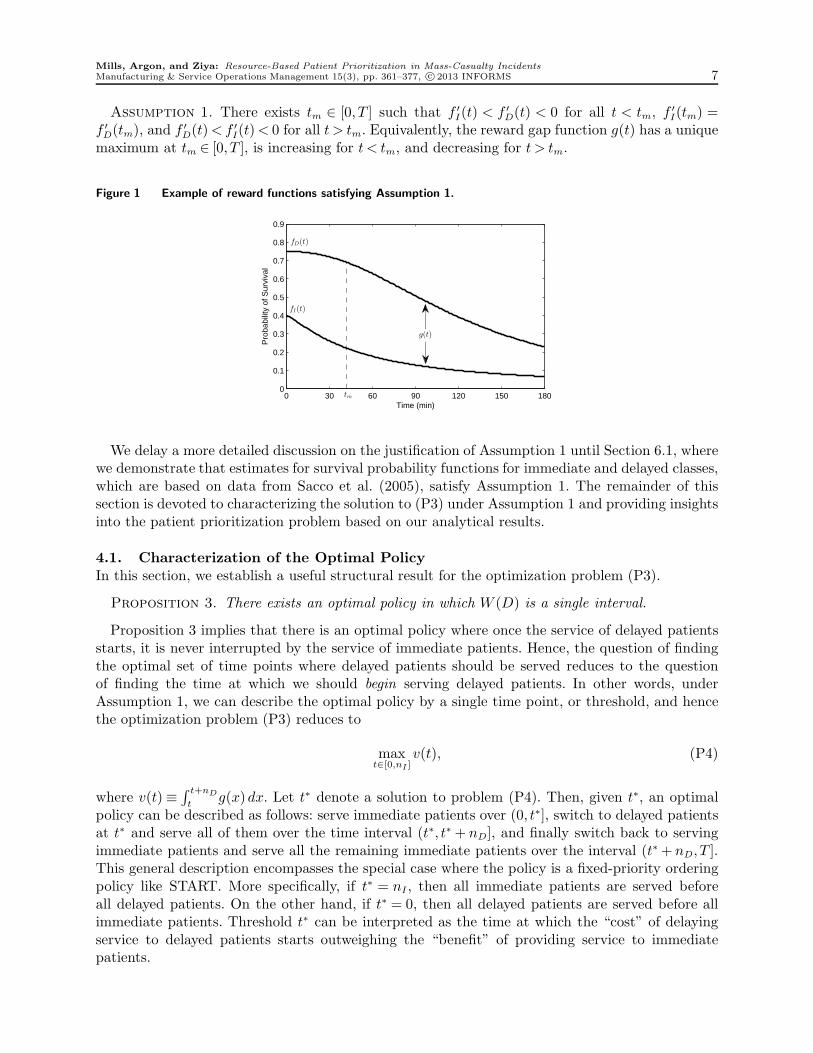
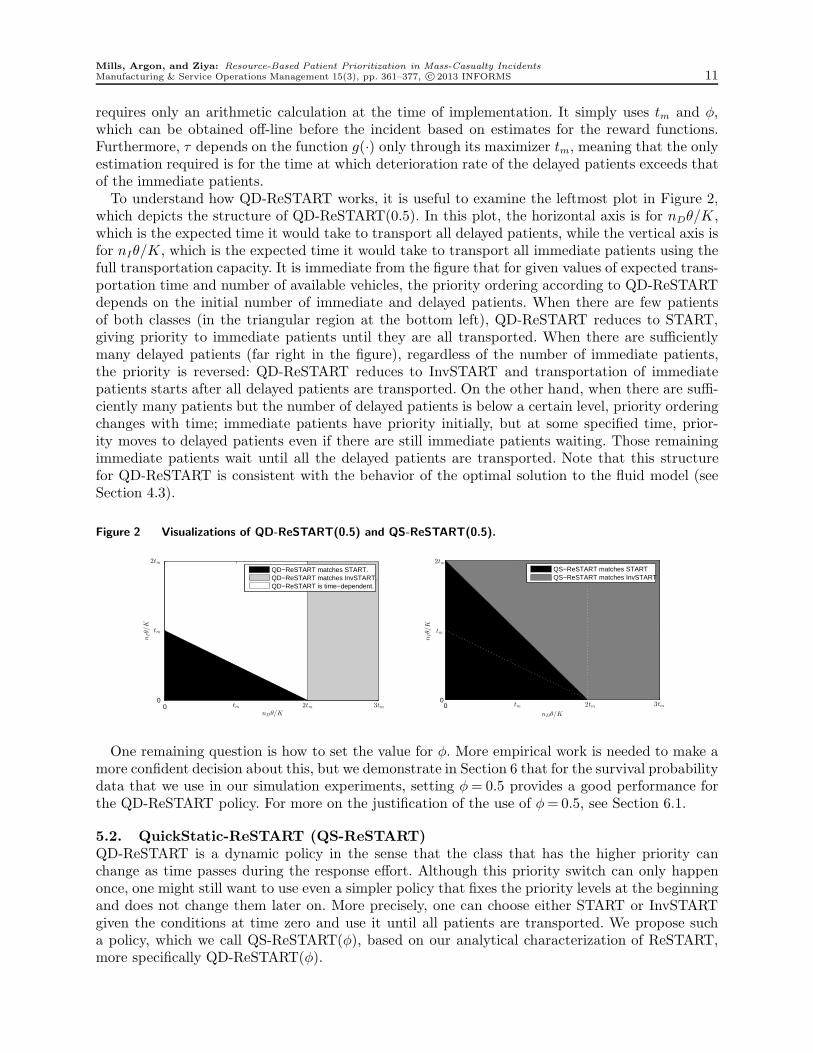
From Proposition 2, we know that if patients of class I consistently deteriorate faster thanpatients of class D over [0, T ], then class I should have priority over class D at all times. Althoughthis is a possibility in practice, a more likely scenario is one where patients with very criticalconditions, who would be classified as immediate according to START, have rapidly diminishingsurvival probabilities, which approach zero fairly quickly, while the survival probability functionfor delayed patients would be relatively flat initially and then start to decline rapidly after somepoint. We formally state this scenario in Assumption 1 and present an example pair of rewardfunctions, fI(t) and fD(t) satisfying Assumption 1 in Figure 1.
Mills, Argon, and Ziya: Resource-Based Patient Prioritization in Mass-Casualty Incidents
Manufacturing & Service Operations Management 15(3), pp. 361–377, c© 2013 INFORMS 7
Assumption 1. There exists tm ∈ [0, T ] such that f ′I(t) < f ′
D(t) < 0 for all t < tm, f ′I(tm) =
f ′D(tm), and f ′
D(t)< f ′I(t)< 0 for all t > tm. Equivalently, the reward gap function g(t) has a unique
maximum at tm ∈ [0, T ], is increasing for t < tm, and decreasing for t > tm.
Figure 1 Example of reward functions satisfying Assumption 1.
0 30 60 90 120 150 1800
0.1
0.2
0.3
0.4
0.5
0.6
0.7
0.8
0.9
Time (min)
Pro
babi
lity
of S
urvi
val
fD(t)
fI(t)
tm
g(t)
We delay a more detailed discussion on the justification of Assumption 1 until Section 6.1, wherewe demonstrate that estimates for survival probability functions for immediate and delayed classes,which are based on data from Sacco et al. (2005), satisfy Assumption 1. The remainder of thissection is devoted to characterizing the solution to (P3) under Assumption 1 and providing insightsinto the patient prioritization problem based on our analytical results.
4.1. Characterization of the Optimal PolicyIn this section, we establish a useful structural result for the optimization problem (P3).
Proposition 3. There exists an optimal policy in which W (D) is a single interval.
Proposition 3 implies that there is an optimal policy where once the service of delayed patientsstarts, it is never interrupted by the service of immediate patients. Hence, the question of findingthe optimal set of time points where delayed patients should be served reduces to the questionof finding the time at which we should begin serving delayed patients. In other words, underAssumption 1, we can describe the optimal policy by a single time point, or threshold, and hencethe optimization problem (P3) reduces to
maxt∈[0,nI ]
v(t), (P4)
where v(t)≡∫ t+nD
tg(x)dx. Let t∗ denote a solution to problem (P4). Then, given t∗, an optimal
policy can be described as follows: serve immediate patients over (0, t∗], switch to delayed patientsat t∗ and serve all of them over the time interval (t∗, t∗ + nD], and finally switch back to servingimmediate patients and serve all the remaining immediate patients over the interval (t∗ + nD, T ].This general description encompasses the special case where the policy is a fixed-priority orderingpolicy like START. More specifically, if t∗ = nI , then all immediate patients are served beforeall delayed patients. On the other hand, if t∗ = 0, then all delayed patients are served before allimmediate patients. Threshold t∗ can be interpreted as the time at which the “cost” of delayingservice to delayed patients starts outweighing the “benefit” of providing service to immediatepatients.
Mills, Argon, and Ziya: Resource-Based Patient Prioritization in Mass-Casualty Incidents
8 Manufacturing & Service Operations Management 15(3), pp. 361–377, c© 2013 INFORMS
4.2. Determining the Optimal ThresholdWe now investigate how one can obtain a solution to problem (P4). We first show that the solutiont∗ is unique and it can be determined more easily by first solving a relaxation of (P4).
Proposition 4. (i) There is a unique optimal solution, t̃, to the optimization problemmax
t∈[0,∞)v(t), and t̃∈ [max{0, tm −nD}, tm].
(ii) t∗ =min{t̃, nI}.(iii) tm ∈ [t∗, t∗ +nD].
Part (i) of Proposition 4 partially characterizes t̃. Note that the difference between t∗ and t̃ isthat while t∗ is restricted to be no greater than nI , t̃ has no such restriction. Practically, t̃ is thetime at which the service of delayed patients should start even if there are still immediate patientsin need of service, which is very likely to be the case when there are many immediate patientsinitially. On the other hand, if all immediate patients are served before t̃, i.e., nI < t̃, then service ofdelayed patients should start at nI , because idling is suboptimal. Therefore, t∗ is the minimum oft̃ and the time it would take to serve all immediate patients if they were given priority at all times.This is reflected in the relationship described in part (ii) of Proposition 4. Part (iii) of Proposition4 states that the optimal service time interval for delayed patients must contain tm. Thus, serviceof delayed patients should start late enough for the service interval to contain the time point atwhich deterioration of delayed patients becomes faster.The following theorem provides a complete characterization of t̃, and thus a complete character-
ization of t∗, which subsequently leads to an algorithm for finding t∗.
Theorem 1. Exactly one of the following three statements is true:(i) g(0)> g(nD), in which case t∗ = t̃= 0.(ii) g(t̃) = g(t̃+nD) and g(nI)≤ g(T ), in which case t∗ = nI ≤ t̃.(iii) g(t̃) = g(t̃+nD) and g(nI)>g(T ), in which case t∗ = t̃ < nI .
Using Theorem 1, it is straightforward to show that the following algorithm determines theoptimal threshold t∗:1. If g(0)>g(nD), return t∗ = 0.2. Else, if g(nI)≤ g(T ), return t∗ = nI .3. Else, return the solution of g(t) = g(t+nD).
Note that t∗ is readily available if one of the two conditions in the first two steps holds. If neitherholds, then one needs to determine the unique solution to g(t) = g(t+nD).The first step in the algorithm checks whether g(0) > g(nD). This condition may hold when
delayed patients deteriorate faster than immediate patients starting at either time zero or soonafter, i.e., when tm is close to or equal to zero. In this case, Theorem 1 indicates that t∗ = 0, andhence, delayed patients have priority at all times. This policy, which we call Inverted START (InvS-TART), is the complete opposite of START because delayed patients have priority over immediatepatients at all times. The same condition may also hold when nD is very large, suggesting thatInvSTART is optimal when there are sufficiently many delayed patients. If the condition in the firststep of the algorithm is not satisfied, i.e., g(0)≤ g(nD), then Theorem 1 states that g(t̃) = g(t̃+nD).In this case, t∗ is equal to t̃ or nI , depending on whether the inequality g(nI) > g(T ) holds ornot. If the algorithm stops in the second step, i.e., t∗ = nI , then the optimal policy is STARTsince immediate patients are given priority over all delayed patients at all times. This case, whereg(nI)≤ g(T ), may occur when either tm is sufficiently large or the total number of patients is suffi-ciently small. Finally, if the algorithm stops in the third step, i.e., t∗ <nI , then the optimal policyis either InvSTART (when t∗ = 0) or time-dependent (i.e., priority will change at time 0< t∗ <nI).Under a time-dependent policy, the service of immediate patients is interrupted by the service ofdelayed patients during (t∗, t∗ +nD].
Mills, Argon, and Ziya: Resource-Based Patient Prioritization in Mass-Casualty Incidents
Manufacturing & Service Operations Management 15(3), pp. 361–377, c© 2013 INFORMS 9
4.3. Sensitivity of the Optimal Policy to the Number of PatientsFrom Theorem 1, it is clear that the optimal prioritization policy depends on the number of patientsin each class, since t∗ is a function of both nI and nD. In order to better understand the relationshipbetween the optimal policy and patient counts, we investigate how t∗ changes with nI and nD.By definition, t̃ does not depend on nI . Hence, by part (ii) of Proposition 4, t∗ increases with nI
for nI < t̃ but does not change for nI ≥ t̃. This suggests that if there are few immediate patients andSTART is optimal (i.e., t∗ = nI), then increasing the number of immediate patients will not changethe policy at first (except for the time when the service of delayed patients should start), butwill eventually change the policy from START to a time-dependent one. However, when there areenough immediate patients for a time-dependent policy or InvSTART to be optimal, then havingmore immediate patients does not change the optimal policy.We next present a proposition that describes how t∗ depends on nD.
Proposition 5. Everything else remaining the same, t∗ either decreases or stays the same asnD increases, i.e., having more delayed patients can only decrease the time the service of delayedpatients starts under the optimal policy.
Proposition 5 and the discussion above yield the following conclusions:(i) If the optimal policy is START, having more patients, regardless of their class, may push the
optimal policy to be time-dependent.(ii) If the optimal policy is time-dependent, having more immediate patients will not change the
policy, whereas having more delayed patients will push the optimal policy toward InvSTART.(iii) If the optimal policy is InvSTART, having more patients will not change the optimal policy.
5. A New Policy for Patient Triage: ReSTARTIn this section, building on our analytical results from previous sections, we demonstrate how onecould construct a new patient prioritization policy that takes into account resource limitations, yetis simple enough for practical implementation. More specifically, we carry the simple solution fromSection 4 to practical settings where the fluid assumptions are obviously violated. We call the newpolicy Resource-based START (ReSTART) to indicate the fact that it builds on START, whichis the most widely adopted triage method in U.S. It is important to emphasize that ReSTARTdoes not propose any new medical criteria to classify patients. ReSTART uses the START classes,but unlike START, it does not necessarily give priority to immediate patients at all times. UnderReSTART, delayed patients can get priority over immediate patients depending on the relativeavailability of the transportation vehicles with respect to the number of patients.Now, let θ denote the expected transportation time for each patient, and K denote the number
of available transportation vehicles. Recall that in Section 4, we normalized the service rate toone, which is the same as assuming that K/θ = 1. Incorporating generality in service rates, i.e.,allowing a general number of vehicles and general transportation times, simply requires scaling ofthe number of patients by θ/K. The description below is based on the algorithm given in Section4.2.Resource-based START (ReSTART):1. Classify patients according to the START classes.2. Determine the number of patients classified as immediate (nI) and the number of patients
classified as delayed (nD). Determine θ, the expected round-trip travel time for each transportationvehicle, and K, the number of vehicles that can be used for transporting patients to the hospital.3. Determine priorities among the immediate and delayed patients as follows:
(i) If g(0)> g(nDθ/K), transport all delayed patients first, followed by all immediate patients.(ii) If g(nIθ/K) ≤ g((nI + nD)θ/K), transport all immediate patients first, followed by all
delayed patients.
Mills, Argon, and Ziya: Resource-Based Patient Prioritization in Mass-Casualty Incidents
10 Manufacturing & Service Operations Management 15(3), pp. 361–377, c© 2013 INFORMS
(iii) Otherwise, determine t∗ such that g(t∗) = g(t∗+nDθ/K). Transport immediate patientsuntil time t∗ or until there are no more remaining immediate patients. Then, start transportingdelayed patients and continue until there are none remaining. Finally, continue with the trans-portation of any remaining immediate patients.Given the reward functions fI(·) and fD(·), implementation of ReSTART is straightforward to
a large extent. While in steps 3(i) and 3(ii), one only needs to check whether the given inequalitieshold, in step 3(iii) a solution to g(t∗) = g(t∗+nDθ/K) must be found. Because the right-hand side ofthe equation depends on nD, θ, and K, t∗ can be computed only after the incident occurs; in otherwords, it cannot be computed “off-line.” The computation of t∗ can be done very quickly using aline-search algorithm, since g(·) is a unimodal function. Nevertheless, this cannot necessarily bedone by hand, which might be a cause for resistance to any potential implementation of ReSTART.Therefore, we simplify the policy further by proposing an approximation for t∗ based on ouranalytical results. In order to distinguish this approximate version of ReSTART from the exactversion described above, we call it Quick-ReSTART (Q-ReSTART). In particular, we propose twodifferent versions of Quick-ReSTART, which we call QuickDynamic-ReSTART (QD-ReSTART)and QuickStatic-ReSTART (QS-ReSTART). In the following, we describe these two policies.
5.1. QuickDynamic-ReSTART (QD-ReSTART)QD-ReSTART is essentially the same as ReSTART except that it does not use the exact value oft∗, but rather an approximation for t∗. From Proposition 4, with the proper scaling for the expectedtravel time and the number of ambulances, we know that t̃∈ [tm−nDθ/K, tm]. Therefore, even if wecannot locate t̃ exactly, it would be reasonable to expect that approximating t̃ with a choice fromthis interval could lead to a policy that performs well. Now, we know that there exists φ̃ ∈ [0,1]such that t̃= tm− φ̃nDθ/K. Instead of determining φ̃ exactly, we approximate it by some φ∈ [0,1].Then, we use τ = tm − φnDθ/K instead of t̃ and set t∗ =min{nI , τ} by part (ii) of Proposition 4.We call the policy that uses this approximation “QD-ReSTART(φ).” Thus, QD-ReSTART is infact a family of policies, with each policy being uniquely described by a value of the parameterφ∈ [0,1]. Below is a formal description of QD-ReSTART.QD-ReSTART(φ):1. Same as ReSTART.2. Same as ReSTART.3. Compute τ = tm −φnDθ/K and prioritize the immediate and delayed patients as follows:
(i) If τ ≤ 0, transport all delayed patients first, followed by all immediate patients.(ii) If τ ≥ nIθ/K, transport all immediate patients first, followed by all delayed patients.(iii) If 0< τ < nIθ/K, transport immediate patients until time τ or until there are no more
remaining immediate patients. Then, start transporting delayed patients (if there are any) andcontinue until there are no remaining delayed patients. Finally, continue with the transportationof any remaining immediate patients.As a result of using τ in place of t̃, the inequalities in steps 3(i) and 3(ii) of ReSTART simplify to
conditions that are easier to check and have insightful interpretations. Here, τ can be interpretedas a measure of the availability of resources relative to the size of the event. It is larger when thereare fewer delayed patients, when transportation times are shorter, and/or when more vehicles areavailable for transportation. Thus, lower values of τ indicate more serious resource limitations.Although ReSTART is the optimal policy for our fluid model under Assumption 1 and is likely
to perform better than QD-ReSTART even under realistic conditions where the fluid assumption isrelaxed, QD-ReSTART is simpler and more practical. Like ReSTART, it requires estimates for theexpected travel time, number of ambulances, and number of immediate and delayed patients, whichshould not be difficult to determine and which are likely to be the minimal set of requirements forany policy that takes resource limitations into account. However, unlike ReSTART, QD-ReSTART
Mills, Argon, and Ziya: Resource-Based Patient Prioritization in Mass-Casualty Incidents
Manufacturing & Service Operations Management 15(3), pp. 361–377, c© 2013 INFORMS 11
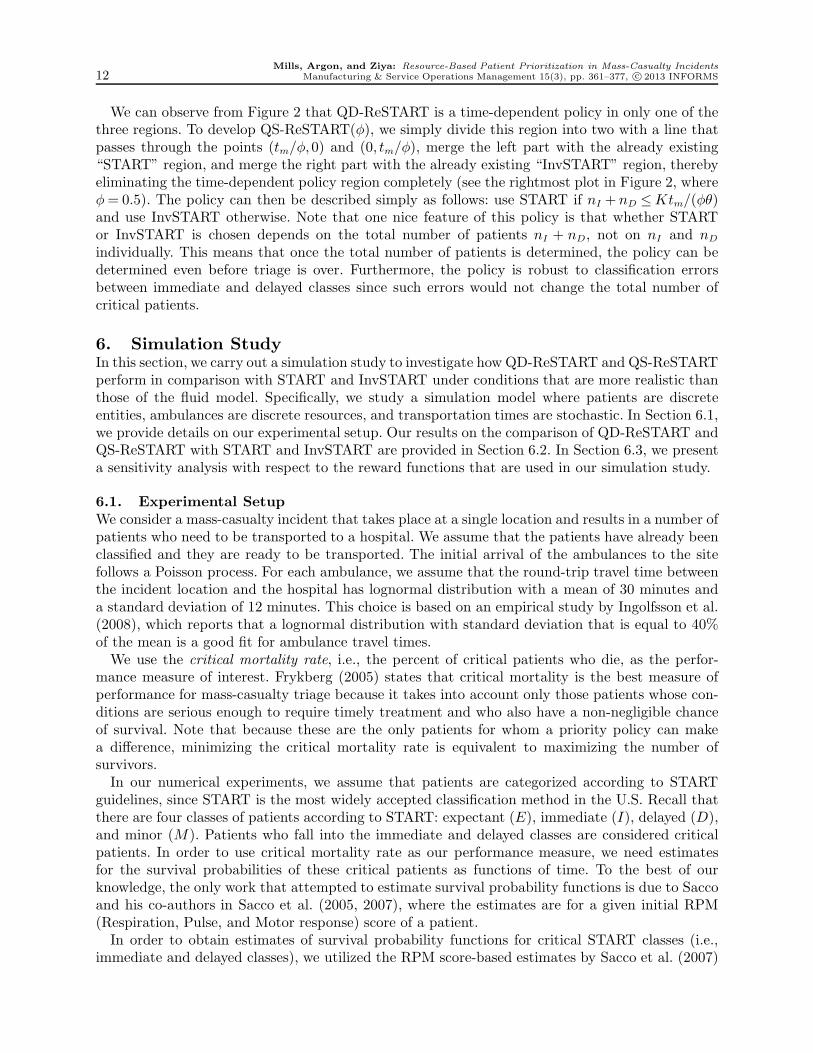
requires only an arithmetic calculation at the time of implementation. It simply uses tm and φ,which can be obtained off-line before the incident based on estimates for the reward functions.Furthermore, τ depends on the function g(·) only through its maximizer tm, meaning that the onlyestimation required is for the time at which deterioration rate of the delayed patients exceeds thatof the immediate patients.To understand how QD-ReSTART works, it is useful to examine the leftmost plot in Figure 2,
which depicts the structure of QD-ReSTART(0.5). In this plot, the horizontal axis is for nDθ/K,which is the expected time it would take to transport all delayed patients, while the vertical axis isfor nIθ/K, which is the expected time it would take to transport all immediate patients using thefull transportation capacity. It is immediate from the figure that for given values of expected trans-portation time and number of available vehicles, the priority ordering according to QD-ReSTARTdepends on the initial number of immediate and delayed patients. When there are few patientsof both classes (in the triangular region at the bottom left), QD-ReSTART reduces to START,giving priority to immediate patients until they are all transported. When there are sufficientlymany delayed patients (far right in the figure), regardless of the number of immediate patients,the priority is reversed: QD-ReSTART reduces to InvSTART and transportation of immediatepatients starts after all delayed patients are transported. On the other hand, when there are suffi-ciently many patients but the number of delayed patients is below a certain level, priority orderingchanges with time; immediate patients have priority initially, but at some specified time, prior-ity moves to delayed patients even if there are still immediate patients waiting. Those remainingimmediate patients wait until all the delayed patients are transported. Note that this structurefor QD-ReSTART is consistent with the behavior of the optimal solution to the fluid model (seeSection 4.3).
Figure 2 Visualizations of QD-ReSTART(0.5) and QS-ReSTART(0.5).
nDθ/K
nIθ/K
0 tm 2tm 3tm0
tm
2tmQD−ReSTART matches START.QD−ReSTART matches InvSTART.QD−ReSTART is time−dependent.
00
nDθ/K
nIθ/K
QS−ReSTART matches STARTQS−ReSTART matches InvSTART
3tm
2tm
tm 2tm
tm
One remaining question is how to set the value for φ. More empirical work is needed to make amore confident decision about this, but we demonstrate in Section 6 that for the survival probabilitydata that we use in our simulation experiments, setting φ= 0.5 provides a good performance forthe QD-ReSTART policy. For more on the justification of the use of φ=0.5, see Section 6.1.
5.2. QuickStatic-ReSTART (QS-ReSTART)QD-ReSTART is a dynamic policy in the sense that the class that has the higher priority canchange as time passes during the response effort. Although this priority switch can only happenonce, one might still want to use even a simpler policy that fixes the priority levels at the beginningand does not change them later on. More precisely, one can choose either START or InvSTARTgiven the conditions at time zero and use it until all patients are transported. We propose sucha policy, which we call QS-ReSTART(φ), based on our analytical characterization of ReSTART,more specifically QD-ReSTART(φ).
Mills, Argon, and Ziya: Resource-Based Patient Prioritization in Mass-Casualty Incidents
12 Manufacturing & Service Operations Management 15(3), pp. 361–377, c© 2013 INFORMS
We can observe from Figure 2 that QD-ReSTART is a time-dependent policy in only one of thethree regions. To develop QS-ReSTART(φ), we simply divide this region into two with a line thatpasses through the points (tm/φ,0) and (0, tm/φ), merge the left part with the already existing“START” region, and merge the right part with the already existing “InvSTART” region, therebyeliminating the time-dependent policy region completely (see the rightmost plot in Figure 2, whereφ= 0.5). The policy can then be described simply as follows: use START if nI + nD ≤Ktm/(φθ)and use InvSTART otherwise. Note that one nice feature of this policy is that whether STARTor InvSTART is chosen depends on the total number of patients nI + nD, not on nI and nD
individually. This means that once the total number of patients is determined, the policy can bedetermined even before triage is over. Furthermore, the policy is robust to classification errorsbetween immediate and delayed classes since such errors would not change the total number ofcritical patients.
6. Simulation StudyIn this section, we carry out a simulation study to investigate how QD-ReSTART and QS-ReSTARTperform in comparison with START and InvSTART under conditions that are more realistic thanthose of the fluid model. Specifically, we study a simulation model where patients are discreteentities, ambulances are discrete resources, and transportation times are stochastic. In Section 6.1,we provide details on our experimental setup. Our results on the comparison of QD-ReSTART andQS-ReSTART with START and InvSTART are provided in Section 6.2. In Section 6.3, we presenta sensitivity analysis with respect to the reward functions that are used in our simulation study.
6.1. Experimental SetupWe consider a mass-casualty incident that takes place at a single location and results in a number ofpatients who need to be transported to a hospital. We assume that the patients have already beenclassified and they are ready to be transported. The initial arrival of the ambulances to the sitefollows a Poisson process. For each ambulance, we assume that the round-trip travel time betweenthe incident location and the hospital has lognormal distribution with a mean of 30 minutes anda standard deviation of 12 minutes. This choice is based on an empirical study by Ingolfsson et al.(2008), which reports that a lognormal distribution with standard deviation that is equal to 40%of the mean is a good fit for ambulance travel times.We use the critical mortality rate, i.e., the percent of critical patients who die, as the perfor-
mance measure of interest. Frykberg (2005) states that critical mortality is the best measure ofperformance for mass-casualty triage because it takes into account only those patients whose con-ditions are serious enough to require timely treatment and who also have a non-negligible chanceof survival. Note that because these are the only patients for whom a priority policy can makea difference, minimizing the critical mortality rate is equivalent to maximizing the number ofsurvivors.In our numerical experiments, we assume that patients are categorized according to START
guidelines, since START is the most widely accepted classification method in the U.S. Recall thatthere are four classes of patients according to START: expectant (E), immediate (I), delayed (D),and minor (M). Patients who fall into the immediate and delayed classes are considered criticalpatients. In order to use critical mortality rate as our performance measure, we need estimatesfor the survival probabilities of these critical patients as functions of time. To the best of ourknowledge, the only work that attempted to estimate survival probability functions is due to Saccoand his co-authors in Sacco et al. (2005, 2007), where the estimates are for a given initial RPM(Respiration, Pulse, and Motor response) score of a patient.In order to obtain estimates of survival probability functions for critical START classes (i.e.,
immediate and delayed classes), we utilized the RPM score-based estimates by Sacco et al. (2007)
Mills, Argon, and Ziya: Resource-Based Patient Prioritization in Mass-Casualty Incidents
Manufacturing & Service Operations Management 15(3), pp. 361–377, c© 2013 INFORMS 13
and also consulted James E. Winslow, M.D., an associate professor of emergency medicine at WakeForest University (Winslow et al. 2010). Our analysis revealed that the following three-parameterfunction is a good model for the reward functions fI(t) and fD(t):
fi(t) =β0,i
(
t
β1,i
)β2,i
+1
, for i∈ {I,D}, (3)
where βj,i > 0 for j = 0,1,2 and i ∈ {I,D}. Note that this function is a scaled version of thelog-logistic distribution, which is commonly used in survival analysis (Cox and Oakes 1984). Fur-thermore, among such functions, this function provided one of the best fits to the empirical datathat originated from Sacco et al. (2007). The Online Supplement discusses the details of this curvefitting study and how we estimated the parameters of model (3) using the data from Sacco et al.(2007) and Winslow et al. (2010).To our knowledge there is no existing research on the survival probability functions or patient
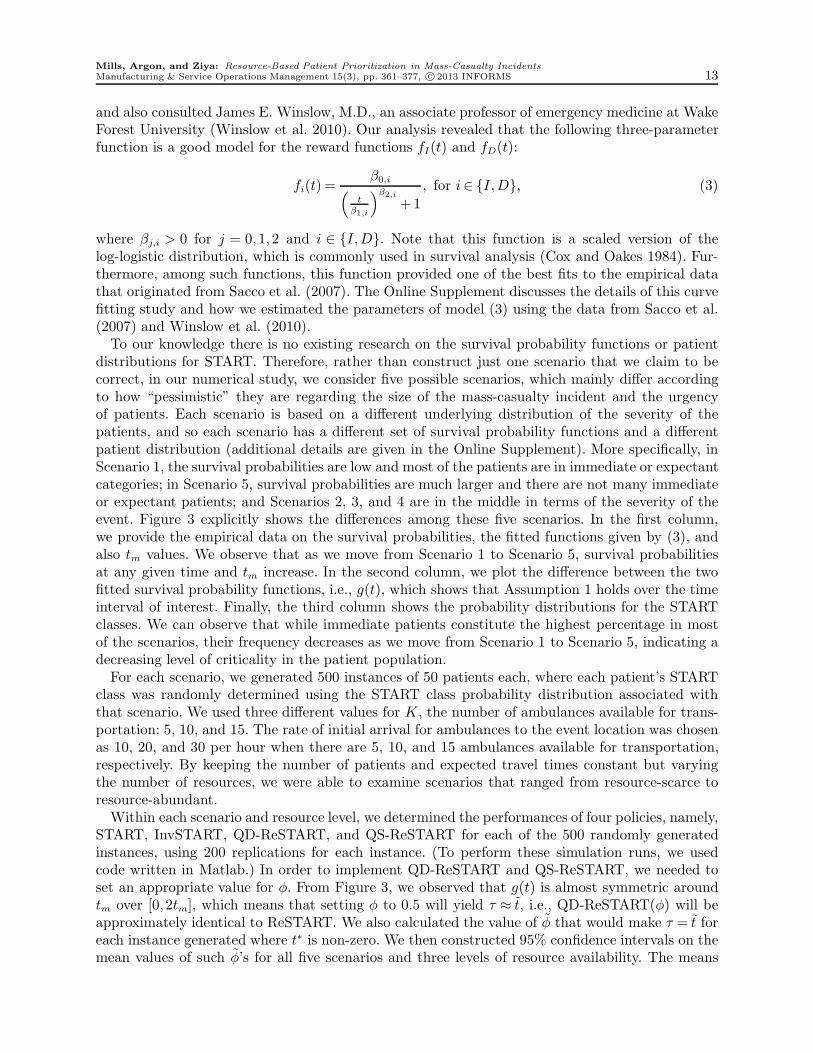
distributions for START. Therefore, rather than construct just one scenario that we claim to becorrect, in our numerical study, we consider five possible scenarios, which mainly differ accordingto how “pessimistic” they are regarding the size of the mass-casualty incident and the urgencyof patients. Each scenario is based on a different underlying distribution of the severity of thepatients, and so each scenario has a different set of survival probability functions and a differentpatient distribution (additional details are given in the Online Supplement). More specifically, inScenario 1, the survival probabilities are low and most of the patients are in immediate or expectantcategories; in Scenario 5, survival probabilities are much larger and there are not many immediateor expectant patients; and Scenarios 2, 3, and 4 are in the middle in terms of the severity of theevent. Figure 3 explicitly shows the differences among these five scenarios. In the first column,we provide the empirical data on the survival probabilities, the fitted functions given by (3), andalso tm values. We observe that as we move from Scenario 1 to Scenario 5, survival probabilitiesat any given time and tm increase. In the second column, we plot the difference between the twofitted survival probability functions, i.e., g(t), which shows that Assumption 1 holds over the timeinterval of interest. Finally, the third column shows the probability distributions for the STARTclasses. We can observe that while immediate patients constitute the highest percentage in mostof the scenarios, their frequency decreases as we move from Scenario 1 to Scenario 5, indicating adecreasing level of criticality in the patient population.For each scenario, we generated 500 instances of 50 patients each, where each patient’s START
class was randomly determined using the START class probability distribution associated withthat scenario. We used three different values for K, the number of ambulances available for trans-portation: 5, 10, and 15. The rate of initial arrival for ambulances to the event location was chosenas 10, 20, and 30 per hour when there are 5, 10, and 15 ambulances available for transportation,respectively. By keeping the number of patients and expected travel times constant but varyingthe number of resources, we were able to examine scenarios that ranged from resource-scarce toresource-abundant.Within each scenario and resource level, we determined the performances of four policies, namely,
START, InvSTART, QD-ReSTART, and QS-ReSTART for each of the 500 randomly generatedinstances, using 200 replications for each instance. (To perform these simulation runs, we usedcode written in Matlab.) In order to implement QD-ReSTART and QS-ReSTART, we needed toset an appropriate value for φ. From Figure 3, we observed that g(t) is almost symmetric aroundtm over [0,2tm], which means that setting φ to 0.5 will yield τ ≈ t̃, i.e., QD-ReSTART(φ) will beapproximately identical to ReSTART. We also calculated the value of φ̃ that would make τ = t̃ foreach instance generated where t∗ is non-zero. We then constructed 95% confidence intervals on themean values of such φ̃’s for all five scenarios and three levels of resource availability. The means
Mills, Argon, and Ziya: Resource-Based Patient Prioritization in Mass-Casualty Incidents
14 Manufacturing & Service Operations Management 15(3), pp. 361–377, c© 2013 INFORMS
Figure 3 Survival probability (reward) functions, g(t), and START class distributions for the five scenarios.
0 60 120 180 240 3000
0.3
0.6
0.9
tm = 8
Sce
nario
1
EmpiricalImmediate Reward Delayed Reward
0 60 120 180 240 3000
0.3
0.6
0.9
tm = 18
Sce
nario
2
0 60 120 180 240 3000
0.3
0.6
0.9
tm = 35
Sce
nario
3
0 60 120 180 240 3000
0.3
0.6
0.9
tm = 51
Sce
nario
4
0 60 120 180 240 3000
0.3
0.6
0.9
tm = 71
Sce
nario
5
0 60 120 180 240 3000
0.3
0.6
g(t)
0 60 120 180 240 3000
0.3
0.6
0 60 120 180 240 3000
0.3
0.6
0 60 120 180 240 3000
0.3
0.6
0 60 120 180 240 3000
0.3
0.6
E I D M0
0.2
0.4
0.6
0.8
1
E I D M0
0.2
0.4
0.6
0.8
1
E I D M0
0.2
0.4
0.6
0.8
1
E I D M0
0.2
0.4
0.6
0.8
1
E I D M0
0.2
0.4
0.6
0.8
1
of these fifteen confidence intervals ranged between 0.42 and 0.51, and the half-lengths of theseintervals were all less than 0.01. Based on these observations, we set φ to 0.5 in all our simulationexperiments that involve QD-ReSTART and QS-ReSTART.
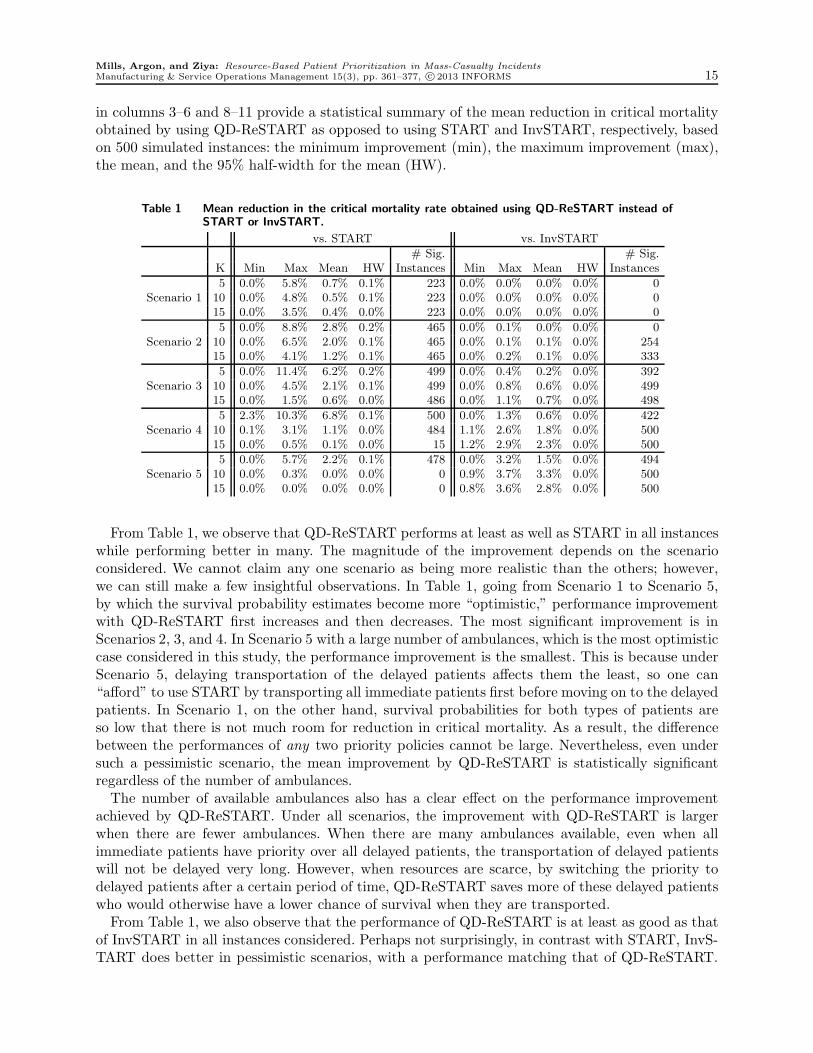
6.2. Comparison of QD-ReSTART and QS-ReSTART with START and InvSTARTWe first compare QD-ReSTART with START and InvSTART in terms of the critical mortalityrate in Table 1. In this table, the 7th and 12th columns report the number of instances (out of 500)in which the mean performance difference is statistically significant at the 0.05 level. The numbers
Mills, Argon, and Ziya: Resource-Based Patient Prioritization in Mass-Casualty Incidents
Manufacturing & Service Operations Management 15(3), pp. 361–377, c© 2013 INFORMS 15
in columns 3–6 and 8–11 provide a statistical summary of the mean reduction in critical mortalityobtained by using QD-ReSTART as opposed to using START and InvSTART, respectively, basedon 500 simulated instances: the minimum improvement (min), the maximum improvement (max),the mean, and the 95% half-width for the mean (HW).
Table 1 Mean reduction in the critical mortality rate obtained using QD-ReSTART instead ofSTART or InvSTART.
vs. START vs. InvSTART
# Sig. # Sig.K Min Max Mean HW Instances Min Max Mean HW Instances
5 0.0% 5.8% 0.7% 0.1% 223 0.0% 0.0% 0.0% 0.0% 0Scenario 1 10 0.0% 4.8% 0.5% 0.1% 223 0.0% 0.0% 0.0% 0.0% 0
15 0.0% 3.5% 0.4% 0.0% 223 0.0% 0.0% 0.0% 0.0% 0
5 0.0% 8.8% 2.8% 0.2% 465 0.0% 0.1% 0.0% 0.0% 0Scenario 2 10 0.0% 6.5% 2.0% 0.1% 465 0.0% 0.1% 0.1% 0.0% 254
15 0.0% 4.1% 1.2% 0.1% 465 0.0% 0.2% 0.1% 0.0% 333
5 0.0% 11.4% 6.2% 0.2% 499 0.0% 0.4% 0.2% 0.0% 392Scenario 3 10 0.0% 4.5% 2.1% 0.1% 499 0.0% 0.8% 0.6% 0.0% 499
15 0.0% 1.5% 0.6% 0.0% 486 0.0% 1.1% 0.7% 0.0% 498
5 2.3% 10.3% 6.8% 0.1% 500 0.0% 1.3% 0.6% 0.0% 422Scenario 4 10 0.1% 3.1% 1.1% 0.0% 484 1.1% 2.6% 1.8% 0.0% 500
15 0.0% 0.5% 0.1% 0.0% 15 1.2% 2.9% 2.3% 0.0% 500
5 0.0% 5.7% 2.2% 0.1% 478 0.0% 3.2% 1.5% 0.0% 494Scenario 5 10 0.0% 0.3% 0.0% 0.0% 0 0.9% 3.7% 3.3% 0.0% 500
15 0.0% 0.0% 0.0% 0.0% 0 0.8% 3.6% 2.8% 0.0% 500
From Table 1, we observe that QD-ReSTART performs at least as well as START in all instanceswhile performing better in many. The magnitude of the improvement depends on the scenarioconsidered. We cannot claim any one scenario as being more realistic than the others; however,we can still make a few insightful observations. In Table 1, going from Scenario 1 to Scenario 5,by which the survival probability estimates become more “optimistic,” performance improvementwith QD-ReSTART first increases and then decreases. The most significant improvement is inScenarios 2, 3, and 4. In Scenario 5 with a large number of ambulances, which is the most optimisticcase considered in this study, the performance improvement is the smallest. This is because underScenario 5, delaying transportation of the delayed patients affects them the least, so one can“afford” to use START by transporting all immediate patients first before moving on to the delayedpatients. In Scenario 1, on the other hand, survival probabilities for both types of patients areso low that there is not much room for reduction in critical mortality. As a result, the differencebetween the performances of any two priority policies cannot be large. Nevertheless, even undersuch a pessimistic scenario, the mean improvement by QD-ReSTART is statistically significantregardless of the number of ambulances.The number of available ambulances also has a clear effect on the performance improvement
achieved by QD-ReSTART. Under all scenarios, the improvement with QD-ReSTART is largerwhen there are fewer ambulances. When there are many ambulances available, even when allimmediate patients have priority over all delayed patients, the transportation of delayed patientswill not be delayed very long. However, when resources are scarce, by switching the priority todelayed patients after a certain period of time, QD-ReSTART saves more of these delayed patientswho would otherwise have a lower chance of survival when they are transported.From Table 1, we also observe that the performance of QD-ReSTART is at least as good as that
of InvSTART in all instances considered. Perhaps not surprisingly, in contrast with START, InvS-TART does better in pessimistic scenarios, with a performance matching that of QD-ReSTART.
Mills, Argon, and Ziya: Resource-Based Patient Prioritization in Mass-Casualty Incidents
16 Manufacturing & Service Operations Management 15(3), pp. 361–377, c© 2013 INFORMS
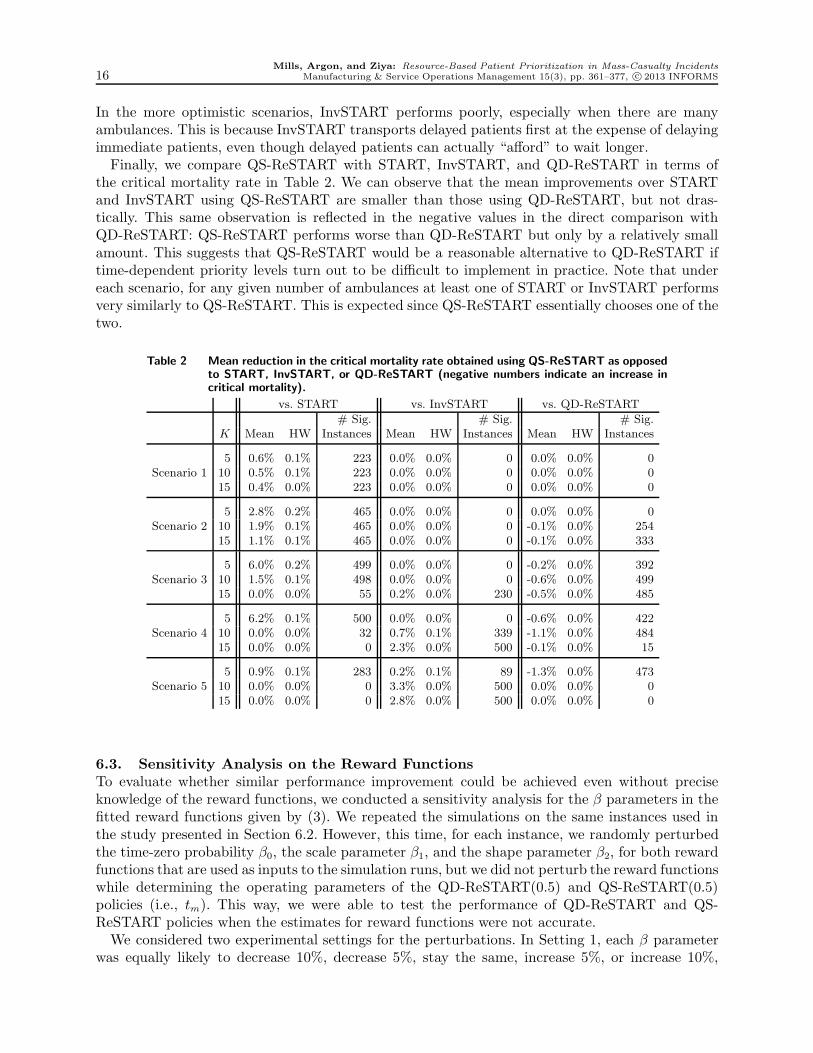
In the more optimistic scenarios, InvSTART performs poorly, especially when there are manyambulances. This is because InvSTART transports delayed patients first at the expense of delayingimmediate patients, even though delayed patients can actually “afford” to wait longer.Finally, we compare QS-ReSTART with START, InvSTART, and QD-ReSTART in terms of
the critical mortality rate in Table 2. We can observe that the mean improvements over STARTand InvSTART using QS-ReSTART are smaller than those using QD-ReSTART, but not dras-tically. This same observation is reflected in the negative values in the direct comparison withQD-ReSTART: QS-ReSTART performs worse than QD-ReSTART but only by a relatively smallamount. This suggests that QS-ReSTART would be a reasonable alternative to QD-ReSTART iftime-dependent priority levels turn out to be difficult to implement in practice. Note that undereach scenario, for any given number of ambulances at least one of START or InvSTART performsvery similarly to QS-ReSTART. This is expected since QS-ReSTART essentially chooses one of thetwo.
Table 2 Mean reduction in the critical mortality rate obtained using QS-ReSTART as opposedto START, InvSTART, or QD-ReSTART (negative numbers indicate an increase incritical mortality).
vs. START vs. InvSTART vs. QD-ReSTART
# Sig. # Sig. # Sig.K Mean HW Instances Mean HW Instances Mean HW Instances
5 0.6% 0.1% 223 0.0% 0.0% 0 0.0% 0.0% 0Scenario 1 10 0.5% 0.1% 223 0.0% 0.0% 0 0.0% 0.0% 0
15 0.4% 0.0% 223 0.0% 0.0% 0 0.0% 0.0% 0
5 2.8% 0.2% 465 0.0% 0.0% 0 0.0% 0.0% 0Scenario 2 10 1.9% 0.1% 465 0.0% 0.0% 0 -0.1% 0.0% 254
15 1.1% 0.1% 465 0.0% 0.0% 0 -0.1% 0.0% 333
5 6.0% 0.2% 499 0.0% 0.0% 0 -0.2% 0.0% 392Scenario 3 10 1.5% 0.1% 498 0.0% 0.0% 0 -0.6% 0.0% 499
15 0.0% 0.0% 55 0.2% 0.0% 230 -0.5% 0.0% 485
5 6.2% 0.1% 500 0.0% 0.0% 0 -0.6% 0.0% 422Scenario 4 10 0.0% 0.0% 32 0.7% 0.1% 339 -1.1% 0.0% 484
15 0.0% 0.0% 0 2.3% 0.0% 500 -0.1% 0.0% 15
5 0.9% 0.1% 283 0.2% 0.1% 89 -1.3% 0.0% 473Scenario 5 10 0.0% 0.0% 0 3.3% 0.0% 500 0.0% 0.0% 0
15 0.0% 0.0% 0 2.8% 0.0% 500 0.0% 0.0% 0
6.3. Sensitivity Analysis on the Reward FunctionsTo evaluate whether similar performance improvement could be achieved even without preciseknowledge of the reward functions, we conducted a sensitivity analysis for the β parameters in thefitted reward functions given by (3). We repeated the simulations on the same instances used inthe study presented in Section 6.2. However, this time, for each instance, we randomly perturbedthe time-zero probability β0, the scale parameter β1, and the shape parameter β2, for both rewardfunctions that are used as inputs to the simulation runs, but we did not perturb the reward functionswhile determining the operating parameters of the QD-ReSTART(0.5) and QS-ReSTART(0.5)policies (i.e., tm). This way, we were able to test the performance of QD-ReSTART and QS-ReSTART policies when the estimates for reward functions were not accurate.We considered two experimental settings for the perturbations. In Setting 1, each β parameter
was equally likely to decrease 10%, decrease 5%, stay the same, increase 5%, or increase 10%,

Mills, Argon, and Ziya: Resource-Based Patient Prioritization in Mass-Casualty Incidents
Manufacturing & Service Operations Management 15(3), pp. 361–377, c© 2013 INFORMS 17
whereas in Setting 2, each β parameter was equally likely to decrease 20%, decrease 10%, stay the
same, increase 10%, or increase 20%. In the interest of space, we here provide results only on Setting
1 and note that the main conclusions under Setting 2 are similar but the differences between the
perturbed and original results are more pronounced. We also do not report our sensitivity results
on the comparison of ReSTART policies with InvSTART here because the insights gained are very
similar for those obtained on the comparison with START.
Table 3 Mean reduction in the critical mortality rate obtained using QD-ReSTART(0.5)and QS-ReSTART(0.5) instead of START on instances with perturbed rewardfunction parameters.
QD-ReSTART vs. START QS-ReSTART vs. START
# Better # Worse # Better # WorseK Mean HW Instances Instances Mean HW Instances Instances
5 0.6% 0.1% 223 0 0.6% 0.1% 223 0Scenario 1 10 0.5% 0.1% 223 0 0.5% 0.1% 223 0
15 0.4% 0.0% 223 0 0.4% 0.0% 223 0
5 2.8% 0.2% 465 0 2.8% 0.2% 465 0Scenario 2 10 2.0% 0.1% 465 0 1.9% 0.1% 465 0
15 1.2% 0.1% 465 0 1.1% 0.1% 465 0
5 6.2% 0.2% 499 0 6.0% 0.2% 499 0Scenario 3 10 2.1% 0.1% 499 0 1.6% 0.1% 486 3
15 0.6% 0.0% 461 0 0.0% 0.0% 87 48
5 6.8% 0.2% 500 0 6.2% 0.2% 500 0Scenario 4 10 1.2% 0.1% 455 0 0.1% 0.1% 67 58
15 0.1% 0.0% 36 0 0.0% 0.0% 0 0
5 2.2% 0.1% 441 2 0.9% 0.2% 251 94Scenario 5 10 0.0% 0.0% 4 0 0.0% 0.0% 0 0
15 0.0% 0.0% 0 0 0.0% 0.0% 0 0
The results of the sensitivity analysis of comparison of ReSTART policies with START under
Setting 1 are summarized in Table 3. This table follows the same format as Table 2, except that we
now separate the number of instances where ReSTART policies are statistically better from those
in which they are statistically worse, both at a significance level of 0.05.
From this sensitivity analysis, we observed that while a few of the perturbed instances resulted
in an increase in critical mortality, the vast majority of instances still saw improvement using QD-
ReSTART. Even the first quartile had non-negative improvement over both START and InvSTART
in every scenario, and QD-ReSTART performed worse than START only in 2 [82] instances (out
of the 7500 simulated) at the 0.05 significance level under Setting 1 [2]. QS-ReSTART has similar
trends in average performance, but START performed better than QS-ReSTART in a larger number
of instances (203 [281] of the 7500 simulated under Setting 1 [2]) at the 0.05 significance level.
Hence, QS-ReSTART appears to be less robust to perturbations or changes in the reward functions
than QD-ReSTART. This difference can be attributed to the fact that under QD-ReSTART, a
small change in the value of tm due to imperfect information about reward functions will only lead
to a correspondingly small change in t∗, which will not affect the policy significantly. On the other
hand, under QS-ReSTART, a change in the value of tm could lead to a complete reversal of the
policy (from START to InvSTART or vice versa).
Mills, Argon, and Ziya: Resource-Based Patient Prioritization in Mass-Casualty Incidents
18 Manufacturing & Service Operations Management 15(3), pp. 361–377, c© 2013 INFORMS
7. Adapting ReSTART to Changing Conditions on the FieldThis section relaxes some of the fundamental assumptions that we made when building our math-ematical and simulation models in the earlier sections. In particular, we make three structuralchanges to our original setup. First, since this paper focuses on incidents where no extensive search-and-rescue effort is needed, we originally assumed that all patients are accounted for immediately.However, even when no significant time is needed to locate and prepare patients for transportation,there could be still some delays in having some of the patients ready for transport. Hence, in thissection, we will consider the possibility that not all patients are available at time zero and thusthere is a delay in not only having these patients available but also knowing how many patientsthere are in total.Second, we originally assumed that all patients are classified into the delayed and immediate
categories correctly. In reality, triage is prone to errors. More specifically, there are two typesof triage errors: undertriage, when a patient who should have been classified as immediate isclassified as delayed, and overtriage, when a patient who should have been classified as delayed isclassified as immediate. Taking these misclassification errors into the decision making process isactually a subtle issue because it is tightly related to the estimation of the survival probabilities.Because classification errors are common in triage, survival probability functions can (and should)be estimated by taking this fact into account explicitly. Nevertheless, in practice, classificationerrors can be even more significant than the normally anticipated levels and thus it is of interest toinvestigate their effect on the performance of prioritization policies. Thus, in this section, we willalso consider the possibility that patients are misclassified as a result of triage.Third, in connection with the second issue, our original model assumed that patients are not
triaged again after time zero, which may be the case in practice due to lack of resources or poororganization. However, because many from the emergency response community emphasize theimportance of retriage and because our new set of relaxed conditions that allow misclassificationmake retriage a meaningful action, we now assume that patients will go through retriage some timeafter the start of the response effort.The main difficulty that arises as a result of the explicit consideration of these new features is
that there is a delay of information not only on the actual number of patients from each classbut also on the total number of patients who will need to be transported. As one can observefrom Figure 2, an incorrect estimate of the number of patients can change the specific prescriptionby ReSTART policies, which would possibly degrade their performance. In the remainder of thissection, we discuss how one can use ReSTART policies in an adaptive way and test by means of asimulation study how their performance is affected by misclassification errors, delayed availabilityof patients, and retriage.
7.1. Adaptive QD-ReSTART and QS-ReSTARTAdaptive QD-ReSTART is essentially QD-ReSTART with policy parameters updated regularlyor every time an event provides new information on the number of patients. This event couldbe the arrival of a new patient (which could change nI , nD, and nI + nD) or retriage (whichcould change nI and nD but not nI + nD). More specifically, adaptive QD-ReSTART uses themost up-to-date information on the number of patients in each class and determines which classshould get a priority by following the QD-ReSTART description provided in Section 5 and usingthe τ value updated with respect to the current time t, which we call τ(t). In particular, we letτ(t) = tm− t−nD(t)θφ/K, where ni(t) is the number of patients categorized as class i∈ {I,D} attime t. (Note that τ(0) corresponds to τ in the description of QD-ReSTART provided in Section5.) Thus, τ(t) changes with the number of delayed patients but not with the number of immediatepatients. Similarly, one could obtain an adaptive version of QS-ReSTART as follows: at time t, useSTART if nI(t)+nD(t)≤K(tm− t)/(φθ) and use InvSTART otherwise.
Mills, Argon, and Ziya: Resource-Based Patient Prioritization in Mass-Casualty Incidents
Manufacturing & Service Operations Management 15(3), pp. 361–377, c© 2013 INFORMS 19
7.2. Performance of Adaptive ReSTART policiesIn this section, we report the results of a numerical study on the performance of the adaptive QD-ReSTART and QS-ReSTART policies. In this study, we used the same experimental setup as inSection 6.2 for the total number of patients, the number of ambulances, and the survival probabilityfunctions, which gave us the same 7500 problem instances. However, this time, we also consideredthe possibility that there is some delay in having some of the patients ready for transportationand that the triage classification is imperfect. We assumed that the reward functions are the same(and have the same time origin at t= 0) for the patients who are ready to transport as those forpatients who are not ready. We also assumed that patients would go through triage once again atsome point during the response effort.We conducted two separate simulation studies. In Study 1, we assumed that all patients are
available for transportation at time zero; however, each patient can be misclassified. Retrospec-tive studies of mass-casualty incidents found that while the overtriage rate is typically high, theundertriage rate is usually very low. For example, Frykberg (2005) reports a range of 20–80% forovertriage, while undertriage is almost non-existent. To account for the relatively wide range ofpossible overtriage rates, we simulated each instance twice, once with a moderate overtriage proba-bility for each delayed patient of 0.4, and another time with a high overtriage probability of 0.6. (Welet pO denote the overtriage probability.) We set the undertriage probability for each immediatepatient to 0.05. For both cases, we assumed that patients who are still waiting for transportation40 minutes after the incident go through retriage, which then reveals patients’ true classifications.The choice of 40 minutes as the retriage time is largely arbitrary. In practice, emergency respondersare urged to conduct retriage to identify cases of overtriage and undertriage (Mistovich and Kar-ren 2007), but START and similar policies lack a standard dictating when retriage should occur(Lerner 2008).We considered four different policies, namely the adaptive versions of START, InvSTART, QD-
ReSTART, and QS-ReSTART. Note that here START and InvSTART are adaptive in the sensethat they use the updated classifications as a result of retriage. This is somewhat different fromthe notion of being adaptive for QD-ReSTART and QS-ReSTART, under which not only theclassification of patients but also the structure of the policy may change due to retriage. Our resultson the comparison of QD-ReSTART with START are summarized in Table 4 under the columnlabeled Study 1. Numbers given are the mean percentage improvement in the critical mortality ratewhen using the adaptive version of QD-ReSTART as opposed to START. Comparison with Table 1reveals that with misclassification and retriage, the improvements by adaptive QD-ReSTART overSTART are slightly lower but they are still significant. In the interest of space, we do not presenthere our results on the comparison of QD-ReSTART with InvSTART, which provided similarconclusions. We also omit our results on the performance of QS-ReSTART under Study 1 becausethe performance does not change much compared to the case without misclassification and retriage,which is reported in Table 2. This is an expected result because QS-ReSTART depends only on thetotal number of patients, and hence, the policy structure does not change with misclassificationerrors.In Study 2, we considered two cases where not all patients are available at time zero. In particular,
under the moderate-unavailability case, each patient has a probability 0.6 of being available attime zero, a probability 0.2 of being available at t = 20 minutes, and a probability 0.2 of beingavailable at t = 40 minutes. For the high-unavailability case, each patient has a probability 0.2of being available at time zero, has a probability 0.4 of being available at t= 30 minutes, and aprobability 0.4 of being available at t = 60 minutes. Initial triage is assumed to have been doneimmediately after each arrival and a retriage is carried out once all patients are available. We alsoassume a moderate overtriage probability of 0.4 and a low undertriage probability of 0.05. Thedecision maker does not have advance knowledge of how many patients there are in total and the
Mills, Argon, and Ziya: Resource-Based Patient Prioritization in Mass-Casualty Incidents
20 Manufacturing & Service Operations Management 15(3), pp. 361–377, c© 2013 INFORMS
times at which new patients are going to become available. Therefore, idling to wait for a higherpriority patient is not considered as long as there are patients in need of transport.Results on the comparison of QD-ReSTART and QS-ReSTART with START under Study 2 are
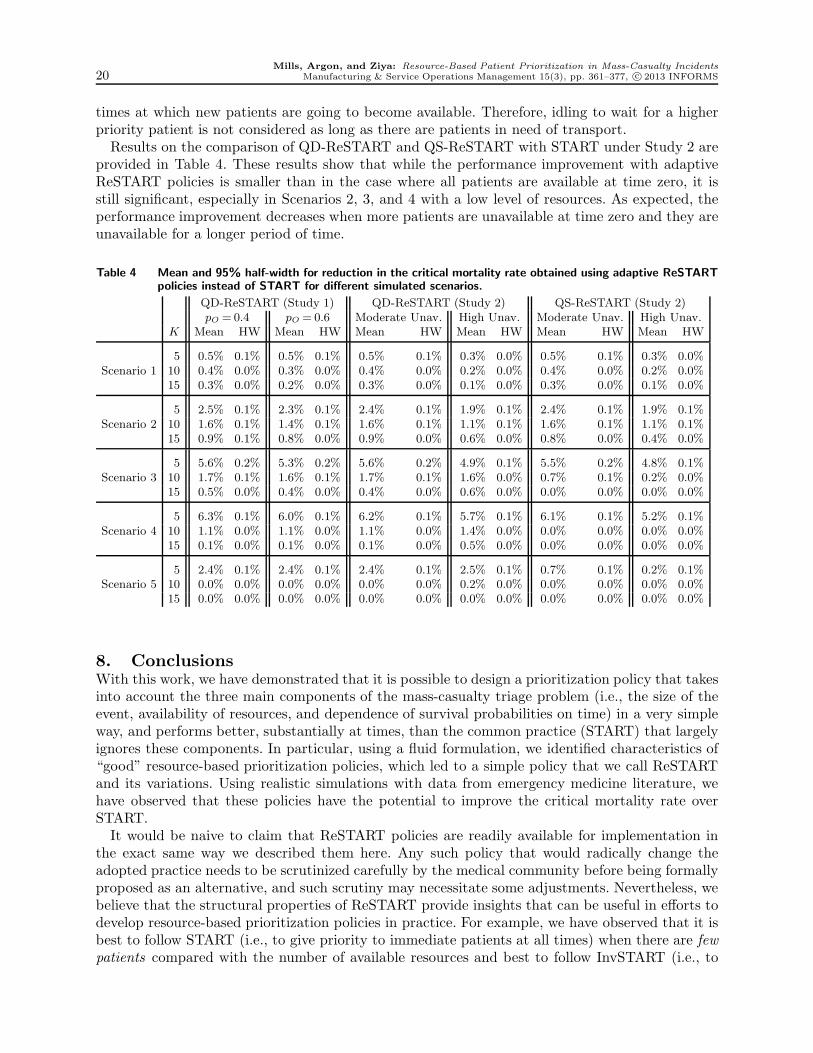
provided in Table 4. These results show that while the performance improvement with adaptiveReSTART policies is smaller than in the case where all patients are available at time zero, it isstill significant, especially in Scenarios 2, 3, and 4 with a low level of resources. As expected, theperformance improvement decreases when more patients are unavailable at time zero and they areunavailable for a longer period of time.
Table 4 Mean and 95% half-width for reduction in the critical mortality rate obtained using adaptive ReSTARTpolicies instead of START for different simulated scenarios.
QD-ReSTART (Study 1) QD-ReSTART (Study 2) QS-ReSTART (Study 2)pO =0.4 pO = 0.6 Moderate Unav. High Unav. Moderate Unav. High Unav.
K Mean HW Mean HW Mean HW Mean HW Mean HW Mean HW
5 0.5% 0.1% 0.5% 0.1% 0.5% 0.1% 0.3% 0.0% 0.5% 0.1% 0.3% 0.0%Scenario 1 10 0.4% 0.0% 0.3% 0.0% 0.4% 0.0% 0.2% 0.0% 0.4% 0.0% 0.2% 0.0%
15 0.3% 0.0% 0.2% 0.0% 0.3% 0.0% 0.1% 0.0% 0.3% 0.0% 0.1% 0.0%
5 2.5% 0.1% 2.3% 0.1% 2.4% 0.1% 1.9% 0.1% 2.4% 0.1% 1.9% 0.1%Scenario 2 10 1.6% 0.1% 1.4% 0.1% 1.6% 0.1% 1.1% 0.1% 1.6% 0.1% 1.1% 0.1%
15 0.9% 0.1% 0.8% 0.0% 0.9% 0.0% 0.6% 0.0% 0.8% 0.0% 0.4% 0.0%
5 5.6% 0.2% 5.3% 0.2% 5.6% 0.2% 4.9% 0.1% 5.5% 0.2% 4.8% 0.1%Scenario 3 10 1.7% 0.1% 1.6% 0.1% 1.7% 0.1% 1.6% 0.0% 0.7% 0.1% 0.2% 0.0%
15 0.5% 0.0% 0.4% 0.0% 0.4% 0.0% 0.6% 0.0% 0.0% 0.0% 0.0% 0.0%
5 6.3% 0.1% 6.0% 0.1% 6.2% 0.1% 5.7% 0.1% 6.1% 0.1% 5.2% 0.1%Scenario 4 10 1.1% 0.0% 1.1% 0.0% 1.1% 0.0% 1.4% 0.0% 0.0% 0.0% 0.0% 0.0%
15 0.1% 0.0% 0.1% 0.0% 0.1% 0.0% 0.5% 0.0% 0.0% 0.0% 0.0% 0.0%
5 2.4% 0.1% 2.4% 0.1% 2.4% 0.1% 2.5% 0.1% 0.7% 0.1% 0.2% 0.1%Scenario 5 10 0.0% 0.0% 0.0% 0.0% 0.0% 0.0% 0.2% 0.0% 0.0% 0.0% 0.0% 0.0%
15 0.0% 0.0% 0.0% 0.0% 0.0% 0.0% 0.0% 0.0% 0.0% 0.0% 0.0% 0.0%
8. ConclusionsWith this work, we have demonstrated that it is possible to design a prioritization policy that takesinto account the three main components of the mass-casualty triage problem (i.e., the size of theevent, availability of resources, and dependence of survival probabilities on time) in a very simpleway, and performs better, substantially at times, than the common practice (START) that largelyignores these components. In particular, using a fluid formulation, we identified characteristics of“good” resource-based prioritization policies, which led to a simple policy that we call ReSTARTand its variations. Using realistic simulations with data from emergency medicine literature, wehave observed that these policies have the potential to improve the critical mortality rate overSTART.It would be naive to claim that ReSTART policies are readily available for implementation in
the exact same way we described them here. Any such policy that would radically change theadopted practice needs to be scrutinized carefully by the medical community before being formallyproposed as an alternative, and such scrutiny may necessitate some adjustments. Nevertheless, webelieve that the structural properties of ReSTART provide insights that can be useful in efforts todevelop resource-based prioritization policies in practice. For example, we have observed that it isbest to follow START (i.e., to give priority to immediate patients at all times) when there are fewpatients compared with the number of available resources and best to follow InvSTART (i.e., to
Mills, Argon, and Ziya: Resource-Based Patient Prioritization in Mass-Casualty Incidents
Manufacturing & Service Operations Management 15(3), pp. 361–377, c© 2013 INFORMS 21
give priority to delayed patients at all times) when there are many delayed patients. Otherwise, itis best to use a policy that prioritizes immediate patients initially but switches to delayed patientsat some point in time. ReSTART gives a precise description of this structure by quantifying whatfew patients, many delayed patients, and some point in time really mean. Even if practitioners donot follow this description exactly, they can still build another policy having a structure that issimilar to that of ReSTART, perhaps by coming up with new definitions for what it means tohave few patients or many delayed patients. In short, our analytical characterization can providea broad outline for the type of policy that is expected to work well in practice.
ReferencesArgon, N.T., J.E. Winslow, S. Ziya. 2011. Triage in the aftermath of mass-casualty incidents. J. J. Cochran,
L. A. Cox, P. Keskinocak, J. P. Kharoufeh, J. C. Smith, eds.,Wiley Encyclopedia of Operations Researchand Management Science. Wiley, 5611–5620.
Argon, N.T., S. Ziya, R. Righter. 2008. Scheduling impatient jobs in a clearing system with insights onpatient triage in mass casualty incidents. Probability in the Engineering and Informational Sciences22 301–332.
Baker, R., M. Strosberg. 1992. Triage and equality: An historical reassessment of utilitarian analyses oftriage. Kennedy Institute of Ethics Journal 2(2) 103–123.
Cone, D.C., D.S. MacMillan. 2005. Mass-casualty triage systems: a hint of science. Academic EmergencyMedicine: Official Journal of the Society for Academic Emergency Medicine 12(8) 739–741.
Cox, D.R., D. Oakes. 1984. Analysis of survival data. CRC Press.
Frykberg, E.R. 2005. Triage: principles and practice. Scandinavian Journal of Surgery 94(4) 272–278.
Garner, A., A. Lee, K. Harrison, C.H. Schultz. 2001. Comparative analysis of multiple-casualty incidenttriage algorithms. Annals of Emergency Medicine 38(5) 541–548.
Ingolfsson, A., S. Budge, E. Erkut. 2008. Optimal ambulance location with random delays and travel times.Health Care Management Science 11(3) 262–274.
Jenkins, J.L., M.L. McCarthy, L.M. Sauer, G.B. Green, S. Stuart, T.L. Thomas, E.B. Hsu. 2008. Mass-casualty triage: time for an evidence-based approach. Prehospital and Disaster Medicine 23(1) 3–8.
Kennedy, K., R. Aghababian, L. Gans, C.P. Lewis. 1996. Triage: Techniques and applications in decision-making. Annals of Emergency Medicine 28(2) 136–144.
Lerner, E.B. 2008. Mass casualty triage: An evaluation of the data and development of a proposed nationalguideline. Disaster Medicine and Public Health Preparedness 2(1) S25–34.
Mistovich, J.J., K.J. Karren. 2007. Prehospital Emergency Care. 8th ed. Prentice Hall.
Sacco, W.J., D.M. Navin, K.E. Fiedler, R.K. Waddell II, W.B. Long, R.F. Buckman Jr. 2005. Precise formu-lation and evidence-based application of resource-constrained triage. Academic Emergency Medicine12(8) 759–770.
Sacco, W.J., D.M. Navin, R.K. Waddell, K.E. Fiedler, W.B. Long, R.F. Buckman. 2007. A new Resource-Constrained triage method applied to victims of penetrating injury. The Journal of Trauma: Injury,Infection, and Critical Care 63(2) 316–325.
Uzun Jacobson, E., N.T. Argon, S. Ziya. 2012. Priority assignment in emergency response. OperationsResearch 60(4) 813–832.
Winslow, G. R. 1982. Triage and Justice. University of California Press.
Winslow, J.E., Associate professor of emergency medicine, Wake Forest University. 2010. Personal commu-nication.