Embed Size (px)
Citation preview
Coffey Mining (SA) Pty Ltd (2006/030152/079) VAT Number (415 023 9327)
Block D, Somerset Office Estate, 604 Kudu Street, Allen’s Nek 1737 Roodepoort, South Africa www.coffey.com/mining
Resource Estimation of Tsumeb Tailings Dump, Namibia, August 2011
Prepared by Coffey Mining (SA) (Pty) Ltd on behalf of:
Weatherly International Plc
JTSU01
Coffey Mining Pty Ltd
Tsumeb dump– JTSU01 Page: i Resource Estimation of Tsumeb Tailings Dump, Namibia – August 2011
Author(s): Rachel McKinney Consultant-Geology (MSC (Geology))
Brendan Botha Exploration Manager (BSc (Hons) Geology, MSc (ESPM), MSc (MRM), Pri.Sci.Nat, MGSSA)
Janine Fleming Senior Consultant- Resources
(BSc Hons Geology, Pr.Sci.Nat, MGSSA)
Kathleen Body Principal Consultant- Resources
(BS Arts and Sciences (Geology), GDE (Mining), Pr.Sci.Nat)
Date: August 2011
Project Number: JTSU01
Version / Status: v.01 / Final
Path & File Name: F:\Projects\Projects\Weatherly International\ JTSU01-Estimation of Tsumeb dump\Roport\JTSU01-Estimation of Tsumeb dump_Final.docx
Print Date: Friday, 26 August 2011
Copies: Weatherly International Plc (2)
Coffey Mining – Johannesburg (1)
Document Change Control
Version Description (section(s) amended) Author(s) Date
Document Review and Sign Off
Author Janine Fleming
Author Rachel McKinney
Author Brendan Botha
Supervising Principal Kathleen Body
This document has been prepared for the exclusive use of Weatherly International Plc (“Client”) on the basis of instructions, information and data supplied by them. No warranty or guarantee, whether express or implied, is made by Coffey Mining with respect to the completeness or accuracy of any aspect of this document and no party, other than the Client, is authorized to or should place any reliance whatsoever on the whole or any part or parts of the document. Coffey Mining does not undertake or accept any responsibility or liability in any way whatsoever to any person or entity in respect of the whole or any part or parts of this document, or any errors in or omissions from it, whether arising from negligence or any other basis in law whatsoever.
Coffey Mining Pty Ltd
Tsumeb dump– JTSU01 Page: ii Resource Estimation of Tsumeb Tailings Dump, Namibia – August 2011
Table of Contents
EXECUTIVE SUMMARY .......................................................................................................................v
1 Introduction ................................................................................................................................7
1.1 Scope of Work.................................................................................................................7
1.2 Participants .....................................................................................................................8
1.3 Technical Report .............................................................................................................8
1.4 Disclaimer .......................................................................................................................9
1.5 Site and Technical Visits .................................................................................................9
1.6 Data Acquired .................................................................................................................9
2 Property Description ............................................................................................................... 10
2.1 Location and Access ..................................................................................................... 10
2.2 Physiography and Climate ............................................................................................ 12
2.3 Local Infrastructure and Services .................................................................................. 13
3 History ...................................................................................................................................... 13
4 Geological Setting ................................................................................................................... 14
4.1 Regional Geology .......................................................................................................... 14
4.2 Local Geology ............................................................................................................... 14
5 Mineralization ........................................................................................................................... 15
6 Data and verification ............................................................................................................... 16
6.1 Drilling ........................................................................................................................... 16
6.2 Sample Logging ............................................................................................................ 17
6.3 Sample Logging ............................................................................................................ 19
6.4 Bulk Density Measurements .......................................................................................... 19
6.5 Data Location ................................................................................................................ 19
6.6 Sample Analysis ............................................................................................................ 19
6.7 Analytical Quality Assurance and Quality Control Data ................................................. 19
7 Geological Modelling ............................................................................................................... 24
7.1 Introduction ................................................................................................................... 24
8 Statistical Analysis .................................................................................................................. 25
8.1 Introduction ................................................................................................................... 25
9 Block Model Development ...................................................................................................... 28
9.1 Introduction ................................................................................................................... 28
9.2 Block Construction Parameters ..................................................................................... 28
10 Grade Estimation ..................................................................................................................... 29
10.1 Introduction ................................................................................................................... 29
Coffey Mining Pty Ltd
Tsumeb dump– JTSU01 Page: iii Resource Estimation of Tsumeb Tailings Dump, Namibia – August 2011
10.2 Nearest Neighbour Estimate ......................................................................................... 29
11 Resource Reporting ................................................................................................................ 31
11.1 Introduction ................................................................................................................... 31
11.2 Criteria for Mineral Resource Classification ................................................................... 31
11.3 Application of Cut-off Grade and other Modifying Factors ............................................. 32
11.4 Mineral Resource Estimate Tabulation .......................................................................... 32
12 Conclusion ............................................................................................................................... 33
13 References ............................................................................................................................... 34
Coffey Mining Pty Ltd
Tsumeb dump– JTSU01 Page: iv Resource Estimation of Tsumeb Tailings Dump, Namibia – August 2011
List of Tables Table 1.1 – Mineral Resources of the Tsumeb Dump vi
Table 6.7_1 – Summary of the Number of Control Samples 21
Table 6.7_2 – Summary of Certified Reference Standards Used 22
Table 8.1_1 – Descriptive Statistics 26
Table 9.2_1 – Block Model Construction Parameters 28
Table 10.2_1 – Nearest Neighbour estimation and search parameters 29
Table 10.2_2 – Block and drillhole grade comparison 30
Table 11.2_1 – Confidence Levels of Key Criteria 31
Table 11.4_1 – Measured Mineral Resource Estimate (August 2011) 32
List of Figures
Figure 2.1_1 – Location of the Tsumeb Dump Project 10
Figure 2.1_2 – Locality of Tsumeb Dump in relation to the town of Tsumeb 11
Figure 2.1_3 – Orthographic Photo of the Tsumeb Dump 12
Figure 6,1_1 – Tailings Dump Showing Boreholehole Locations 16
Figure 6.2_1 - Sampling Procedure 18
Figure 8.1_1 – Histograms of distributions 27
List of Appendices
Appendix A – Level Plans and Cross Sections of Copper Distribution in the Tsumeb Dump
Appendix B – Level Plans Of Copper Leached Distribution in the Tsumeb Dump
Appendix C – QAQC Plots

Coffey Mining Pty Ltd
Tsumeb dump– JTSU01 Page: v Resource Estimation of Tsumeb Tailings Dump, Namibia – August 2011
EXECUTIVE SUMMARY
Coffey Mining (SA) (Pty) Ltd was requested by Weatherly International Plc to complete a Mineral
Resource estimation of the Tailing Dump of the closed Tsumeb Copper Mine in Namibia. Reporting
was requested to conform to ‘Australasian Code for Reporting of Exploration Results, Mineral
Resources and Ore Reserves’ of December 2004 (the JORC Code) as prepared by the Joint Ore
Reserves Committee of the Australasian Institute of Mining and Metallurgy, Australian Institute of
Geoscientists and Mineral Council of Australia (JORC).
The Tsumeb Tailing Dump is on the northern boundary of the town of Tsumeb in Namibia, a town well
serviced with infrastructure, i.e. sealed roads, power and municipal water and waste services. There is
also a railway line connecting Tsumeb with Walvis Bay via Windhoek.
The Tsumeb Copper Mine is a world renowned polymetalic mine that was in production for just under
100 years. During its operation it produced 30 million tonnes of ore at 4.3% copper, 10% lead, 3.5%
zinc and 95g/t silver.
The Tsumeb Dump contains the waste product from the processed ore. It was constructed with a
single inflow pipe which was moved around the perimeter of the dump as required. The dump is
essentially a compound, pod-like deposit with grades varying from one pod to another due to variations
in the beneficiation process and recovery improvements over time. The dump’s dimensions are
approximately 1000m x 1000m x15m and consist mainly of finely crushed felspathic sandstone, which
was the host rock of the mineralization within the Tsumeb Mine. The mineralization of the dump is
directly linked to the original mineralogy of the mine and the recoveries of the copper-bearing minerals
during beneficiation. The dump also contains copper oxides that were not recovered prior 1986 as well
as lead, zinc and minor amounts of silver. The mineralization in the dump and its distribution is directly
linked to the operational day-to-day variations and recoveries.
A total of 112 auger boreholes were drilled by Dump & Dune who are specialists in drilling tailings and
other waste dumps. Samples were taken every meter and a half and sent to Bureau Veritas Laboratory
in Swakopmund for analysis and copper solubility. For the drilling and analysis a full quality control
program was establish to ensure the accuracy of the data collected. The referee samples sent to ALS
Chemex in Johannesburg did reveal some issues regarding the original analysis. The queries
regarding the referee results have not been resolved however these only involve the copper leach
assays which have not been used in the mineral resource estimation.
Statistical analysis of the borehole data that sufficient data was collected to have confidence in the
distribution of the various elements within the dump
A 3D model was created with survey data received from Namibian Custom Smelters for upper surface
and the base as interpreted from borehole logs. Due to the podlike nature of the mineralization, the
nearest neighbour estimation method was deemed most appropriate. The block model was constructed
such that not more than one sample was represented in a block. The tonnes calculated from the block
Coffey Mining Pty Ltd
Tsumeb dump– JTSU01 Page: vi Resource Estimation of Tsumeb Tailings Dump, Namibia – August 2011
model are based on densities obtained using on sand replacement tests. The density determined from
the samples taken is 1.4g/m2.
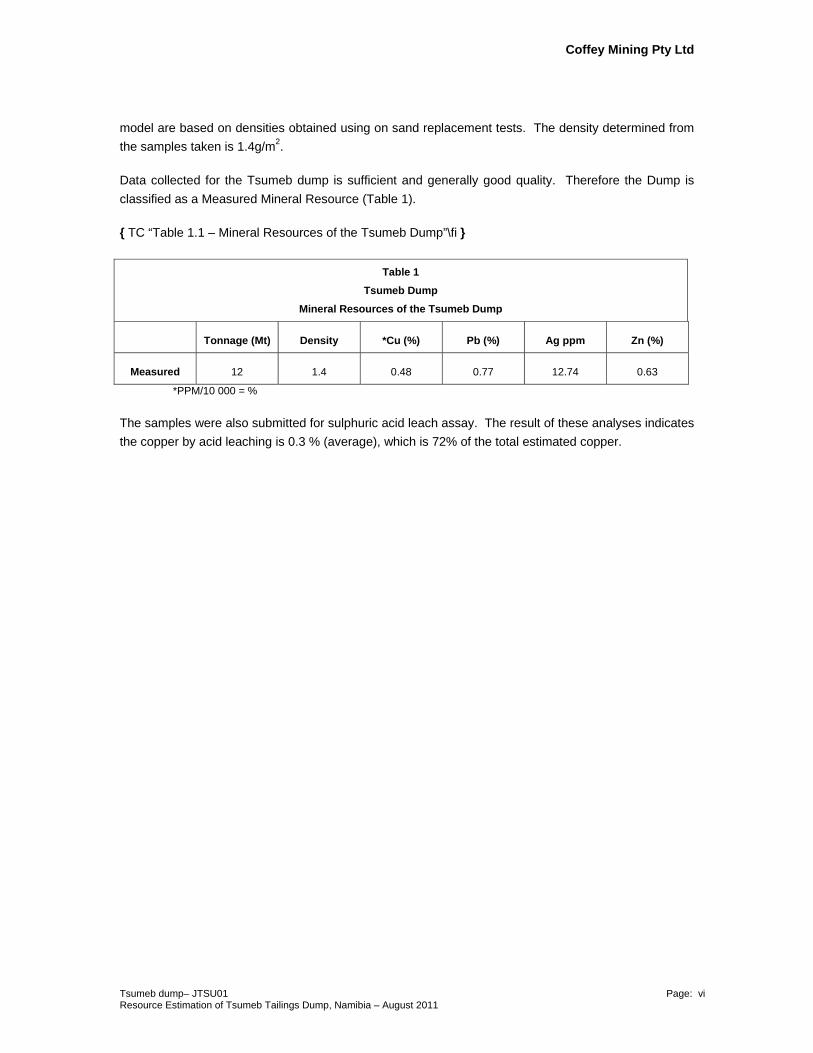
Data collected for the Tsumeb dump is sufficient and generally good quality. Therefore the Dump is
classified as a Measured Mineral Resource (Table 1).
{ TC “Table 1.1 – Mineral Resources of the Tsumeb Dump”\fi }
Table 1
Tsumeb Dump
Mineral Resources of the Tsumeb Dump
Tonnage (Mt) Density *Cu (%) Pb (%) Ag ppm Zn (%)
Measured 12 1.4 0.48 0.77 12.74 0.63
*PPM/10 000 = %
The samples were also submitted for sulphuric acid leach assay. The result of these analyses indicates
the copper by acid leaching is 0.3 % (average), which is 72% of the total estimated copper.
Tsumeb dump– JTSU01 Page: 7 Resource Estimation of Tsumeb Tailings Dump, Namibia – August 2011
1 INTRODUCTION
1.1 Scope of Work
Coffey Mining (SA) (Pty) Ltd (Coffey Mining) was requested by Weatherly International Plc
(Weatherly) to complete an estimation of the mineral resources on the Tsumeb Mine
Tailings Dump (Tsumeb Dump) at Tsumeb in Namibia.
Collectively Coffey Mining was commissioned to carry out the following activities for the
resource estimation study of the Tsumeb Dump:
Three dimensional modelling of the dump volume.
Quality Assurance and Quality Control (QA/QC) of assay laboratory.
Database generation, review and validation.
Statistical analysis.
Block model construction.
Completion and validation of the mineral resource estimate based on data obtained
during this phase of drilling. The elements to be estimated are Copper (Cu), Lead (Pb),
Zinc (Zn) and Silver (Ag), as well as contaminant elements Arsenic (As), Bismuth (Bi),
Cadmium (Cd), Mercury (Hg) and Sulphur (S).
Compilation of a JORC compliant report.
The report describes the methods used to define the mineral resource as well as the result
of the mineral resource estimation. The report also states the criteria used to classify the
mineral resources. It is understood that this report will be used for stock exchange reporting
purposes.

Tsumeb dump– JTSU01 Page: 8 Resource Estimation of Tsumeb Tailings Dump, Namibia – August 2011
1.2 Participants
The participants consist of a number of technical experts brought together by Coffey Mining
to complete the mineral resource estimate. The participants in the review and their
individual areas of responsibility are listed as follows:-
Rachel McKinney, Coffey Mining - : Consultant
MSc Geology
Site visits, QA/QC, data collection, report preparation
Janine Fleming, Coffey Mining - : Senior Consultant – Resources
(BSc (Hons) Geology , MGSSA, Pr.Sci.Nat)
Geological interpretations, mineral resource estimation, report preparation.
Brendan Botha, Coffey Mining - : Senior Consultant - Exploration
(BSc (Hons) Geology, MSc (Earth Science and Project Management), MSc (Mineral
Resource Management), Pr.Sci.Nat., MGSSA)
Project Management, report preparation
Kathleen Body, Coffey Mining - : Principal Consultant - Resources
(BS Arts and Sciences (Geology), GDE (Mining), Pr.Sci.Nat)
Peer Review, and Competent Person
Neither Coffey Mining, nor the key personnel nominated for the work, has any material
interest in Weatherly. The work, and any other work done by Coffey Mining for Weatherly, is
strictly in return for professional fees. Payment for the work is not in any way dependent on
the outcome of the work or on the success or otherwise of Weatherly’s own business
dealings. As such there is no conflict of interest in Coffey Mining undertaking the
independent mineral resource estimate as contained in this document.
1.3 Technical Report
The report has been compiled under the guidelines of the ‘Australasian Code for Reporting
of Exploration Results, Mineral Resources and Ore Reserves’ of December 2004 (the
JORC Code) as prepared by the Joint Ore Reserves Committee of the Australasian Institute
of Mining and Metallurgy, Australian Institute of Geoscientists and Mineral Council of
Australia (JORC).
This report is also compliant with the South African Code for Reporting of Mineral
Resources and Mineral Reserves (SAMREC Code) of 2007, prepared by The South African
Mineral Resource Committee (SAMREC) under the auspices of The South African Institute
of Mining And Metallurgy (SAIMM). The Competent person for the purposes of this report is
Kathleen Body who has supervized all aspects of the work reported. She is a registered
Professional Natural Scientist (Pr.Sci.Nat.) in terms of the Natural Scientific Professions Act
(Act 27 of 2003) and is a “Competent Person” as defined in the JORC and SAMREC Codes.
Kathleen Body is a full-time employee of Coffey Mining and has sufficient experience which
is relevant to the style of mineralization and type of deposit under consideration and to the
Tsumeb dump– JTSU01 Page: 9 Resource Estimation of Tsumeb Tailings Dump, Namibia – August 2011
activity which she is undertaking to qualify as a Competent Person as defined in the 2004
Edition of the ‘Australasian Code for Reporting of Exploration Results, Mineral Resources
and Ore Reserves’ and the South African Code for Reporting of Mineral Resources and
Mineral Reserves (SAMREC Code) of 2007. Kathleen Body consents to the inclusion in the
report of the matters based on her information in the form and context in which it appears.
1.4 Disclaimer
Coffey Mining has based its mineral resource estimate for the Tsumeb Dump on information
largely provided by Weatherly. This data includes third party technical reports along with
other relevant published and unpublished third party information. Coffey Mining has
endeavoured by making all reasonable enquiries to confirm the authenticity and
completeness of the third party technical data upon which this report is based. A final draft
of this report was provided to Weatherly, along with a written request to identify any material
errors or omissions, prior to finalisation.
Neither Coffey Mining, nor the authors of this report, are qualified to provide extensive
comment on legal facets associated with ownership and other rights pertaining to the
Tsumeb Dump.
No warranty or guarantee, be it express or implied, is made by Coffey Mining with respect to
the completeness or accuracy of the legal, environmental, metallurgical, mineral processing
or mineral resource estimate information contained in third party reports. While Coffey
Mining has reviewed such third party reports and relied on certain aspects of such reports in
reaching its conclusions herein, neither Coffey Mining nor the authors of this report accept
any responsibility or liability in any way whatsoever to any person or entity in respect of
information contained in such third party reports and documents and included in this
document, or any errors in or omissions from it, whether arising from negligence or any
other basis in law whatsoever.
1.5 Site and Technical Visits
A site visit was conducted by Mrs Rachel McKinney on 18 March 2011. The intention of the
site visit was to identify the property, understand its location and local infrastructure,
establish the nature of the exploration undertaken and confirm the positions of a selected
number of boreholes. In addition it was possible to verify the logging and sampling
procedures and confirm the quality of the exploration. A site visit to the laboratory, Bureau
Veritas, in Swakopmund Namibia, where the initial assays were to take place, was done
concurrently (17 March 2011). This visit was intended to assess laboratory operating
procedures, formal QA/QC procedures and capabilities.
1.6 Data Acquired
The data and information made available to Coffey Mining by Weatherly consisted of
electronic and hardcopies of geological data (collar coordinates, geological logs, assay data)
generated from the current drilling phase and surveyed topography files of the dump
surface. This data formed the basis from which the mineral resource estimation could be
completed.
Tsumeb dump JTSU01 Page: 10
2 PROPERTY DESCRIPTION
2.1 Location and Access
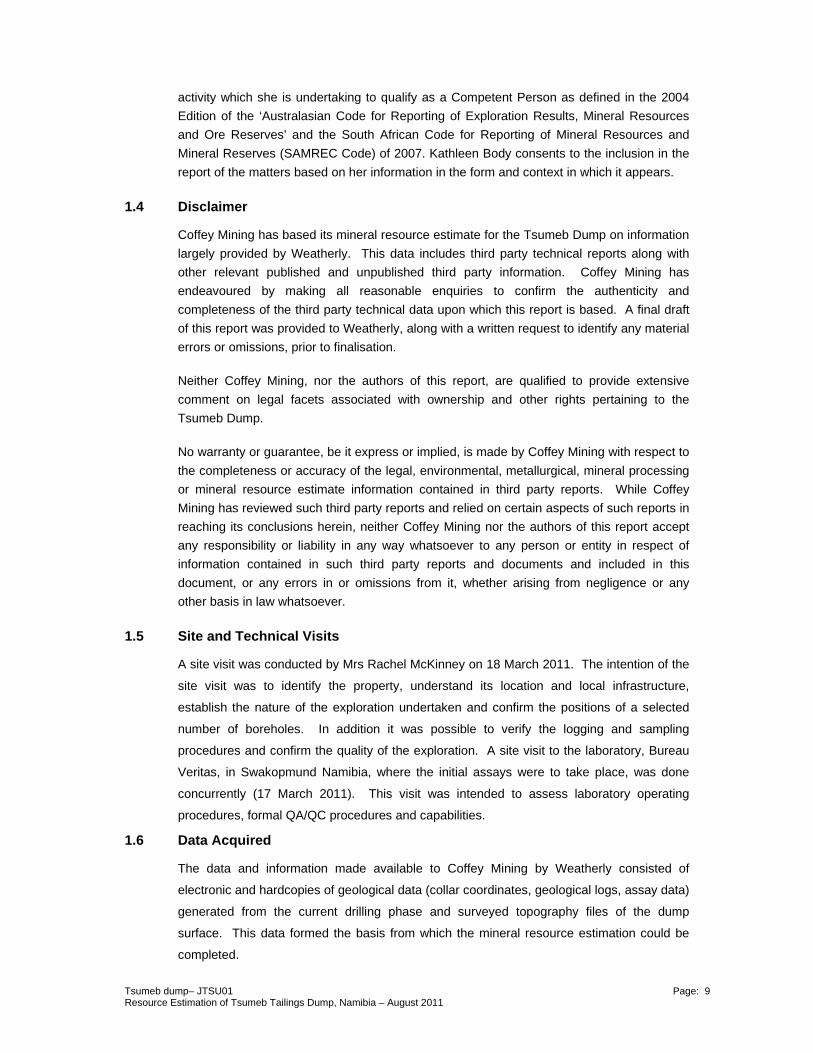
The Tsumeb Copper Mine, and its associated tailings dump, is located on the northern
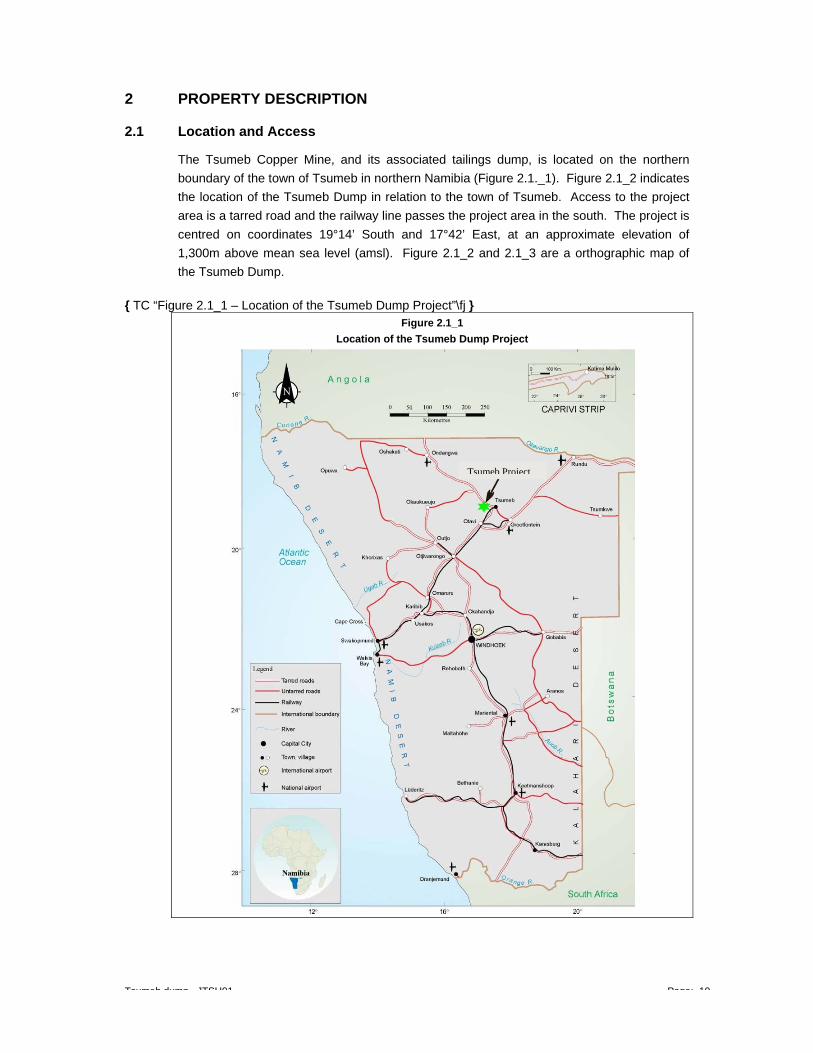
boundary of the town of Tsumeb in northern Namibia (Figure 2.1._1). Figure 2.1_2 indicates
the location of the Tsumeb Dump in relation to the town of Tsumeb. Access to the project
area is a tarred road and the railway line passes the project area in the south. The project is
centred on coordinates 19°14’ South and 17°42’ East, at an approximate elevation of
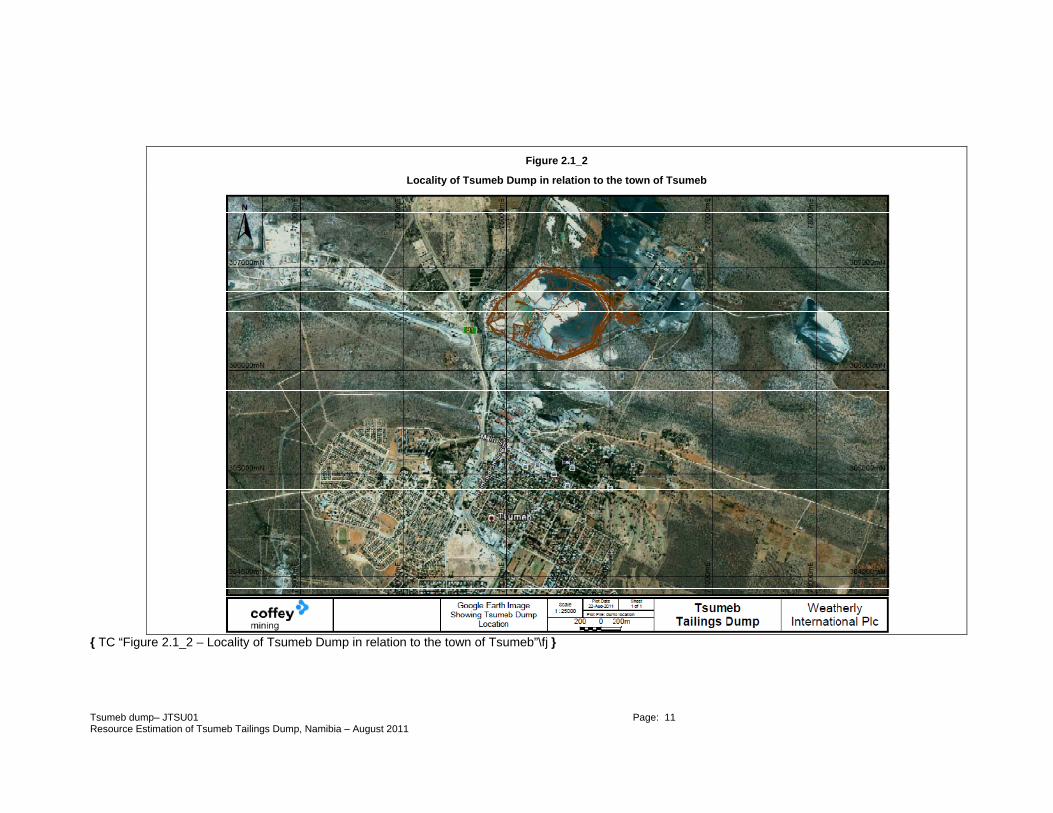
1,300m above mean sea level (amsl). Figure 2.1_2 and 2.1_3 are a orthographic map of
the Tsumeb Dump.
{ TC “Figure 2.1_1 – Location of the Tsumeb Dump Project”\fj } Figure 2.1_1
Location of the Tsumeb Dump Project
Tsumeb Project
Tsumeb dump– JTSU01 Page: 11 Resource Estimation of Tsumeb Tailings Dump, Namibia – August 2011
Figure 2.1_2
Locality of Tsumeb Dump in relation to the town of Tsumeb
{ TC “Figure 2.1_2 – Locality of Tsumeb Dump in relation to the town of Tsumeb”\fj }
Tsumeb dump– JTSU01 Page: 12 Resource Estimation of Tsumeb Tailings Dump, Namibia – August 2011
Figure 2.1_3
Orthographic Photo of the Tsumeb Dump
{ TC “Figure 2.1_3 – Orthographic Photo of the Tsumeb Dump”\fj }
2.2 Physiography and Climate
The Tsumeb area is semi arid, with an average annual rainfall of 572mm, falling mainly from
December to April. However, rainfall is highly variable, and multiyear droughts are common.
The climate is sub-tropical, with mean summer temperatures averaging 35°C, and mean
winter temperatures average around 10°C. Field conditions are such that it is possible to
work all year round; poor weather conditions rarely disrupt exploration or mining operations.
Tsumeb is situated on the northern fringe of the Otavi Mountain land, a highland region that
extends approximately 100km east-west and 75km north-south. At the mine the landscape
is dominated by low hills. The Tsumeb Project area lies on a flat plain sandwiched between
low lying dolomitic hills both to the southern and northern sides.
The soil type is closely related to the bedrock lithology. Over the sandstone plain is a thin
red-brown sandy soil, overlying one to 10m of white calcrete. Below this calcrete are the
arenaceous sandstones of the Mulden Group. The dolomite hills are covered by a thin layer
of dark brown sandy soil, with abundant chert boulder rubble.
The vegetation in the plain is dominantly low bushland, comprised of Acacia and
Dichrostachys species, interspersed with open grassland. On the hills there is a more
diverse range of tree cover. The water table is at approximately 70 – 80m below surface.
The main land use activity in the area is cattle farming with minor game farming.

Tsumeb dump– JTSU01 Page: 13 Resource Estimation of Tsumeb Tailings Dump, Namibia – August 2011
2.3 Local Infrastructure and Services
The Tsumeb Dump lies almost adjacent to the major tarred road that links Tsumeb to
Etosha and Angola to the north. There is an electrical power line located on the project site.
The railway linking Tsumeb to Walvis Bay and Windhoek passes directly south of the
Tsumeb Dump.
Skilled labour and most services are available in Tsumeb, and Namibia has a well
established mining industry. Tsumeb serves as a base for providing a full range of urban
amenities, including medical and educational facilities, financial, retail and commercial
services. Tsumeb is a major tourist destination, thanks to the proximity of Etosha National
Park. Modern hotels, lodges, shops and restaurants are able to provide most services.
Telephone and mobile phone services are reliable, as are the high-speed internet facilities.
3 HISTORY
The Tsumeb Copper Mine is a world renowned copper deposit that was operational for just
under 100 years. In this period the mine changed ownership various times, up to its closure
in 1998.
Tsumeb Mine produced approximately 10 000t of copper and 20 000t of lead per annum
and during the period from 1954 to 1963 a germanium-enriched zinc concentrate was
produced (0.2 to 0.5% germanium).
The Tsumeb Dump, which was built-up from tailings fed from the flotation plant, comprises
finely crushed host rock with copper bearing minerals that were not recovered during the
beneficiation process. Not all of the tailings from the flotation plant were deposited on the
Tsumeb Dump. A large percentage was also used to produce cemented backfill for the
mine.
The beneficiation process was primarily by differential flotation up to 1987; thereafter a
gravity plant was installed to recover some oxides that did not react to flotation. This would
have caused a decrease in the copper bearing minerals in the Tsumeb Dump.
The total recorded production when the mine closed in 1998 was approximately 30Mt with
an average grade of 10% lead, 4.3% copper, 3.5% zinc and 95g/t silver (Maiden and
Hughes, 2000).
Tsumeb dump– JTSU01 Page: 14 Resource Estimation of Tsumeb Tailings Dump, Namibia – August 2011
4 GEOLOGICAL SETTING
4.1 Regional Geology
The Tsumeb Copper deposit is located within the Otavi Group, which is the northern
boundary of the Damara Belt. The Otavi Group represents the miogeosyncline sediments
on the boundary of the orthogeosyncline where stable tectonic processes existed and is
dominated by dolomite and limestone.
The neighbouring, central Damara depositional environment represents eugeosyncilal
facies. This eugeosyncline facies was subjected to more intense tectonic activities than the
Otavi Group and formed a central tectonic mountain range.
The Otavi Group sediments are followed by the Mulden Group sediments. These sediments
are syntectonic and were deposited around and within the central Damara geosynclines
tectonic mountain ranges. The Mulden Group consists predominantly of arkose,
conglomerate, felspathic sandstone, phyllite and limestone.
4.2 Local Geology
The Tsumeb Dump is a man-made structure and not formed by geological processes. The
dump was built up by means of a single inlet pipe that was moved at regular intervals
around the perimeter of the dump. The dump is essentially a compound, pod-like deposit
with grades varying from one pod to another due to variations in the beneficiation process
and recovery improvements over time.
The structure of the deposit is directly related to the type of material (host rock) that was
mined and the fluctuations in the beneficiation process. There were also intermittent
deposits of smelter dust deposited on the dump. This direct dependency on the efficiency of
the plant and the smelter dust quality contributes to the vertical variation of the deposit, with
regards to grades and mineralization.
The main copper mineral mined at the Tsumeb Copper Mine was tennantite; therefore the
majority of minerals in the dump should be tennantite and the secondary oxides that did not
react to flotation up to 1986.
The dump’s dimensions are approximately 1000m x 1000m x 15m high, consisting of mostly
finely crushed felspathic sandstone.
Tsumeb dump– JTSU01 Page: 15 Resource Estimation of Tsumeb Tailings Dump, Namibia – August 2011
5 MINERALIZATION
The Tumeb Mine is one of the most spectacular and complex base metal deposits in the
world however; the mineralization of the Tsumeb Dump is not well understood as it was
primarily a waste dump for the flotation circuit. The mineralization should correspond with
the mineralization of the original Tsumeb orebody less the economic portion. Cu solubility
results indicate that a large portion of the Dump’s copper mineralization occurs in oxide form
(72% solubility). There is also associated lead, silver and zinc.
Tsumeb dump– JTSU01 Page: 16 Resource Estimation of Tsumeb Tailings Dump, Namibia – August 2011
6 DATA AND VERIFICATION
6.1 Drilling
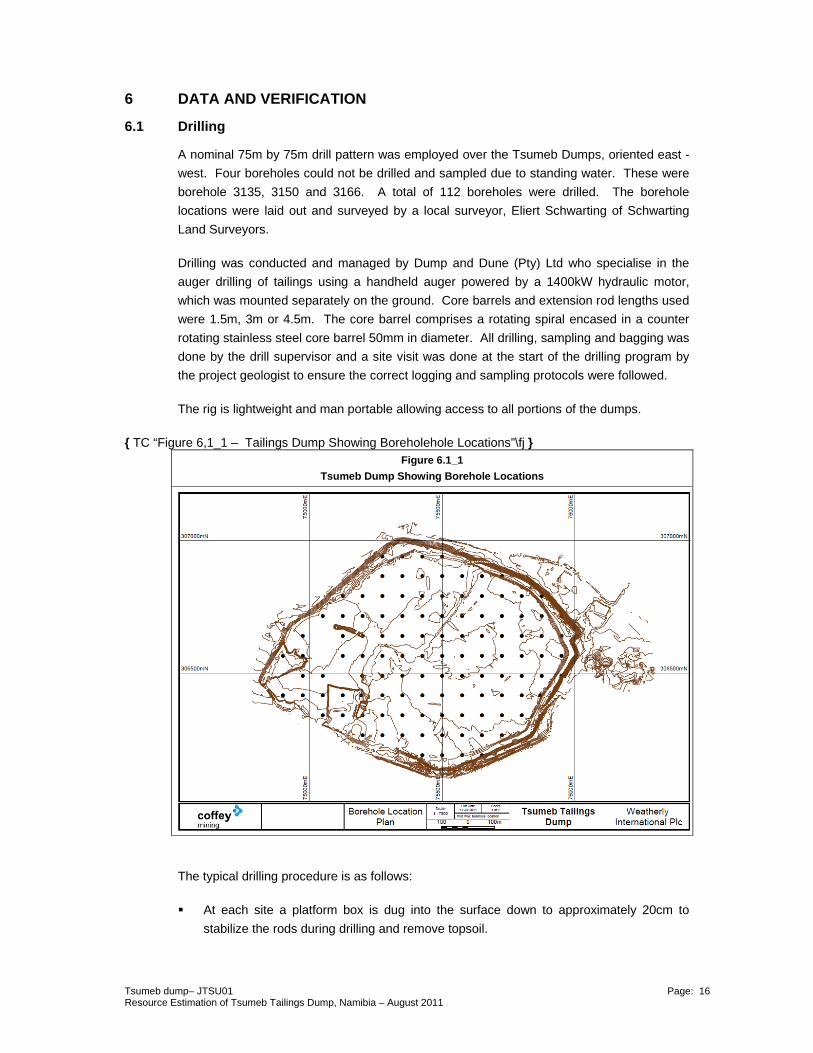
A nominal 75m by 75m drill pattern was employed over the Tsumeb Dumps, oriented east -
west. Four boreholes could not be drilled and sampled due to standing water. These were
borehole 3135, 3150 and 3166. A total of 112 boreholes were drilled. The borehole
locations were laid out and surveyed by a local surveyor, Eliert Schwarting of Schwarting
Land Surveyors.
Drilling was conducted and managed by Dump and Dune (Pty) Ltd who specialise in the
auger drilling of tailings using a handheld auger powered by a 1400kW hydraulic motor,
which was mounted separately on the ground. Core barrels and extension rod lengths used
were 1.5m, 3m or 4.5m. The core barrel comprises a rotating spiral encased in a counter
rotating stainless steel core barrel 50mm in diameter. All drilling, sampling and bagging was
done by the drill supervisor and a site visit was done at the start of the drilling program by
the project geologist to ensure the correct logging and sampling protocols were followed.
The rig is lightweight and man portable allowing access to all portions of the dumps.
{ TC “Figure 6,1_1 – Tailings Dump Showing Boreholehole Locations”\fj } Figure 6.1_1
Tsumeb Dump Showing Borehole Locations
The typical drilling procedure is as follows:
At each site a platform box is dug into the surface down to approximately 20cm to
stabilize the rods during drilling and remove topsoil.
Tsumeb dump– JTSU01 Page: 17 Resource Estimation of Tsumeb Tailings Dump, Namibia – August 2011
Drilling to 1.5m depth using the 1.5m core barrel. The sample is collected by extracting
the barrel and using the hydraulic motor to reverse the auger and redirect the material
into a plastic sample bag. This will typically happen in two to three stages as the entire
1.5m sample cannot fit into the core barrel due to volume taken up by the spiral within.
The 3m core barrel is then used mostly in two stages for the same reason stated
above. The second 1.5m sample increment is collected from the 3m core barrel.
There after the 4.5m core barrel is inserted. This will produce the third 1.5m sample.
On top of the 4.5m core barrel, the 1.5m extension rod is attached, then the 3m
extension, thereafter the 4.5m extension and so on to continue advancement at 1.5m
increments.
Depth to end of tailings could not be determined accurately as the exact point of bottom
intersection is not known unless bedrock was encountered. If soil was penetrated the exact
depth of soil could not be calculated due to material expansion in the auger and unknown
loss from the base of the auger on withdrawal. Depth estimations were made according to
the amount of material in the bags after separating tailings and sub soil. Accuracy is
estimated at better than 0.5m.
All holes were drilled to underlying soil or bedrock.
6.2 Sample Logging
The first two 1.5m samples, i.e. down to 3m depth, were collected by laying the rods
horizontally on trestles and reversing the motor to discharge the samples directly into plastic
bags. The auger was then removed from the outer sleeve over a length of 150mm PVC
pipe that had been cut in half lengthwise, and cleaned and the material added to the
sample. Material from the longer 4.5m rods was sampled manually by rotating the inner
spiral in the opposite direction with a hand crank. The first part of the sample is collected
from the nose of the core barrel, the remainder from the PVC pipe on extraction of the inner
auger as above. Sleeve, auger and pipe were cleaned with a cloth after each sample. If the
sample was wet then water was used to clean. All reasonable measures were taken to
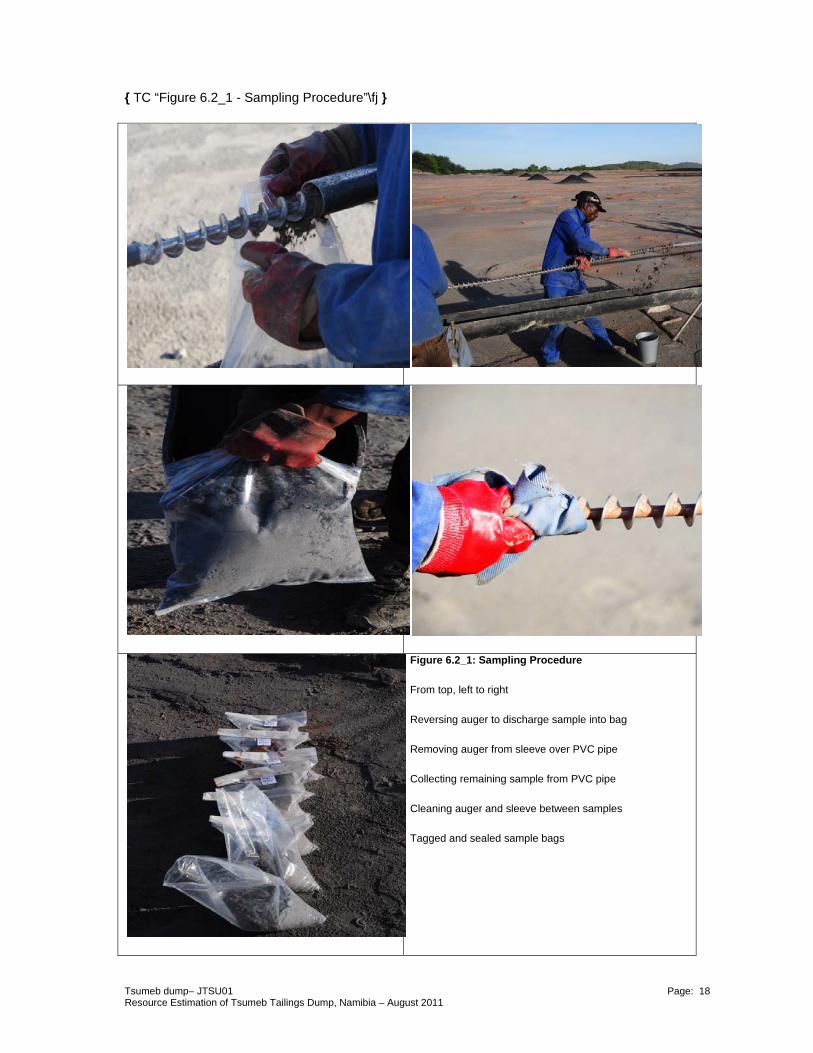
ensure full sample recovery (Figure 6.2_1).
Each sample was given a unique sample number. The soil in the final run was given an
estimated depth in the log and bagged separately to the dump material. The soil sample
was then placed inside the bag containing the last dump sample and both samples were
assigned the same ticket number. The laboratory was instructed to give a suffix A to the
sample number for the dump material and a suffix B to the soil to differentiate between the
two. Where an impenetrable bottom was encountered it was noted in the log.
A sample ticket printed with the sample number was placed in the sample bag and a second
ticket with the same number was stapled into the fold at the top of the bag. Bags were
sealed within a half hour of sample extraction.
Samples were stored until transported in a closed vehicle to Bureau Veritas Laboratory in
Swakopmund, for moisture analysis, screening, drying and splitting off of representative
portions for chemical analysis.
Tsumeb dump– JTSU01 Page: 18 Resource Estimation of Tsumeb Tailings Dump, Namibia – August 2011
{ TC “Figure 6.2_1 - Sampling Procedure”\fj }
Figure 6.2_1: Sampling Procedure
From top, left to right
Reversing auger to discharge sample into bag
Removing auger from sleeve over PVC pipe
Collecting remaining sample from PVC pipe
Cleaning auger and sleeve between samples
Tagged and sealed sample bags
Tsumeb dump– JTSU01 Page: 19 Resource Estimation of Tsumeb Tailings Dump, Namibia – August 2011
6.3 Sample Logging
Tailings samples were logged by Dump and Dune in a very simple manner. Only the From
depth, To depth, and colour of the sample was noted on the logging sheet. Also if the
sample was particularly wet it was noted in the comments
Where subsoil was penetrated this was merely logged as soil and the colour mentioned.
The logs were entered into a Excel spreadsheet and a database compiled for geological
modelling purposes.
6.4 Bulk Density Measurements
A total of six surface bulk density samples were taken from the dumps. The sampling
methodology used to determine the density of the tailings material was to clear an area of
topsoil/organic matter and dig a square pit 0.5 m by 0.5m and 0.5 m deep. The sides are
finished off vertical and as smooth as possible.
Material excavated was carefully bagged into multiple bags and sent to the laboratory and
weighed to produce a wet weight. The material was then oven dried at 750C for 12 hours
and re-weighed to provide moisture estimation and from this an in situ dry bulk density was
calculated.
6.5 Data Location
All borehole collars were laid out and accurately surveyed by a local surveyor Eliert
Schwarting of Schwarting Land Surveyors, and the holes drilled right next to the surveyed
pegs. Namibian Custom Smelters which is located adjacent to the Tsumeb Dump had
conducted a DTM survey over the area which they released for use in order to model the top
surface of the dump.
6.6 Sample Analysis
All drill samples were collected from site and transported to Bureau Veritas Mineral
Laboratories in Swakopmund for analysis. Bureau Veritas Namibia is still awaiting final
accreditation but analysis is conducted following procedures based on ISO 9001 Quality
Management Systems and ISO 17025 accreditation.
The samples were first dried, de-lumped and riffle split to yield approximately 2.5kg before
being pulverized to 95% <75µ. The remaining sample was then stored to be composited at
a later date by the client. Once pulverized a 100g split was sent for wet chemistry and ICP.
A 0.25g sample was taken for each of a 4-acid digest and sulphuric acid leach (5% H2SO4
and 0.1% Supafloc) with ICP-OES and ICP-MS finish. The main elements of interest were
copper, lead, zinc and silver.
6.7 Analytical Quality Assurance and Quality Control Data
A comprehensive quality assurance and quality control (QA/QC) programme was
undertaken. The QA/QC programme identifies various aspects of the results that could
have negatively influenced the subsequent resource estimate. It was possible to identify
Tsumeb dump– JTSU01 Page: 20 Resource Estimation of Tsumeb Tailings Dump, Namibia – August 2011
samples that had been swapped, missing samples, and incorrect labelling amongst other
aspects.
The QA/QC aims to confirm both the precision and accuracy of the laboratory and thereby
confirm that the data used is of a sufficient quality for the mineral resource estimate.
The control samples used comprised of two different standards, a blank and a duplicate
within every 20 samples submitted. The intended aim was 5% coverage for each of the
control sample types. Further control on data integrity was achieved through submittal of
pulps to a referee laboratory (ALS Chemex, Johannesburg). The quality control data was
analysed on an on-going basis and generated some queries with the laboratory. The results
are presented in Appendix C.
Definition of terms related to the QA/QC protocols applied and subsequent evaluations are
provided below:
A standard is a reference sample with a known (statistically) element abundance and
standard deviation (certified independently). Reference standards are used to gauge the
accuracy of analytical reporting by comparing the pre-determined values to those reported
by the analytical laboratory used during an exploration project.
A blank is a standard with abundance of the element of interest below the level of detection
of the analytical technique (certified independently).
A duplicate is the split of a sample taken at a particular stage of the sampling process; e.g.
Field Duplicate.
The precision and accuracy will be discussed in terms of the following statistical measures
routinely applied by Coffey Mining.
Thompson and Howarth Plot showing the mean relative percentage error of
grouped assay pairs across the entire grade range, used to visualize precision
levels by comparing against given control lines.
Rank HARD Plot, which ranks all assay pairs in terms of precision levels measured
as half of the absolute relative difference from the mean of the assay pairs (HARD),
used to visualize relative precision levels and to determine the percentage of the
assay pairs population occurring at a certain precision level.
Mean vs HARD Plot, used as another way of illustrating relative precision levels by
showing the range of HARD over the grade range.
Mean vs HRD Plot is similar to the above, but the sign is retained, thus allowing
negative or positive differences to be computed. This plot gives an overall
impression of precision and also shows whether or not there is significant bias
between the assay pairs by illustrating the mean percent half relative difference
between the assay pairs (mean HRD).
Tsumeb dump– JTSU01 Page: 21 Resource Estimation of Tsumeb Tailings Dump, Namibia – August 2011
Correlation Plot is a simple plot of the value of assay 1 against assay 2. This plot
allows an overall visualisation of precision and bias over selected grade ranges.
Correlation coefficients are also used.
Quantile-Quantile (Q-Q) Plot is a means where the marginal distributions of two
datasets can be compared. Similar distributions should be noted if the data is
unbiased.
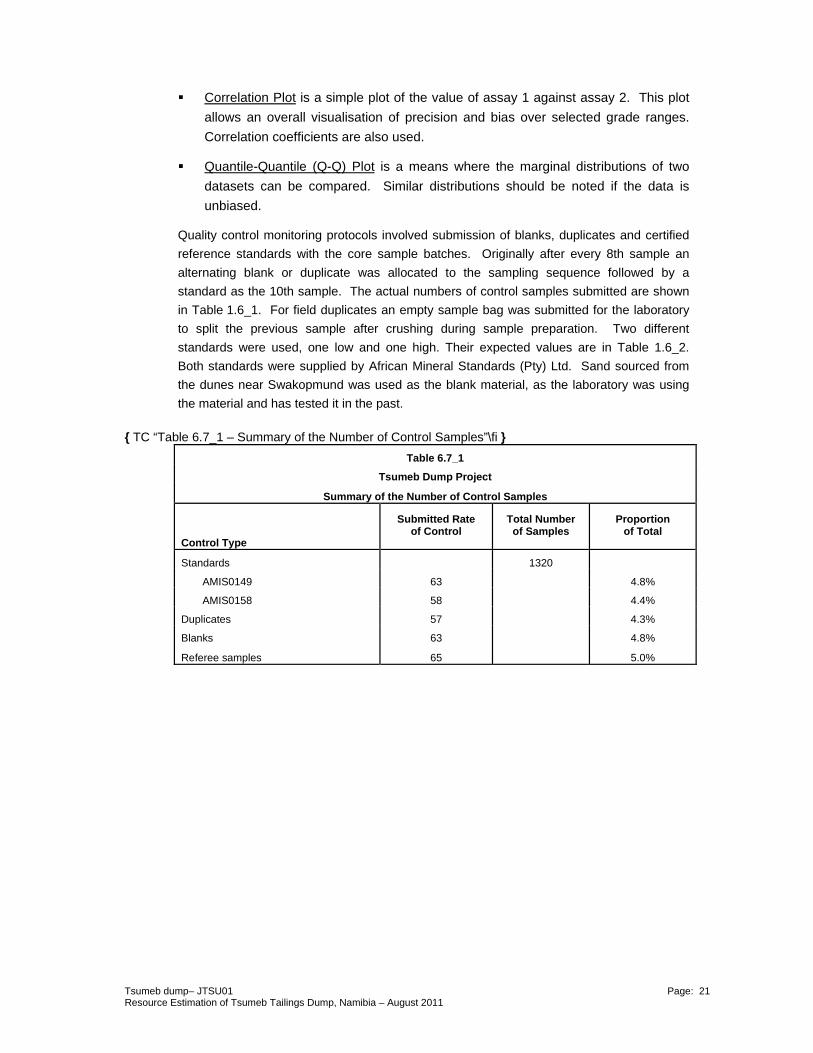
Quality control monitoring protocols involved submission of blanks, duplicates and certified
reference standards with the core sample batches. Originally after every 8th sample an
alternating blank or duplicate was allocated to the sampling sequence followed by a
standard as the 10th sample. The actual numbers of control samples submitted are shown
in Table 1.6_1. For field duplicates an empty sample bag was submitted for the laboratory
to split the previous sample after crushing during sample preparation. Two different
standards were used, one low and one high. Their expected values are in Table 1.6_2.
Both standards were supplied by African Mineral Standards (Pty) Ltd. Sand sourced from
the dunes near Swakopmund was used as the blank material, as the laboratory was using
the material and has tested it in the past.
{ TC “Table 6.7_1 – Summary of the Number of Control Samples”\fi }
Table 6.7_1
Tsumeb Dump Project
Summary of the Number of Control Samples
Control Type
Submitted Rate of Control
Total Number of Samples
Proportion of Total
Standards 1320
AMIS0149 63 4.8%
AMIS0158 58 4.4%
Duplicates 57 4.3%
Blanks 63 4.8%
Referee samples 65 5.0%
Tsumeb dump– JTSU01 Page: 22 Resource Estimation of Tsumeb Tailings Dump, Namibia – August 2011
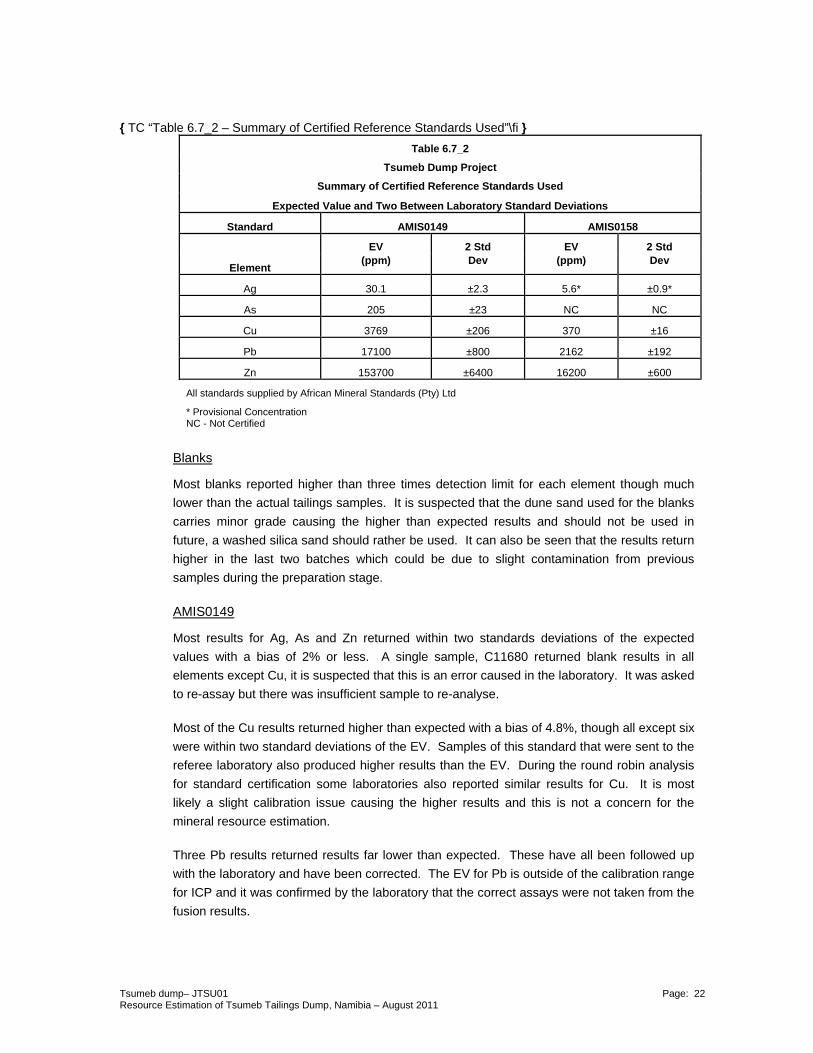
{ TC “Table 6.7_2 – Summary of Certified Reference Standards Used”\fi }
Table 6.7_2
Tsumeb Dump Project
Summary of Certified Reference Standards Used
Expected Value and Two Between Laboratory Standard Deviations
Standard AMIS0149 AMIS0158
Element
EV 2 Std EV 2 Std (ppm) Dev (ppm) Dev
Ag 30.1 ±2.3 5.6* ±0.9*
As 205 ±23 NC NC
Cu 3769 ±206 370 ±16
Pb 17100 ±800 2162 ±192
Zn 153700 ±6400 16200 ±600
All standards supplied by African Mineral Standards (Pty) Ltd
* Provisional Concentration NC - Not Certified
Blanks
Most blanks reported higher than three times detection limit for each element though much
lower than the actual tailings samples. It is suspected that the dune sand used for the blanks
carries minor grade causing the higher than expected results and should not be used in
future, a washed silica sand should rather be used. It can also be seen that the results return
higher in the last two batches which could be due to slight contamination from previous
samples during the preparation stage.
AMIS0149
Most results for Ag, As and Zn returned within two standards deviations of the expected
values with a bias of 2% or less. A single sample, C11680 returned blank results in all
elements except Cu, it is suspected that this is an error caused in the laboratory. It was asked
to re-assay but there was insufficient sample to re-analyse.
Most of the Cu results returned higher than expected with a bias of 4.8%, though all except six
were within two standard deviations of the EV. Samples of this standard that were sent to the
referee laboratory also produced higher results than the EV. During the round robin analysis
for standard certification some laboratories also reported similar results for Cu. It is most
likely a slight calibration issue causing the higher results and this is not a concern for the
mineral resource estimation.
Three Pb results returned results far lower than expected. These have all been followed up
with the laboratory and have been corrected. The EV for Pb is outside of the calibration range
for ICP and it was confirmed by the laboratory that the correct assays were not taken from the
fusion results.
Tsumeb dump– JTSU01 Page: 23 Resource Estimation of Tsumeb Tailings Dump, Namibia – August 2011
AMIS0158
Most results have returned within two standard deviations of the EV except sample C11550.
This sample does not correspond to any other QA/QC sample nor is it an obvious sample
transposition. The laboratory was asked to re-assay, including five samples above and below.
but similar results were returned. When this sample is removed from the dataset all elements
have an acceptable bias of less than 4%.
Field Duplicates
Of all data pairs grading better than ten times detection limit 90% or more are within 10%
HARD precision limits for all elements. In all cases bar one where the duplicate sample was
preceded by a soil sample (suffix B), it was the dump sample above that which was duplicated
(suffix A) not the soil sample. The laboratory did not follow requested procedures exactly.
With two of the duplicate pairs it could not be ascertained which sample had been duplicated.
These two samples were C11309 and C11489.
Referee Analysis
Pulps were sent to ALS Chemex laboratory in Johannesburg. The analytical techniques
employed were the same as those utilised by Bureau Veritas in the primary analysis to ensure
compatibility of data. All standards returned acceptable values. All elements show
acceptable precision and accuracy with <11% difference bias between laboratories. There
was a problem with samples from batch S0348 for Cu leach assays. The original results from
Bureau Veritas are approximately 45% less than the results obtained from ALS. This has
been queried with Bureau Veritas and the initial response is that they confirmed a dilution
error and corrected the results by applying a mathematical factor to the all the Cu leach
results from this batch. Coffey Mining is of the opinion that this is not correct as the solubility
is related to the copper minerals present and is unlikely to be linear but rather related to the
type and habit of copper minerals throughout the grade range.
Tsumeb dump– JTSU01 Page: 24 Resource Estimation of Tsumeb Tailings Dump, Namibia – August 2011
7 GEOLOGICAL MODELLING
7.1 Introduction
The Tsumeb Dump was modelled using the 3D software package Datamine™.
A model was generated for the surface of the dump and the base of the dump. The surface of
the dump is based on the survey supplied to Coffey Mining from Namibian Custom Smelters.
The interpretation of the base of the dump is based on the coding in the borehole data where
soil first appears in the log, as mentioned in Section 6.1, this method of defining the base has
an approximate error of 0.5m.
Tsumeb dump– JTSU01 Page: 25 Resource Estimation of Tsumeb Tailings Dump, Namibia – August 2011
8 STATISTICAL ANALYSIS
8.1 Introduction
Statistical analyses were completed on the Tsumeb Dump for the raw data in the de-surveyed
borehole file which is based on the analysis received from the laboratory.
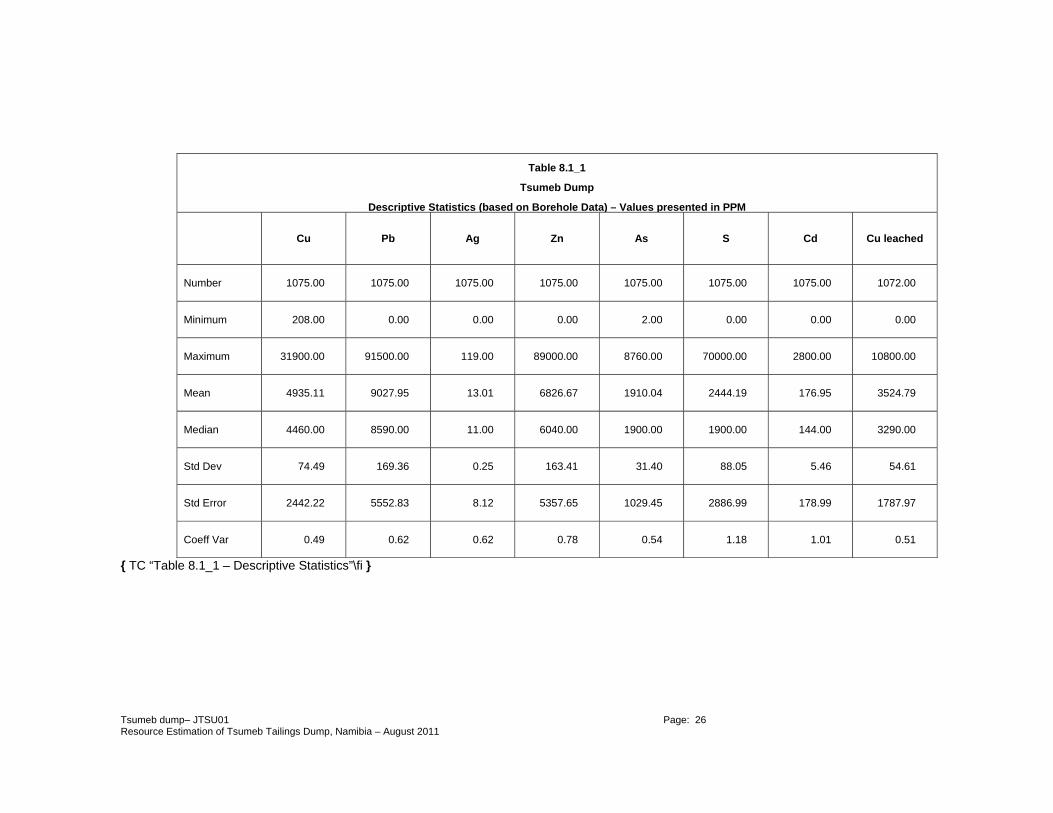
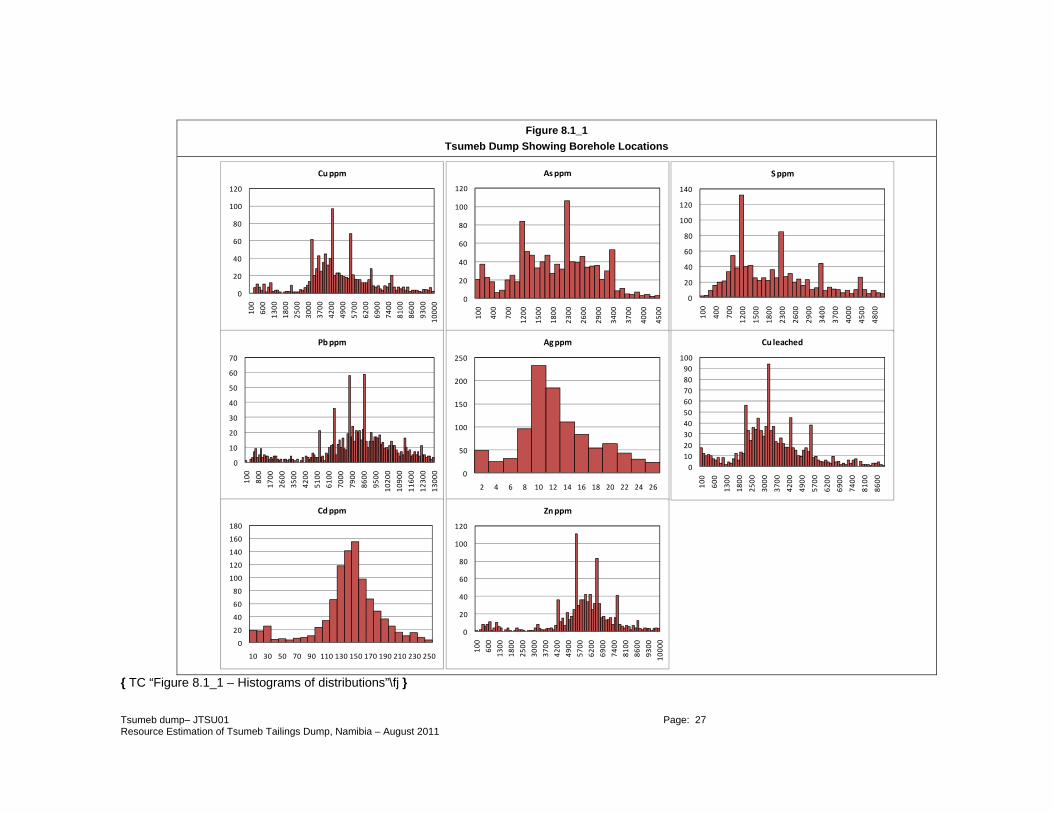
Statistical analysis and distribution histograms were calculated for Cu, Pb, Ag and Zn as well
as for minor elements; arsenic (As), sulphur (S), cadmium (Cd) as well as Cu leached. These
are shown in Table 8.1_1 and Figure 8.1_1.
The statistical analysis indicates that the major elements and Cu leached approximate normal
distributions except for Ag, which is positively skewed. This can be due to the low
concentrations of Ag found in the dump.
The minor elements Cd and As have normal distributions. Sulphur (S) is positively skewed.
All the elements the statistical analysis was based on have a moderate to large co-efficient of
variation, especially the minor elements. This is due to the way the dump was built, the
operational fluctuations, and recovery improvement with time of the beneficiation process.
The statistical analysis indicates that there is adequate understanding of the variation in the
Tsumeb Dump to do a high level resource classification.
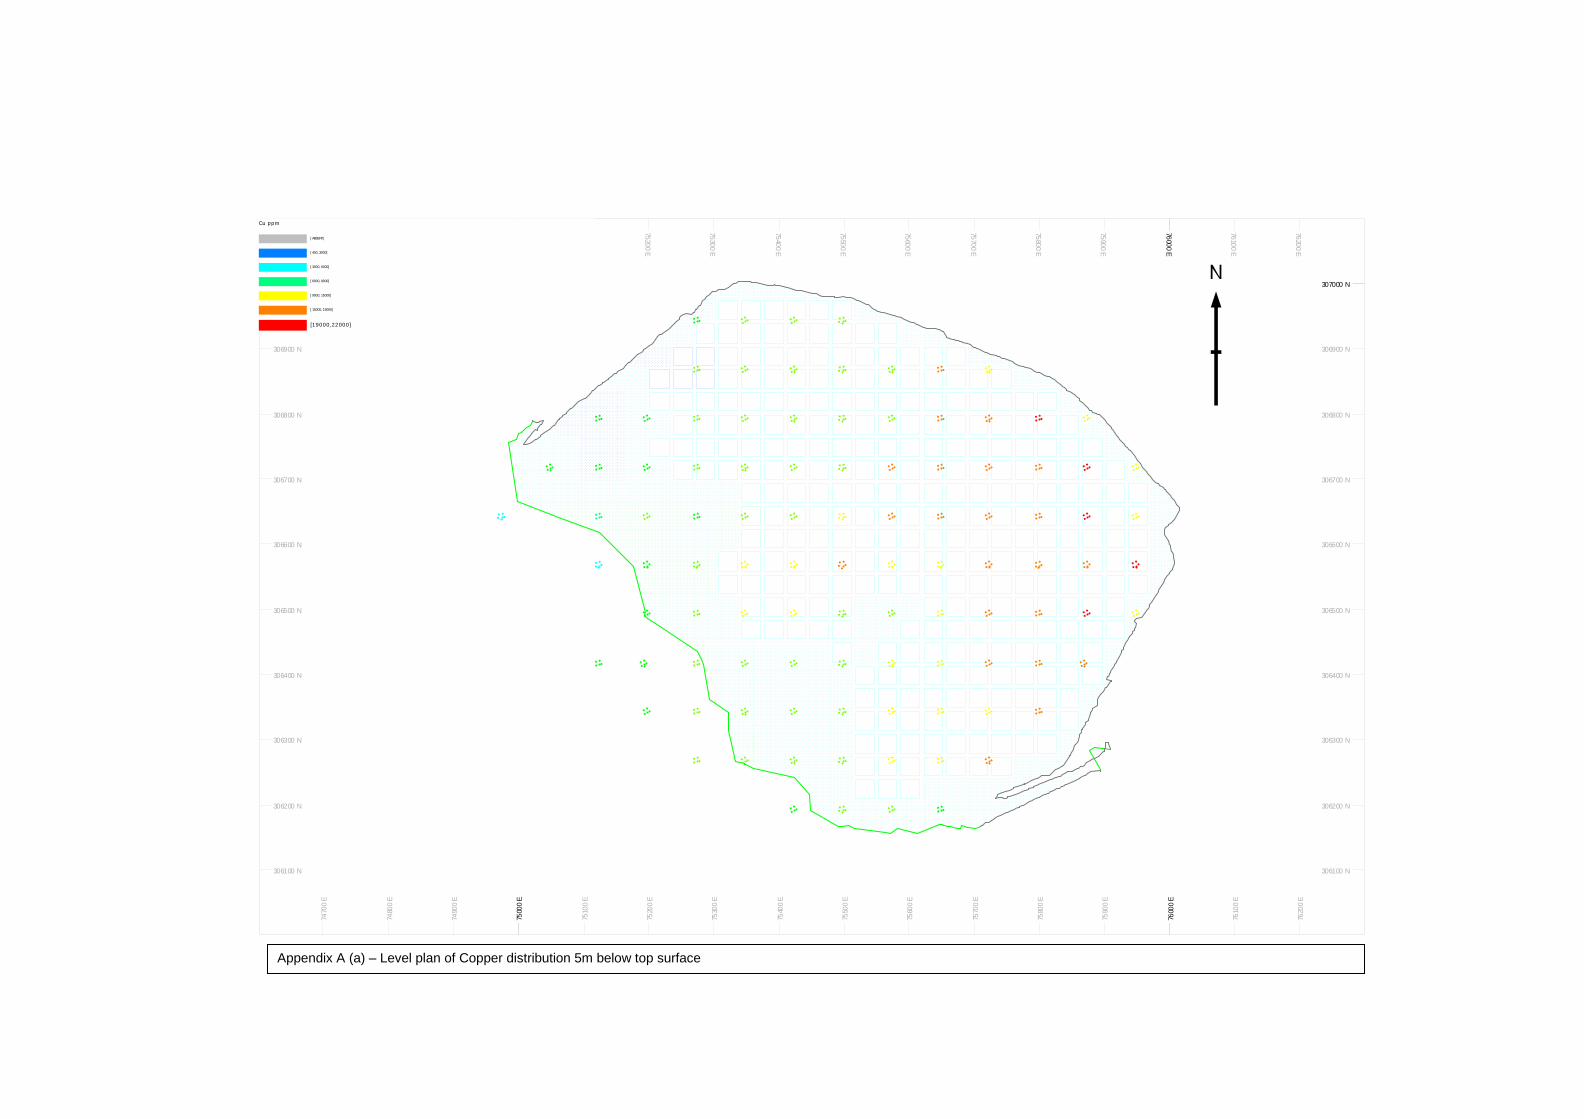
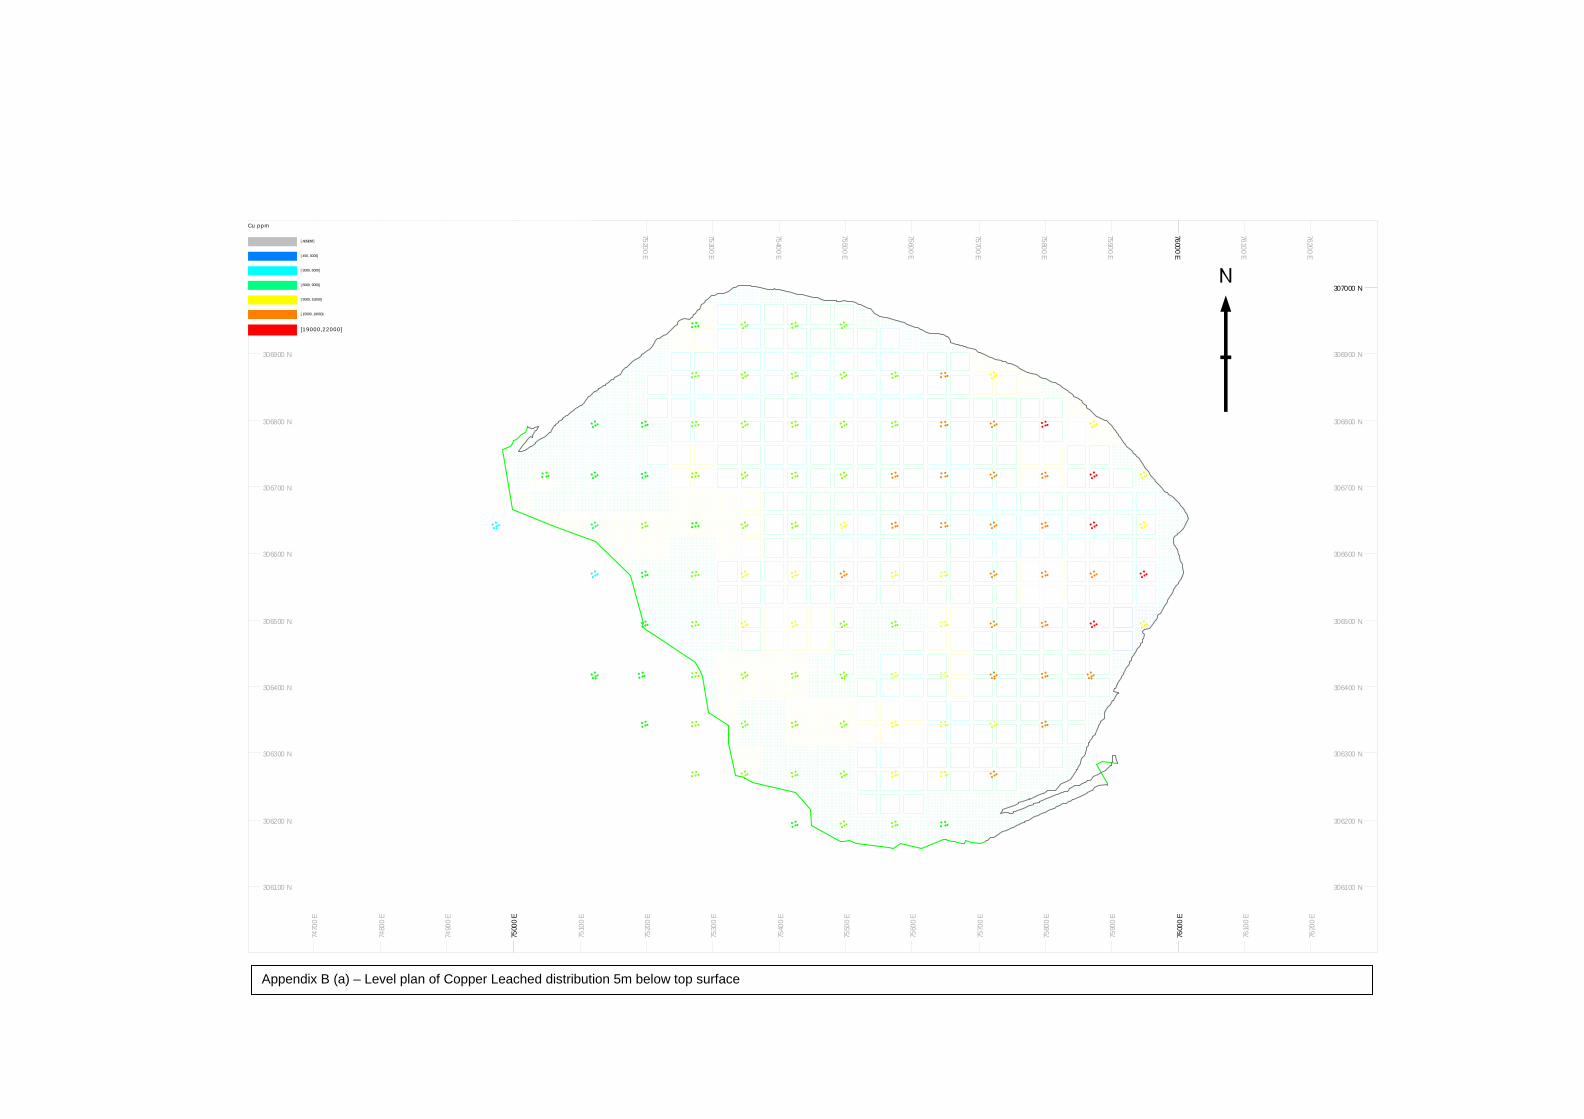
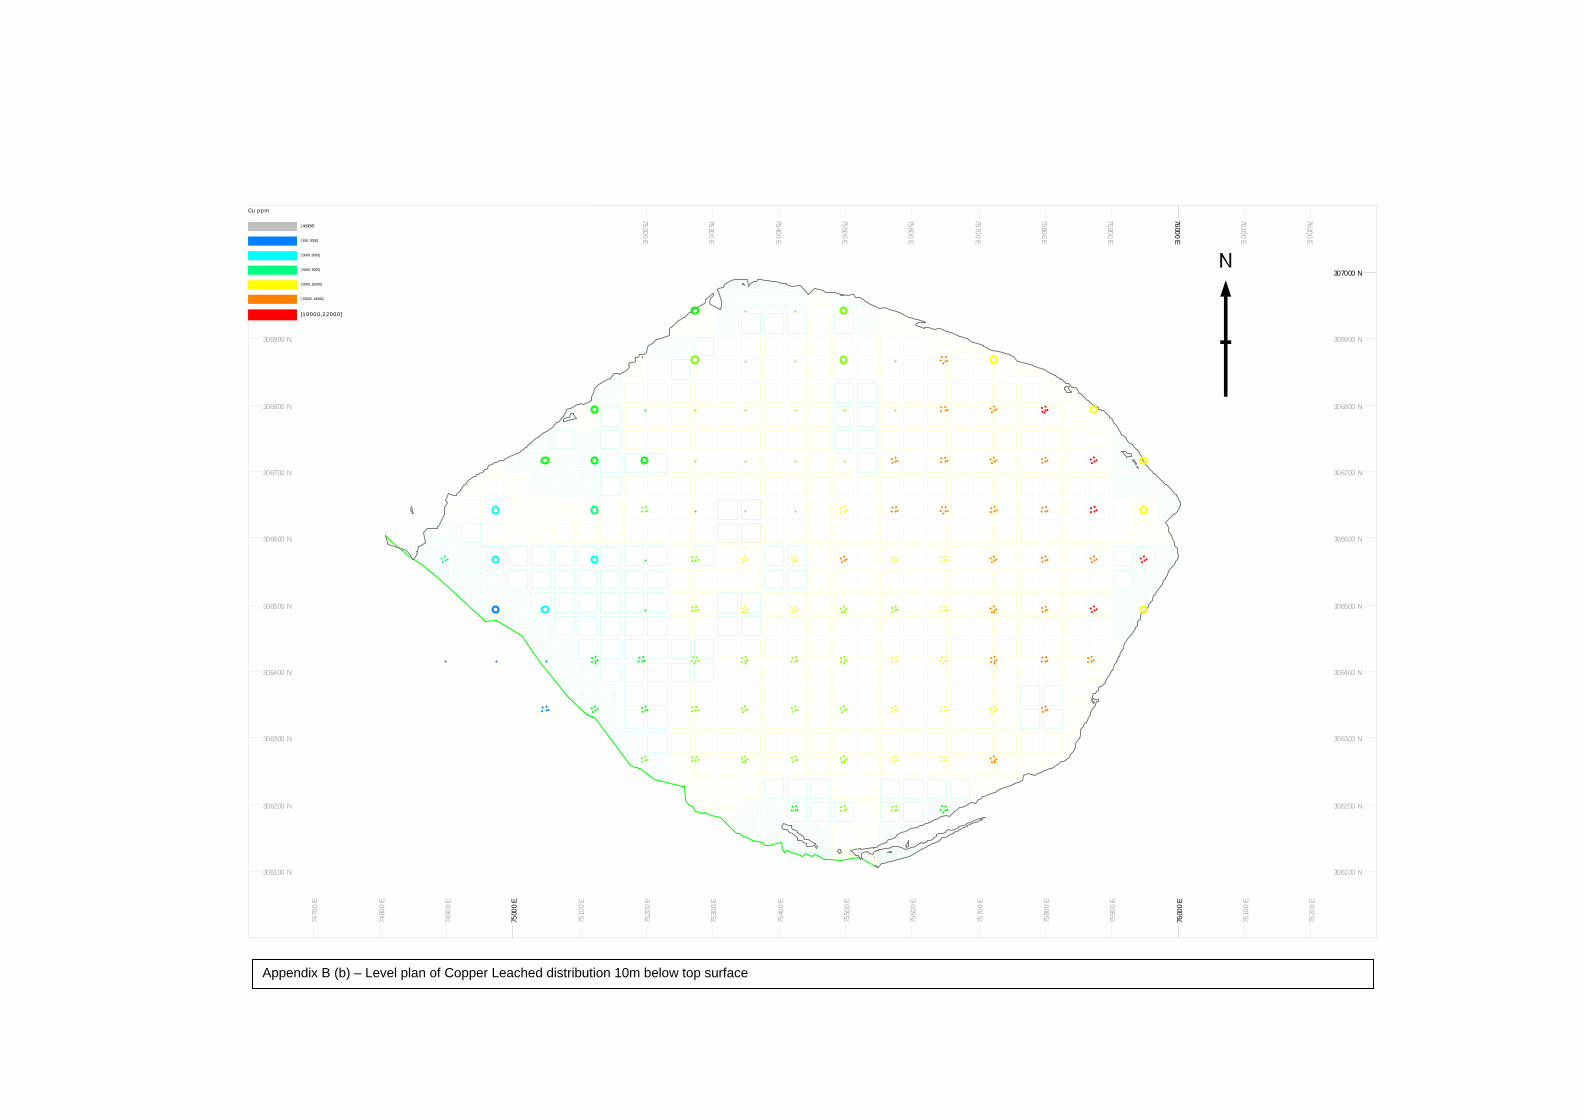
Level plans and cross sections of the Cu distribution on a 5m and 10m elevation from surface
is appended in Appendix A and for Cu solubility in Appendix B
Tsumeb dump– JTSU01 Page: 26 Resource Estimation of Tsumeb Tailings Dump, Namibia – August 2011
Table 8.1_1
Tsumeb Dump
Descriptive Statistics (based on Borehole Data) – Values presented in PPM
Cu Pb Ag Zn As S Cd Cu leached
Number 1075.00 1075.00 1075.00 1075.00 1075.00 1075.00 1075.00 1072.00
Minimum 208.00 0.00 0.00 0.00 2.00 0.00 0.00 0.00
Maximum 31900.00 91500.00 119.00 89000.00 8760.00 70000.00 2800.00 10800.00
Mean 4935.11 9027.95 13.01 6826.67 1910.04 2444.19 176.95 3524.79
Median 4460.00 8590.00 11.00 6040.00 1900.00 1900.00 144.00 3290.00
Std Dev 74.49 169.36 0.25 163.41 31.40 88.05 5.46 54.61
Std Error 2442.22 5552.83 8.12 5357.65 1029.45 2886.99 178.99 1787.97
Coeff Var 0.49 0.62 0.62 0.78 0.54 1.18 1.01 0.51
{ TC “Table 8.1_1 – Descriptive Statistics”\fi }
Tsumeb dump– JTSU01 Page: 27 Resource Estimation of Tsumeb Tailings Dump, Namibia – August 2011
Figure 8.1_1
Tsumeb Dump Showing Borehole Locations
{ TC “Figure 8.1_1 – Histograms of distributions”\fj }
0
20
40
60
80
100
120
100
600
1300
1800
2500
3000
3700
4200
4900
5700
6200
6900
7400
8100
8600
9300
1000
0
Cu ppm
0
20
40
60
80
100
120
100
400
700
1200
1500
1800
2300
2600
2900
3400
3700
4000
4500
As ppm
0
10
20
30
40
50
60
70
100
800
1700
2600
3500
4200
5100
6100
7000
7900
8600
9500
1020
0
1090
0
1160
0
1230
0
1300
0
Pb ppm
0
50
100
150
200
250
2 4 6 8 10 12 14 16 18 20 22 24 26
Ag ppm
0
20
40
60
80
100
120
140
100
400
700
1200
1500
1800
2300
2600
2900
3400
3700
4000
4500
4800
S ppm
0102030405060708090100
100
600
1300
1800
2500
3000
3700
4200
4900
5700
6200
6900
7400
8100
8600
Cu leached
0
20
40
60
80
100
120
140
160
180
10 30 50 70 90 110 130 150 170 190 210 230 250
Cd ppm
0
20
40
60
80
100
120
100
600
1300
1800
2500
3000
3700
4200
4900
5700
6200
6900
7400
8100
8600
9300
1000
0
Zn ppm
Tsumeb dump– JTSU01 Page: 28 Resource Estimation of Tsumeb Tailings Dump, Namibia – August 2011
9 BLOCK MODEL DEVELOPMENT
9.1 Introduction
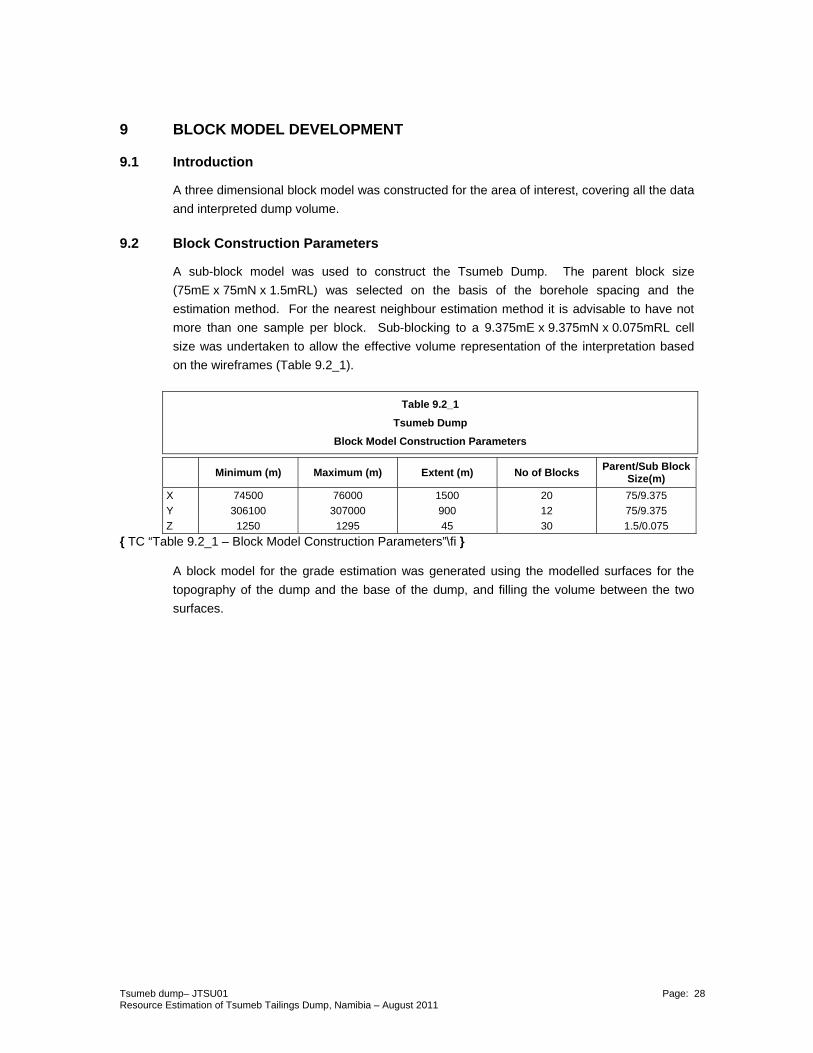
A three dimensional block model was constructed for the area of interest, covering all the data
and interpreted dump volume.
9.2 Block Construction Parameters
A sub-block model was used to construct the Tsumeb Dump. The parent block size
(75mE x 75mN x 1.5mRL) was selected on the basis of the borehole spacing and the
estimation method. For the nearest neighbour estimation method it is advisable to have not
more than one sample per block. Sub-blocking to a 9.375mE x 9.375mN x 0.075mRL cell
size was undertaken to allow the effective volume representation of the interpretation based
on the wireframes (Table 9.2_1).
Table 9.2_1
Tsumeb Dump
Block Model Construction Parameters
Minimum (m) Maximum (m) Extent (m) No of Blocks Parent/Sub Block
Size(m)
X 74500 76000 1500 20 75/9.375
Y 306100 307000 900 12 75/9.375
Z 1250 1295 45 30 1.5/0.075
{ TC “Table 9.2_1 – Block Model Construction Parameters”\fi }
A block model for the grade estimation was generated using the modelled surfaces for the
topography of the dump and the base of the dump, and filling the volume between the two
surfaces.

Tsumeb dump– JTSU01 Page: 29 Resource Estimation of Tsumeb Tailings Dump, Namibia – August 2011
10 GRADE ESTIMATION
10.1 Introduction
The resource estimation for the Tsumeb Dump was completed using a nearest neighbour
estimation method. Based on the fact that the dump had been constructed using a single inlet
which had been re-positioned over time, nearest neighbour estimation was deemed to provide
the most accurate representation of the grade distribution within the dump. This method also
has a proven track record in the estimation of old gold mine dumps in South Africa. Grade
estimation was carried out using the Datamine software.
10.2 Nearest Neighbour Estimate
A Nearest Neighbour (NN) estimate was completed for the entire dump area. A two pass
estimation strategy was applied using progressively expanded and less restrictive searches to
successive estimation passes. The search parameters were determined from the borehole
spacing and block sizes and are shown in Table 10.2_1.
Table 10.2_1
Tsumeb Dump
Nearest Neighbour estimation and search parameters
Estimation Pass
Rotation Search Distance
X Y Z X Y Z
1 0 0 0 100 100 20
2 0 0 0 150 150 50
{ TC “Table 10.2_1 – Nearest Neighbour estimation and search parameters”\fi }
As the estimation method was nearest neighbour- it was not necessary to limit the number of
samples used as the estimation method simply uses the nearest sample value for each block.
All relevant statistical information was recorded in order to validate and review the estimate.
The recorded information included average distance to sample per block estimate.
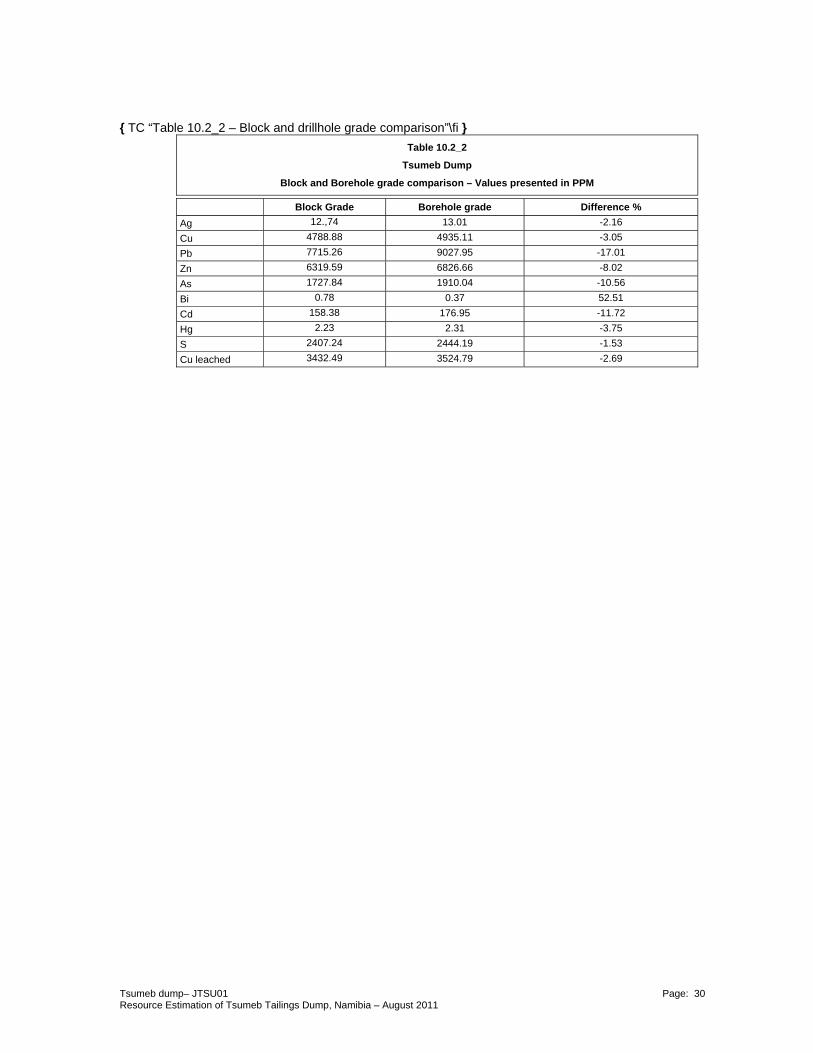
The model was checked visually and statistically to ensure the results could be confidently
reported. The statistical analysis compared the block average for each estimated element to
that of the raw borehole data (Table 10.2_2). In most cases the model grade compares very
well to the original borehole average grade, except in the case of Bi, where there is a
considerable discrepancy between the two averages. This is due to the amount of data
available and the very low values reported for Bi
Tsumeb dump– JTSU01 Page: 30 Resource Estimation of Tsumeb Tailings Dump, Namibia – August 2011
{ TC “Table 10.2_2 – Block and drillhole grade comparison”\fi }
Table 10.2_2
Tsumeb Dump
Block and Borehole grade comparison – Values presented in PPM
Block Grade Borehole grade Difference %
Ag 12.,74 13.01 -2.16
Cu 4788.88 4935.11 -3.05
Pb 7715.26 9027.95 -17.01
Zn 6319.59 6826.66 -8.02
As 1727.84 1910.04 -10.56
Bi 0.78 0.37 52.51
Cd 158.38 176.95 -11.72
Hg 2.23 2.31 -3.75
S 2407.24 2444.19 -1.53
Cu leached 3432.49 3524.79 -2.69
Tsumeb dump– JTSU01 Page: 31 Resource Estimation of Tsumeb Tailings Dump, Namibia – August 2011
11 RESOURCE REPORTING
11.1 Introduction
Based on the assessment of borehole spacing, geological understanding and grade
estimation, and the confidence in the analyses the mineral resource is classified as an
Indicated Mineral Resource.
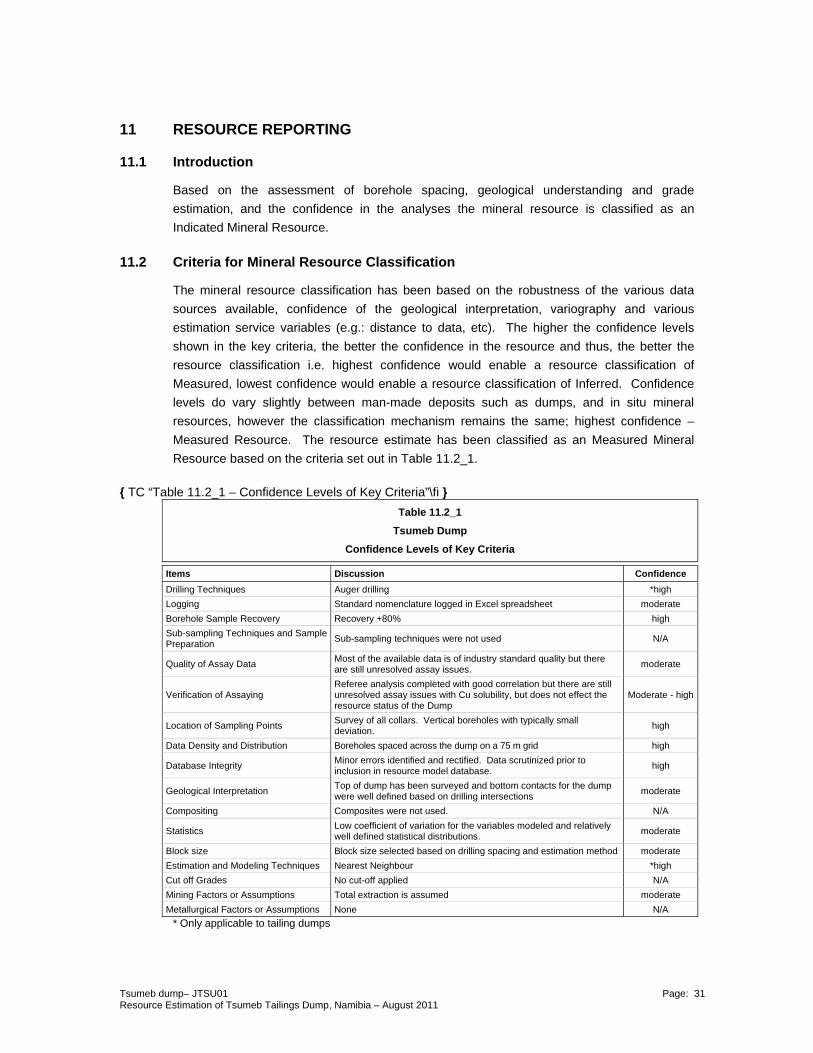
11.2 Criteria for Mineral Resource Classification
The mineral resource classification has been based on the robustness of the various data
sources available, confidence of the geological interpretation, variography and various
estimation service variables (e.g.: distance to data, etc). The higher the confidence levels
shown in the key criteria, the better the confidence in the resource and thus, the better the
resource classification i.e. highest confidence would enable a resource classification of
Measured, lowest confidence would enable a resource classification of Inferred. Confidence
levels do vary slightly between man-made deposits such as dumps, and in situ mineral
resources, however the classification mechanism remains the same; highest confidence –
Measured Resource. The resource estimate has been classified as an Measured Mineral
Resource based on the criteria set out in Table 11.2_1.
{ TC “Table 11.2_1 – Confidence Levels of Key Criteria”\fi }
Table 11.2_1
Tsumeb Dump
Confidence Levels of Key Criteria
Items Discussion Confidence
Drilling Techniques Auger drilling *high
Logging Standard nomenclature logged in Excel spreadsheet moderate
Borehole Sample Recovery Recovery +80% high
Sub-sampling Techniques and Sample Preparation
Sub-sampling techniques were not used N/A
Quality of Assay Data Most of the available data is of industry standard quality but there are still unresolved assay issues.
moderate
Verification of Assaying Referee analysis completed with good correlation but there are still unresolved assay issues with Cu solubility, but does not effect the resource status of the Dump
Moderate - high
Location of Sampling Points Survey of all collars. Vertical boreholes with typically small deviation.
high
Data Density and Distribution Boreholes spaced across the dump on a 75 m grid high
Database Integrity Minor errors identified and rectified. Data scrutinized prior to inclusion in resource model database.
high
Geological Interpretation Top of dump has been surveyed and bottom contacts for the dump were well defined based on drilling intersections
moderate
Compositing Composites were not used. N/A
Statistics Low coefficient of variation for the variables modeled and relatively well defined statistical distributions.
moderate
Block size Block size selected based on drilling spacing and estimation method moderate
Estimation and Modeling Techniques Nearest Neighbour *high
Cut off Grades No cut-off applied N/A
Mining Factors or Assumptions Total extraction is assumed moderate
Metallurgical Factors or Assumptions None N/A
* Only applicable to tailing dumps
Tsumeb dump– JTSU01 Page: 32 Resource Estimation of Tsumeb Tailings Dump, Namibia – August 2011
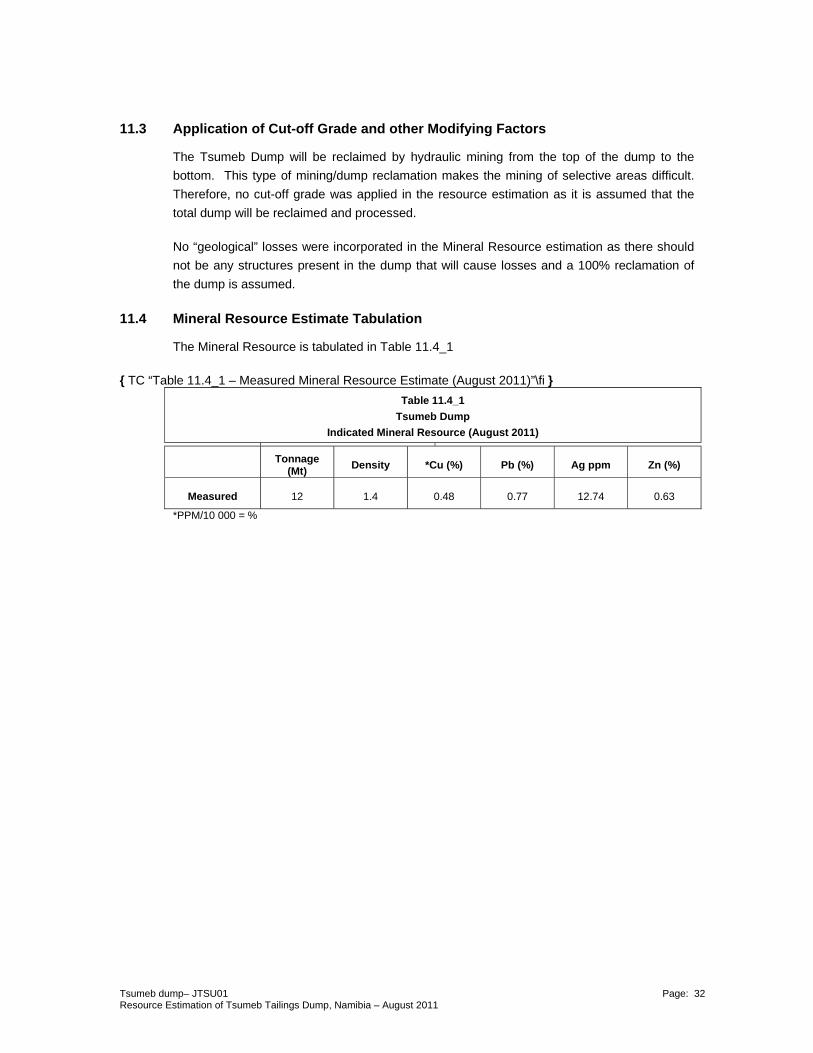
11.3 Application of Cut-off Grade and other Modifying Factors
The Tsumeb Dump will be reclaimed by hydraulic mining from the top of the dump to the
bottom. This type of mining/dump reclamation makes the mining of selective areas difficult.
Therefore, no cut-off grade was applied in the resource estimation as it is assumed that the
total dump will be reclaimed and processed.
No “geological” losses were incorporated in the Mineral Resource estimation as there should
not be any structures present in the dump that will cause losses and a 100% reclamation of
the dump is assumed.
11.4 Mineral Resource Estimate Tabulation
The Mineral Resource is tabulated in Table 11.4_1
{ TC “Table 11.4_1 – Measured Mineral Resource Estimate (August 2011)”\fi }
Table 11.4_1
Tsumeb Dump
Indicated Mineral Resource (August 2011)
Tonnage
(Mt) Density *Cu (%) Pb (%) Ag ppm Zn (%)
Measured 12 1.4 0.48 0.77 12.74 0.63
*PPM/10 000 = %
Tsumeb dump– JTSU01 Page: 33 Resource Estimation of Tsumeb Tailings Dump, Namibia – August 2011
12 CONCLUSION
The Tsumeb Dump consists mainly of the crushed tails from the flotation circuit of the Tsumeb
Copper Mine’s beneficiation plant (specifically the flotation circuit).
The drilling of dump, taking of the samples and implementation of QAQC procedures were
conducted under the supervision of Coffey Mining. This was done to ensure a high level of
confidence in the data and the estimation of the dump.
The statistical analyses of the data obtained from the assayed samples indicate that sufficient
information and knowledge regarding the variation of the data existed on which to base a
resource estimate.
The quality control procedures, which are implemented to ensure accuracy of the analysis,
revealed various issues with the original result from the laboratory. Not all queries submitted
to the laboratory have been address adequately; quality of the assays results is compromised
resulting in a low level of confidence for some parts of the assay results especially Cu
solubility.
The mineral resource estimate is based on the dump topography and the base of the dump,
as interpreted from borehole logs, wireframes created in Datamine. While the quality of the
data is generally good. As a result the mineral resource is classified as Measured.
A Measured Mineral Resource with 12 million tonnes at 0.48% Cu was estimated for the
Tsumeb Dump.
Tsumeb dump– JTSU01 Page: 34 Resource Estimation of Tsumeb Tailings Dump, Namibia – August 2011
13 REFERENCES
Brown, I et al. 2009.Tscudi Copper Deposit, Geological Modelling and Resource Estimate.
Coffey Mining Report for Weatherly Mining Namibia Ltd.
Gebhard, G.1999. Tsumeb. Pub. G.G. Publishing, Grossenseifen, Germany
Grunert, N. 2000. Namibia. Fascination of Geology. A Travel Handbook. Pub.Klaus Hess
Publishers, Germany.
Lombaard, A.F. et al. 1986. The Tsumeb Lead-Copper-Zinc-Silver Deposit, South West
Africa/Namibia. Mineral Deposits of South Africa. pp.1761-1787
Mineralogical Record. 1977. Tsumeb. Ed.Wilson, W.E. Pub. The Mineralogical Record Inc.,
Maryland, USA.vol.8, no.3 (May-June 1977)
Ministry of Mines and Energy, Geological Survey. 1992. The Mineral Resources of Namibia.
pp. 2.3-52 to 2.3-69, 2.5-2 to 2.5-9
Sohnge,G. 1967. Tsumeb a historical sketch. Pub. Committee of the S.W.A. Scientific
Society, Windhoek

Appendix A Level Plans and Cross Sections of Copper
Distribution in the Tsumeb Dump { TC “Appendix A – Level Plans and Cross Sections of Copper Distribution in the Tsumeb Dump”\fa }
74
700
E
7470
0 E
74
800
E
7480
0 E
74
900
E
7490
0 E
75
000
E
7500
0 E
75
100
E
7510
0 E
75
200
E
7520
0 E
75
300
E
7530
0 E
75
400
E
7540
0 E
75
500
E
7550
0 E
75
600
E
7560
0 E
75
700
E
7570
0 E
75
800
E
7580
0 E
75
900
E
7590
0 E
76
000
E
7600
0 E
76
100
E
7610
0 E
76
200
E
7620
0 E
306100 N 306100 N
306200 N 306200 N
306300 N 306300 N
306400 N 306400 N
306500 N 306500 N
306600 N 306600 N
306700 N 306700 N
306800 N 306800 N
306900 N 306900 N
307000 N 307000 N
Cu ppm
[ ABSENT]
[ 450, 3000]
[ 3000, 6000]
[ 6000, 9000]
[ 9000, 15000]
[ 15000, 19000]
[19000,22000]
Appendix A (a) – Level plan of Copper distribution 5m below top surface

74
700
E
7470
0 E
74
800
E
7480
0 E
74
900
E
7490
0 E
75
000
E
7500
0 E
75
100
E
7510
0 E
75
200
E
7520
0 E
75
300
E
7530
0 E
75
400
E
7540
0 E
75
500
E
7550
0 E
75
600
E
7560
0 E
75
700
E
7570
0 E
75
800
E
7580
0 E
75
900
E
7590
0 E
76
000
E
7600
0 E
76
100
E
7610
0 E
76
200
E
7620
0 E
306100 N 306100 N
306200 N 306200 N
306300 N 306300 N
306400 N 306400 N
306500 N 306500 N
306600 N 306600 N
306700 N 306700 N
306800 N 306800 N
306900 N 306900 N
307000 N 307000 N
Cu ppm
[ ABSENT]
[ 450, 3000]
[ 3000, 6000]
[ 6000, 9000]
[ 9000, 15000]
[ 15000, 19000]
[19000,22000]
Appendix A (b) – Level plan of Copper distribution 10m below top surface with section lines
Section 1 Section 2 Section 3
Section 4
Section 5
Section 6
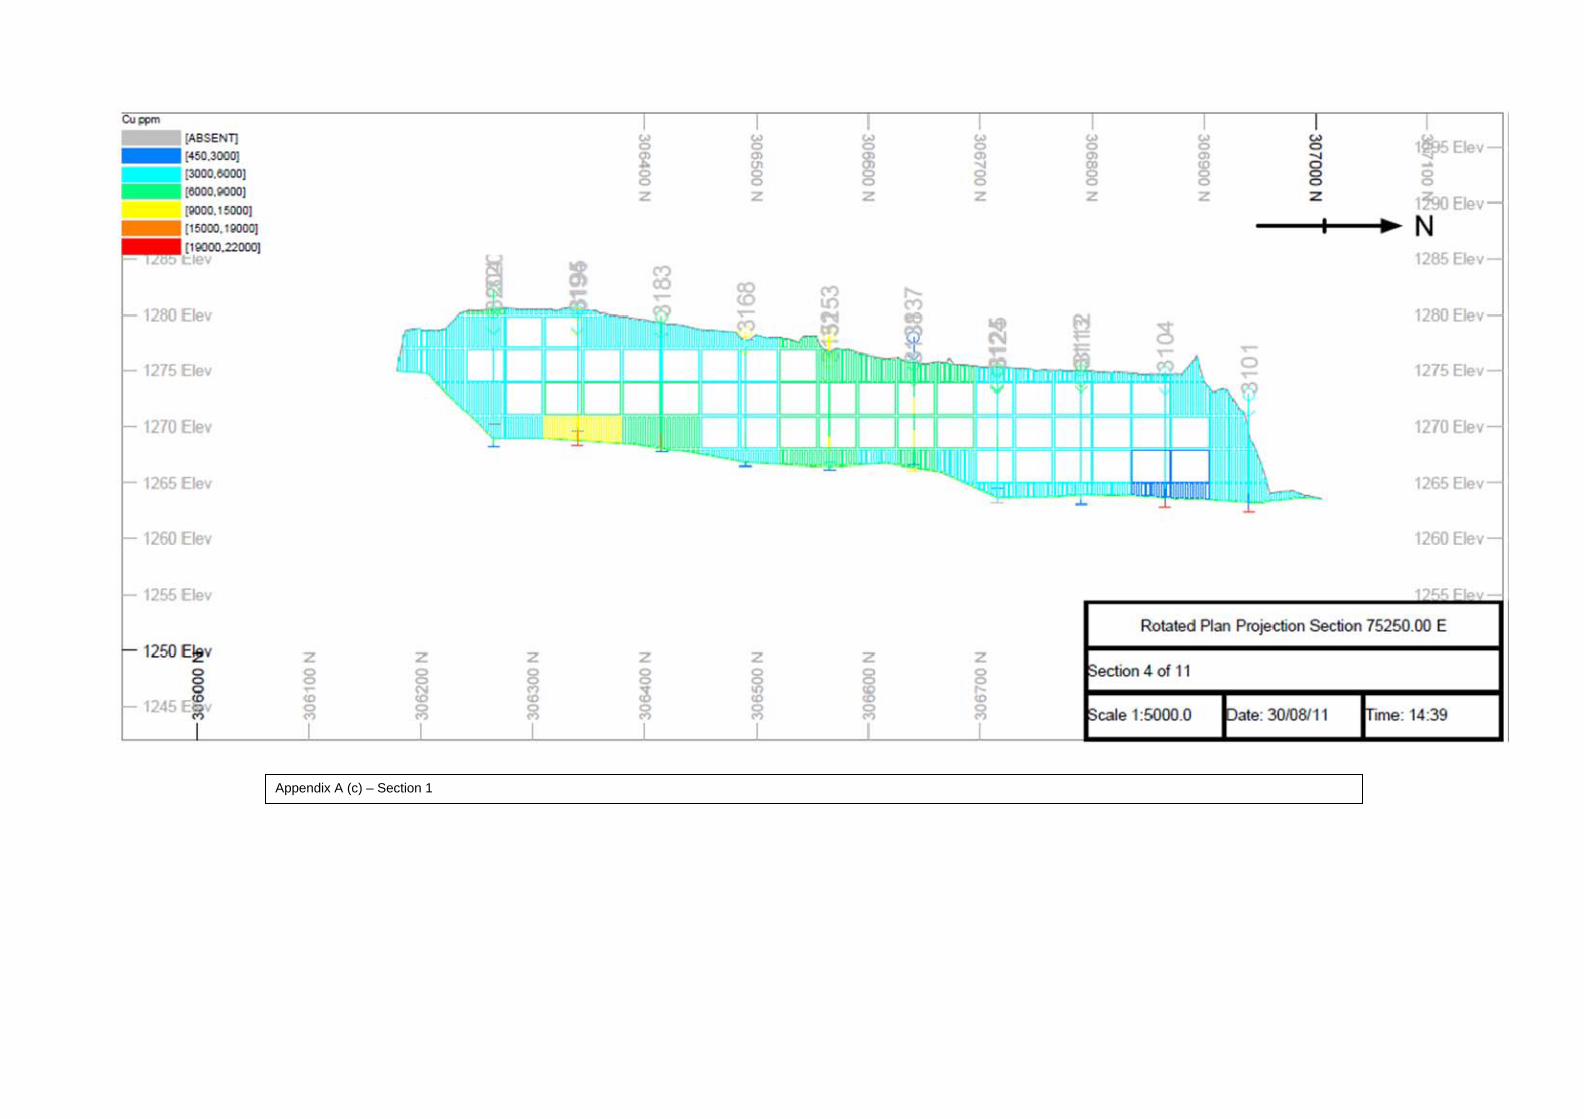
Appendix A (c) – Section 1
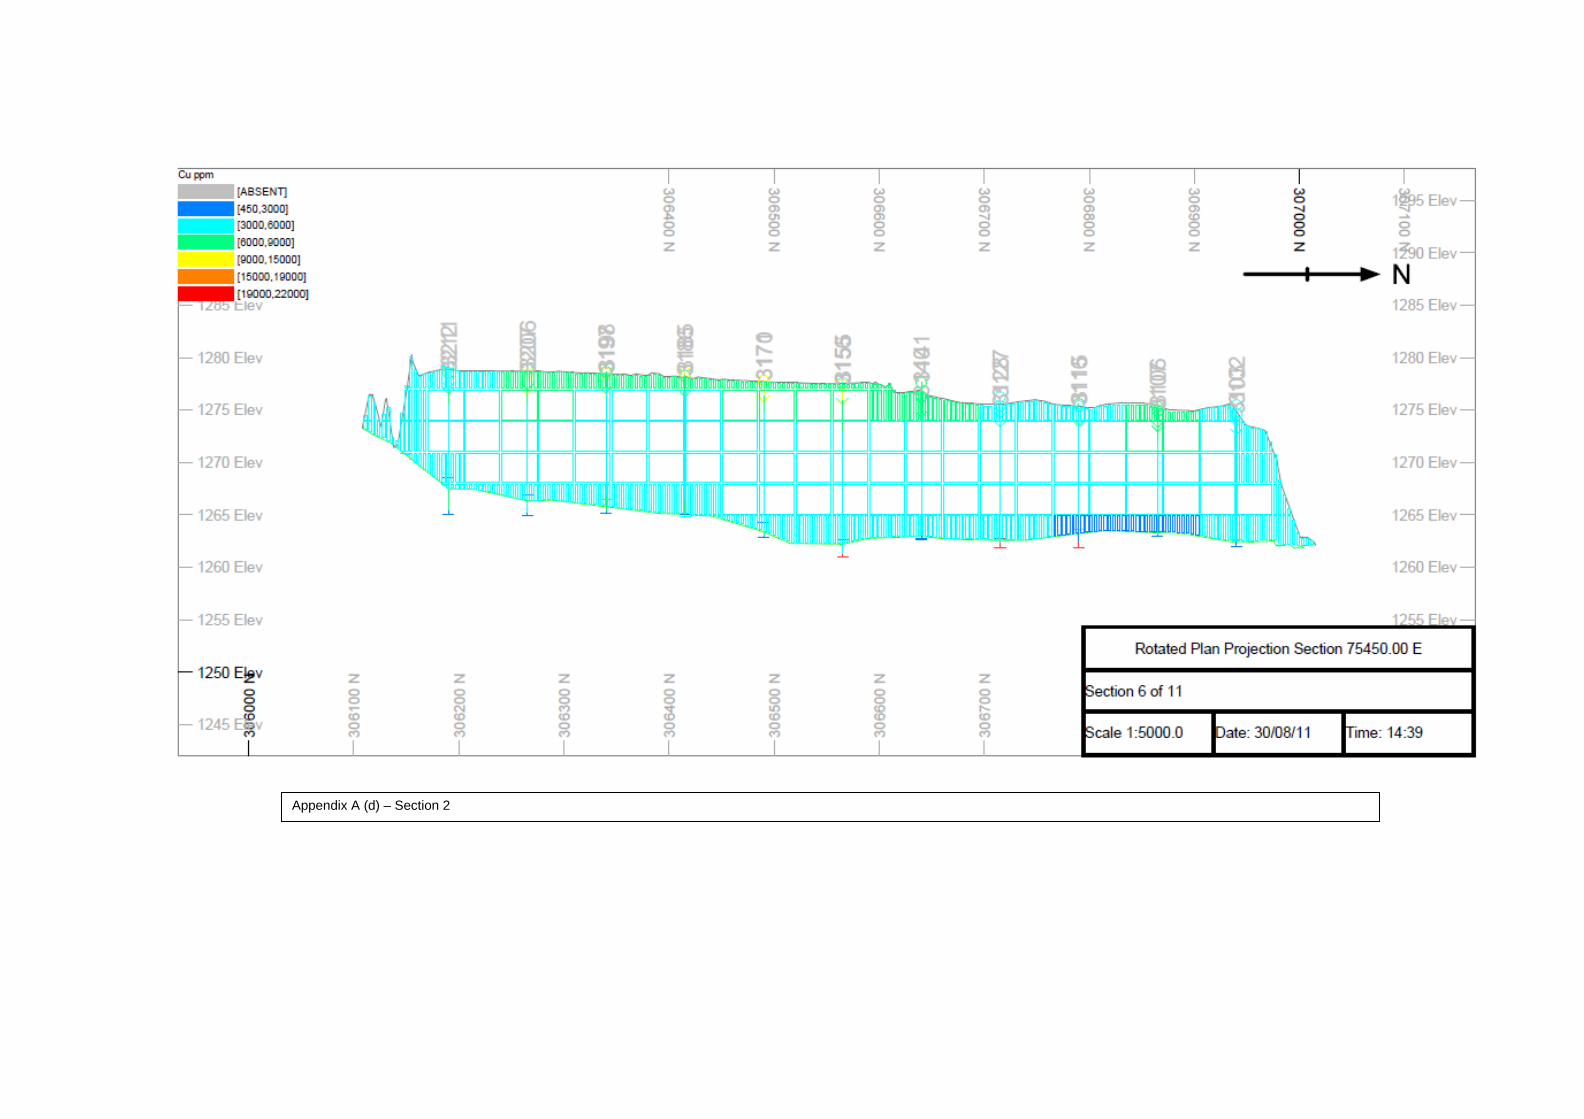
Appendix A (d) – Section 2
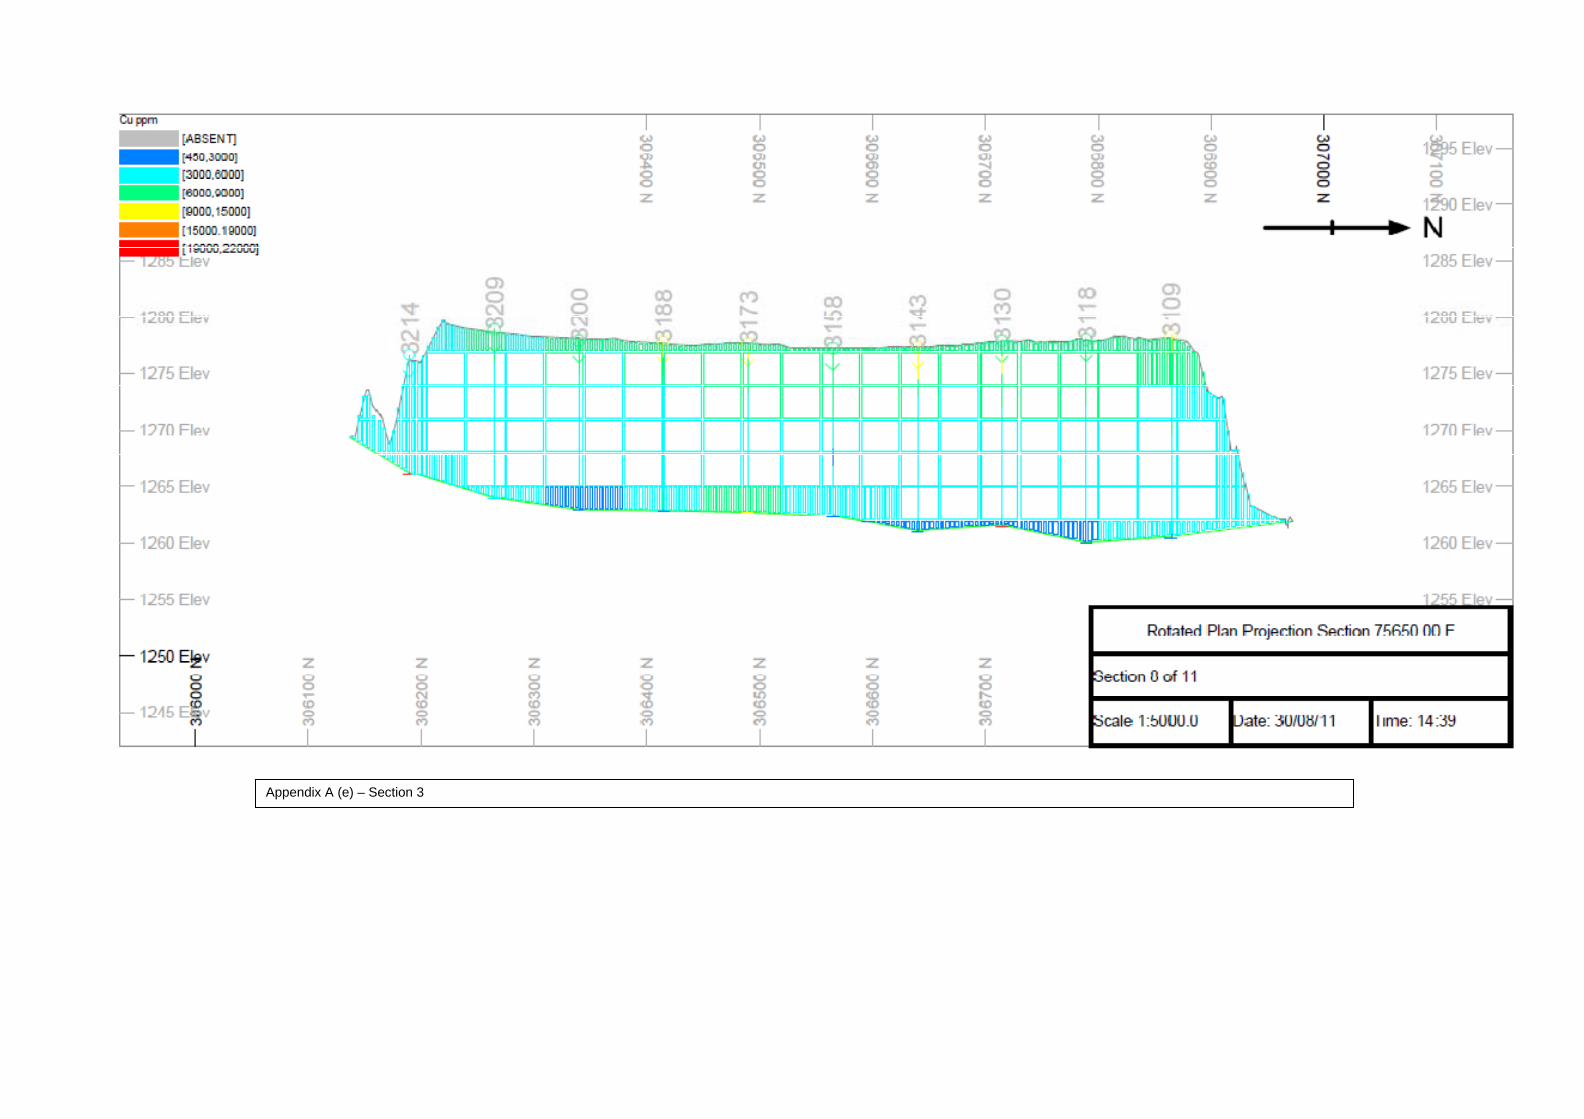
Appendix A (e) – Section 3
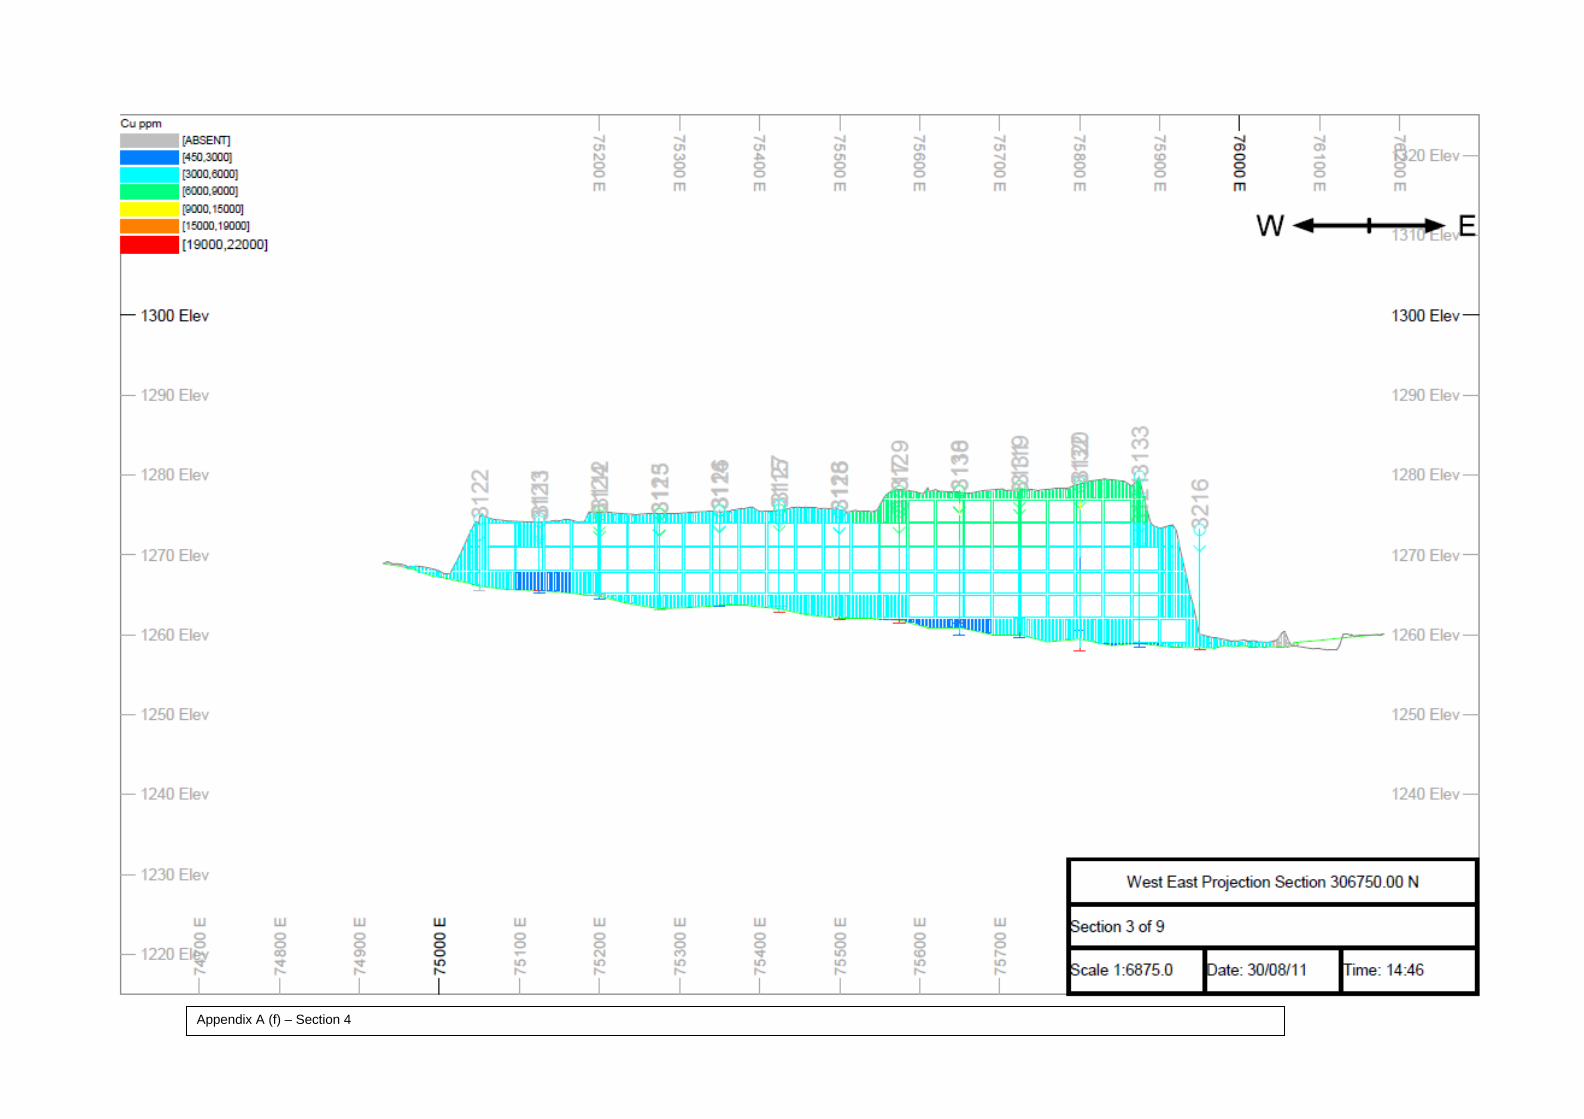
Appendix A (f) – Section 4

Appendix A (g) – Section 5
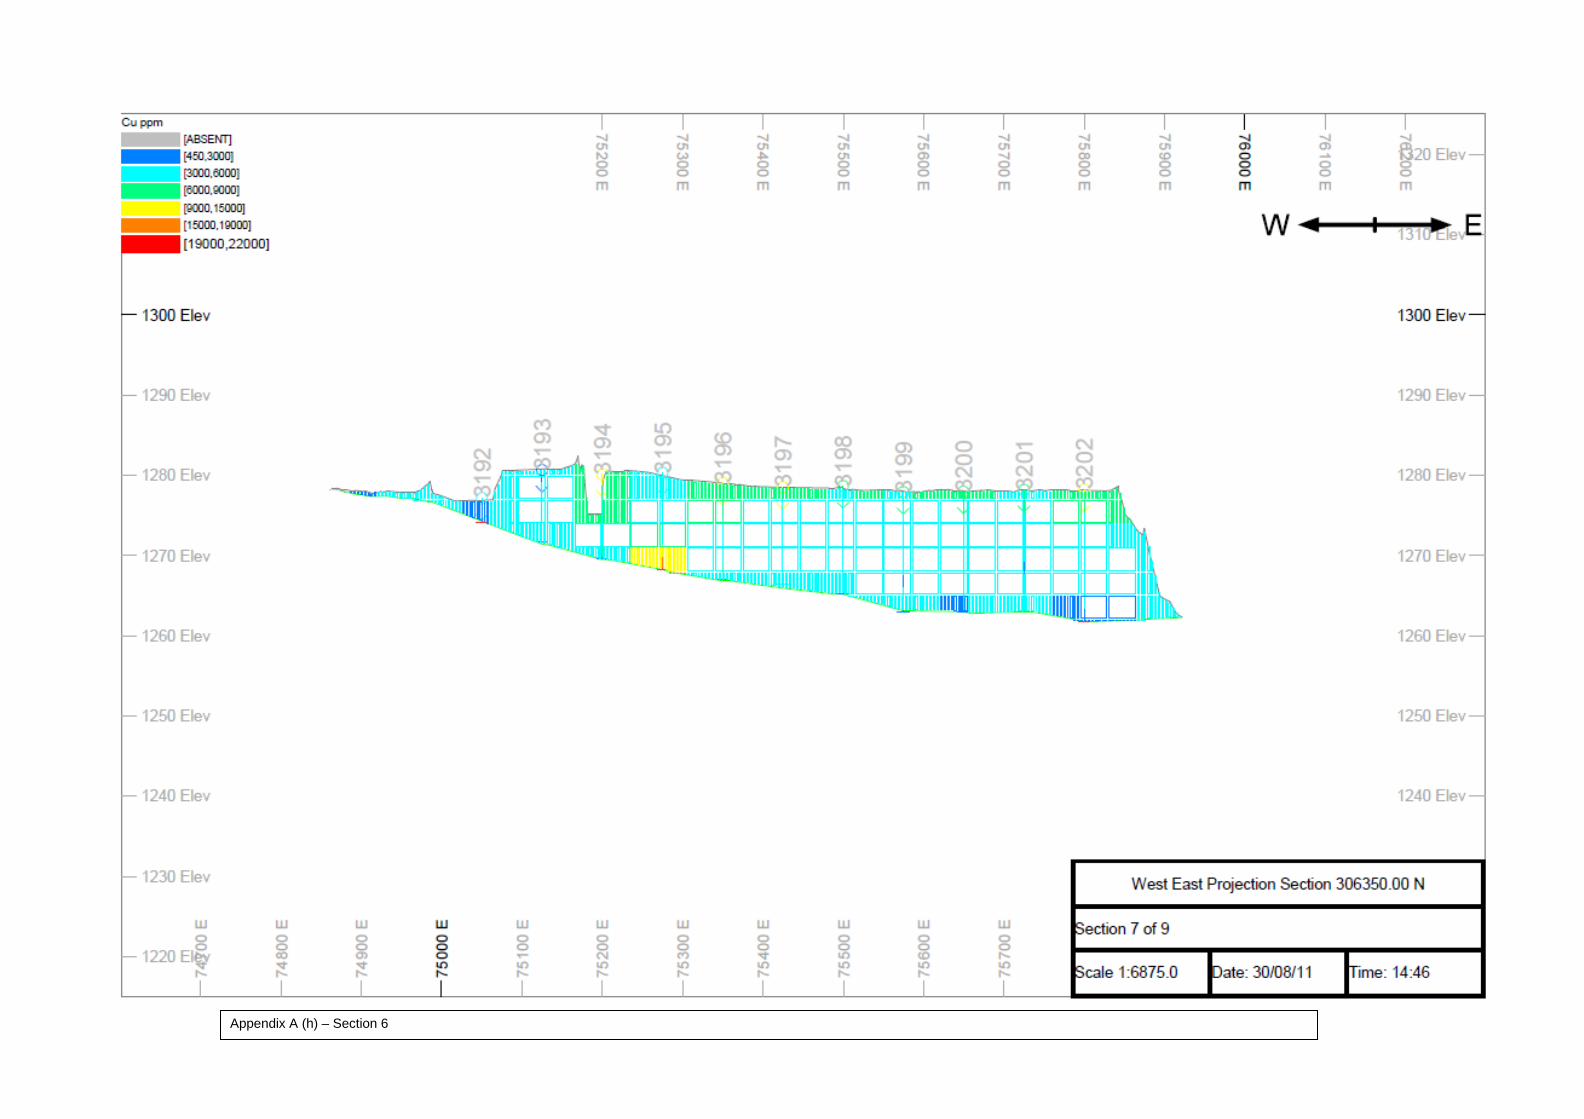
Appendix A (h) – Section 6

Appendix B Level Plans of Copper Leached Distribution
in the Tsumeb Dump { TC “Appendix B – Level Plans Of Copper Leached Distribution in the Tsumeb Dump”\fa }
74
700
E
7470
0 E
74
800
E
7480
0 E
74
900
E
7490
0 E
75
000
E
7500
0 E
75
100
E
7510
0 E
75
200
E
7520
0 E
75
300
E
7530
0 E
75
400
E
7540
0 E
75
500
E
7550
0 E
75
600
E
7560
0 E
75
700
E
7570
0 E
75
800
E
7580
0 E
75
900
E
7590
0 E
76
000
E
7600
0 E
76
100
E
7610
0 E
76
200
E
7620
0 E
306100 N 306100 N
306200 N 306200 N
306300 N 306300 N
306400 N 306400 N
306500 N 306500 N
306600 N 306600 N
306700 N 306700 N
306800 N 306800 N
306900 N 306900 N
307000 N 307000 N
Cu ppm
[ ABSENT]
[ 450, 3000]
[ 3000, 6000]
[ 6000, 9000]
[ 9000, 15000]
[ 15000, 19000]
[19000,22000]
Appendix B (a) – Level plan of Copper Leached distribution 5m below top surface
74
700
E
7470
0 E
74
800
E
7480
0 E
74
900
E
7490
0 E
75
000
E
7500
0 E
75
100
E
7510
0 E
75
200
E
7520
0 E
75
300
E
7530
0 E
75
400
E
7540
0 E
75
500
E
7550
0 E
75
600
E
7560
0 E
75
700
E
7570
0 E
75
800
E
7580
0 E
75
900
E
7590
0 E
76
000
E
7600
0 E
76
100
E
7610
0 E
76
200
E
7620
0 E
306100 N 306100 N
306200 N 306200 N
306300 N 306300 N
306400 N 306400 N
306500 N 306500 N
306600 N 306600 N
306700 N 306700 N
306800 N 306800 N
306900 N 306900 N
307000 N 307000 N
Cu ppm
[ ABSENT]
[ 450, 3000]
[ 3000, 6000]
[ 6000, 9000]
[ 9000, 15000]
[ 15000, 19000]
[19000,22000]
Appendix B (b) – Level plan of Copper Leached distribution 10m below top surface

Appendix C QAQC Plots
{ TC “Appendix C – QAQC Plots”\fa }
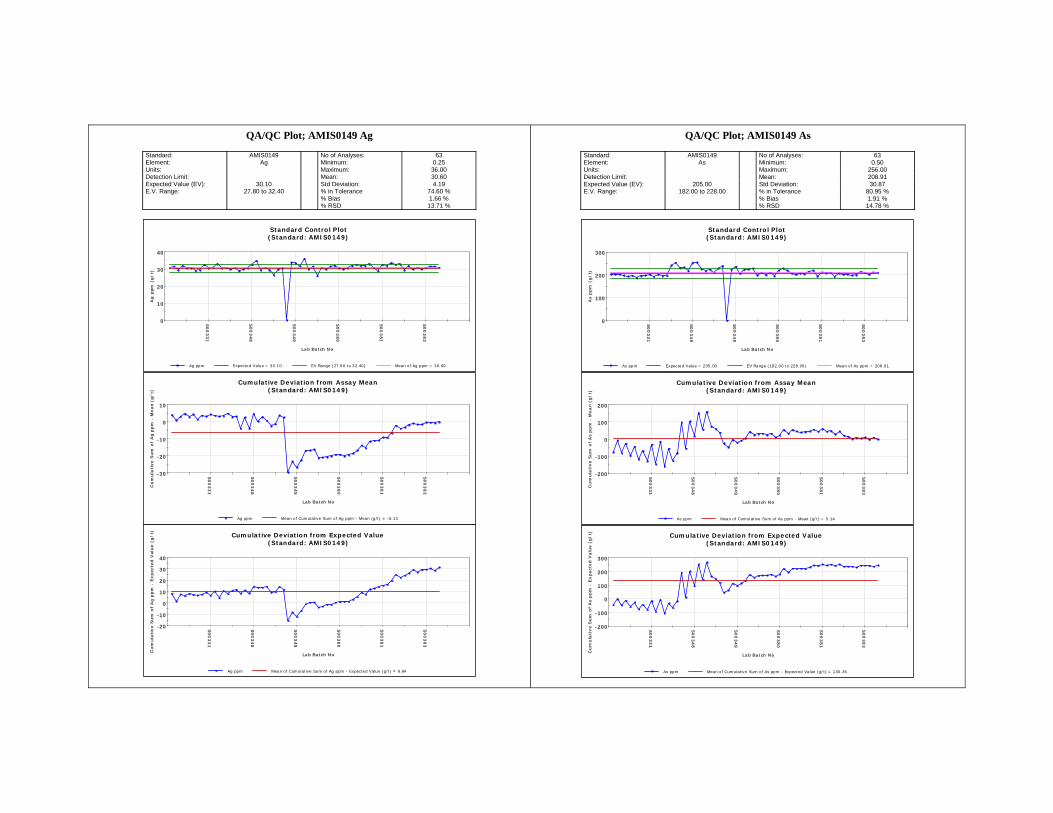
QA/QC Plot; AMIS0149 Ag
QA/QC Plot; AMIS0149 As
Standard: AMIS0149 No of Analyses: 63Element: Ag Minimum: 0.25Units: Maximum: 36.00Detection Limit: Mean: 30.60Expected Value (EV): 30.10 Std Deviation: 4.19E.V. Range: 27.80 to 32.40 % in Tolerance 74.60 %
% Bias 1.66 %% RSD 13.71 %
0
10
20
30
40
S0
03
31
S0
03
48
S0
03
49
S0
03
80
S0
03
81
S0
03
83
Ag
ppm
(g
/t)
Lab Batch No
Standard Control Plot(Standard: AMIS0149)
Ag ppm Expected Value = 30.10 EV Range (27.80 to 32.40) Mean of Ag ppm = 30.60
-30
-20
-10
0
10
S0
03
31
S0
03
48
S0
03
49
S0
03
80
S0
03
81
S0
03
83
Cu
mu
lati
ve S
um
of
Ag
pp
m -
Me
an
(g
/t)
Lab Batch No
Cumulative Deviation from Assay Mean(Standard: AMIS0149)
Ag ppm Mean of Cumulative Sum of Ag ppm - Mean (g/t) = -6.13
-20
-10
0
10
20
30
40
S00
33
1
S00
34
8
S00
34
9
S00
38
0
S00
38
1
S00
38
3
Cu
mu
lati
ve S
um
of
Ag
ppm
- E
xp
ecte
d V
alu
e (
g/
t)
Lab Batch No
Cumulative Deviation from Expected Value(Standard: AMIS0149)
Ag ppm Mean of Cumulative Sum of Ag ppm - Expected Value (g/t) = 9.84
Standard: AMIS0149 No of Analyses: 63Element: As Minimum: 0.50Units: Maximum: 256.00Detection Limit: Mean: 208.91Expected Value (EV): 205.00 Std Deviation: 30.87E.V. Range: 182.00 to 228.00 % in Tolerance 80.95 %
% Bias 1.91 %% RSD 14.78 %
0
100
200
300
S0
03
31
S0
03
48
S0
03
49
S0
03
80
S0
03
81
S0
03
83
As p
pm
(g/
t)
Lab Batch No
Standard Control Plot(Standard: AMIS0149)
As ppm Expected Value = 205.00 EV Range (182.00 to 228.00) Mean of As ppm = 208.91
-200
-100
0
100
200S
00
331
S0
03
48
S0
03
49
S0
03
80
S0
03
81
S0
03
83
Cu
mu
lati
ve S
um
of
As p
pm
- M
ea
n (
g/
t)
Lab Batch No
Cumulative Deviation from Assay Mean(Standard: AMIS0149)
As ppm Mean of Cumulative Sum of As ppm - Mean (g/t) = 5.14
-200
-100
0
100
200
300
S0
033
1
S0
034
8
S0
034
9
S0
038
0
S0
038
1
S0
038
3
Cu
mula
tiv
e S
um
of
As p
pm
- E
xp
ecte
d V
alu
e (
g/
t)
Lab Batch No
Cumulative Deviation from Expected Value(Standard: AMIS0149)
As ppm Mean of Cumulative Sum of As ppm - Expected Value (g/t) = 130.35
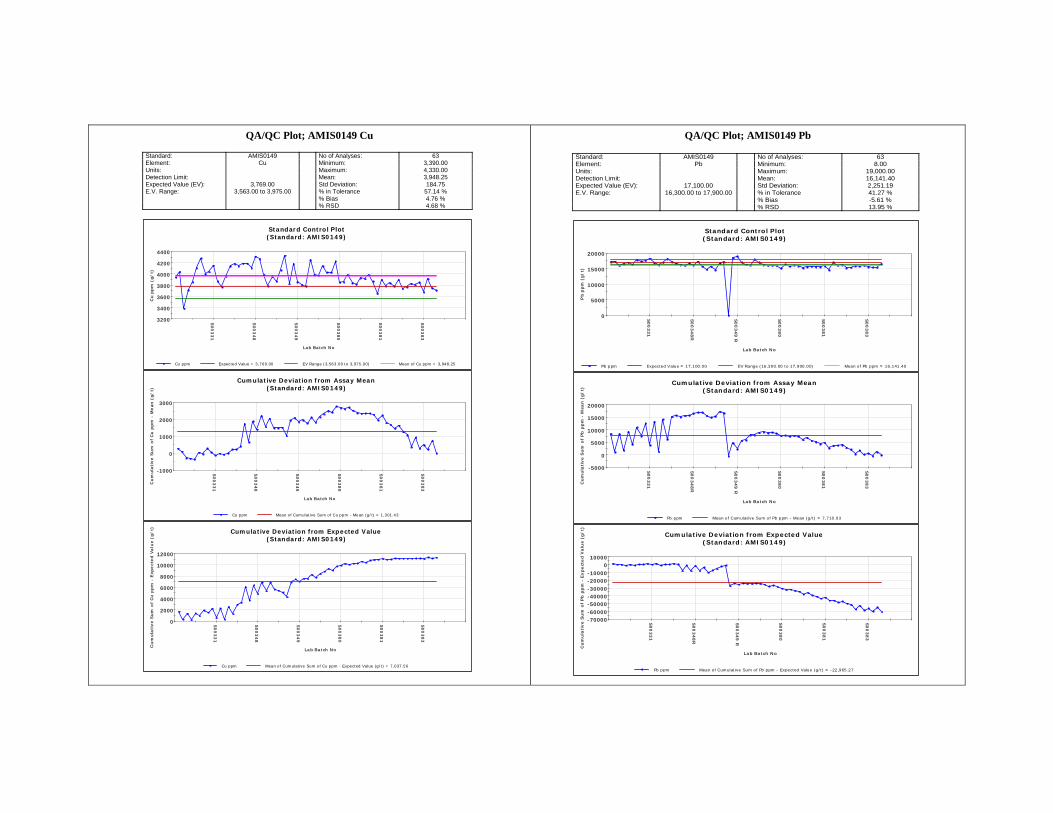
QA/QC Plot; AMIS0149 Cu
QA/QC Plot; AMIS0149 Pb
Standard: AMIS0149 No of Analyses: 63Element: Cu Minimum: 3,390.00Units: Maximum: 4,330.00Detection Limit: Mean: 3,948.25Expected Value (EV): 3,769.00 Std Deviation: 184.75E.V. Range: 3,563.00 to 3,975.00 % in Tolerance 57.14 %
% Bias 4.76 %% RSD 4.68 %
3200
3400
3600
3800
4000
4200
4400
S0
03
31
S0
03
48
S0
03
49
S0
03
80
S0
03
81
S0
03
83
Cu
pp
m (
g/
t)
Lab Batch No
Standard Control Plot(Standard: AMIS0149)
Cu ppm Expected Value = 3,769.00 EV Range (3,563.00 to 3,975.00) Mean of Cu ppm = 3,948.25
-1000
0
1000
2000
3000
S0
03
31
S0
03
48
S0
03
49
S0
03
80
S0
03
81
S0
03
83
Cu
mu
lati
ve S
um
of
Cu
pp
m -
Me
an
(g
/t)
Lab Batch No
Cumulative Deviation from Assay Mean(Standard: AMIS0149)
Cu ppm Mean of Cumulative Sum of Cu ppm - Mean (g/t) = 1,301.43
0
2000
4000
6000
8000
10000
12000
S0
03
31
S0
03
48
S0
03
49
S0
03
80
S0
03
81
S0
03
83
Cu
mu
lati
ve S
um
of
Cu
pp
m -
Exp
ecte
d V
alu
e (
g/
t)
Lab Batch No
Cumulative Deviation from Expected Value(Standard: AMIS0149)
Cu ppm Mean of Cumulative Sum of Cu ppm - Expected Value (g/t) = 7,037.56
Standard: AMIS0149 No of Analyses: 63Element: Pb Minimum: 8.00Units: Maximum: 19,000.00Detection Limit: Mean: 16,141.40Expected Value (EV): 17,100.00 Std Deviation: 2,251.19E.V. Range: 16,300.00 to 17,900.00 % in Tolerance 41.27 %
% Bias -5.61 %% RSD 13.95 %
0
5000
10000
15000
20000
S00
331
S00
348R
S00
349 R
S00
380
S00
381
S00
383
Pb p
pm
(g/t)
Lab Batch No
Standard Control Plot(Standard: AMIS0149)
Pb ppm Expected Value = 17,100.00 EV Range (16,300.00 to 17,900.00) Mean of Pb ppm = 16,141.40
-5000
0
5000
10000
15000
20000S00
331
S00
348R
S00
349 R
S00
380
S00
381
S00
383C
um
ula
tive S
um
of
Pb p
pm
- M
ean (
g/t)
Lab Batch No
Cumulative Deviation from Assay Mean(Standard: AMIS0149)
Pb ppm Mean of Cumulative Sum of Pb ppm - Mean (g/t) = 7,710.03
-70000-60000-50000-40000-30000-20000-10000
010000
S00
331
S00
348R
S00
349 R
S00
380
S00
381
S00
383
Cum
ula
tive S
um
of
Pb p
pm
- E
xpect
ed V
alu
e (
g/t)
Lab Batch No
Cumulative Deviation from Expected Value(Standard: AMIS0149)
Pb ppm Mean of Cumulative Sum of Pb ppm - Expected Value (g/t) = -22,965.27
( )
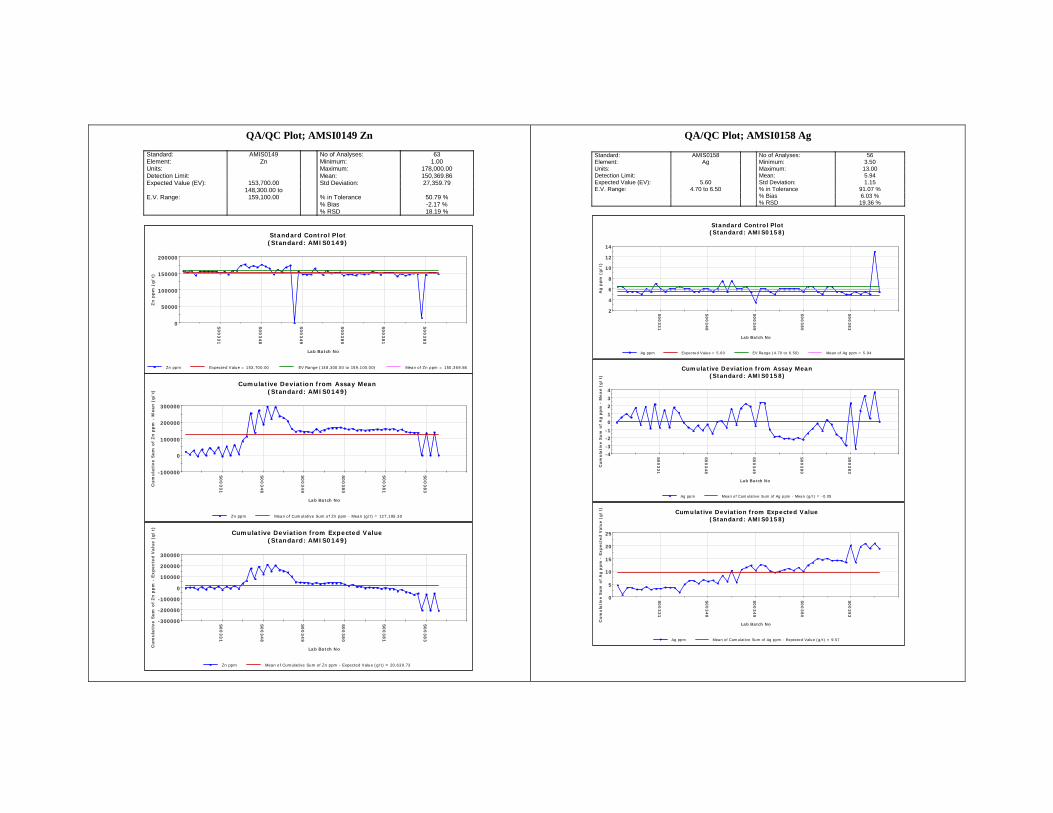
QA/QC Plot; AMSI0149 Zn
QA/QC Plot; AMSI0158 Ag
Standard: AMIS0149 No of Analyses: 63Element: Zn Minimum: 1.00Units: Maximum: 178,000.00Detection Limit: Mean: 150,369.86Expected Value (EV): 153,700.00 Std Deviation: 27,359.79
E.V. Range:148,300.00 to
159,100.00 % in Tolerance 50.79 %% Bias -2.17 %% RSD 18.19 %
0
50000
100000
150000
200000
S0
03
31
S0
03
48
S0
03
49
S0
03
80
S0
03
81
S0
03
83
Zn
pp
m (
g/
t)
Lab Batch No
Standard Control Plot(Standard: AMIS0149)
Zn ppm Expected Value = 153,700.00 EV Range (148,300.00 to 159,100.00) Mean of Zn ppm = 150,369.86
-100000
0
100000
200000
300000
S0
03
31
S0
03
48
S0
03
49
S0
03
80
S0
03
81
S0
03
83
Cu
mu
lati
ve S
um
of
Zn
pp
m -
Mea
n (
g/
t)
Lab Batch No
Cumulative Deviation from Assay Mean(Standard: AMIS0149)
Zn ppm Mean of Cumulative Sum of Zn ppm - Mean (g/t) = 127,195.30
-300000
-200000
-100000
0
100000
200000
300000
S0
03
31
S0
03
48
S0
03
49
S0
03
80
S0
03
81
S0
03
83
Cu
mu
lati
ve S
um
of
Zn
pp
m -
Ex
pecte
d V
alu
e (
g/
t)
Lab Batch No
Cumulative Deviation from Expected Value(Standard: AMIS0149)
Zn ppm Mean of Cumulative Sum of Zn ppm - Expected Value (g/t) = 20,630.73
Standard: AMIS0158 No of Analyses: 56Element: Ag Minimum: 3.50Units: Maximum: 13.00Detection Limit: Mean: 5.94Expected Value (EV): 5.60 Std Deviation: 1.15E.V. Range: 4.70 to 6.50 % in Tolerance 91.07 %
% Bias 6.03 %% RSD 19.36 %
2
4
6
8
10
12
14
S0
03
31
S0
03
48
S0
03
49
S0
03
80
S0
03
83
Ag p
pm
(g/
t)
Lab Batch No
Standard Control Plot(Standard: AMIS0158)
Ag ppm Expected Value = 5.60 EV Range (4.70 to 6.50) Mean of Ag ppm = 5.94
-4-3
-2-1
01
23
4S0
03
31
S0
03
48
S0
03
49
S0
03
80
S0
03
83
Cu
mula
tiv
e S
um
of
Ag p
pm
- M
ea
n (
g/
t)
Lab Batch No
Cumulative Deviation from Assay Mean(Standard: AMIS0158)
Ag ppm Mean of Cumulative Sum of Ag ppm - Mean (g/t) = -0.05
0
5
10
15
20
25
S0
03
31
S0
03
48
S0
03
49
S0
03
80
S0
03
83
Cum
ula
tiv
e S
um
of
Ag p
pm
- E
xp
ecte
d V
alu
e (
g/
t)
Lab Batch No
Cumulative Deviation from Expected Value(Standard: AMIS0158)
Ag ppm Mean of Cumulative Sum of Ag ppm - Expected Value (g/t) = 9.57
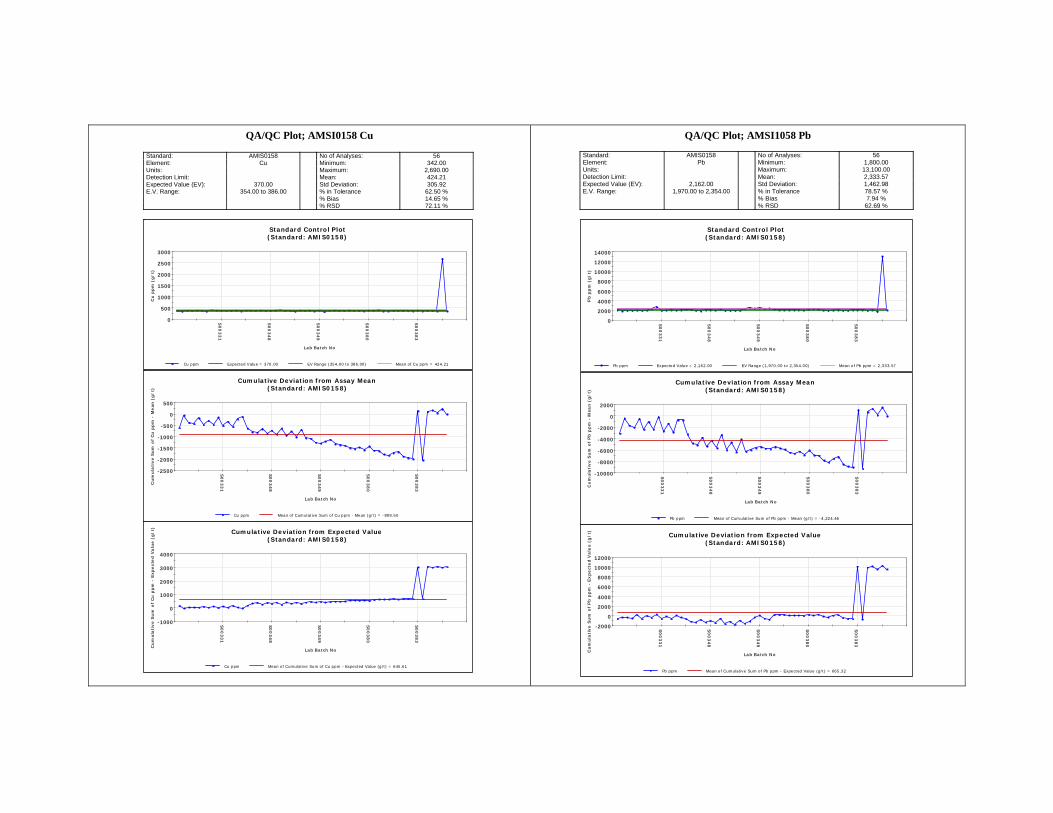
QA/QC Plot; AMSI0158 Cu
QA/QC Plot; AMSI1058 Pb
Standard: AMIS0158 No of Analyses: 56Element: Cu Minimum: 342.00Units: Maximum: 2,690.00Detection Limit: Mean: 424.21Expected Value (EV): 370.00 Std Deviation: 305.92E.V. Range: 354.00 to 386.00 % in Tolerance 62.50 %
% Bias 14.65 %% RSD 72.11 %
0
500
1000
1500
2000
2500
3000
S0
03
31
S0
03
48
S0
03
49
S0
03
80
S0
03
83
Cu
pp
m (
g/
t)
Lab Batch No
Standard Control Plot(Standard: AMIS0158)
Cu ppm Expected Value = 370.00 EV Range (354.00 to 386.00) Mean of Cu ppm = 424.21
-2500
-2000
-1500
-1000
-500
0
500
S0
03
31
S0
03
48
S0
03
49
S0
03
80
S0
03
83
Cu
mu
lati
ve S
um
of
Cu
pp
m -
Me
an
(g
/t)
Lab Batch No
Cumulative Deviation from Assay Mean(Standard: AMIS0158)
Cu ppm Mean of Cumulative Sum of Cu ppm - Mean (g/t) = -899.50
-1000
0
1000
2000
3000
4000
S0
03
31
S0
03
48
S0
03
49
S0
03
80
S0
03
83
Cu
mu
lati
ve S
um
of
Cu
pp
m -
Exp
ecte
d V
alu
e (
g/
t)
Lab Batch No
Cumulative Deviation from Expected Value(Standard: AMIS0158)
Cu ppm Mean of Cumulative Sum of Cu ppm - Expected Value (g/t) = 645.61
Standard: AMIS0158 No of Analyses: 56Element: Pb Minimum: 1,800.00Units: Maximum: 13,100.00Detection Limit: Mean: 2,333.57Expected Value (EV): 2,162.00 Std Deviation: 1,462.98E.V. Range: 1,970.00 to 2,354.00 % in Tolerance 78.57 %
% Bias 7.94 %% RSD 62.69 %
0
2000
4000
6000
8000
10000
12000
14000
S0
03
31
S0
03
48
S0
03
49
S0
03
80
S0
03
83
Pb p
pm
(g
/t)
Lab Batch No
Standard Control Plot(Standard: AMIS0158)
Pb ppm Expected Value = 2,162.00 EV Range (1,970.00 to 2,354.00) Mean of Pb ppm = 2,333.57
-10000
-8000
-6000
-4000
-2000
0
2000
S0
03
31
S0
03
48
S0
03
49
S0
03
80
S0
03
83
Cu
mula
tiv
e S
um
of
Pb p
pm
- M
ea
n (
g/
t)
Lab Batch No
Cumulative Deviation from Assay Mean(Standard: AMIS0158)
Pb ppm Mean of Cumulative Sum of Pb ppm - Mean (g/t) = -4,224.46
-2000
0
2000
4000
6000
8000
10000
12000
S0
03
31
S0
03
48
S0
03
49
S0
03
80
S0
03
83
Cu
mula
tive S
um
of
Pb p
pm
- E
xp
ect
ed V
alu
e (
g/
t)
Lab Batch No
Cumulative Deviation from Expected Value(Standard: AMIS0158)
Pb ppm Mean of Cumulative Sum of Pb ppm - Expected Value (g/t) = 665.32
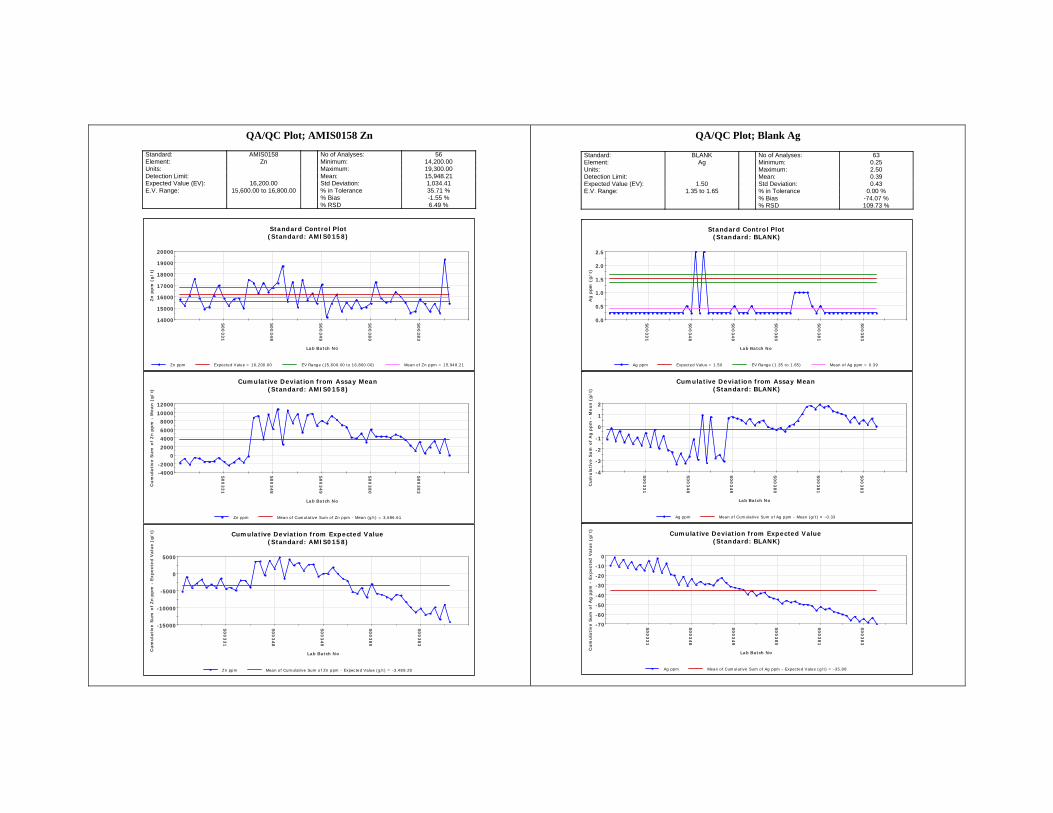
QA/QC Plot; AMIS0158 Zn
QA/QC Plot; Blank Ag
Standard: AMIS0158 No of Analyses: 56Element: Zn Minimum: 14,200.00Units: Maximum: 19,300.00Detection Limit: Mean: 15,948.21Expected Value (EV): 16,200.00 Std Deviation: 1,034.41E.V. Range: 15,600.00 to 16,800.00 % in Tolerance 35.71 %
% Bias -1.55 %% RSD 6.49 %
14000
15000
16000
17000
18000
19000
20000
S00
33
1
S00
34
8
S00
34
9
S00
38
0
S00
38
3
Zn
pp
m (
g/
t)
Lab Batch No
Standard Control Plot(Standard: AMIS0158)
Zn ppm Expected Value = 16,200.00 EV Range (15,600.00 to 16,800.00) Mean of Zn ppm = 15,948.21
-4000-2000
02000
40006000
800010000
12000
S0
033
1
S0
034
8
S0
034
9
S0
038
0
S0
038
3
Cu
mula
tiv
e S
um
of
Zn p
pm
- M
ea
n (
g/
t)
Lab Batch No
Cumulative Deviation from Assay Mean(Standard: AMIS0158)
Zn ppm Mean of Cumulative Sum of Zn ppm - Mean (g/t) = 3,686.61
-15000
-10000
-5000
0
5000
S0
03
31
S0
03
48
S0
03
49
S0
03
80
S0
03
83
Cu
mu
lati
ve S
um
of
Zn
pp
m -
Exp
ecte
d V
alu
e (
g/
t)
Lab Batch No
Cumulative Deviation from Expected Value(Standard: AMIS0158)
Zn ppm Mean of Cumulative Sum of Zn ppm - Expected Value (g/t) = -3,489.29
Standard: BLANK No of Analyses: 63Element: Ag Minimum: 0.25Units: Maximum: 2.50Detection Limit: Mean: 0.39Expected Value (EV): 1.50 Std Deviation: 0.43E.V. Range: 1.35 to 1.65 % in Tolerance 0.00 %
% Bias -74.07 %% RSD 109.73 %
0.0
0.5
1.0
1.5
2.0
2.5
S0
033
1
S0
034
8
S0
034
9
S0
038
0
S0
038
1
S0
038
3
Ag p
pm
(g/
t)
Lab Batch No
Standard Control Plot(Standard: BLANK)
Ag ppm Expected Value = 1.50 EV Range (1.35 to 1.65) Mean of Ag ppm = 0.39
-4
-3
-2
-1
0
1
2S
00
331
S00
348
S00
349
S00
380
S00
381
S00
383
Cum
ula
tive S
um
of
Ag
pp
m -
Me
an
(g
/t)
Lab Batch No
Cumulative Deviation from Assay Mean(Standard: BLANK)
Ag ppm Mean of Cumulative Sum of Ag ppm - Mean (g/t) = -0.33
-70
-60
-50
-40
-30
-20
-10
0
S0
03
31
S0
03
48
S0
03
49
S0
03
80
S0
03
81
S0
03
83
Cum
ula
tive S
um
of
Ag
pp
m -
Exp
ecte
d V
alu
e (
g/t)
Lab Batch No
Cumulative Deviation from Expected Value(Standard: BLANK)
Ag ppm Mean of Cumulative Sum of Ag ppm - Expected Value (g/t) = -35.88
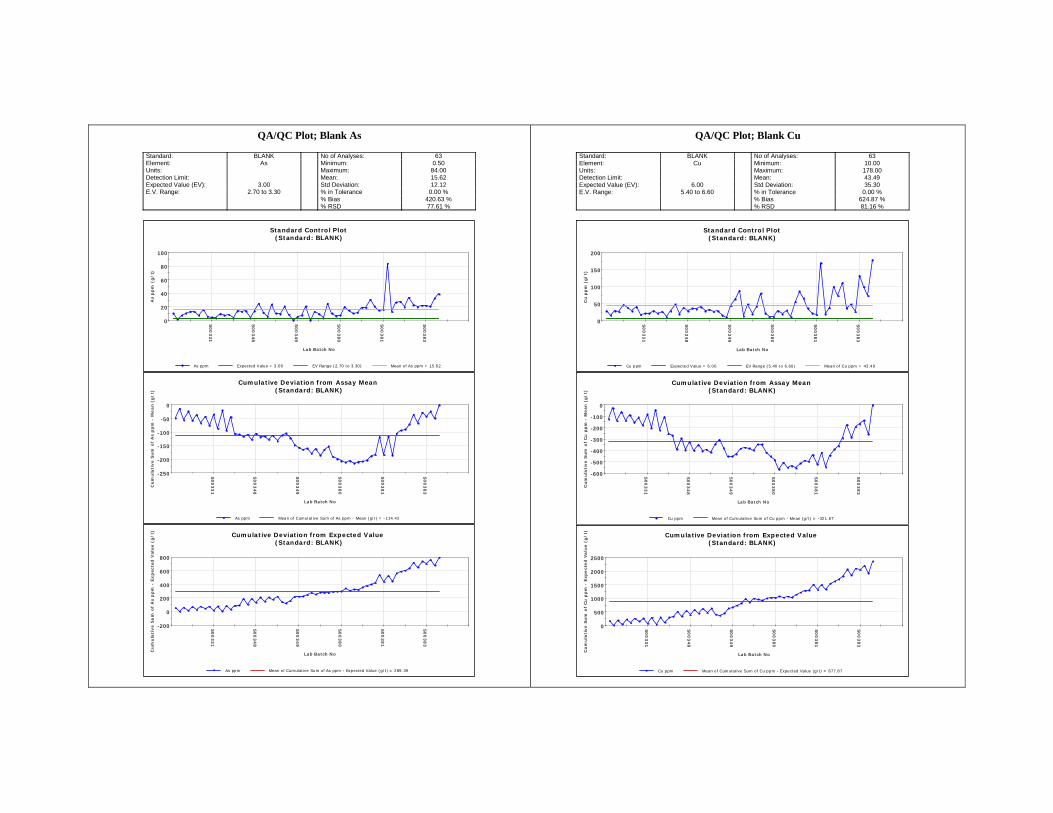
QA/QC Plot; Blank As
QA/QC Plot; Blank Cu
Standard: BLANK No of Analyses: 63Element: As Minimum: 0.50Units: Maximum: 84.00Detection Limit: Mean: 15.62Expected Value (EV): 3.00 Std Deviation: 12.12E.V. Range: 2.70 to 3.30 % in Tolerance 0.00 %
% Bias 420.63 %% RSD 77.61 %
0
20
40
60
80
100
S00
331
S00
348
S00
349
S00
380
S00
381
S00
383
As p
pm
(g
/t)
Lab Batch No
Standard Control Plot(Standard: BLANK)
As ppm Expected Value = 3.00 EV Range (2.70 to 3.30) Mean of As ppm = 15.62
-250
-200
-150
-100
-50
0
S00
33
1
S00
34
8
S00
34
9
S00
38
0
S00
38
1
S00
38
3
Cum
ula
tive S
um
of
As p
pm
- M
ean
(g
/t)
Lab Batch No
Cumulative Deviation from Assay Mean(Standard: BLANK)
As ppm Mean of Cumulative Sum of As ppm - Mean (g/t) = -114.42
-200
0
200
400
600
800
S0
033
1
S0
034
8
S0
034
9
S0
038
0
S0
038
1
S0
038
3
Cum
ula
tive S
um
of
As p
pm
- E
xp
ecte
d V
alu
e (
g/
t)
Lab Batch No
Cumulative Deviation from Expected Value(Standard: BLANK)
As ppm Mean of Cumulative Sum of As ppm - Expected Value (g/t) = 289.39
Standard: BLANK No of Analyses: 63Element: Cu Minimum: 10.00Units: Maximum: 178.00Detection Limit: Mean: 43.49Expected Value (EV): 6.00 Std Deviation: 35.30E.V. Range: 5.40 to 6.60 % in Tolerance 0.00 %
% Bias 624.87 %% RSD 81.16 %
0
50
100
150
200
S0
03
31
S0
03
48
S0
03
49
S0
03
80
S0
03
81
S0
03
83
Cu
pp
m (
g/
t)
Lab Batch No
Standard Control Plot(Standard: BLANK)
Cu ppm Expected Value = 6.00 EV Range (5.40 to 6.60) Mean of Cu ppm = 43.49
-600
-500
-400
-300
-200
-100
0S
00
33
1
S0
03
48
S0
03
49
S0
03
80
S0
03
81
S0
03
83
Cum
ula
tiv
e S
um
of
Cu
pp
m -
Mean
(g
/t)
Lab Batch No
Cumulative Deviation from Assay Mean(Standard: BLANK)
Cu ppm Mean of Cumulative Sum of Cu ppm - Mean (g/t) = -321.87
0
500
1000
1500
2000
2500
S0
03
31
S0
03
48
S0
03
49
S0
03
80
S0
03
81
S0
03
83
Cu
mu
lati
ve S
um
of
Cu p
pm
- E
xp
ecte
d V
alu
e (
g/
t)
Lab Batch No
Cumulative Deviation from Expected Value(Standard: BLANK)
Cu ppm Mean of Cumulative Sum of Cu ppm - Expected Value (g/t) = 877.87

QA/QC Plot; Blank Pb
QA/QC Plot; Blank Zn
Standard: BLANK No of Analyses: 63Element: Pb Minimum: 0.50Units: Maximum: 344.00Detection Limit: Mean: 77.75Expected Value (EV): 3.00 Std Deviation: 66.18E.V. Range: 2.70 to 3.30 % in Tolerance 0.00 %
% Bias 2,491.80 %% RSD 85.12 %
0
100
200
300
400
S0
03
31
S0
03
48
S0
03
49
S0
03
80
S0
03
81
S0
03
83
Pb p
pm
(g/
t)
Lab Batch No
Standard Control Plot(Standard: BLANK)
Pb ppm Expected Value = 3.00 EV Range (2.70 to 3.30) Mean of Pb ppm = 77.75
-1000
-800
-600
-400
-200
0
200
S0
03
31
S0
03
48
S0
03
49
S0
03
80
S0
03
81
S0
03
83
Cu
mula
tiv
e S
um
of
Pb
ppm
- M
ea
n (
g/t)
Lab Batch No
Cumulative Deviation from Assay Mean(Standard: BLANK)
Pb ppm Mean of Cumulative Sum of Pb ppm - Mean (g/t) = -526.17
0
1000
2000
3000
4000
5000
S0
03
31
S0
03
48
S0
03
49
S0
03
80
S0
03
81
S0
03
83
Cum
ula
tiv
e S
um
of
Pb p
pm
- E
xp
ect
ed V
alu
e (
g/t)
Lab Batch No
Cumulative Deviation from Expected Value(Standard: BLANK)
Pb ppm Mean of Cumulative Sum of Pb ppm - Expected Value (g/t) = 1,865.96
Standard: BLANK No of Analyses: 63Element: Zn Minimum: 1.00Units: Maximum: 398.00Detection Limit: Mean: 78.62Expected Value (EV): 6.00 Std Deviation: 86.82E.V. Range: 5.40 to 6.60 % in Tolerance 0.00 %
% Bias 1,210.32 %% RSD 110.43 %
0
100
200
300
400
S0
033
1
S0
034
8
S0
034
9
S0
038
0
S0
038
1
S0
038
3
Zn p
pm
(g/
t)
Lab Batch No
Standard Control Plot(Standard: BLANK)
Zn ppm Expected Value = 6.00 EV Range (5.40 to 6.60) Mean of Zn ppm = 78.62
-1400
-1200
-1000
-800
-600
-400
-200
0S00
331
S00
348
S00
349
S00
380
S00
381
S00
383
Cum
ula
tive S
um
of
Zn p
pm
- M
ean
(g/
t)
Lab Batch No
Cumulative Deviation from Assay Mean(Standard: BLANK)
Zn ppm Mean of Cumulative Sum of Zn ppm - Mean (g/t) = -738.32
0
1000
2000
3000
4000
5000
S00
331
S00
348
S00
349
S00
380
S00
381
S00
383
Cum
ula
tive S
um
of
Zn p
pm
- E
xpecte
d V
alu
e (
g/t)
Lab Batch No
Cumulative Deviation from Expected Value(Standard: BLANK)
Zn ppm Mean of Cumulative Sum of Zn ppm - Expected Value (g/t) = 1,585.49
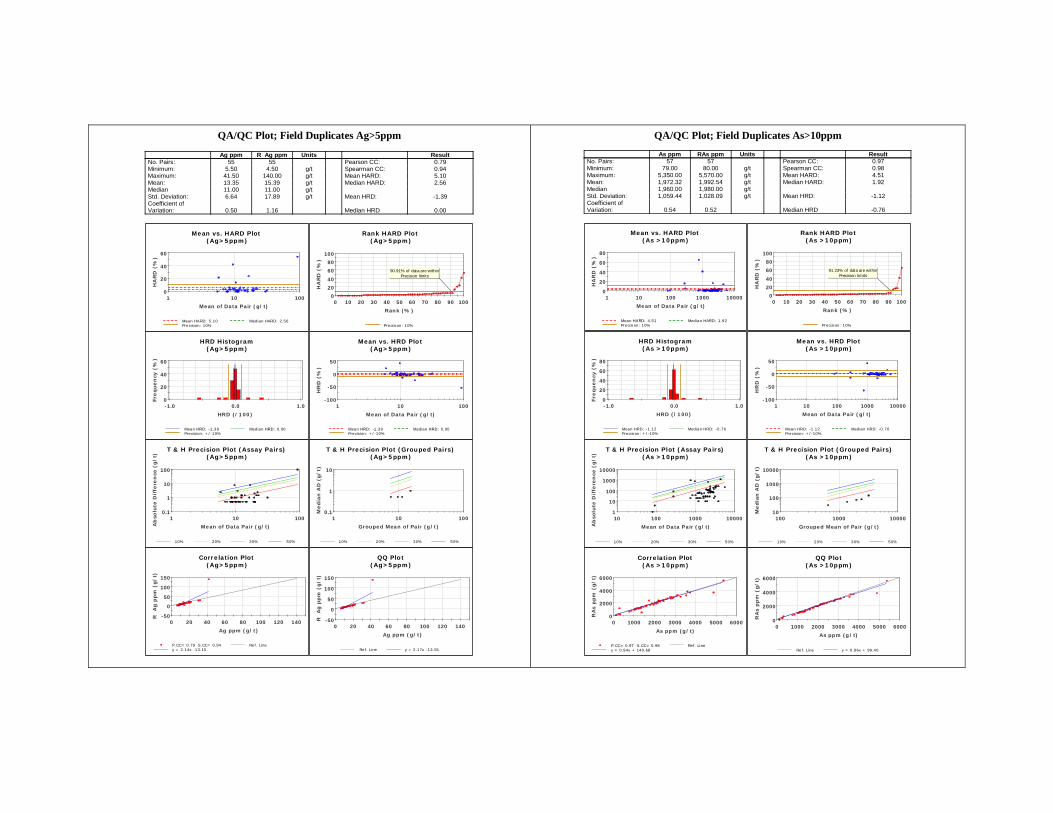
QA/QC Plot; Field Duplicates Ag>5ppm
QA/QC Plot; Field Duplicates As>10ppm
Ag ppm R Ag ppm Units ResultNo. Pairs: 55 55 Pearson CC: 0.79Minimum: 5.50 4.50 g/t Spearman CC: 0.94Maximum: 41.50 140.00 g/t Mean HARD: 5.10Mean: 13.35 15.39 g/t Median HARD: 2.56Median 11.00 11.00 g/tStd. Deviation: 6.64 17.89 g/t Mean HRD: -1.39Coefficient of Variation: 0.50 1.16 Median HRD 0.00
0
20
40
60
1 10 100
HA
RD
(%
)
Mean of Data Pair (g/t)
Mean vs. HARD Plot(Ag>5ppm)
Mean HARD: 5.10 Median HARD: 2.56Precision: 10%
0
20
40
60
80
100
0 10 20 30 40 50 60 70 80 90 100
HA
RD
(%
)
Rank (%)
Rank HARD Plot(Ag>5ppm)
Precision: 10%
90.91% of data are withinPrecision limits
0
20
40
60
-1.0 0.0 1.0
Fre
quen
cy (
%)
HRD (/100)
HRD Histogram(Ag>5ppm)
Mean HRD: -1.39 Median HRD: 0.00Precision: +/-10%
-100
-50
0
50
1 10 100
HR
D (
%)
Mean of Data Pair (g/t)
Mean vs. HRD Plot(Ag>5ppm)
Mean HRD: -1.39 Median HRD: 0.00Precision: +/-10%
0.1
1
10
100
1 10 100
Ab
solu
te D
iffe
ren
ce (
g/t)
Mean of Data Pair (g/t)
T & H Precision Plot (Assay Pairs)(Ag>5ppm)
10% 20% 30% 50%
0.1
1
10
1 10 100
Media
n A
D (
g/t)
Grouped Mean of Pair (g/t)
T & H Precision Plot (Grouped Pairs)(Ag>5ppm)
10% 20% 30% 50%
-50
0
50
100
150
0 20 40 60 80 100 120 140
R A
g p
pm
(g/t)
Ag ppm (g/t)
Correlation Plot(Ag>5ppm)
P.CC= 0.79 S.CC= 0.94 Ref. Liney = 2.14x -13.15
-50
0
50
100
150
0 20 40 60 80 100 120 140
R A
g p
pm
(g/t)
Ag ppm (g/t)
QQ Plot(Ag>5ppm)
Ref. Line y = 2.17x -13.55
As ppm RAs ppm Units ResultNo. Pairs: 57 57 Pearson CC: 0.97Minimum: 79.00 80.00 g/t Spearman CC: 0.98Maximum: 5,350.00 5,570.00 g/t Mean HARD: 4.51Mean: 1,972.32 1,992.54 g/t Median HARD: 1.92Median 1,960.00 1,980.00 g/tStd. Deviation: 1,059.44 1,028.09 g/t Mean HRD: -1.12Coefficient of Variation: 0.54 0.52 Median HRD -0.76
0
20
40
60
80
1 10 100 1000 10000
HA
RD
(%
)
Mean of Data Pair (g/t)
Mean vs. HARD Plot(As >10ppm)
Mean HARD: 4.51 Median HARD: 1.92Precision: 10%
0
20
40
60
80
100
0 10 20 30 40 50 60 70 80 90 100
HA
RD
(%
)
Rank (%)
Rank HARD Plot(As >10ppm)
Precision: 10%
91.23% of data are withinPrecision limits
0
20
40
60
80
-1.0 0.0 1.0
Fre
quen
cy (
%)
HRD (/100)
HRD Histogram(As >10ppm)
Mean HRD: -1.12 Median HRD: -0.76Precision: +/-10%
-100
-50
0
50
1 10 100 1000 10000
HR
D (
%)
Mean of Data Pair (g/t)
Mean vs. HRD Plot(As >10ppm)
Mean HRD: -1.12 Median HRD: -0.76Precision: +/-10%
1
10
100
1000
10000
10 100 1000 10000
Ab
solu
te D
iffe
ren
ce (
g/t)
Mean of Data Pair (g/t)
T & H Precision Plot (Assay Pairs)(As >10ppm)
10% 20% 30% 50%
10
100
1000
10000
100 1000 10000
Media
n A
D (
g/t)
Grouped Mean of Pair (g/t)
T & H Precision Plot (Grouped Pairs)(As >10ppm)
10% 20% 30% 50%
0
2000
4000
6000
0 1000 2000 3000 4000 5000 6000
RA
s ppm
(g/t)
As ppm (g/t)
Correlation Plot(As >10ppm)
P.CC= 0.97 S.CC= 0.98 Ref. Liney = 0.94x + 140.68
0
2000
4000
6000
0 1000 2000 3000 4000 5000 6000
RA
s ppm
(g/t)
As ppm (g/t)
QQ Plot(As >10ppm)
Ref. Line y = 0.96x + 99.40
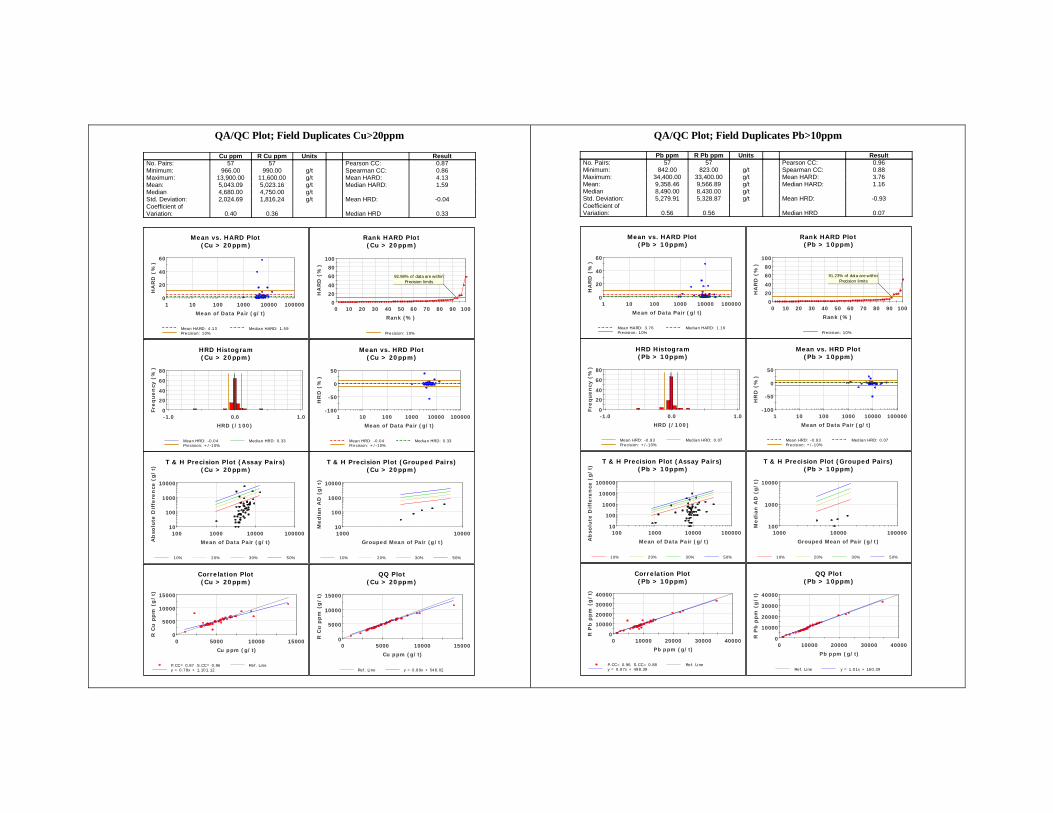
QA/QC Plot; Field Duplicates Cu>20ppm
QA/QC Plot; Field Duplicates Pb>10ppm
Cu ppm R Cu ppm Units ResultNo. Pairs: 57 57 Pearson CC: 0.87Minimum: 966.00 990.00 g/t Spearman CC: 0.86Maximum: 13,900.00 11,600.00 g/t Mean HARD: 4.13Mean: 5,043.09 5,023.16 g/t Median HARD: 1.59Median 4,680.00 4,750.00 g/tStd. Deviation: 2,024.69 1,816.24 g/t Mean HRD: -0.04Coefficient of Variation: 0.40 0.36 Median HRD 0.33
0
20
40
60
1 10 100 1000 10000 100000
HA
RD
(%
)
Mean of Data Pair (g/t)
Mean vs. HARD Plot(Cu > 20ppm)
Mean HARD: 4.13 Median HARD: 1.59Precision: 10%
0
20
40
60
80
100
0 10 20 30 40 50 60 70 80 90 100
HA
RD
(%
)Rank (%)
Rank HARD Plot(Cu > 20ppm)
Precision: 10%
92.98% of data are withinPrecision limits
0
20
40
60
80
-1.0 0.0 1.0
Fre
qu
en
cy (
%)
HRD (/100)
HRD Histogram(Cu > 20ppm)
Mean HRD: -0.04 Median HRD: 0.33Precision: +/-10%
-100
-50
0
50
1 10 100 1000 10000 100000
HR
D (
%)
Mean of Data Pair (g/t)
Mean vs. HRD Plot(Cu > 20ppm)
Mean HRD: -0.04 Median HRD: 0.33Precision: +/-10%
10
100
1000
10000
100 1000 10000 100000
Ab
solu
te D
iffe
ren
ce (
g/
t)
Mean of Data Pair (g/t)
T & H Precision Plot (Assay Pairs)(Cu > 20ppm)
10% 20% 30% 50%
10
100
1000
10000
1000 10000
Me
dia
n A
D (
g/
t)
Grouped Mean of Pair (g/t)
T & H Precision Plot (Grouped Pairs)(Cu > 20ppm)
10% 20% 30% 50%
0
5000
10000
15000
0 5000 10000 15000
R C
u p
pm
(g
/t)
Cu ppm (g/t)
Correlation Plot(Cu > 20ppm)
P.CC= 0.87 S.CC= 0.86 Ref. Liney = 0.78x + 1,101.12
0
5000
10000
15000
0 5000 10000 15000
R C
u p
pm
(g
/t)
Cu ppm (g/t)
QQ Plot(Cu > 20ppm)
Ref. Line y = 0.89x + 548.02
Pb ppm R Pb ppm Units ResultNo. Pairs: 57 57 Pearson CC: 0.96Minimum: 842.00 823.00 g/t Spearman CC: 0.88Maximum: 34,400.00 33,400.00 g/t Mean HARD: 3.76Mean: 9,358.46 9,566.89 g/t Median HARD: 1.16Median 8,490.00 8,430.00 g/tStd. Deviation: 5,279.91 5,328.87 g/t Mean HRD: -0.93Coefficient of Variation: 0.56 0.56 Median HRD 0.07
0
20
40
60
1 10 100 1000 10000 100000
HA
RD
(%
)
Mean of Data Pair (g/t)
Mean vs. HARD Plot(Pb > 10ppm)
Mean HARD: 3.76 Median HARD: 1.16Precision: 10%
0
20
40
60
80
100
0 10 20 30 40 50 60 70 80 90 100
HA
RD
(%
)
Rank (%)
Rank HARD Plot(Pb > 10ppm)
Precision: 10%
91.23% of data are withinPrecision limits
0
20
40
60
80
-1.0 0.0 1.0
Fre
qu
en
cy (
%)
HRD (/100)
HRD Histogram(Pb > 10ppm)
Mean HRD: -0.93 Median HRD: 0.07Precision: +/-10%
-100
-50
0
50
1 10 100 1000 10000 100000
HR
D (
%)
Mean of Data Pair (g/t)
Mean vs. HRD Plot(Pb > 10ppm)
Mean HRD: -0.93 Median HRD: 0.07Precision: +/-10%
10
100
1000
10000
100000
100 1000 10000 100000
Ab
solu
te D
iffe
ren
ce (
g/
t)
Mean of Data Pair (g/t)
T & H Precision Plot (Assay Pairs)(Pb > 10ppm)
10% 20% 30% 50%
100
1000
10000
1000 10000 100000
Me
dia
n A
D (
g/t)
Grouped Mean of Pair (g/t)
T & H Precision Plot (Grouped Pairs)(Pb > 10ppm)
10% 20% 30% 50%
0
10000
20000
30000
40000
0 10000 20000 30000 40000
R P
b p
pm
(g
/t)
Pb ppm (g/t)
Correlation Plot(Pb > 10ppm)
P.CC= 0.96 S.CC= 0.88 Ref. Liney = 0.97x + 498.39
0
10000
20000
30000
40000
0 10000 20000 30000 40000
R P
b p
pm
(g
/t)
Pb ppm (g/t)
QQ Plot(Pb > 10ppm)
Ref. Line y = 1.01x + 160.39
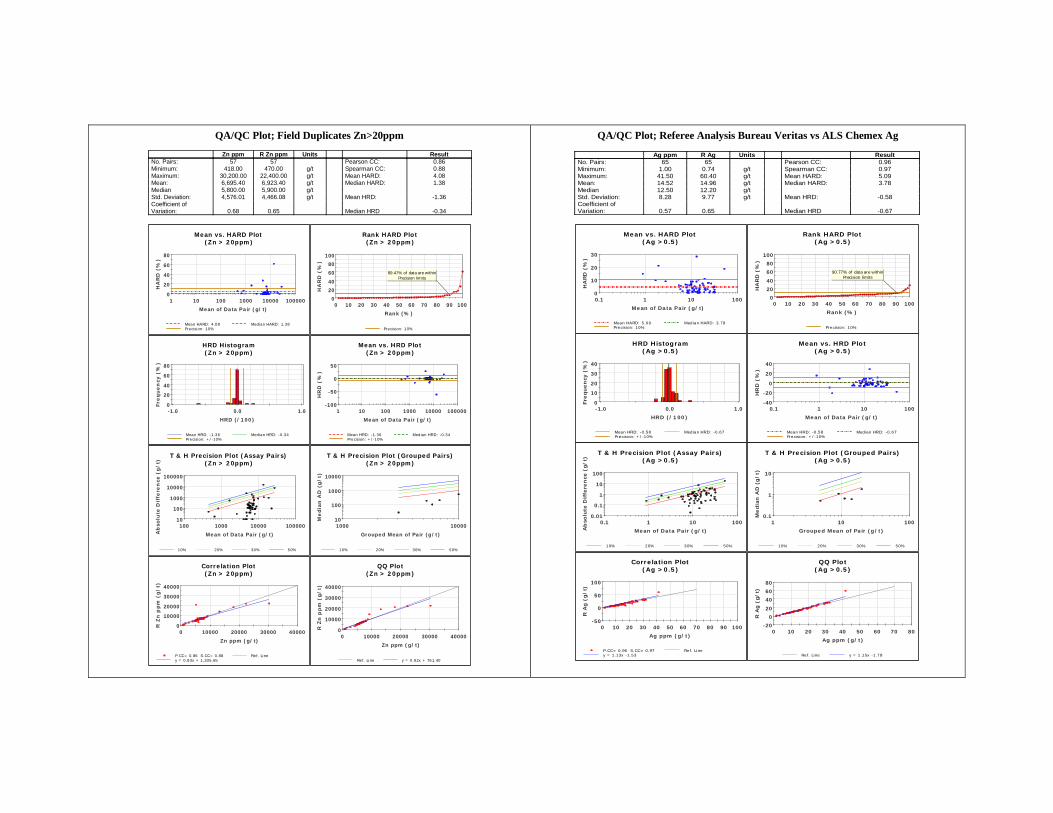
QA/QC Plot; Field Duplicates Zn>20ppm
QA/QC Plot; Referee Analysis Bureau Veritas vs ALS Chemex Ag
Zn ppm R Zn ppm Units ResultNo. Pairs: 57 57 Pearson CC: 0.86Minimum: 418.00 470.00 g/t Spearman CC: 0.88Maximum: 30,200.00 22,400.00 g/t Mean HARD: 4.08Mean: 6,695.40 6,923.40 g/t Median HARD: 1.38Median 5,800.00 5,900.00 g/tStd. Deviation: 4,576.01 4,466.08 g/t Mean HRD: -1.36Coefficient of Variation: 0.68 0.65 Median HRD -0.34
0
20
40
60
80
1 10 100 1000 10000 100000
HA
RD
(%
)
Mean of Data Pair (g/t)
Mean vs. HARD Plot(Zn > 20ppm)
Mean HARD: 4.08 Median HARD: 1.38Precision: 10%
0
20
40
60
80
100
0 10 20 30 40 50 60 70 80 90 100
HA
RD
(%
)Rank (%)
Rank HARD Plot(Zn > 20ppm)
Precision: 10%
89.47% of data are withinPrecision limits
0
20
40
60
80
-1.0 0.0 1.0
Fre
qu
en
cy (
%)
HRD (/100)
HRD Histogram(Zn > 20ppm)
Mean HRD: -1.36 Median HRD: -0.34Precision: +/-10%
-100
-50
0
50
1 10 100 1000 10000 100000
HR
D (
%)
Mean of Data Pair (g/t)
Mean vs. HRD Plot(Zn > 20ppm)
Mean HRD: -1.36 Median HRD: -0.34Precision: +/-10%
10
100
1000
10000
100000
100 1000 10000 100000
Ab
solu
te D
iffe
ren
ce (
g/
t)
Mean of Data Pair (g/t)
T & H Precision Plot (Assay Pairs)(Zn > 20ppm)
10% 20% 30% 50%
10
100
1000
10000
1000 10000
Me
dia
n A
D (
g/
t)
Grouped Mean of Pair (g/t)
T & H Precision Plot (Grouped Pairs)(Zn > 20ppm)
10% 20% 30% 50%
0
10000
20000
30000
40000
0 10000 20000 30000 40000
R Z
n p
pm
(g
/t)
Zn ppm (g/t)
Correlation Plot(Zn > 20ppm)
P.CC= 0.86 S.CC= 0.88 Ref. Liney = 0.83x + 1,335.65
0
10000
20000
30000
40000
0 10000 20000 30000 40000
R Z
n p
pm
(g
/t)
Zn ppm (g/t)
QQ Plot(Zn > 20ppm)
Ref. Line y = 0.92x + 761.40
Ag ppm R Ag Units ResultNo. Pairs: 65 65 Pearson CC: 0.96Minimum: 1.00 0.74 g/t Spearman CC: 0.97Maximum: 41.50 60.40 g/t Mean HARD: 5.09Mean: 14.52 14.96 g/t Median HARD: 3.78Median 12.50 12.20 g/tStd. Deviation: 8.28 9.77 g/t Mean HRD: -0.58Coefficient of Variation: 0.57 0.65 Median HRD -0.67
0
10
20
30
0.1 1 10 100
HA
RD
(%
)
Mean of Data Pair (g/t)
Mean vs. HARD Plot(Ag >0.5)
Mean HARD: 5.09 Median HARD: 3.78Precision: 10%
0
20
40
60
80
100
0 10 20 30 40 50 60 70 80 90 100
HA
RD
(%
)
Rank (%)
Rank HARD Plot(Ag >0.5)
Precision: 10%
90.77% of data are withinPrecision limits
0
10
20
30
40
-1.0 0.0 1.0
Fre
quen
cy (
%)
HRD (/100)
HRD Histogram(Ag >0.5)
Mean HRD: -0.58 Median HRD: -0.67Precision: +/-10%
-40
-20
0
20
40
0.1 1 10 100
HR
D (
%)
Mean of Data Pair (g/t)
Mean vs. HRD Plot(Ag >0.5)
Mean HRD: -0.58 Median HRD: -0.67Precision: +/-10%
0.01
0.1
1
10
100
0.1 1 10 100
Ab
solu
te D
iffe
ren
ce (
g/t)
Mean of Data Pair (g/t)
T & H Precision Plot (Assay Pairs)(Ag >0.5)
10% 20% 30% 50%
0.1
1
10
1 10 100
Media
n A
D (
g/t)
Grouped Mean of Pair (g/t)
T & H Precision Plot (Grouped Pairs)(Ag >0.5)
10% 20% 30% 50%
-50
0
50
100
0 10 20 30 40 50 60 70 80 90 100
R A
g (
g/t)
Ag ppm (g/t)
Correlation Plot(Ag >0.5)
P.CC= 0.96 S.CC= 0.97 Ref. Liney = 1.13x -1.53
-20
0
20
40
60
80
0 10 20 30 40 50 60 70 80
R A
g (
g/t)
Ag ppm (g/t)
QQ Plot(Ag >0.5)
Ref. Line y = 1.15x -1.78

QA/QC Plot; Analysis Bureau Veritas vs ALS Chemex As
QA/QC Plot; Analysis Bureau Veritas vs ALS Chemex Bi
As ppm R As Units ResultNo. Pairs: 65 65 Pearson CC: 0.98Minimum: 20.00 22.90 g/t Spearman CC: 0.97Maximum: 7,160.00 8,520.00 g/t Mean HARD: 6.39Mean: 1,886.77 2,100.47 g/t Median HARD: 5.11Median 1,960.00 2,250.00 g/tStd. Deviation: 1,318.20 1,492.55 g/t Mean HRD: -4.73Coefficient of Variation: 0.70 0.71 Median HRD -4.63
0
10
20
30
1 10 100 1000 10000
HA
RD
(%
)
Mean of Data Pair (g/t)
Mean vs. HARD Plot(As>1)
Mean HARD: 6.39 Median HARD: 5.11Precision: 10%
0
20
40
60
80
100
0 10 20 30 40 50 60 70 80 90 100
HA
RD
(%
)Rank (%)
Rank HARD Plot(As>1)
Precision: 10%
75.38% of data are withinPrecision limits
0
10
20
30
40
-1.0 0.0 1.0
Fre
quen
cy (
%)
HRD (/100)
HRD Histogram(As>1)
Mean HRD: -4.73 Median HRD: -4.63Precision: +/-10%
-20
0
20
40
1 10 100 1000 10000
HR
D (
%)
Mean of Data Pair (g/t)
Mean vs. HRD Plot(As>1)
Mean HRD: -4.73 Median HRD: -4.63Precision: +/-10%
1
10
100
1000
10000
10 100 1000 10000
Abso
lute
Diffe
rence
(g/t)
Mean of Data Pair (g/t)
T & H Precision Plot (Assay Pairs)(As>1)
10% 20% 30% 50%
1
10
100
1000
10000
100 1000 10000
Media
n A
D (
g/t)
Grouped Mean of Pair (g/t)
T & H Precision Plot (Grouped Pairs)(As>1)
10% 20% 30% 50%
0
5000
10000
0 2000 4000 6000 8000 10000
R A
s (
g/t)
As ppm (g/t)
Correlation Plot(As>1)
P.CC= 0.98 S.CC= 0.97 Ref. Liney = 1.11x + 2.89
-5000
0
5000
10000
0 2000 4000 6000 8000 10000
R A
s (
g/t)
As ppm (g/t)
QQ Plot(As>1)
Ref. Line y = 1.13x -26.36
Bi ppm R Bi Units ResultNo. Pairs: 42 42 Pearson CC: 1.00Minimum: 0.10 0.10 g/t Spearman CC: 0.97Maximum: 5.70 5.51 g/t Mean HARD: 16.26Mean: 1.03 0.94 g/t Median HARD: 15.32Median 0.30 0.18 g/tStd. Deviation: 1.71 1.69 g/t Mean HRD: 15.09Coefficient of Variation: 1.65 1.80 Median HRD 15.32
0
20
40
60
0.1 1 10
HA
RD
(%
)
Mean of Data Pair (g/t)
Mean vs. HARD Plot(Bi>0.1)
Mean HARD: 16.26 Median HARD: 15.32Precision: 10%
0
20
40
60
80
100
0 10 20 30 40 50 60 70 80 90 100
HA
RD
(%
)
Rank (%)
Rank HARD Plot(Bi>0.1)
Precision: 10%
40.48% of data are withinPrecision limits
0
5
10
15
20
-1.0 0.0 1.0
Fre
quen
cy (
%)
HRD (/100)
HRD Histogram(Bi>0.1)
Mean HRD: 15.09 Median HRD: 15.32Precision: +/-10%
-20
0
20
40
60
0.1 1 10
HR
D (
%)
Mean of Data Pair (g/t)
Mean vs. HRD Plot(Bi>0.1)
Mean HRD: 15.09 Median HRD: 15.32Precision: +/-10%
0.01
0.1
1
10
0.1 1 10
Abso
lute
Dif
fere
nce
(g/t)
Mean of Data Pair (g/t)
T & H Precision Plot (Assay Pairs)(Bi>0.1)
10% 20% 30% 50%
0.01
0.1
1
0.1 1 10
Media
n A
D (
g/t)
Grouped Mean of Pair (g/t)
T & H Precision Plot (Grouped Pairs)(Bi>0.1)
10% 20% 30% 50%
0
2
4
6
0 1 2 3 4 5 6
R B
i (g
/t)
Bi ppm (g/t)
Correlation Plot(Bi>0.1)
P.CC= 1.00 S.CC= 0.97 Ref. Liney = 0.99x -0.08
0
2
4
6
0 1 2 3 4 5 6
R B
i (g
/t)
Bi ppm (g/t)
QQ Plot(Bi>0.1)
Ref. Line y = 0.99x -0.08
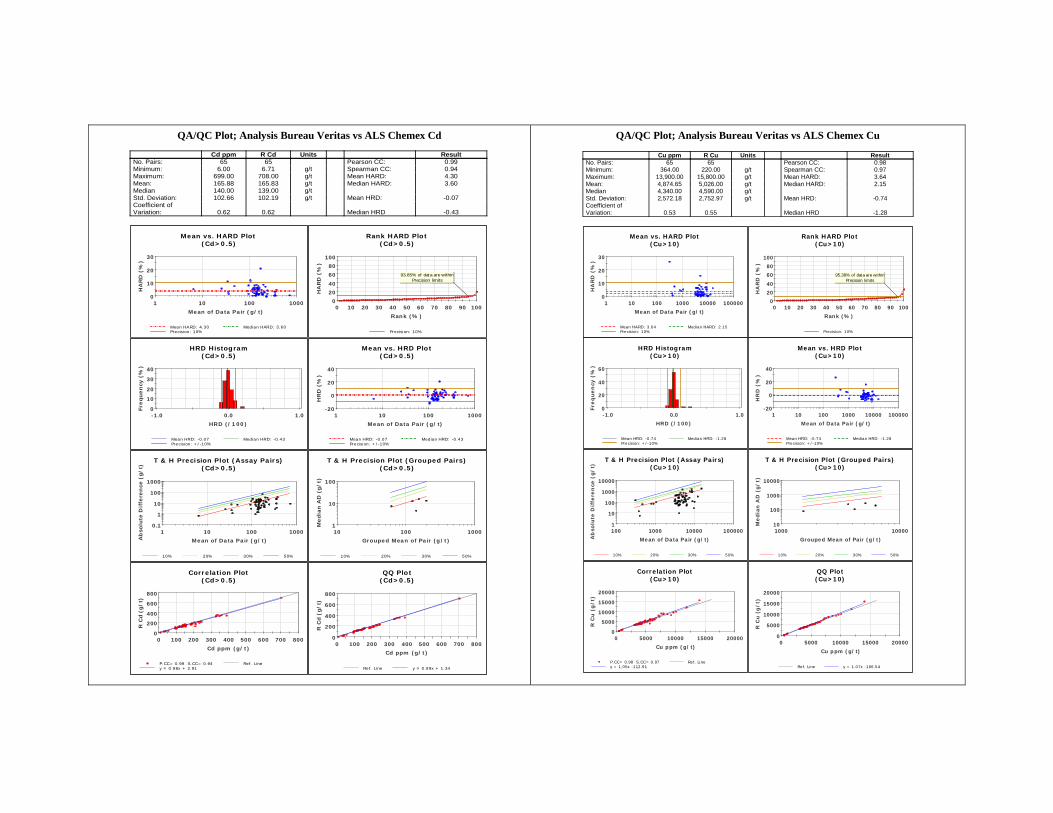
QA/QC Plot; Analysis Bureau Veritas vs ALS Chemex Cd
QA/QC Plot; Analysis Bureau Veritas vs ALS Chemex Cu
Cd ppm R Cd Units ResultNo. Pairs: 65 65 Pearson CC: 0.99Minimum: 6.00 6.71 g/t Spearman CC: 0.94Maximum: 699.00 708.00 g/t Mean HARD: 4.30Mean: 165.88 165.83 g/t Median HARD: 3.60Median 140.00 139.00 g/tStd. Deviation: 102.66 102.19 g/t Mean HRD: -0.07Coefficient of Variation: 0.62 0.62 Median HRD -0.43
0
10
20
30
1 10 100 1000
HA
RD
(%
)
Mean of Data Pair (g/t)
Mean vs. HARD Plot(Cd>0.5)
Mean HARD: 4.30 Median HARD: 3.60Precision: 10%
0
20
40
60
80
100
0 10 20 30 40 50 60 70 80 90 100
HA
RD
(%
)Rank (%)
Rank HARD Plot(Cd>0.5)
Precision: 10%
93.85% of data are withinPrecision limits
0
10
20
30
40
-1.0 0.0 1.0
Fre
quen
cy (
%)
HRD (/100)
HRD Histogram(Cd>0.5)
Mean HRD: -0.07 Median HRD: -0.43Precision: +/-10%
-20
0
20
40
1 10 100 1000
HR
D (
%)
Mean of Data Pair (g/t)
Mean vs. HRD Plot(Cd>0.5)
Mean HRD: -0.07 Median HRD: -0.43Precision: +/-10%
0.1
1
10
100
1000
1 10 100 1000
Ab
solu
te D
iffe
ren
ce (
g/t)
Mean of Data Pair (g/t)
T & H Precision Plot (Assay Pairs)(Cd>0.5)
10% 20% 30% 50%
1
10
100
10 100 1000
Media
n A
D (
g/t)
Grouped Mean of Pair (g/t)
T & H Precision Plot (Grouped Pairs)(Cd>0.5)
10% 20% 30% 50%
0
200
400
600
800
0 100 200 300 400 500 600 700 800
R C
d (
g/t)
Cd ppm (g/t)
Correlation Plot(Cd>0.5)
P.CC= 0.99 S.CC= 0.94 Ref. Liney = 0.98x + 2.91
0
200
400
600
800
0 100 200 300 400 500 600 700 800
R C
d (
g/t)
Cd ppm (g/t)
QQ Plot(Cd>0.5)
Ref. Line y = 0.99x + 1.34
Cu ppm R Cu Units ResultNo. Pairs: 65 65 Pearson CC: 0.98Minimum: 364.00 220.00 g/t Spearman CC: 0.97Maximum: 13,900.00 15,800.00 g/t Mean HARD: 3.64Mean: 4,874.65 5,026.00 g/t Median HARD: 2.15Median 4,340.00 4,590.00 g/tStd. Deviation: 2,572.18 2,752.97 g/t Mean HRD: -0.74Coefficient of Variation: 0.53 0.55 Median HRD -1.28
0
10
20
30
1 10 100 1000 10000 100000
HA
RD
(%
)
Mean of Data Pair (g/t)
Mean vs. HARD Plot(Cu>10)
Mean HARD: 3.64 Median HARD: 2.15Precision: 10%
0
20
40
60
80
100
0 10 20 30 40 50 60 70 80 90 100
HA
RD
(%
)
Rank (%)
Rank HARD Plot(Cu>10)
Precision: 10%
95.38% of data are withinPrecision limits
0
20
40
60
-1.0 0.0 1.0
Fre
qu
en
cy (
%)
HRD (/100)
HRD Histogram(Cu>10)
Mean HRD: -0.74 Median HRD: -1.28Precision: +/-10%
-20
0
20
40
1 10 100 1000 10000 100000
HR
D (
%)
Mean of Data Pair (g/t)
Mean vs. HRD Plot(Cu>10)
Mean HRD: -0.74 Median HRD: -1.28Precision: +/-10%
1
10
100
1000
10000
100 1000 10000 100000
Ab
solu
te D
iffe
ren
ce (
g/t)
Mean of Data Pair (g/t)
T & H Precision Plot (Assay Pairs)(Cu>10)
10% 20% 30% 50%
10
100
1000
10000
1000 10000
Me
dia
n A
D (
g/t)
Grouped Mean of Pair (g/t)
T & H Precision Plot (Grouped Pairs)(Cu>10)
10% 20% 30% 50%
0
5000
10000
15000
20000
0 5000 10000 15000 20000
R C
u (
g/t)
Cu ppm (g/t)
Correlation Plot(Cu>10)
P.CC= 0.98 S.CC= 0.97 Ref. Liney = 1.05x -112.91
0
5000
10000
15000
20000
0 5000 10000 15000 20000
R C
u (
g/t)
Cu ppm (g/t)
QQ Plot(Cu>10)
Ref. Line y = 1.07x -166.54
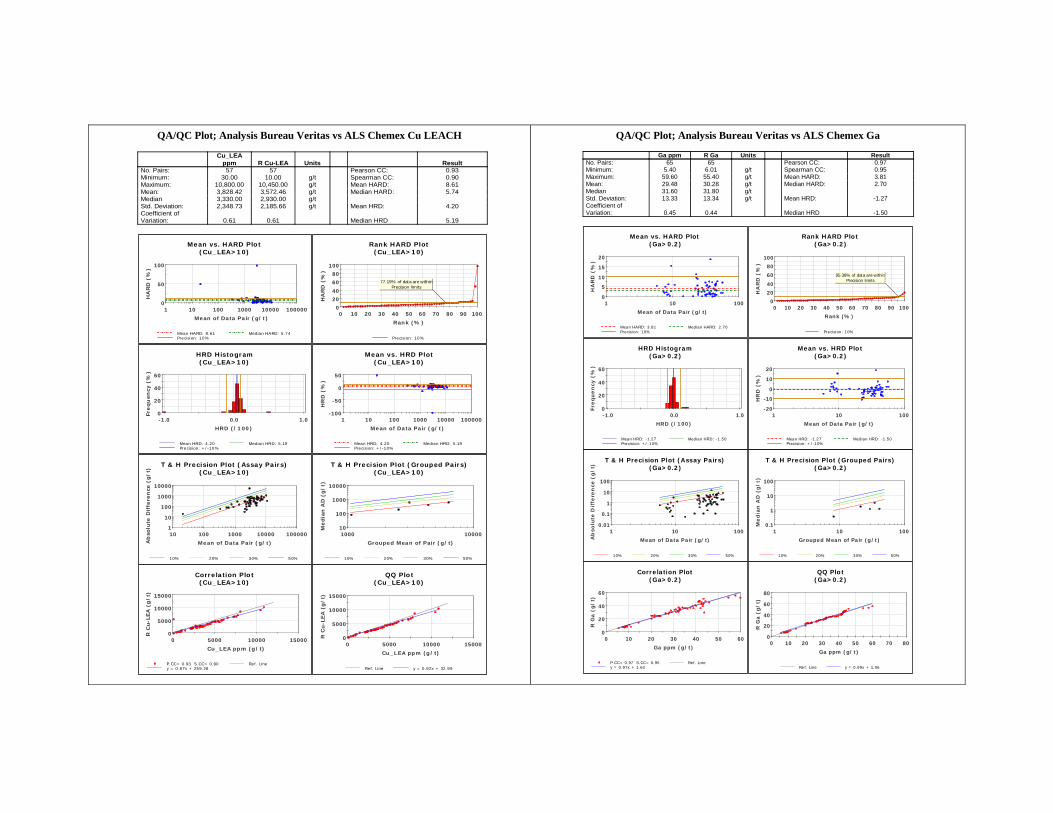
QA/QC Plot; Analysis Bureau Veritas vs ALS Chemex Cu LEACH
QA/QC Plot; Analysis Bureau Veritas vs ALS Chemex Ga
Cu_LEAppm R Cu-LEA Units Result
No. Pairs: 57 57 Pearson CC: 0.93Minimum: 30.00 10.00 g/t Spearman CC: 0.90Maximum: 10,800.00 10,450.00 g/t Mean HARD: 8.61Mean: 3,828.42 3,572.46 g/t Median HARD: 5.74Median 3,330.00 2,930.00 g/tStd. Deviation: 2,348.73 2,185.66 g/t Mean HRD: 4.20Coefficient of Variation: 0.61 0.61 Median HRD 5.19
0
50
100
1 10 100 1000 10000 100000
HA
RD
(%
)
Mean of Data Pair (g/t)
Mean vs. HARD Plot(Cu_LEA>10)
Mean HARD: 8.61 Median HARD: 5.74Precision: 10%
02040
6080
100
0 10 20 30 40 50 60 70 80 90 100
HA
RD
(%
)Rank (%)
Rank HARD Plot(Cu_LEA>10)
Precision: 10%
77.19% of data are withinPrecision limits
0
20
40
60
-1.0 0.0 1.0
Fre
qu
en
cy (
%)
HRD (/100)
HRD Histogram(Cu_LEA>10)
Mean HRD: 4.20 Median HRD: 5.19Precision: +/-10%
-100
-50
0
50
1 10 100 1000 10000 100000
HR
D (
%)
Mean of Data Pair (g/t)
Mean vs. HRD Plot(Cu_LEA>10)
Mean HRD: 4.20 Median HRD: 5.19Precision: +/-10%
1
10
100
1000
10000
10 100 1000 10000 100000
Ab
solu
te D
iffe
ren
ce (
g/t)
Mean of Data Pair (g/t)
T & H Precision Plot (Assay Pairs)(Cu_LEA>10)
10% 20% 30% 50%
10
100
1000
10000
1000 10000
Media
n A
D (
g/t)
Grouped Mean of Pair (g/t)
T & H Precision Plot (Grouped Pairs)(Cu_LEA>10)
10% 20% 30% 50%
0
5000
10000
15000
0 5000 10000 15000
R C
u-L
EA
(g
/t)
Cu_LEA ppm (g/t)
Correlation Plot(Cu_LEA>10)
P.CC= 0.93 S.CC= 0.90 Ref. Liney = 0.87x + 259.28
0
5000
10000
15000
0 5000 10000 15000
R C
u-L
EA
(g
/t)
Cu_LEA ppm (g/t)
QQ Plot(Cu_LEA>10)
Ref. Line y = 0.92x + 32.99
Ga ppm R Ga Units ResultNo. Pairs: 65 65 Pearson CC: 0.97Minimum: 5.40 6.01 g/t Spearman CC: 0.95Maximum: 59.60 55.40 g/t Mean HARD: 3.81Mean: 29.48 30.28 g/t Median HARD: 2.70Median 31.60 31.80 g/tStd. Deviation: 13.33 13.34 g/t Mean HRD: -1.27Coefficient of Variation: 0.45 0.44 Median HRD -1.50
0
5
10
15
20
1 10 100
HA
RD
(%
)
Mean of Data Pair (g/t)
Mean vs. HARD Plot(Ga>0.2)
Mean HARD: 3.81 Median HARD: 2.70Precision: 10%
0
20
40
60
80
100
0 10 20 30 40 50 60 70 80 90 100
HA
RD
(%
)
Rank (%)
Rank HARD Plot(Ga>0.2)
Precision: 10%
95.38% of data are withinPrecision limits
0
20
40
60
-1.0 0.0 1.0
Fre
qu
en
cy (
%)
HRD (/100)
HRD Histogram(Ga>0.2)
Mean HRD: -1.27 Median HRD: -1.50Precision: +/-10%
-20
-10
0
10
20
1 10 100
HR
D (
%)
Mean of Data Pair (g/t)
Mean vs. HRD Plot(Ga>0.2)
Mean HRD: -1.27 Median HRD: -1.50Precision: +/-10%
0.01
0.1
1
10
100
1 10 100
Ab
solu
te D
iffe
ren
ce (
g/
t)
Mean of Data Pair (g/t)
T & H Precision Plot (Assay Pairs)(Ga>0.2)
10% 20% 30% 50%
0.1
1
10
100
1 10 100
Me
dia
n A
D (
g/t)
Grouped Mean of Pair (g/t)
T & H Precision Plot (Grouped Pairs)(Ga>0.2)
10% 20% 30% 50%
0
20
40
60
0 10 20 30 40 50 60
R G
a (
g/
t)
Ga ppm (g/t)
Correlation Plot(Ga>0.2)
P.CC= 0.97 S.CC= 0.95 Ref. Liney = 0.97x + 1.63
0
20
40
60
80
0 10 20 30 40 50 60 70 80
R G
a (
g/
t)
Ga ppm (g/t)
QQ Plot(Ga>0.2)
Ref. Line y = 0.99x + 1.06
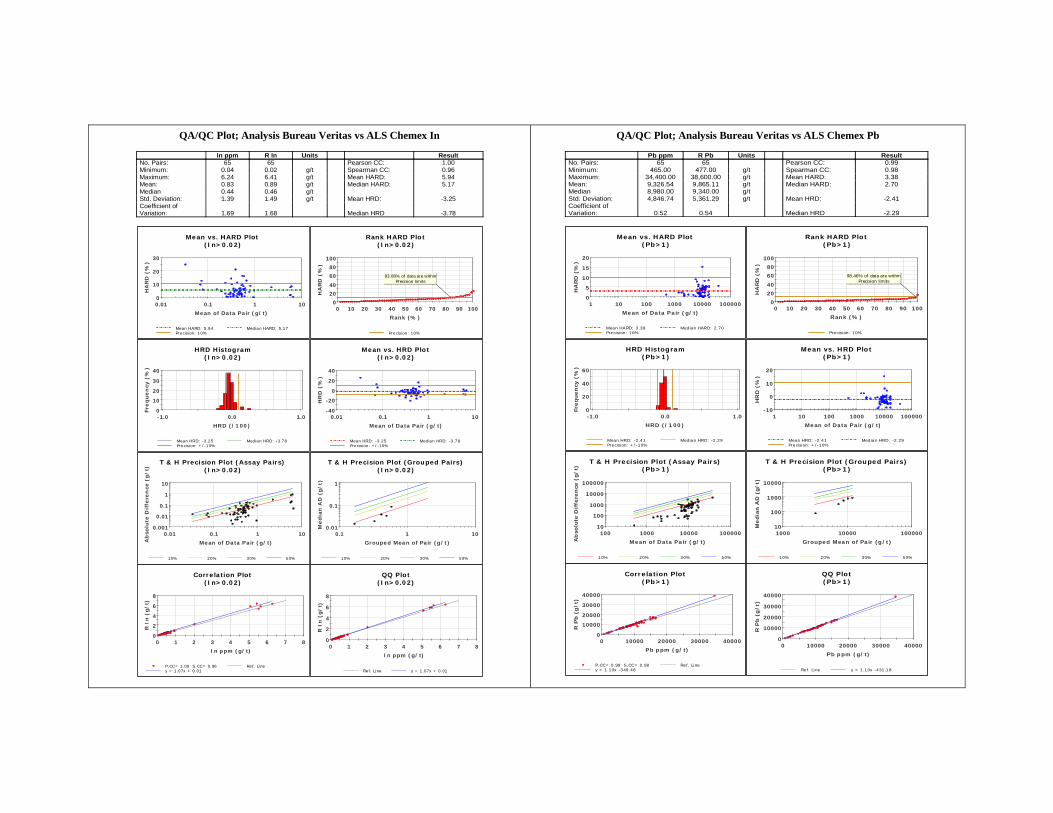
QA/QC Plot; Analysis Bureau Veritas vs ALS Chemex In
QA/QC Plot; Analysis Bureau Veritas vs ALS Chemex Pb
In ppm R In Units ResultNo. Pairs: 65 65 Pearson CC: 1.00Minimum: 0.04 0.02 g/t Spearman CC: 0.96Maximum: 6.24 6.41 g/t Mean HARD: 5.94Mean: 0.83 0.89 g/t Median HARD: 5.17Median 0.44 0.46 g/tStd. Deviation: 1.39 1.49 g/t Mean HRD: -3.25Coefficient of Variation: 1.69 1.68 Median HRD -3.78
0
10
20
30
0.01 0.1 1 10
HA
RD
(%
)
Mean of Data Pair (g/t)
Mean vs. HARD Plot(In>0.02)
Mean HARD: 5.94 Median HARD: 5.17Precision: 10%
0
20
40
60
80
100
0 10 20 30 40 50 60 70 80 90 100
HA
RD
(%
)Rank (%)
Rank HARD Plot(In>0.02)
Precision: 10%
83.08% of data are withinPrecision limits
0
10
20
30
40
-1.0 0.0 1.0
Fre
quen
cy (
%)
HRD (/100)
HRD Histogram(In>0.02)
Mean HRD: -3.25 Median HRD: -3.78Precision: +/-10%
-40
-20
0
20
40
0.01 0.1 1 10
HR
D (
%)
Mean of Data Pair (g/t)
Mean vs. HRD Plot(In>0.02)
Mean HRD: -3.25 Median HRD: -3.78Precision: +/-10%
0.001
0.01
0.1
1
10
0.01 0.1 1 10
Ab
solu
te D
iffe
ren
ce (
g/t)
Mean of Data Pair (g/t)
T & H Precision Plot (Assay Pairs)(In>0.02)
10% 20% 30% 50%
0.01
0.1
1
0.1 1 10
Media
n A
D (
g/t)
Grouped Mean of Pair (g/t)
T & H Precision Plot (Grouped Pairs)(In>0.02)
10% 20% 30% 50%
0
2
4
6
8
0 1 2 3 4 5 6 7 8
R I
n (
g/t)
In ppm (g/t)
Correlation Plot(In>0.02)
P.CC= 1.00 S.CC= 0.96 Ref. Liney = 1.07x + 0.01
0
2
4
6
8
0 1 2 3 4 5 6 7 8
R I
n (
g/t)
In ppm (g/t)
QQ Plot(In>0.02)
Ref. Line y = 1.07x + 0.01
Pb ppm R Pb Units ResultNo. Pairs: 65 65 Pearson CC: 0.99Minimum: 465.00 477.00 g/t Spearman CC: 0.98Maximum: 34,400.00 38,600.00 g/t Mean HARD: 3.38Mean: 9,326.54 9,865.11 g/t Median HARD: 2.70Median 8,980.00 9,340.00 g/tStd. Deviation: 4,846.74 5,361.29 g/t Mean HRD: -2.41Coefficient of Variation: 0.52 0.54 Median HRD -2.29
0
5
10
15
20
1 10 100 1000 10000 100000
HA
RD
(%
)
Mean of Data Pair (g/t)
Mean vs. HARD Plot(Pb>1)
Mean HARD: 3.38 Median HARD: 2.70Precision: 10%
0
20
40
60
80
100
0 10 20 30 40 50 60 70 80 90 100
HA
RD
(%
)
Rank (%)
Rank HARD Plot(Pb>1)
Precision: 10%
98.46% of data are withinPrecision limits
0
20
40
60
-1.0 0.0 1.0
Fre
quen
cy (
%)
HRD (/100)
HRD Histogram(Pb>1)
Mean HRD: -2.41 Median HRD: -2.29Precision: +/-10%
-10
0
10
20
1 10 100 1000 10000 100000
HR
D (
%)
Mean of Data Pair (g/t)
Mean vs. HRD Plot(Pb>1)
Mean HRD: -2.41 Median HRD: -2.29Precision: +/-10%
10
100
1000
10000
100000
100 1000 10000 100000
Abso
lute
Diffe
ren
ce (
g/t)
Mean of Data Pair (g/t)
T & H Precision Plot (Assay Pairs)(Pb>1)
10% 20% 30% 50%
10
100
1000
10000
1000 10000 100000
Media
n A
D (
g/t)
Grouped Mean of Pair (g/t)
T & H Precision Plot (Grouped Pairs)(Pb>1)
10% 20% 30% 50%
0
10000
20000
30000
40000
0 10000 20000 30000 40000
R P
b (
g/t)
Pb ppm (g/t)
Correlation Plot(Pb>1)
P.CC= 0.99 S.CC= 0.98 Ref. Liney = 1.10x -349.48
0
10000
20000
30000
40000
0 10000 20000 30000 40000
R P
b (
g/t)
Pb ppm (g/t)
QQ Plot(Pb>1)
Ref. Line y = 1.10x -431.18
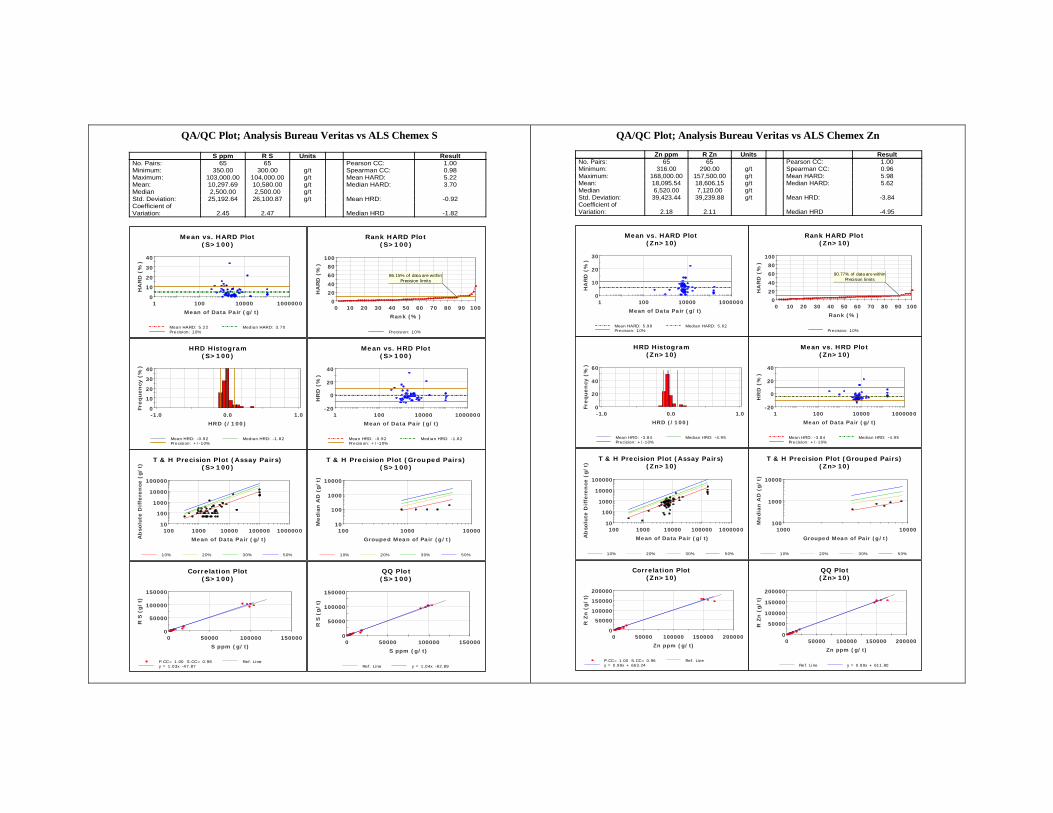
QA/QC Plot; Analysis Bureau Veritas vs ALS Chemex S
QA/QC Plot; Analysis Bureau Veritas vs ALS Chemex Zn
S ppm R S Units ResultNo. Pairs: 65 65 Pearson CC: 1.00Minimum: 350.00 300.00 g/t Spearman CC: 0.98Maximum: 103,000.00 104,000.00 g/t Mean HARD: 5.22Mean: 10,297.69 10,580.00 g/t Median HARD: 3.70Median 2,500.00 2,500.00 g/tStd. Deviation: 25,192.64 26,100.87 g/t Mean HRD: -0.92Coefficient of Variation: 2.45 2.47 Median HRD -1.82
0
10
20
30
40
1 100 10000 1000000
HA
RD
(%
)
Mean of Data Pair (g/t)
Mean vs. HARD Plot(S>100)
Mean HARD: 5.22 Median HARD: 3.70Precision: 10%
0
20
40
60
80
100
0 10 20 30 40 50 60 70 80 90 100
HA
RD
(%
)Rank (%)
Rank HARD Plot(S>100)
Precision: 10%
86.15% of data are withinPrecision limits
0
10
20
30
40
-1.0 0.0 1.0
Fre
quen
cy (
%)
HRD (/100)
HRD Histogram(S>100)
Mean HRD: -0.92 Median HRD: -1.82Precision: +/-10%
-20
0
20
40
1 100 10000 1000000
HR
D (
%)
Mean of Data Pair (g/t)
Mean vs. HRD Plot(S>100)
Mean HRD: -0.92 Median HRD: -1.82Precision: +/-10%
10
100
1000
10000
100000
100 1000 10000 100000 1000000
Ab
solu
te D
iffe
ren
ce (
g/t)
Mean of Data Pair (g/t)
T & H Precision Plot (Assay Pairs)(S>100)
10% 20% 30% 50%
10
100
1000
10000
100 1000 10000
Media
n A
D (
g/t)
Grouped Mean of Pair (g/t)
T & H Precision Plot (Grouped Pairs)(S>100)
10% 20% 30% 50%
0
50000
100000
150000
0 50000 100000 150000
R S
(g/t)
S ppm (g/t)
Correlation Plot(S>100)
P.CC= 1.00 S.CC= 0.98 Ref. Liney = 1.03x -47.87
0
50000
100000
150000
0 50000 100000 150000
R S
(g/t)
S ppm (g/t)
QQ Plot(S>100)
Ref. Line y = 1.04x -82.89
Zn ppm R Zn Units ResultNo. Pairs: 65 65 Pearson CC: 1.00Minimum: 316.00 290.00 g/t Spearman CC: 0.96Maximum: 168,000.00 157,500.00 g/t Mean HARD: 5.98Mean: 18,095.54 18,606.15 g/t Median HARD: 5.62Median 6,520.00 7,120.00 g/tStd. Deviation: 39,423.44 39,239.88 g/t Mean HRD: -3.84Coefficient of Variation: 2.18 2.11 Median HRD -4.95
0
10
20
30
1 100 10000 1000000
HA
RD
(%
)
Mean of Data Pair (g/t)
Mean vs. HARD Plot(Zn>10)
Mean HARD: 5.98 Median HARD: 5.62Precision: 10%
0
20
40
60
80
100
0 10 20 30 40 50 60 70 80 90 100
HA
RD
(%
)
Rank (%)
Rank HARD Plot(Zn>10)
Precision: 10%
90.77% of data are withinPrecision limits
0
20
40
60
-1.0 0.0 1.0
Fre
quen
cy (
%)
HRD (/100)
HRD Histogram(Zn>10)
Mean HRD: -3.84 Median HRD: -4.95Precision: +/-10%
-20
0
20
40
1 100 10000 1000000
HR
D (
%)
Mean of Data Pair (g/t)
Mean vs. HRD Plot(Zn>10)
Mean HRD: -3.84 Median HRD: -4.95Precision: +/-10%
10
100
1000
10000
100000
100 1000 10000 100000 1000000
Ab
solu
te D
iffe
ren
ce (
g/t)
Mean of Data Pair (g/t)
T & H Precision Plot (Assay Pairs)(Zn>10)
10% 20% 30% 50%
100
1000
10000
1000 10000
Media
n A
D (
g/t)
Grouped Mean of Pair (g/t)
T & H Precision Plot (Grouped Pairs)(Zn>10)
10% 20% 30% 50%
0
50000
100000
150000
200000
0 50000 100000 150000 200000
R Z
n (
g/t)
Zn ppm (g/t)
Correlation Plot(Zn>10)
P.CC= 1.00 S.CC= 0.96 Ref. Liney = 0.99x + 663.24
0
50000
100000
150000
200000
0 50000 100000 150000 200000
R Z
n (
g/t)
Zn ppm (g/t)
QQ Plot(Zn>10)
Ref. Line y = 0.99x + 611.80