Embed Size (px)
Citation preview
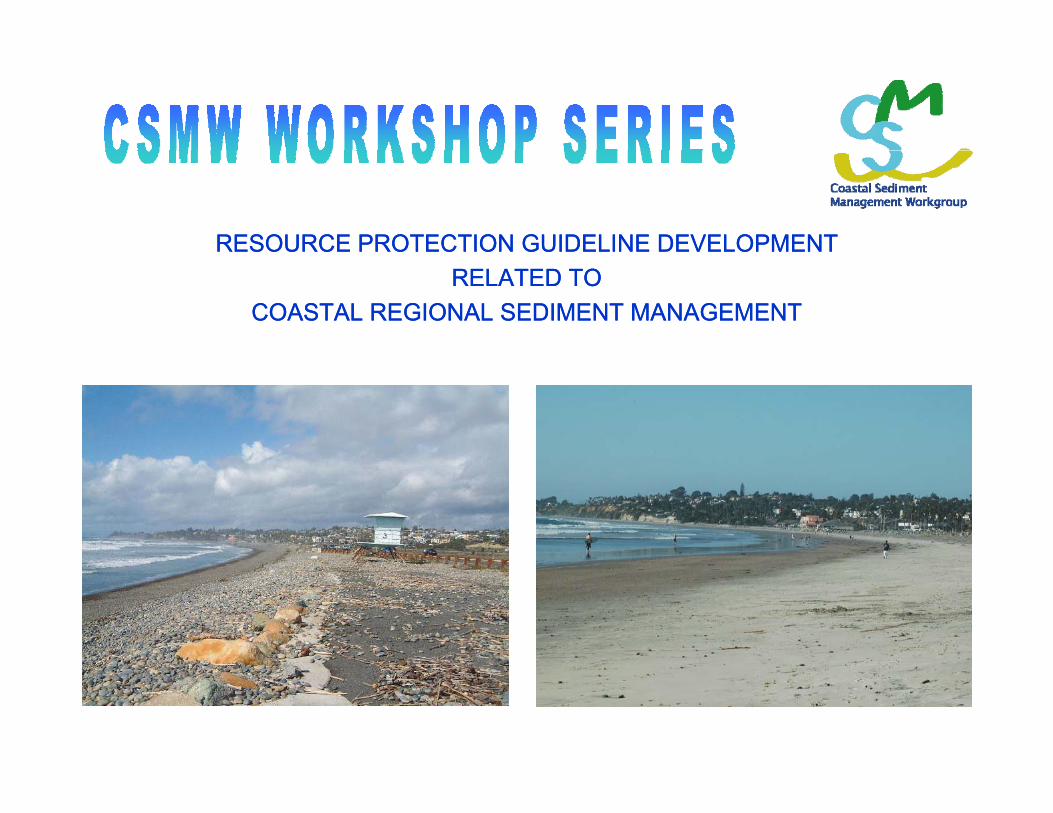
RESOURCE PROTECTION GUIDELINE DEVELOPMENT RESOURCE PROTECTION GUIDELINE DEVELOPMENT RELATED TO RELATED TO
COASTAL REGIONAL SEDIMENT MANAGEMENTCOASTAL REGIONAL SEDIMENT MANAGEMENT
CSMW Workshop 4 July 1, 2010July 1, 2010
I t d ti d B k dI t d ti d B k d•• Introductions and BackgroundIntroductions and Background•• Workshop Purpose and ObjectivesWorkshop Purpose and Objectives
•• Resource Protection Guidelines and User’s GuideResource Protection Guidelines and User’s Guide•• Resource Protection Guidelines and User s Guide Resource Protection Guidelines and User s Guide OrganizationOrganization
•• Rocky Intertidal and Rocky Rocky Intertidal and Rocky SubtidalSubtidal Habitats Habitats
•• SurfgrassSurfgrass and Kelp Bed Habitatsand Kelp Bed Habitats•• Workshop Process and ProductsWorkshop Process and Products•• Next StepsNext Steps
2
Introductions
Sponsor AgenciesSponsor Agencies California Sediment Management Workgroup (CSMW)
M t B N ti l M i S t (NMS) Monterey Bay National Marine Sanctuary (NMS)
Contract AgenciesContract Agenciesgg Beach Erosion Authority for Clean Oceans and Nourishment
(BEACON) USACE Los Angeles District (Moffatt & Nichol contract) USACE, Los Angeles District (Moffatt & Nichol contract)
Project Manager/ModeratorProject Manager/Moderator
3
j gj g Science Applications International Corporation

Introductions
CSMW Co ChairsCSMW Co-Chairs• USACE: George Domurat
Heather Schlosser, Project Manager d l d t l l L A land lead coastal planner, Los Angeles
District
• CA Natural Resources Agency: Brian Baird Chris Potter – Staff liaison
CSMW Project Manager: Clif Davenport
Monterey Bay NMS: Brad Damitz
SAIC Project Manager Karen Green
4
SAIC Project Manager: Karen Green

Background
•• Coastal Sediment Management WorkgroupCoastal Sediment Management Workgroup
g
Coastal Sediment Management Workgroup Coastal Sediment Management Workgroup Efforts and Work Products Efforts and Work Products
•• Biological Impact Analysis (BIA) DocumentBiological Impact Analysis (BIA) Documentg p y ( )g p y ( )
•• WorkshopsWorkshops
5
Coastal Sediment Management Workgroup
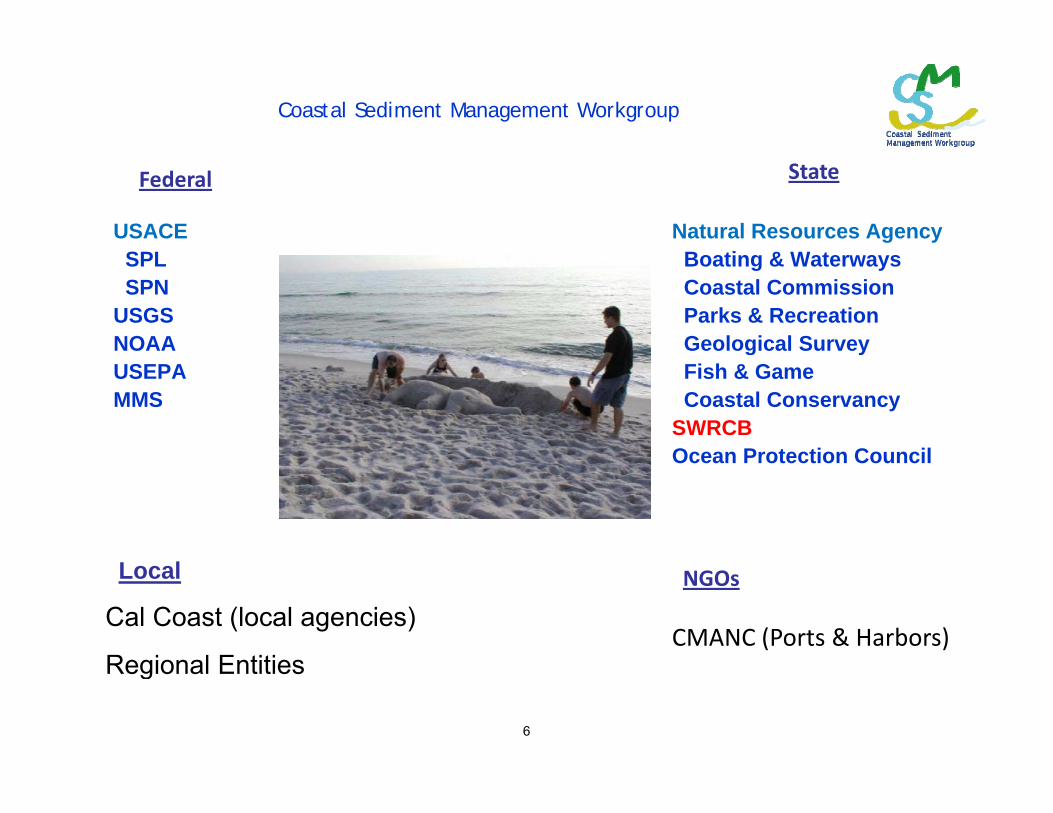
USACESPL
Natural Resources AgencyB ti & W t
Federal State
SPLSPN
USGSNOAA
Boating & WaterwaysCoastal CommissionParks & RecreationGeological Survey
USEPAMMS
Fish & Game Coastal Conservancy
SWRCBOcean Protection CouncilOcean Protection Council
Local
Cal Coast (local agencies)
Regional Entities
NGOs
CMANC (Ports & Harbors)
6
Regional Entities
CSMW Mission and GoalsCSMW Mission and Goals
MissionConserve, restore, and protect California’s coastal resources by developing and facilitating regionalresources by developing and facilitating regional approaches to managing sediment imbalances.
GoalsGoals• To reduce shoreline erosion and coastal storm
damages; • restore and protect beaches and coastal habitat by
restoring natural sediment supply from rivers, impoundments and other sources to the coast; and
• optimize the use of sediment from ports, harbors, and other opportunistic sources.
7

Figure 7. Cumulative sand impounded by dams in each of California’s 25 majorCalifornia s 25 major littoral cells. The numbers are millions of cubic meters of sand that have been trapped by dams in the watersheds draining into each littoral cell.into each littoral cell. The cubes are scaled in size relative to each other to depict i d t iimpoundment in northern, central, and southern California. Littoral cell names and
8
divisions are from Patsch and Griggs, 2005

Natural sediment supply has been reduced:
Seacliff armoring 20%Seacliff armoring 20%
Dams and debris basins
Santa Maria River 68%
Santa Ynez River 51%Santa Ynez River 51%
Ventura River 53%
Santa Clara River 27%
Pt. Conception littoral barrier
Harbor sand traps
The Sediment Bottom LineAll sand lost to Mugu Canyon
9Coastal Regional Sediment Management Plan
All sand lost to Mugu Canyon

Regional Sediment Management- Road to Solutions
Sediment Trapped Behind Dams and Debris
Basins
Sediment excavated and bypassed downstream.
Urbanization of Watershed
Sand and Gravel Mining Sand loss compensated
through projects or fees.
Mining moved out of river More sand
Sand held in place by future urbanization is compensated
through projects or fees.
Less Beach Erosion
Harbor
Sand from harbors placed on beaches
in need.
river. More sand transported to coast.
Beach replenished with sand dredged from offshore or transported from inland projects.
Harbor
Sand Trapped by Harbor Structures
OceanOcean
More Sand Reaching Coast
10
Regional Sediment (Sand) Management

COASTAL SEDIMENT MASTER PLAN
Deliverables:
Educational materials, reports & data
Computer-based decision support toolstools
Regional-based Coastal RSM Plans.
Agency outreach to incorporate g y pRSM
11
Educational & Informational Reports and Data
• Biological Impacts Analysis and Recommendations
• Cumulative Loss of Sediment Due
• SMP Status Report and Brochure
• Development of Sand Budgets forto Dams
• The Economics of Regional Sediment Management in Ventura and Santa Barbara
• Development of Sand Budgets for California’s Major Littoral Cells
• Tijuana Estuary Demonstration Program• Sources, Dispersal & Fate of Fine
Sediment Supplied to CoastalCounties
• Beaches, Littoral Drift and Littoral Cells ‐understanding California’s Shoreline and
Sediment Supplied to Coastal California
• Public Outreach & Workshops• Conceptual Plan to Capture/Reuse
Coastal Sediments Lost toBeach Nourishment
• Beach Restoration Regulatory Guide
• Sand Compatibility and
Coastal Sediments Lost to Submarine Canyons
• California Beach Erosion Assessment Survey (CBEAS)
p yOpportunistic Use Program (SCOUP)
12

Biological Information Analysis (BIA) Study
Eight public and three technical workshops in 2004: Broad spectrum of attendees
Participants asked to identify biological issues of concern (amongst other things)Participants asked to identify biological issues of concern (amongst other things)
General consensus: better information needed to better determine whether and when sediment management activities could cause environmental problems
CSMW commissioned a study to: Assess what was known about critical biota and habitat, compile adverse and beneficial impacts from sediment management activities compile adverse and beneficial impacts from sediment management activities summarize important findings for educational perspectives, andProvide mitigation guidance for consistent project methodologies to facilitate
environmental assessments and permitting
CSMW commissioned academic and obtained agency review: Reviews all generally positive and supportive Reviewers had recommendations for improvements or requested additional
13
p qinformation.
Academic and Agency Review
Peer Review commissioned for academic balance:D St S h t UCSB d CCC SAP— Dr. Steven Schroeter – UCSB and CCC-SAP
— overall positive commendations and support.
CSMW’s cochair requested additional review:CSMW s cochair requested additional review:— Resource & Regulatory Agencies
CDFG, NMFS, USACE Regulatory— Coastal Managers of Sanctuaries and Protected Areasg
ONMS-WRCO, MBNMS— Coastal Wetlands Biologist
SCCWRP
Reviews were all generally positive and supportive on what and how we were trying to accomplish. Several reviewers had recommendations for improvements or requested additional information above and beyond that contained within the
14
q yreport.
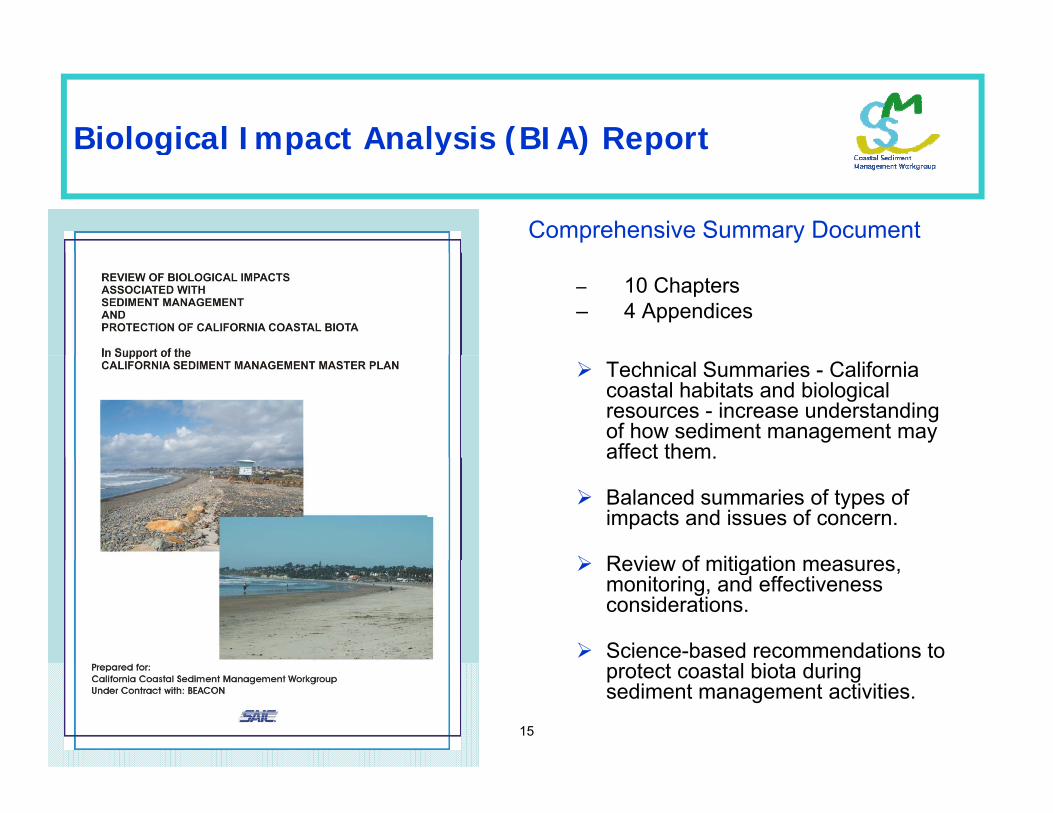
Biological Impact Analysis (BIA) Report
Comprehensive Summary Document
g p y ( ) p
– 10 Chapters– 4 Appendices
Technical Summaries - California coastal habitats and biological resources - increase understanding of how sediment management may affect them.affect them.
Balanced summaries of types of impacts and issues of concern.
Review of mitigation measures Review of mitigation measures, monitoring, and effectiveness considerations.
Science-based recommendations to l bi d i
15
protect coastal biota during sediment management activities.
Habitat and/or Species: Habitat Species Common Name Species Scientific Name
Regulatory Status:
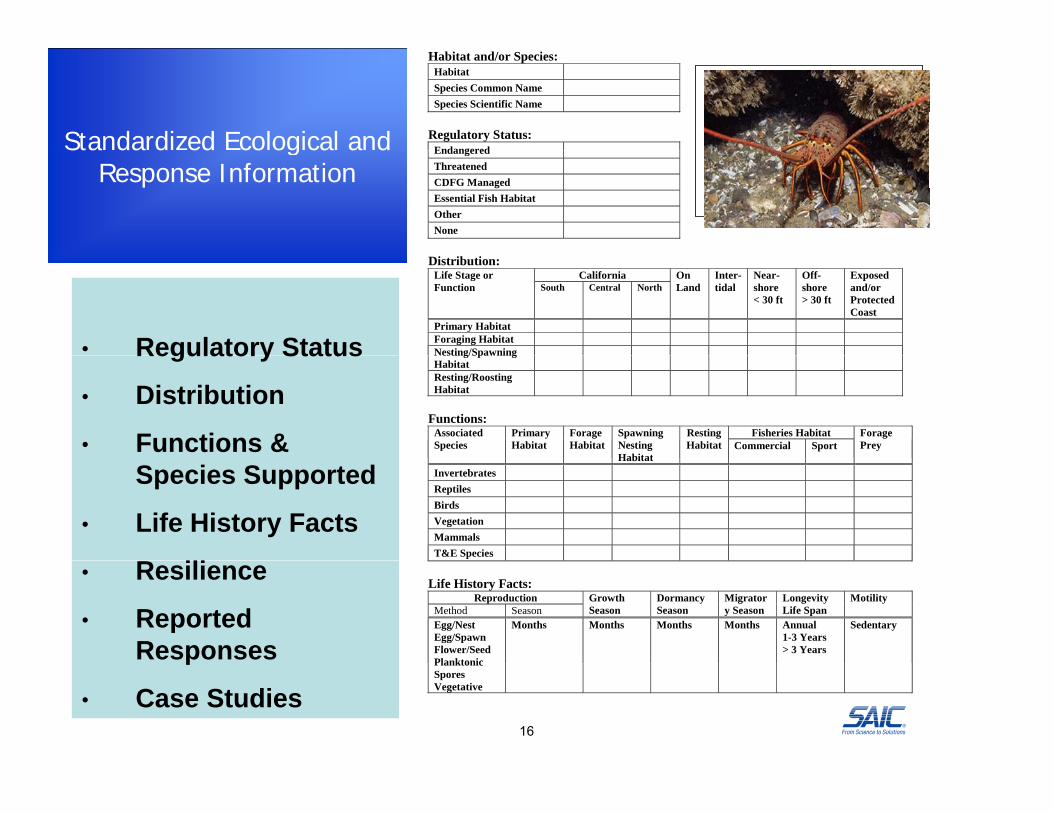
EndangeredStandardized Ecological and Endangered Threatened CDFG Managed Essential Fish Habitat Other None
Sta da d ed co og ca a dResponse Information
Distribution: California Life Stage or
Function South Central North On Land
Inter- tidal
Near-shore < 30 ft
Off- shore > 30 ft
Exposed and/or Protected Coast
Primary Habitat Foraging Habitat Nesting/Spawning • Regulatory Status Nesting/Spawning Habitat Resting/Roosting Habitat
Functions:
Fisheries Habitat Associated Species
Primary Habitat
Forage Habitat
Spawning Nesting Habitat
Resting Habitat Commercial Sport
Forage Prey
Regulatory Status
• Distribution
• Functions & Habitat
Invertebrates Reptiles Birds Vegetation Mammals T&E Species
Species Supported
• Life History Facts
R ili Life History Facts:
Reproduction Method Season
Growth Season
Dormancy Season
Migratory Season
Longevity Life Span
Motility
Egg/Nest Egg/Spawn Flower/Seed Planktonic
Months Months Months Months Annual 1-3 Years > 3 Years
Sedentary
• Resilience
• Reported Responses
16
PlanktonicSpores Vegetative
p
• Case Studies
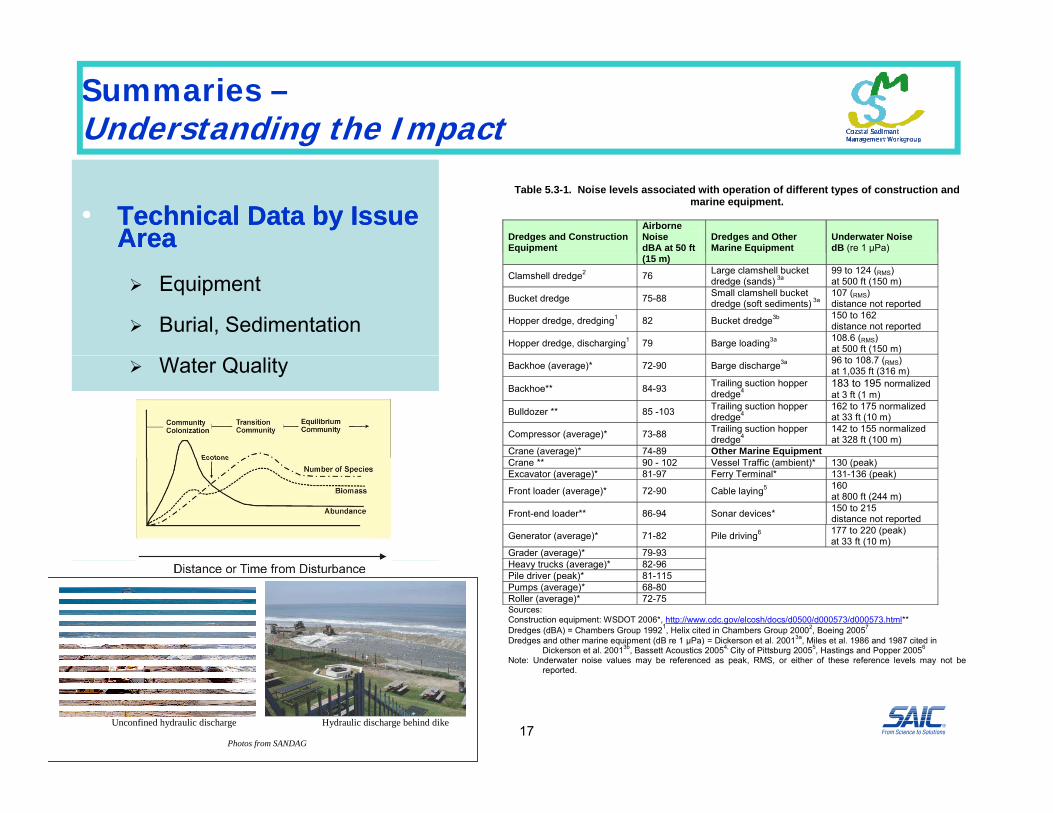
Summaries –Understanding the Impact
•• Technical Data by Issue Technical Data by Issue AreaArea
Table 5.3-1. Noise levels associated with operation of different types of construction and marine equipment.
Dredges and Construction Equipment
Airborne Noise dBA at 50 ft
Dredges and Other Marine Equipment
Underwater Noise dB (re 1 μPa)
Equipment
Burial, Sedimentation
(15 m)
Clamshell dredge2 76 Large clamshell bucket dredge (sands) 3a
99 to 124 (RMS) at 500 ft (150 m)
Bucket dredge 75-88 Small clamshell bucket dredge (soft sediments) 3a
107 (RMS) distance not reported
Hopper dredge, dredging1 82 Bucket dredge3b 150 to 162 distance not reported
Hopper dredge, discharging1 79 Barge loading3a 108.6 (RMS) at 500 ft (150 m)
Water Quality Backhoe (average)* 72-90 Barge discharge3a 96 to 108.7 (RMS) at 1,035 ft (316 m)
Backhoe** 84-93 Trailing suction hopper dredge4
183 to 195 normalized at 3 ft (1 m)
Bulldozer ** 85 -103 Trailing suction hopper dredge4
162 to 175 normalized at 33 ft (10 m)
Compressor (average)* 73-88 Trailing suction hopper dredge4
142 to 155 normalized at 328 ft (100 m)
Crane (average)* 74-89 Other Marine Equipment
Crane ** 90 - 102 Vessel Traffic (ambient)* 130 (peak)Excavator (average)* 81-97 Ferry Terminal* 131-136 (peak)
Front loader (average)* 72-90 Cable laying5 160 at 800 ft (244 m)
Front-end loader** 86-94 Sonar devices* 150 to 215 distance not reported
Generator (average)* 71-82 Pile driving6 177 to 220 (peak) at 33 ft (10 m)
Grader (average)* 79-93 ( )*Heavy trucks (average)* 82-96
Pile driver (peak)* 81-115 Pumps (average)* 68-80 Roller (average)* 72-75
Sources: Construction equipment: WSDOT 2006*, http://www.cdc.gov/elcosh/docs/d0500/d000573/d000573.html** Dredges (dBA) = Chambers Group 19921, Helix cited in Chambers Group 20002, Boeing 20057 Dredges and other marine equipment (dB re 1 μPa) = Dickerson et al. 20013a, Miles et al. 1986 and 1987 cited in
Dickerson et al. 20013b, Bassett Acoustics 20054, City of Pittsburg 20055, Hastings and Popper 20056 Note: Underwater noise values may be referenced as peak, RMS, or either of these reference levels may not be
17
Unconfined hydraulic discharge Hydraulic discharge behind dike
Photos from SANDAG
ote U de ate o se a ues ay be e e e ced as pea , S, o e t e o t ese e e e ce e e s ay ot bereported.
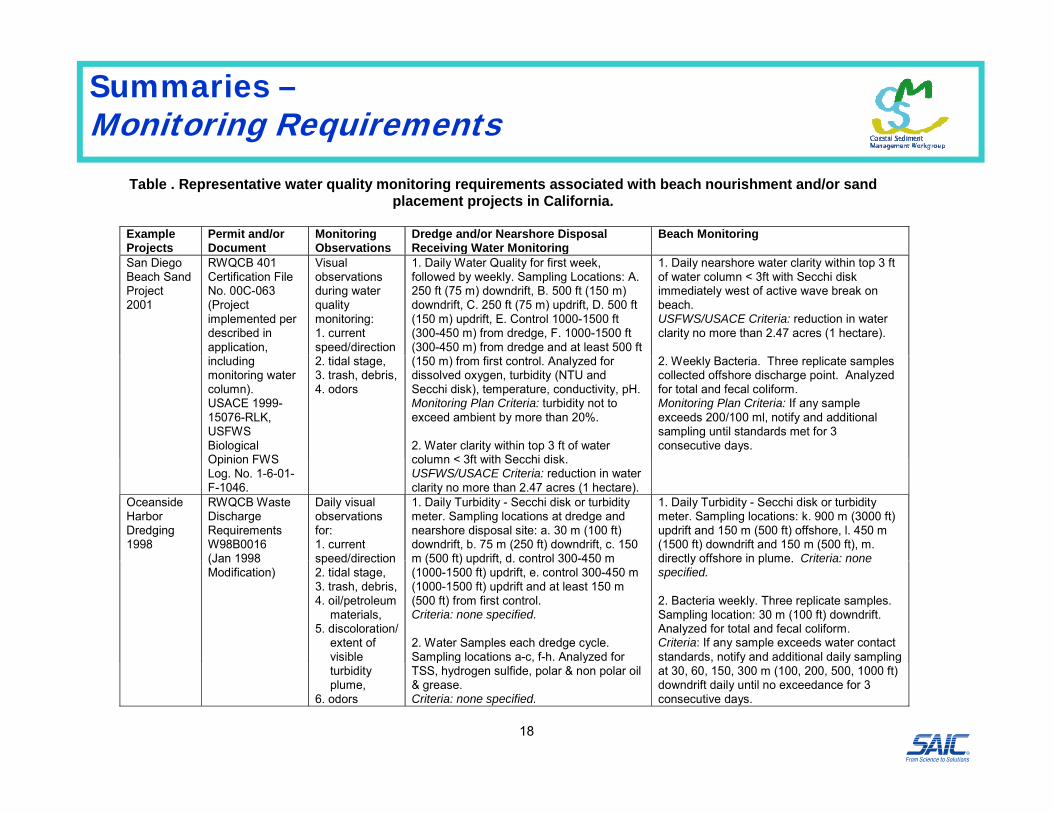
Summaries –Monitoring Requirements
Table . Representative water quality monitoring requirements associated with beach nourishment and/or sand placement projects in California.
Example Projects
Permit and/or Document
Monitoring Observations
Dredge and/or Nearshore Disposal Receiving Water Monitoring
Beach Monitoring j g g
San Diego Beach Sand Project 2001
RWQCB 401 Certification File No. 00C-063 (Project implemented per described in application,
Visual observations during water quality monitoring: 1. current speed/direction
1. Daily Water Quality for first week, followed by weekly. Sampling Locations: A. 250 ft (75 m) downdrift, B. 500 ft (150 m) downdrift, C. 250 ft (75 m) updrift, D. 500 ft (150 m) updrift, E. Control 1000-1500 ft (300-450 m) from dredge, F. 1000-1500 ft (300-450 m) from dredge and at least 500 ft
1. Daily nearshore water clarity within top 3 ft of water column < 3ft with Secchi disk immediately west of active wave break on beach. USFWS/USACE Criteria: reduction in water clarity no more than 2.47 acres (1 hectare).
including monitoring water column). USACE 1999-15076-RLK, USFWS Biological Opinion FWS
2. tidal stage, 3. trash, debris, 4. odors
(150 m) from first control. Analyzed for dissolved oxygen, turbidity (NTU and Secchi disk), temperature, conductivity, pH. Monitoring Plan Criteria: turbidity not to exceed ambient by more than 20%. 2. Water clarity within top 3 ft of water column < 3ft with Secchi disk
2. Weekly Bacteria. Three replicate samples collected offshore discharge point. Analyzed for total and fecal coliform. Monitoring Plan Criteria: If any sample exceeds 200/100 ml, notify and additional sampling until standards met for 3 consecutive days.
Opinion FWS Log. No. 1-6-01-F-1046.
column < 3ft with Secchi disk. USFWS/USACE Criteria: reduction in water clarity no more than 2.47 acres (1 hectare).
Oceanside Harbor Dredging 1998
RWQCB Waste Discharge Requirements W98B0016 (Jan 1998
Daily visual observations for: 1. current speed/direction
1. Daily Turbidity - Secchi disk or turbidity meter. Sampling locations at dredge and nearshore disposal site: a. 30 m (100 ft) downdrift, b. 75 m (250 ft) downdrift, c. 150 m (500 ft) updrift d control 300-450 m
1. Daily Turbidity - Secchi disk or turbidity meter. Sampling locations: k. 900 m (3000 ft) updrift and 150 m (500 ft) offshore, l. 450 m (1500 ft) downdrift and 150 m (500 ft), m. directly offshore in plume Criteria: none(Jan 1998
Modification) speed/direction2. tidal stage, 3. trash, debris, 4. oil/petroleum
materials, 5. discoloration/
extent of visible
m (500 ft) updrift, d. control 300 450 m (1000-1500 ft) updrift, e. control 300-450 m (1000-1500 ft) updrift and at least 150 m (500 ft) from first control. Criteria: none specified. 2. Water Samples each dredge cycle. Sampling locations a-c, f-h. Analyzed for
directly offshore in plume. Criteria: none specified. 2. Bacteria weekly. Three replicate samples. Sampling location: 30 m (100 ft) downdrift. Analyzed for total and fecal coliform. Criteria: If any sample exceeds water contact standards, notify and additional daily sampling
18
turbidity plume,
6. odors
p g yTSS, hydrogen sulfide, polar & non polar oil & grease. Criteria: none specified.
y y p gat 30, 60, 150, 300 m (100, 200, 500, 1000 ft) downdrift daily until no exceedance for 3 consecutive days.
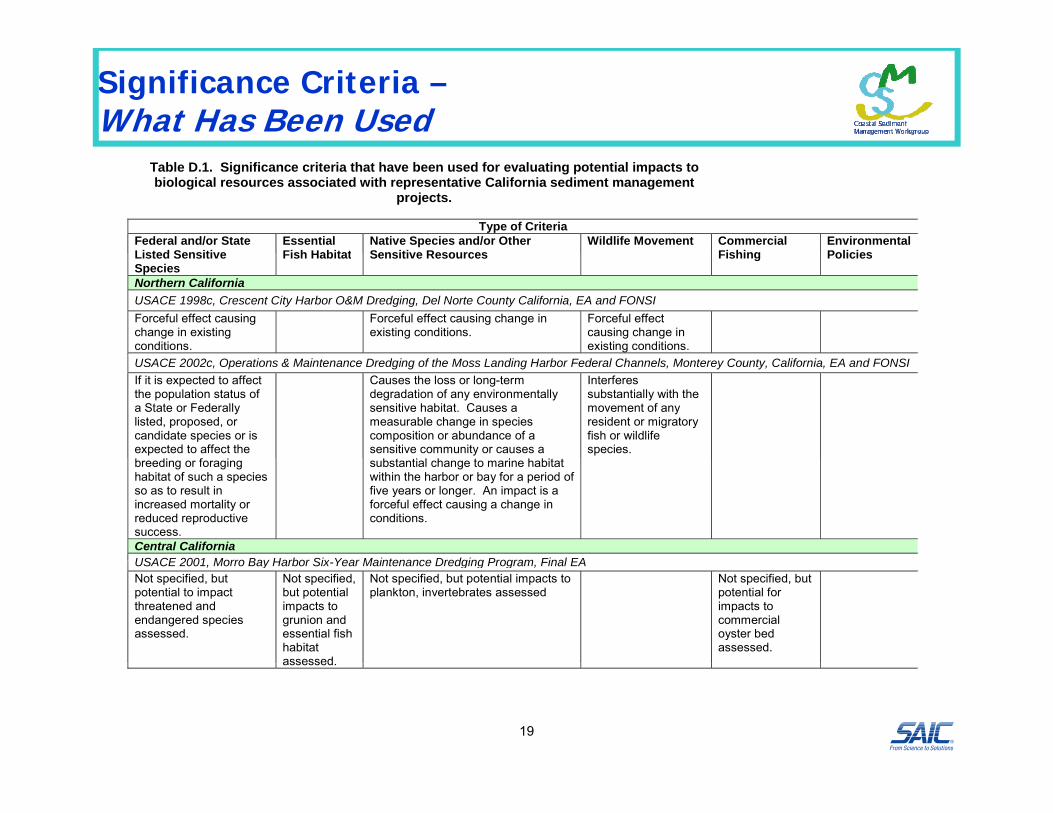
Significance Criteria –What Has Been Used
Table D.1. Significance criteria that have been used for evaluating potential impacts to biological resources associated with representative California sediment management
projects.
Type of Criteria Federal and/or State Listed Sensitive
Essential Fish Habitat
Native Species and/or Other Sensitive Resources
Wildlife Movement Commercial Fishing
Environmental PoliciesListed Sensitive
Species Fish Habitat Sensitive Resources Fishing Policies
Northern California USACE 1998c, Crescent City Harbor O&M Dredging, Del Norte County California, EA and FONSI Forceful effect causing change in existing conditions.
Forceful effect causing change in existing conditions.
Forceful effect causing change in existing conditions.
USACE 2002c, Operations & Maintenance Dredging of the Moss Landing Harbor Federal Channels, Monterey County, California, EA and FONSI If it is expected to affect the population status of a State or Federally listed, proposed, or candidate species or is expected to affect the
Causes the loss or long-term degradation of any environmentally sensitive habitat. Causes a measurable change in species composition or abundance of a sensitive community or causes a
Interferes substantially with the movement of any resident or migratory fish or wildlife species.
breeding or foraging habitat of such a species so as to result in increased mortality or reduced reproductive success.
substantial change to marine habitat within the harbor or bay for a period of five years or longer. An impact is a forceful effect causing a change in conditions.
Central California USACE 2001 Morro Bay Harbor Six Year Maintenance Dredging Program Final EAUSACE 2001, Morro Bay Harbor Six-Year Maintenance Dredging Program, Final EANot specified, but potential to impact threatened and endangered species assessed.
Not specified, but potential impacts to grunion and essential fish habitat assessed
Not specified, but potential impacts to plankton, invertebrates assessed
Not specified, but potential for impacts to commercial oyster bed assessed.
19
assessed.
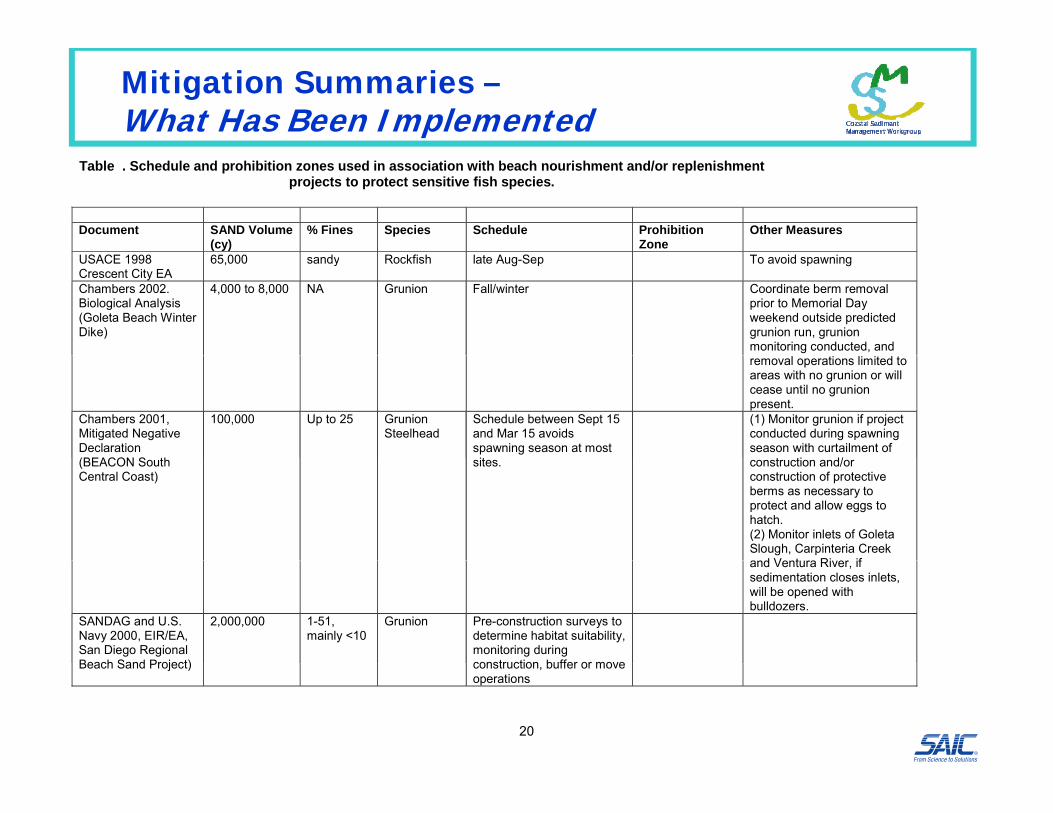
Mitigation Summaries –What Has Been Implemented
Table . Schedule and prohibition zones used in association with beach nourishment and/or replenishment projects to protect sensitive fish species.
Document SAND Volume
(cy) % Fines Species Schedule Prohibition
Zone Other Measures
USACE 1998 Crescent City EA
65,000 sandy Rockfish late Aug-Sep To avoid spawning
Chambers 2002. Biological Analysis (Goleta Beach Winter Dike)
4,000 to 8,000 NA Grunion Fall/winter Coordinate berm removal prior to Memorial Day weekend outside predicted grunion run, grunion monitoring conducted, and removal operations limited to areas with no grunion or will cease until no grunion present.
Chambers 2001, Mitigated Negative Declaration (BEACON S th
100,000 Up to 25 Grunion Steelhead
Schedule between Sept 15 and Mar 15 avoids spawning season at most it
(1) Monitor grunion if project conducted during spawning season with curtailment of
t ti d/(BEACON South Central Coast)
sites. construction and/or construction of protective berms as necessary to protect and allow eggs to hatch. (2) Monitor inlets of Goleta Slough, Carpinteria Creek and Ventura River ifand Ventura River, if sedimentation closes inlets, will be opened with bulldozers.
SANDAG and U.S. Navy 2000, EIR/EA, San Diego Regional Beach Sand Project)
2,000,000 1-51, mainly <10
Grunion Pre-construction surveys to determine habitat suitability, monitoring during construction buffer or move
20
Beach Sand Project) construction, buffer or move operations

Response to Comments and Completion of Biological Impact Analysis (BIA) Document
•• Conduct WorkshopsConduct Workshops
•• Develop Resource Protection GuidelinesDevelop Resource Protection GuidelinesDevelop Resource Protection GuidelinesDevelop Resource Protection Guidelines
•• Finalize BIA DocumentFinalize BIA Document
•• Prepare Abbreviated User’s GuidePrepare Abbreviated User’s Guide
•• Develop WorkDevelop Work PlanPlan
21

Workshop Series
Date (2010) Location Key TopicsFebruary 18 Long Beach General Approach to Guideline Development,
NOAA Resource Agency Coordination
February 24 SacramentoEPA
Water Quality, Water-Sediment Resource Protection in Watersheds, Resource Protection Managed AreasResource Protection Managed Areas
June 16 CarlsbadUSFWS
Habitats: Sandy Beach, Dune/Strand, Sandy Subtidal
July 1 Monterey Habitats: Rocky Intertidal Rocky SubtidalJuly 1 MontereyMBARI
Habitats: Rocky Intertidal, Rocky Subtidal, Surfgrass, Kelp Beds
July 13 OaklandSEI
Habitats: Bays, Lagoons, EelgrassSEI
July 14 EurekaHumboldt BRCD
Habitats: Bays/Wetlands and Commercial Fisheries
August 4 San Diego Impact Assessment, Monitoring, Database Tools
22
August 4 San Diego SCCWRP
Impact Assessment, Monitoring, Database Tools
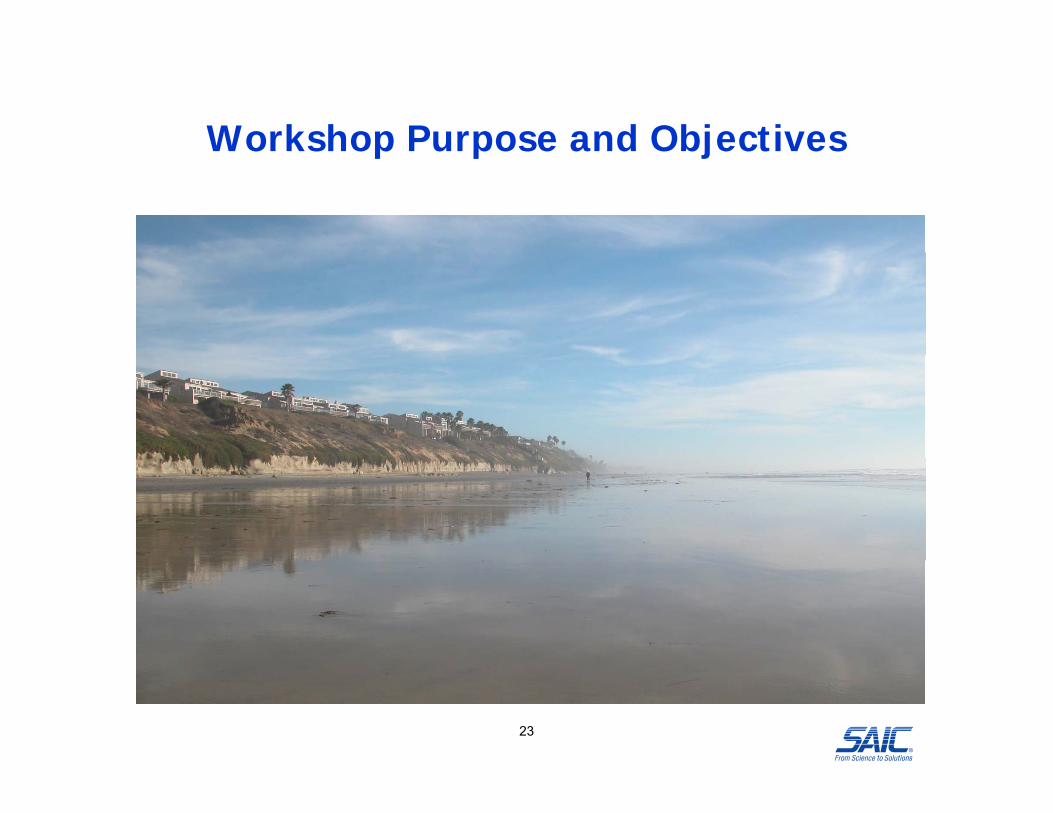
Workshop Purpose and ObjectivesWorkshop Purpose and Objectives
23

Workshop Purpose: Assist Development of Resource Protection GuidelinesAssist Development of Resource Protection Guidelines
Objectives:Objectives:Objectives:Objectives:Identify Opportunities to Refine Existing Guidelines, Identify Opportunities to Refine Existing Guidelines, Improve Coordination with Other Relevant Programs, and Improve Coordination with Other Relevant Programs, and Identify Guideline Considerations to Improve ResourceIdentify Guideline Considerations to Improve ResourceIdentify Guideline Considerations to Improve Resource Identify Guideline Considerations to Improve Resource Protection During Sediment Management Projects Relative Protection During Sediment Management Projects Relative to: to:
Rocky Intertidal Habitat and Resources Rocky Intertidal Habitat and Resources
Rocky Subtidal Habitat and Resources
Surfgrass Habitat and Resources
Kelp bed Habitat and Resources
24

Guideline Format and User’s Guide O i tiOrganization
25

User’s Guide Organizationg
Objective: Streamline Document to Facilitate Practical Objective: Streamline Document to Facilitate Practical U t A i Pl S i ti tU t A i Pl S i ti t
•• Condensed Version BIA DocumentCondensed Version BIA Document
Use to Agencies, Planners, ScientistsUse to Agencies, Planners, Scientists
Condensed Version BIA DocumentCondensed Version BIA Document•• Overview Summaries Overview Summaries
– Key Elements (Sediment Management Activities, Project Types, Impact Issues By Project Phase Monitoring Performance Evaluation)Impact Issues By Project Phase, Monitoring, Performance Evaluation)
•• Resource Protection GuidelinesResource Protection Guidelines– Habitat-Based – Flow Path Approach (Resources, Impact Issues, Protective Measures,
Monitoring Considerations)– Cross-Reference Tables (e.g., Habitat, Species, Impact Type,
Project Phase)
26
j )
Resource Protection Guideline Format
Habitat BasedHabitat Based
GuidlelineGuidleline DescriptionsDescriptions
– Issue Statement
– Guideline Description
R ti l– Rationale
– References (As Applicable)
– Effectiveness Considerations
27

HabitatExampleHabitat = Rocky
I t tid lp
IntertidalProject Type Sand Placement
Resource Categories Invertebrates Fish Birds Marine Mammals Vegetation Other
Resource TypeRocky Intertidal Invertebrates
Nearshore Water Column, TidepoolFish
Seabirds,Shorebirds Pinnipeds
Algae, Seagrasses
Species of Concern - If P t Ab l B P li Pi i d S fPresent Abalone Brown Pelican Pinnipeds Surfgrass
Critical Habitat - If Present
ASBS, MLPA,R
Sensitive HabitatMajor Roosting Sites Rookeries
Reserve, Sanctuary, State Park
Adjacent Habitats of Particular Concern (HAPC) - If Present Reef, Surfgrass Reef, Surfgrass Reef, Surfgrass Reef, Surfgrass
Other Adjacent Sensitve Habitats - If Present Dunes
Nesting Sites, major roosting sites, criticalhabitat Haul out, Rookeries Bay, Estuary
28
Adjacent Species of Concern - If Present
Least Tern, snowy plover, Brown Pelican
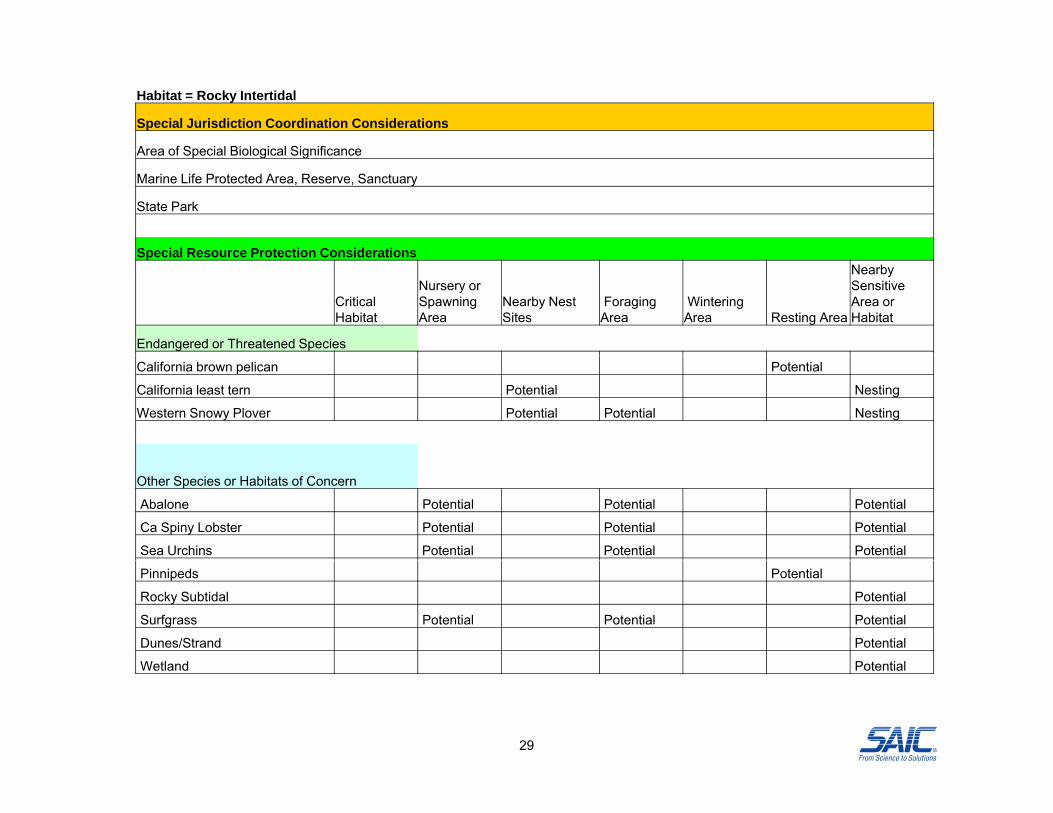
Habitat = Rocky Intertidal
Special Jurisdiction Coordination Considerations
Area of Special Biological SignificanceArea of Special Biological Significance
Marine Life Protected Area, Reserve, Sanctuary
State Park
Special Resource Protection ConsiderationsSpecial Resource Protection Considerations
Critical Habitat
Nursery or Spawning Area
Nearby Nest Sites
Foraging Area
Wintering Area Resting Area
Nearby Sensitive Area or Habitat
Endangered or Threatened Species
California brown pelican Potential
California least tern Potential Nesting
Western Snowy Plover Potential Potential Nesting
Other Species or Habitats of Concern
Abalone Potential Potential Potential
Ca Spiny Lobster Potential Potential Potential
Sea Urchins Potential Potential Potential
Pinnipeds Potential
Rocky Subtidal Potential
Surfgrass Potential Potential Potential
Dunes/Strand Potential
W tl d P t ti l
29
Wetland Potential

Habitat = Rocky Intertidal Project Type Sand Placement at Nearby Beach
R C t i I t b t Fi h Bi d M i M l V t ti Oth
Impact Considerations
● Equipment (e.g., pipelines) Damage Disturbance Disturbance Disturbance Damage
Resource Categories Invertebrates Fish Birds Marine Mammals Vegetation Other
Contaminant Spill ContaminateContaminate Prey
Contaminate Prey, Oiling Harm
Habitat Degradation
Entrainment
Li htiPredator Att tiLighting Attraction
Noise Disturbance Disturbance
Vehicles (Damage)
● Sediment burial/removal
● Sedimentation
HabitatDegradation, Loss
HabitatDegradation, Loss
HabitatDegradation, Loss
HabitatDegradation, Loss
Inlet Closure, Degrade Habitat
30
● TurbidityFeeding, Recruitment Disturbance Foraging
Habitat Degradation
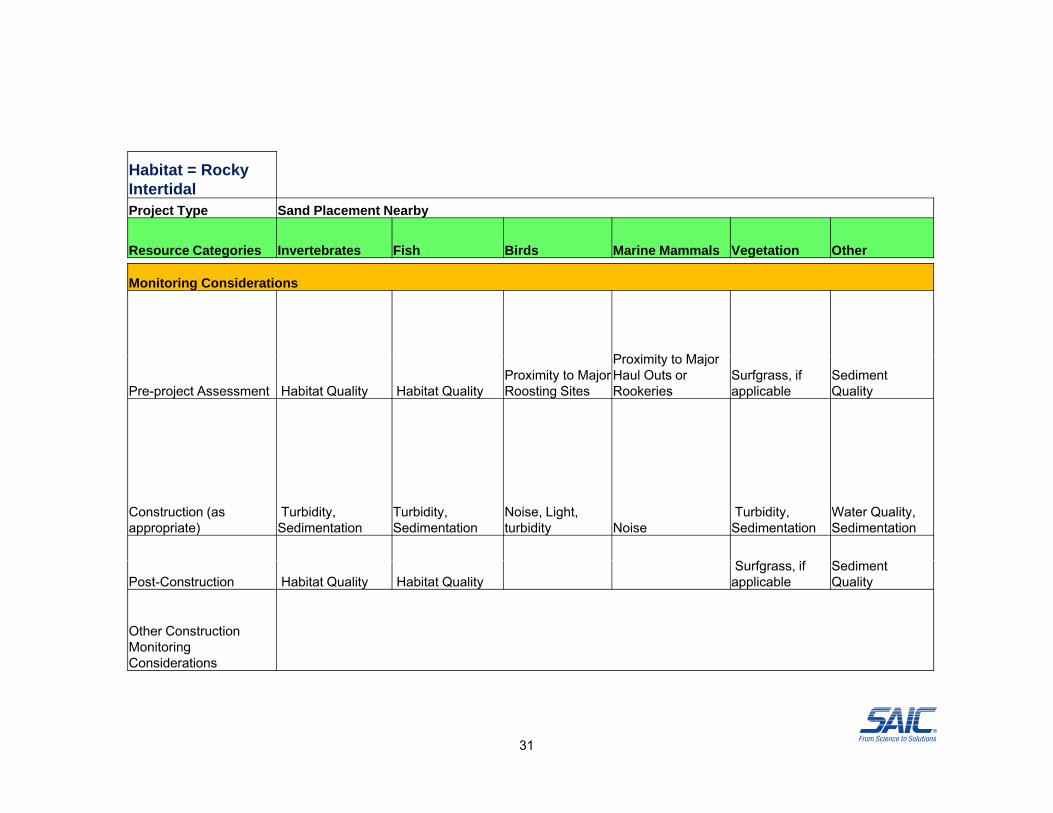
Habitat = Rocky Intertidal Project Type Sand Placement Nearby
Resource Categories Invertebrates Fish Birds Marine Mammals Vegetation OtherResource Categories Invertebrates Fish Birds Marine Mammals Vegetation Other
Monitoring Considerations
P i it t M j
Pre-project Assessment Habitat Quality Habitat QualityProximity to Major Roosting Sites
Proximity to Major Haul Outs or Rookeries
Surfgrass, if applicable
Sediment Quality
Construction (as appropriate)
Turbidity, Sedimentation
Turbidity, Sedimentation
Noise, Light, turbidity Noise
Turbidity, Sedimentation
Water Quality, Sedimentation
Post-Construction Habitat Quality Habitat QualitySurfgrass, if applicable
Sediment Quality
Other Construction Monitoring Considerations
31
Considerations
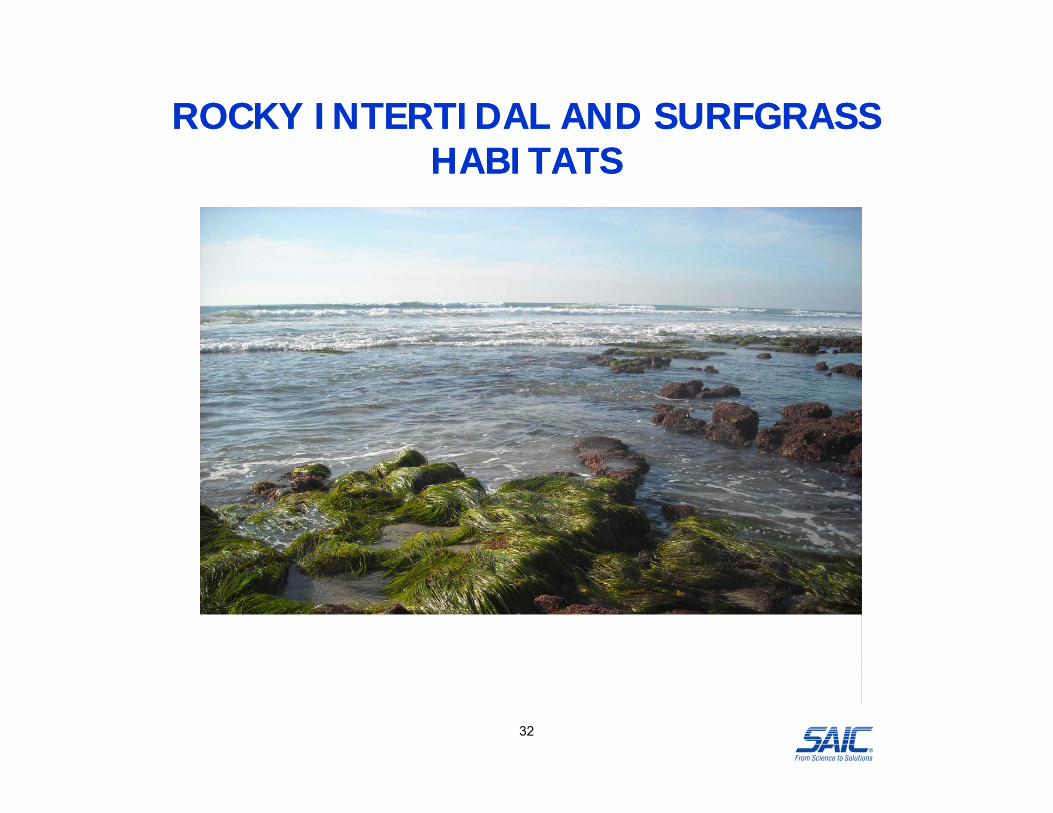
ROCKY INTERTIDAL AND ROCKY INTERTIDAL AND SURFGRASSSURFGRASSHABITATSHABITATSHABITATS HABITATS
32

Round-Table DiscussionGuideline Development Considerations
• Issues of Concern• BMPs Mitigation Measures• BMPs, Mitigation Measures• Identify guideline topics of particular interest
Di id li id i i• Discuss guideline considerations to improve resource protection of beneficial uses Id tif iti l d t• Identify critical data gaps
33

Sediment Management ActivitiesSediment Management Activities
B h N i h t Beach Nourishment Discharge – Receiving Site
Sand Maintenance Relocate Sand – Backpass, Bypass
Other Activities - Beach Grooming Rework Sand - Remove Debris Rework Sand Remove Debris
34
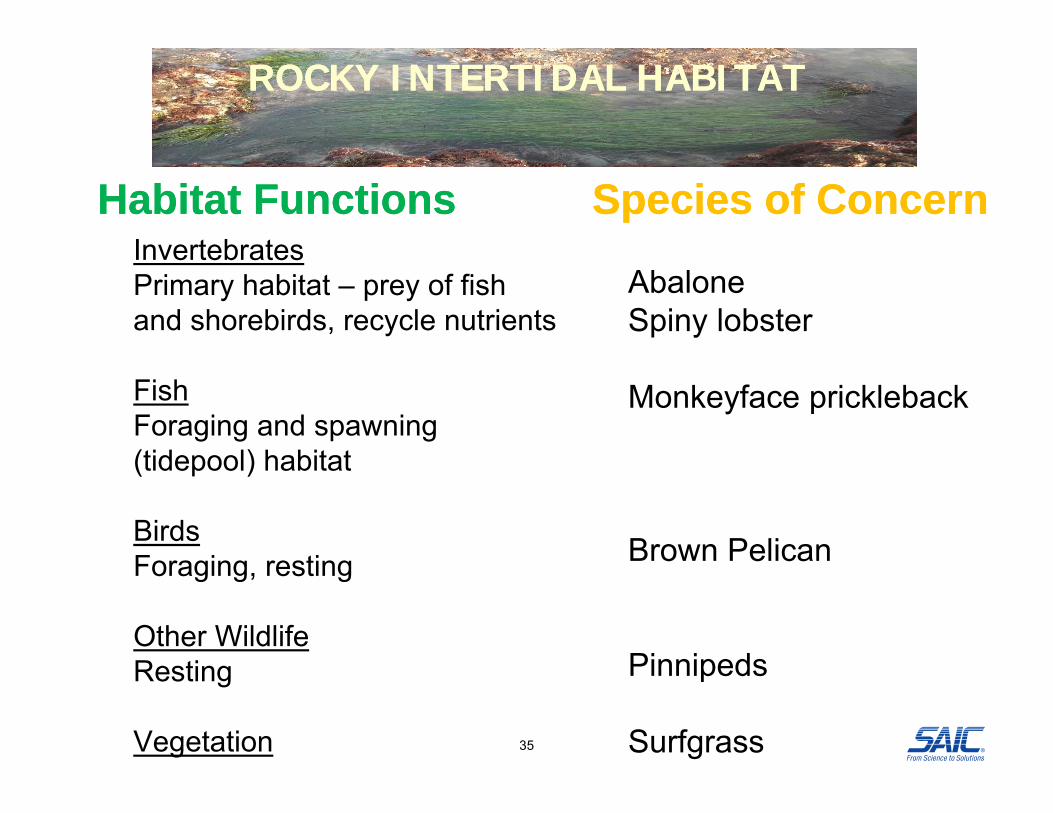
ROCKY INTERTIDAL HABITATROCKY INTERTIDAL HABITAT
Habitat FunctionsHabitat Functions• Invertebrates
Species of ConcernSpecies of ConcernInvertebrates
• Primary habitat – prey of fish and shorebirds, recycle nutrients
• Abalone• Spiny lobster
• Fish• Foraging and spawning
(tidepool) habitat
• Monkeyface prickleback
(tidepool) habitat
• BirdsForaging resting • Brown Pelican• Foraging, resting
• Other WildlifeR ti
Brown Pelican
• Pinnipeds• Resting
• Vegetation
• Pinnipeds
• Surfgrass35
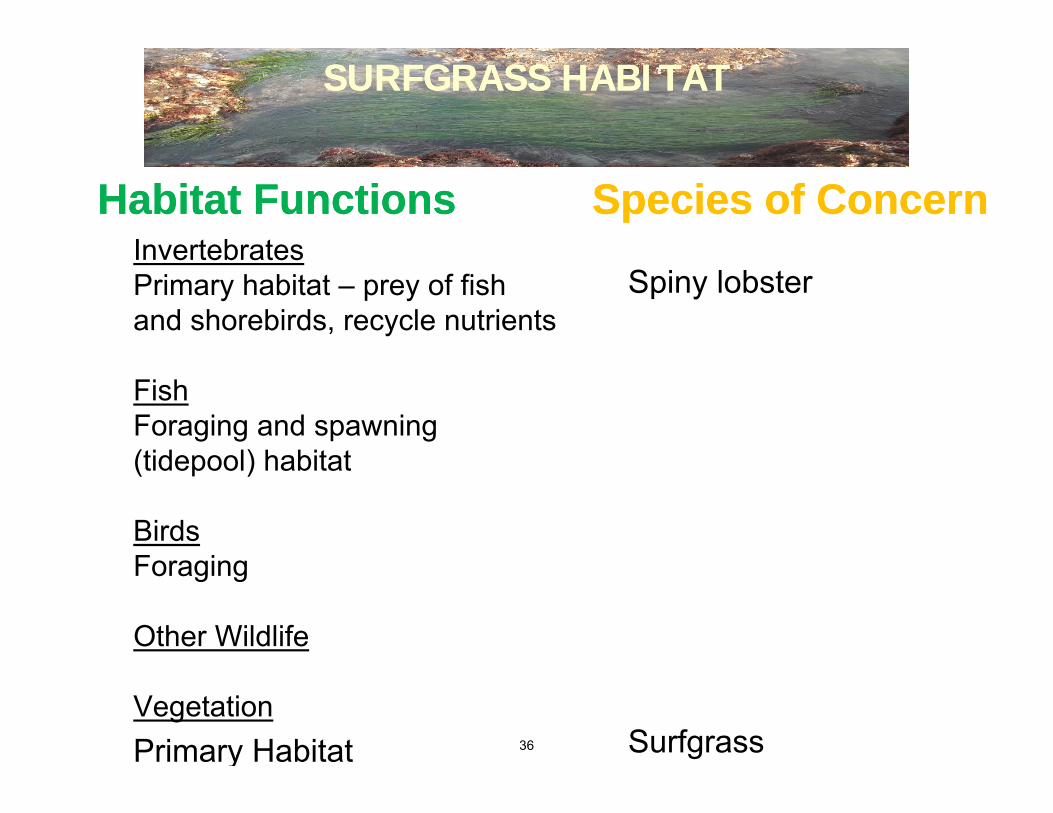
SURFGRASS HABITATSURFGRASS HABITAT
Habitat FunctionsHabitat Functions• Invertebrates
Species of ConcernSpecies of ConcernInvertebrates
• Primary habitat – prey of fish and shorebirds, recycle nutrients
• Spiny lobster
• Fish• Foraging and spawning
(tidepool) habitat(tidepool) habitat
• BirdsForaging• Foraging
• Other Wildlife
• Vegetation• Primary Habitat • Surfgrass36
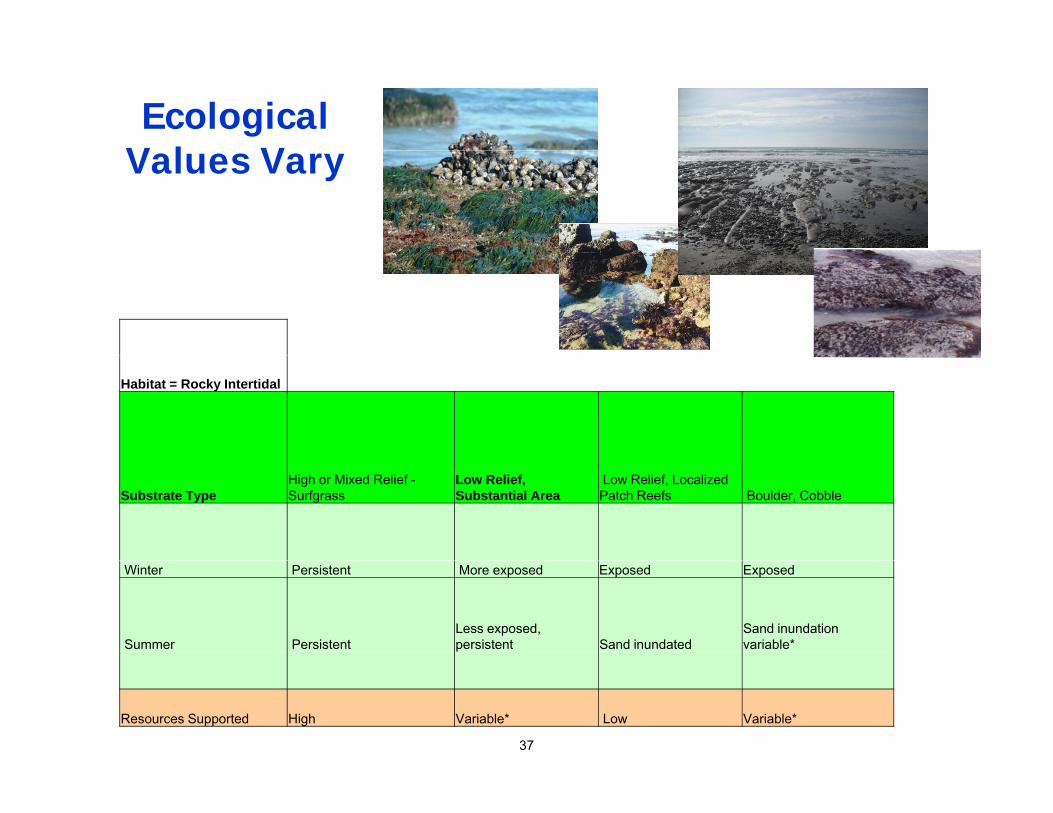
Ecological V l VValues Vary
Habitat = Rocky Intertidal
Substrate TypeHigh or Mixed Relief -Surfgrass
Low Relief, Substantial Area
Low Relief, Localized Patch Reefs Boulder, Cobble
Winter Persistent More exposed Exposed Exposed
Summer PersistentLess exposed, persistent Sand inundated
Sand inundation variable*
37
Resources Supported High Variable* Low Variable*

Potential Sand Placement ImpactsPotential Sand Placement Impacts
Equipment Damage (Anchors Chains Damage (Anchors, Chains,
Pipelines, Propellers) Noise Disturbance of Sensitive
Species Accidental Spillsp
Turbidity Reduce Vegetative Growth Interfere with Seabird Foraging Interfere Fish Foraging/Respiration
Indirect Sedimentation H bit t L Habitat Loss Degrade Habitat Function Reduce Vegetative Recruitment Impact Spawning Grounds I l t Sh li Cl Inlet Shoaling, Closure

Rocky Intertidal/SurfgrassRocky Intertidal/Surfgrass
• Issue of Concern • Sedimentation, Turbidity, Damage
• Resource Protection Considerations Proximity to reef
Project size and duration
Measures to minimize sedimentation Measures to minimize sedimentation
Avoid habitat degradation or loss
Anchor and pipelines plans to avoid hard bottom areas 39

Abalone, LobsterAbalone, LobsterAbalone, LobsterAbalone, Lobster
• Issue of Concern• Reef sedimentation, turbidity, damage Black abalone
Photo credit: http://www.marine.gov
• Protection Considerations Mi i i t bidit Minimize turbidity
Avoid habitat degradation or loss
Avoid equipment on or near reefs
40

TidepoolTidepool FishFishTidepoolTidepool Fish Fish
• Issue of Concern • Reef sedimentation, turbidity, disturbance
• Monkeyface prickleback• Photo credit: Daniel Gotshall
, y,
• Protection Considerations Minimize turbidity
Avoid habitat degradation or loss
Avoid equipment on or near reefs
41
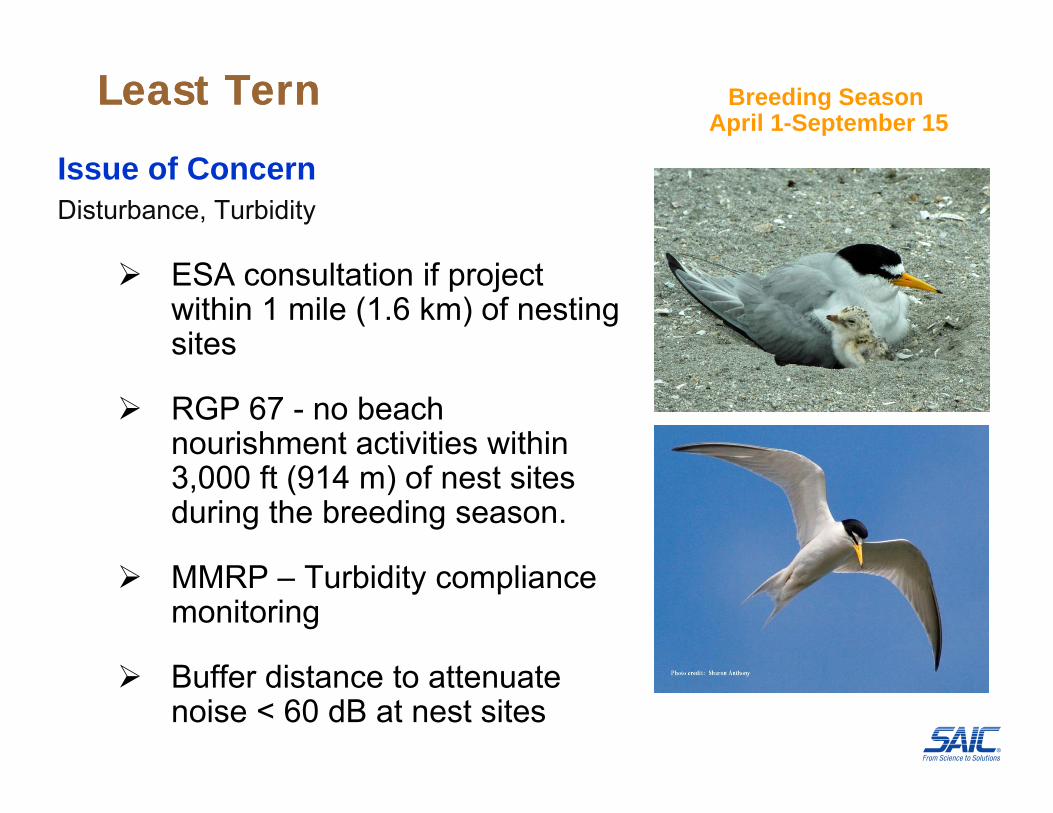
Least TernLeast Tern Breeding Season April 1-September 15
Issue of Concern Disturbance, Turbidity
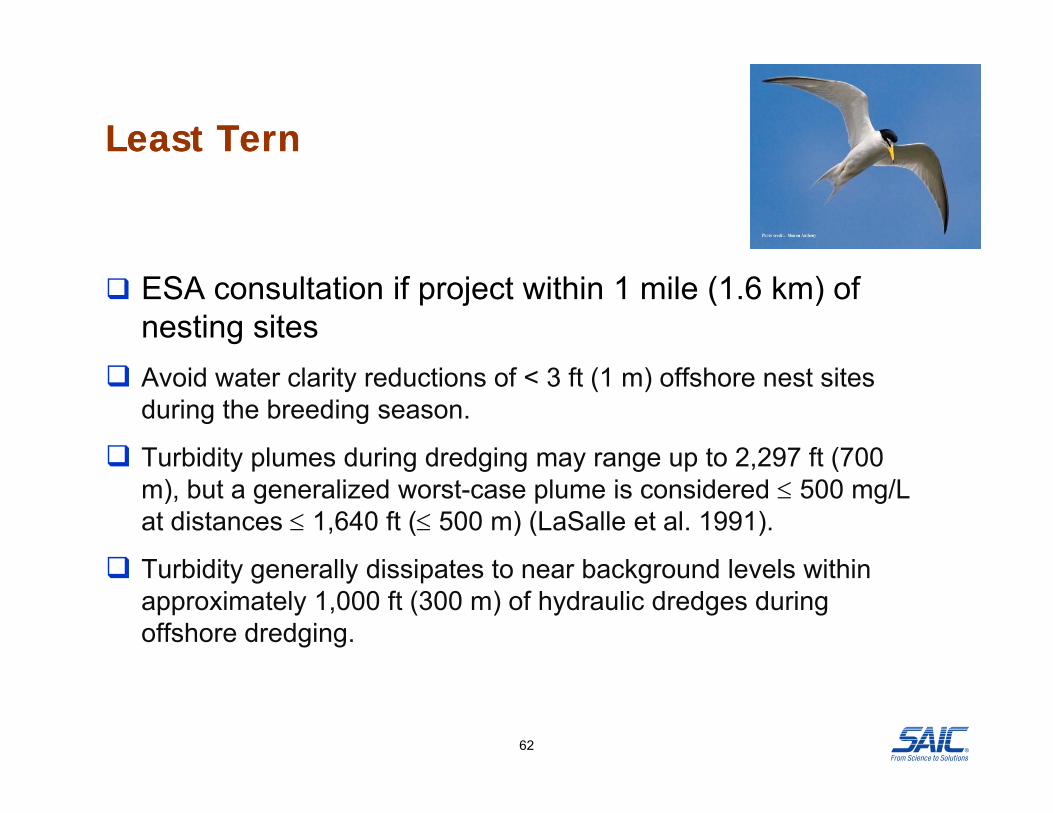
ESA consultation if project within 1 mile (1.6 km) of nesting sites
RGP 67 - no beach nourishment activities within 3,000 ft (914 m) of nest sites during the breeding season.
MMRP – Turbidity compliance monitoring
Buffer distance to attenuate noise < 60 dB at nest sites

Brown PelicanBrown Pelican
• Issue of Concern • Disturbance, Turbidity
Buffer distance to attenuate noise < 60 dB at major roost sitessites
MMRP – Turbidity compliance monitoringcompliance monitoring

Shorebirds, Seabirds Shorebirds, Seabirds
Minimize turbidityMinimize turbidity
Avoid equipment on or near reefs.
Use buffer to attenuate noise to < 60 dB near nesting sites
Avoid removal of all beach wrack
Creation of Foraging Habitat at Cardiff Beach (SAIC 2005)
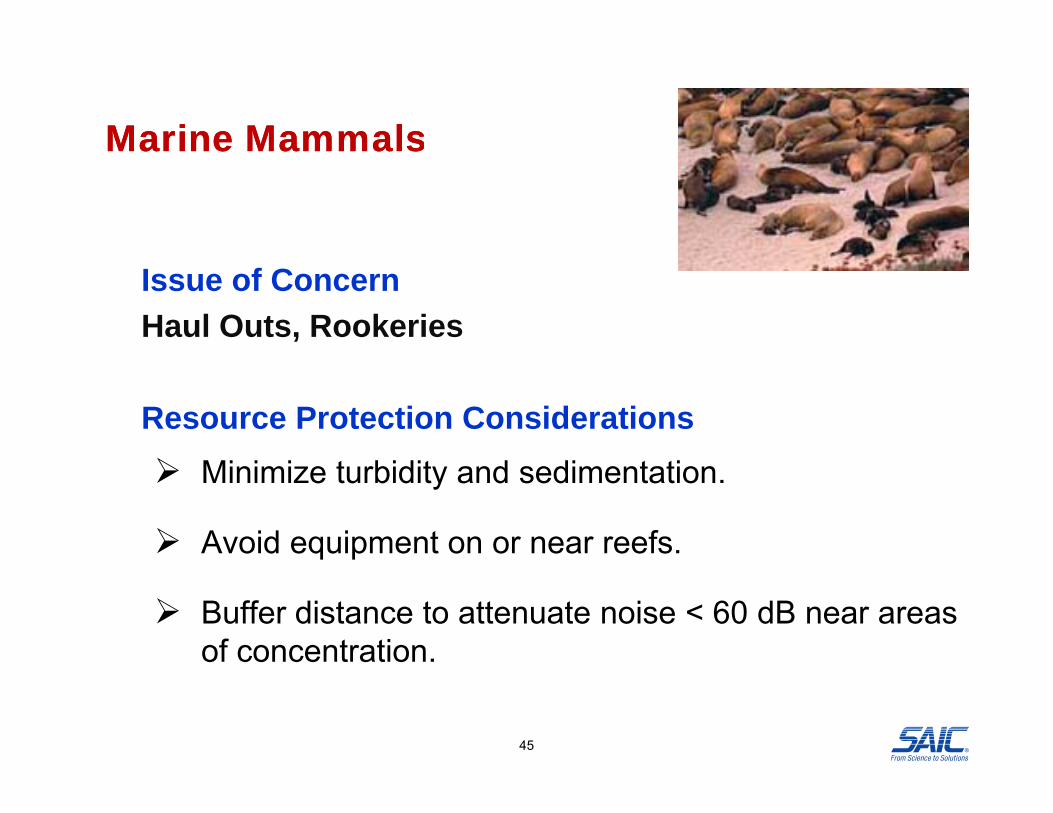
Marine MammalsMarine MammalsMarine MammalsMarine Mammals
• Issue of Concern • Haul Outs, Rookeries
• Resource Protection Considerations Minimize turbidity and sedimentation.
Avoid equipment on or near reefs.
Buffer distance to attenuate noise < 60 dB near areas of concentration.
45
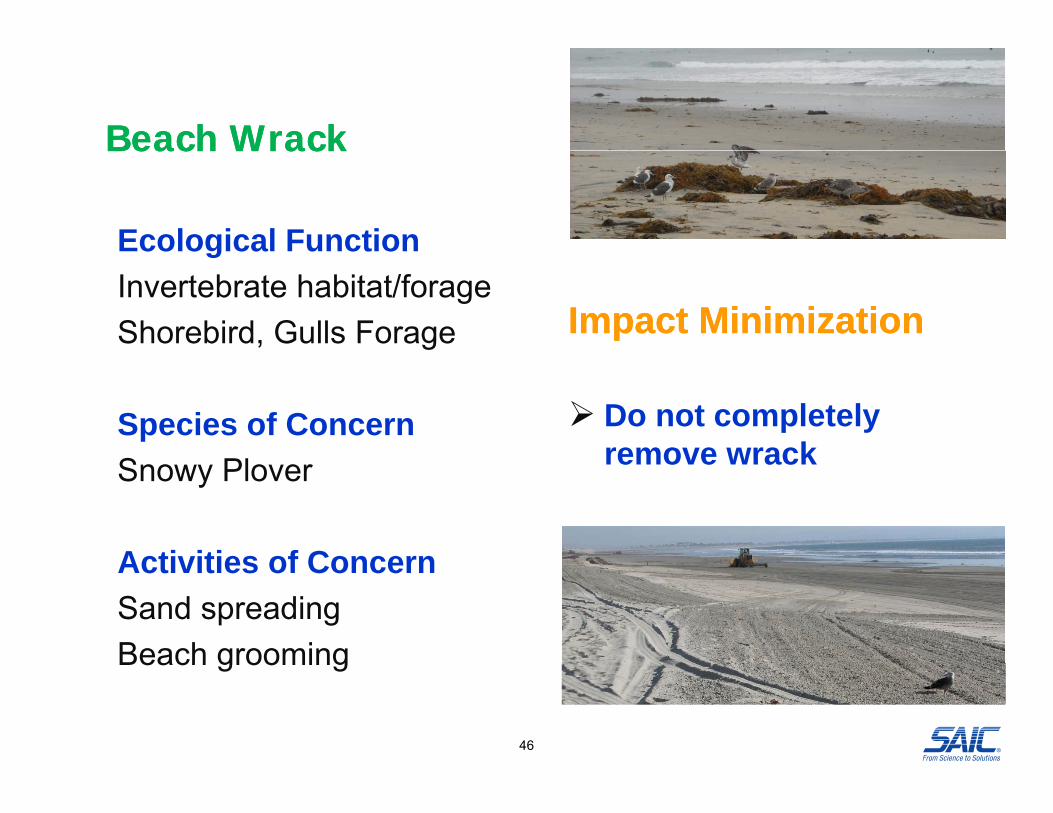
Beach WrackBeach WrackBeach WrackBeach Wrack
• Ecological Functiong• Invertebrate habitat/forage• Shorebird, Gulls Forage Impact MinimizationImpact Minimization
• Species of ConcernS
Do not completely remove wrack• Snowy Plover
• Activities of Concern
remove wrack
• Activities of Concern• Sand spreading • Beach groomingBeach grooming
46

Strand and Dune VegetationStrand and Dune VegetationStrand and Dune VegetationStrand and Dune Vegetation
• FunctionsImpact MinimizationImpact Minimization• Dune stabilization
• Wildlife habitat/forage No work zones 50-ft vehicle corridors
• Species of Concern Supports for pipelines• Native vegetation
• Blue butterflies• Globose dune beetle• Globose dune beetle
• Activities of Concern
47
Activities of Concern• Vehicles, Pipelines• Trampling

TurbidityTurbidityTurbidityTurbidity
Naturally occurs in areas of rip currents, during storms.
B h i h t it i Beach nourishment monitoring Turbidity mainly confined within the surf zone unless carried
offshore by rip currents.
Under rip current conditions, turbidity plumes may be visible downcurrent for > 2 mi (3.2 km) and extend outside the breaker zone (MEC 1997, Sherman et al. 1998, AMEC 2002).
Under non-rip conditions, plumes may be < 1,000 ft (305 m) long and within the surf zone (MEC 1997, AMEC 2002, Moffatt & Nichol 2003, other data files reviewed in Section 5.5.3.5).
48

TurbidityTurbidity
RGP 67RGP 67
80% sand, < 10% difference from receiving beach
Temporary dike (SANDAG 2001)
Use dikes or swales to slow rate of release of fines
Generally limits turbidity to the surf zone except in Generally limits turbidity to the surf zone, except in areas of rip currents (MEC 1997, AMEC 2002, Moffatt & Nichol 2004).
)
Proximity to InletProximity to InletProximity to InletProximity to Inlet
Issue of Concern Inlet ClosureSedimentation – increased maintenance
Protection Considerations
Monitor to determine if inlet closure occurs due to sedimentation. If closure is observed, then remove material as necessary until the inlet area has stabilized (BEACON Demonstration project measure).
Contribute funds to inlet maintenance program (SANDAG RBSP I measure).
50
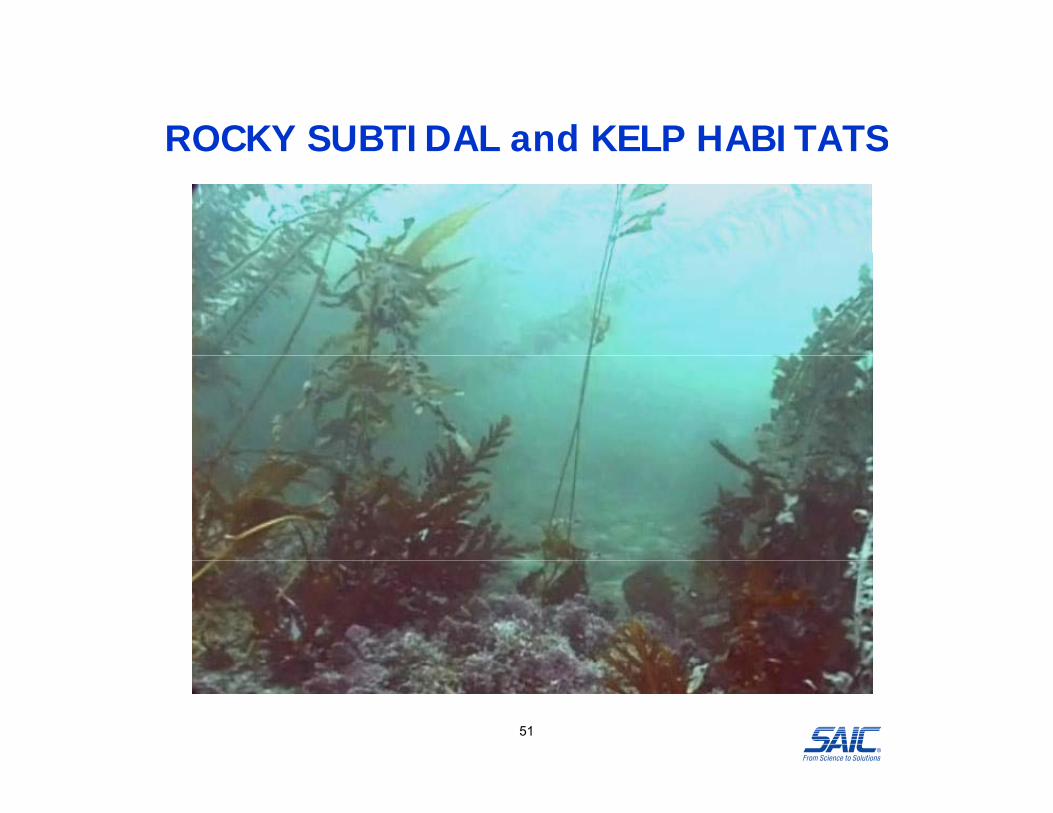
ROCKY SUBTIDAL and KELP HABITATSROCKY SUBTIDAL and KELP HABITATS
51
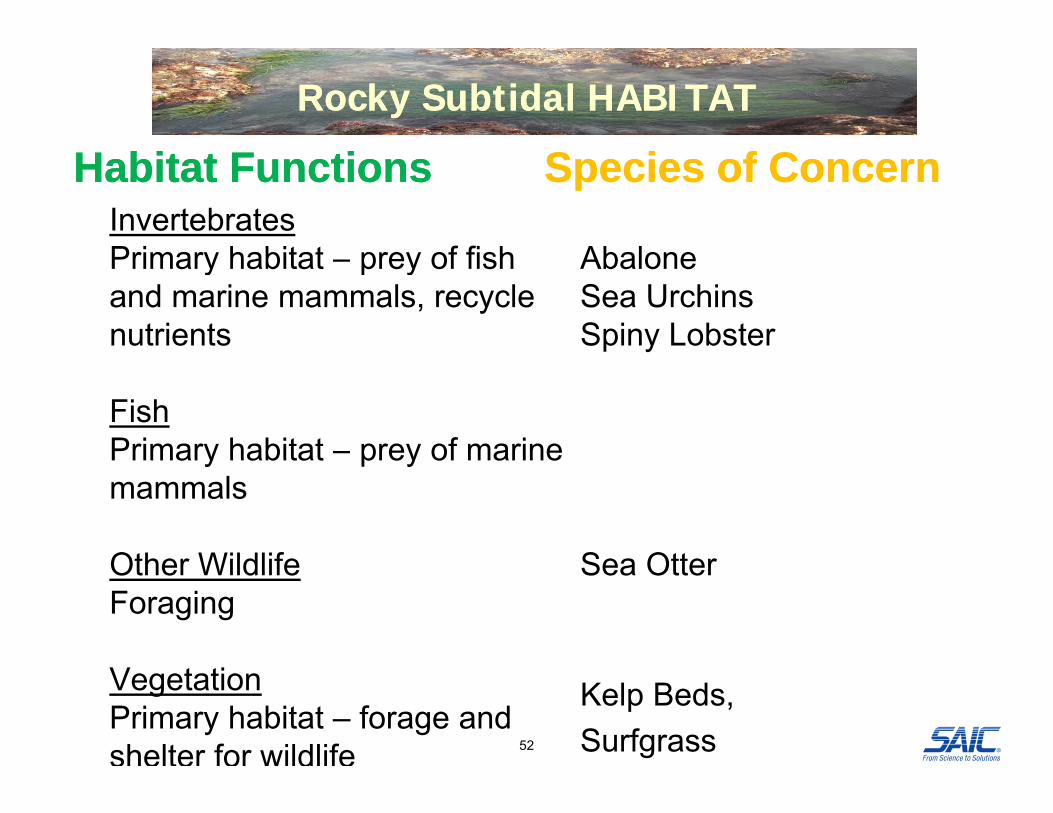
Rocky Rocky SubtidalSubtidal HABITATHABITAT
Habitat FunctionsHabitat Functions• Invertebrates• Primary habitat prey of fish
Species of ConcernSpecies of Concern
• Abalone• Primary habitat – prey of fish and marine mammals, recycle nutrients
• Abalone• Sea Urchins • Spiny Lobster
• Fish• Primary habitat – prey of marinePrimary habitat prey of marine
mammals
• Other Wildlife • Sea Otter• Other Wildlife• Foraging
• Sea Otter
• Vegetation• Primary habitat – forage and
shelter for wildlife
• Kelp Beds,• Surfgrass52
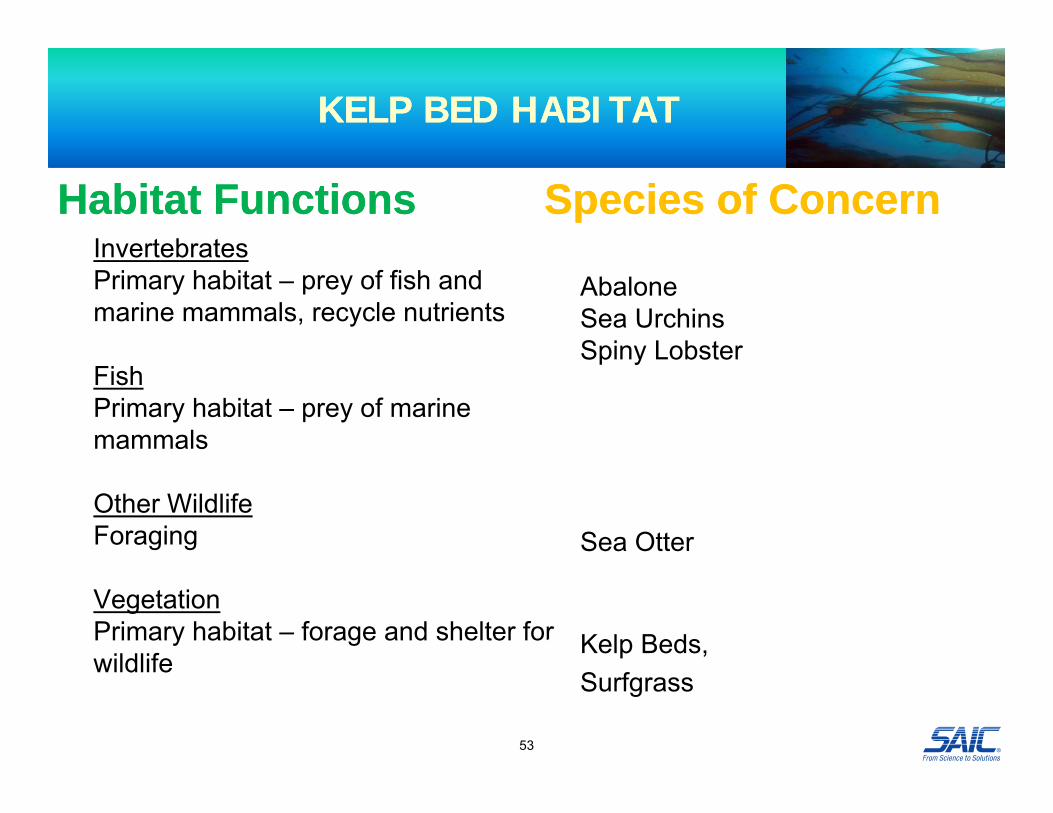
KELP BED HABITATKELP BED HABITAT
Habitat FunctionsHabitat Functions• Invertebrates
Species of ConcernSpecies of ConcernInvertebrates
• Primary habitat – prey of fish and marine mammals, recycle nutrients
• Abalone• Sea Urchins • Spiny Lobster
• Fish• Primary habitat – prey of marine
mammals
Spiny Lobster
• Other Wildlife• Foraging • Sea Otter
• Vegetation• Primary habitat – forage and shelter for
wildlife• Kelp Beds,
wildlife • Surfgrass
53

Ecological Ecological Values VaryValues VaryValues VaryValues Vary
Photo credit: San Diego Nearshore Program http://nearshore.ucsd.edu/
Habitat = Rocky Subtidal
Substrate Type High or Mixed ReliefLow Relief, Substantial Area
Low Relief, Localized Patch Reefs Boulder, Cobble
Winter PersistentSand influence variable* Sand scour Sand scourWinter Persistent variable* Sand scour Sand scour
Summer Persistent More exposed More exposed More exposed
54
Resources Supported High Variable* Low Low

Round-Table DiscussionGuideline Development Considerations
• Issues of Concern• BMPs Mitigation Measures• BMPs, Mitigation Measures• Identify guideline topics of particular interest
Di id li id i i• Discuss guideline considerations to improve resource protection of beneficial uses Id tif iti l d t• Identify critical data gaps
55

Sediment Management ActivitiesSediment Management Activities
B Sit Borrow Site Dredging - Sand Source Dredging
Nearshore Placement Discharge - Receiving Site
56
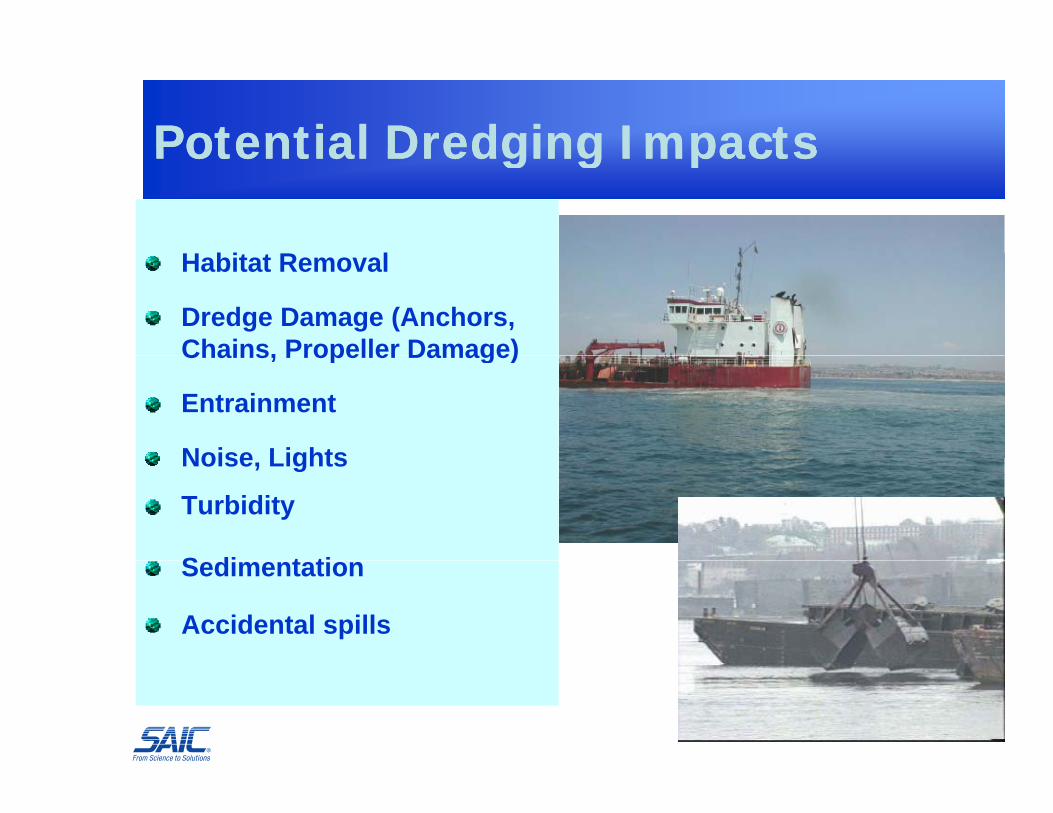
Potential Dredging ImpactsPotential Dredging ImpactsPotential Dredging ImpactsPotential Dredging Impacts
H bi R lHabitat Removal
Dredge Damage (Anchors, Chains, Propeller Damage)Chains, Propeller Damage)
Entrainment
Noise LightsNoise, Lights
Turbidity
S di t tiSedimentation
Accidental spills

Potential Potential NearshoreNearshore Placement Placement ImpactsImpacts
H bi B i lHabitat Burial
Damage (Anchors, Chains, Propellors)Propellors)
Noise, Lights
T biditTurbidity
Sedimentation
Accidental spills

Rocky Reef/Kelp BedsRocky Reef/Kelp BedsRocky Reef/Kelp BedsRocky Reef/Kelp Beds
• Issue of Concern • Sedimentation, Turbidity, Damage
Photo credit: San Diego Nearshore Program http://nearshore.ucsd.edu/
• Resource Protection Considerations Proximity to reef - Project Size, Duration, Sediment
CharacteristicsCharacteristics
Turbidity light level thresholds
Measures to minimize sedimentation
V l id t id k l b d Vessel corridors to avoid kelp beds
Anchor and pipelines plans to avoid hard bottom areas 59

InvertebratesInvertebratesInvertebratesInvertebrates
• Issue of Concern Live Bottom Fisheries (Abalone Lobster Sea Urchins)Live Bottom Fisheries (Abalone, Lobster, Sea Urchins)
• Resource Protection ConsiderationsResource Protection Considerations Minimize turbidity and sedimentation
Avoid equipment on or near reefs
60
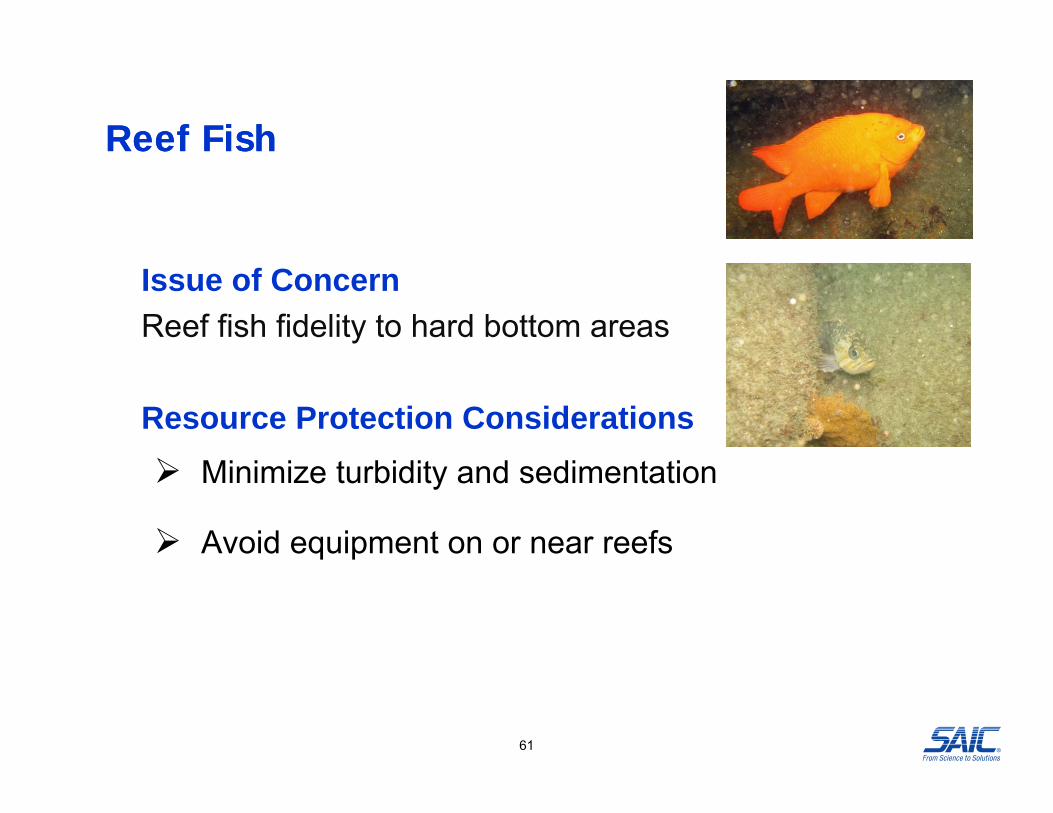
Reef FishReef FishReef FishReef Fish
• Issue of Concern • Reef fish fidelity to hard bottom areas
• Resource Protection Considerations Minimize turbidity and sedimentation
Avoid equipment on or near reefs
61
Least TernLeast TernLeast Tern Least Tern
ESA consultation if project within 1 mile (1.6 km) of nesting sites
Avoid water clarity reductions of < 3 ft (1 m) offshore nest sites during the breeding season.
Turbidity plumes during dredging may range up to 2 297 ft (700 Turbidity plumes during dredging may range up to 2,297 ft (700 m), but a generalized worst-case plume is considered 500 mg/L at distances 1,640 ft ( 500 m) (LaSalle et al. 1991).
T bidit ll di i t t b k d l l ithi Turbidity generally dissipates to near background levels within approximately 1,000 ft (300 m) of hydraulic dredges during offshore dredging.
62
Marine MammalsMarine MammalsMarine MammalsMarine Mammals
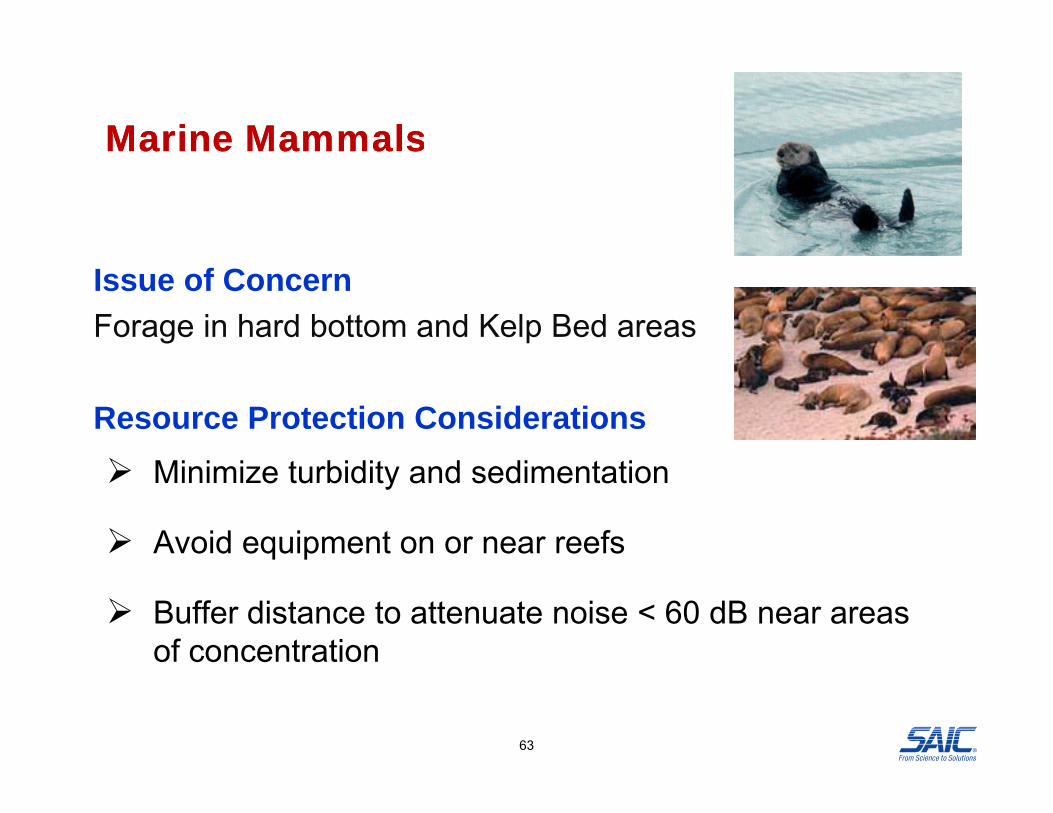
• Issue of Concern • Forage in hard bottom and Kelp Bed areas
• Resource Protection Considerations Minimize turbidity and sedimentation
Avoid equipment on or near reefs
Buffer distance to attenuate noise < 60 dB near areas of concentration
63

Types of BMPs and Effectiveness C id tiConsiderations
• Operational ControlsC l Ti– Cycle Time
– Bucket Dredges • Eliminate multiple bites, bottom stockpiling• Waterline pause to drain excess water
– Cutterhead Dredge • Reduce rotation and swing speeds, bank undercuttingReduce rotation and swing speeds, bank undercutting• Increase pump rates• Operate below sediment surface
Hopper Dredge– Hopper Dredge • Reduce Overflow, fill level• Use morninglory spillway - conveys overflow subtidally
64
– Halt and Adjust
Water Clarity - Nearshore Placement25
Marina Del Rey to Redondo Beach
15
20
pth
(feet
)
2000
Mean (N = 6)
Marina Del Rey to Long Beach
1998
Mean (N = 21)
Oceanside
10
Secc
hi D
isk
Dep Oceanside
1998
Mean (N = 18)
Oceanside
1997
Mean (N = 7)
0
5
S Oceanside
1996
Mean (N = 9)
Oceanside
1994
M (N 7)
1200
-2000
1000
650-1
000
500-6
5030
0-500
200-3
0010
0-200
0-100
100-2
0020
0-300
300-5
0050
0-650
650-1
000
1000
1200
-2000
Downcoast Distance from Discharge (feet) Upcoast
Mean (N = 7)
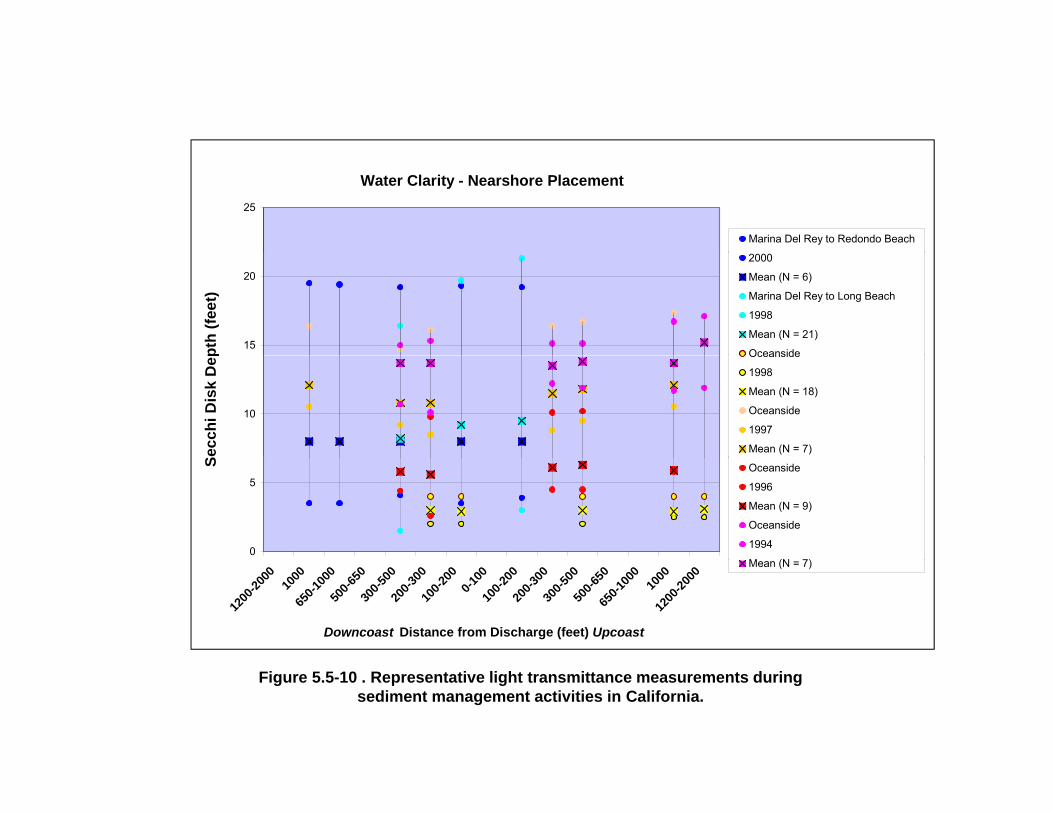
Figure 5.5-10 . Representative light transmittance measurements during sediment management activities in California.
Turbidity - Borrow Site Dredging
140
S0-9 Surface2001Mean (N = 4) SO-9 Bottom 2001
100
120
Mean (N = 4) SO-7 Surface2001Mean (N = 15) SO-7 Bottom 2001Mean (N =15)
80
100
NTU
Mean (N 15)SO-6 Surface2001Mean (N = 4) SO-6 Bottom2001Mean (N = 4)
40
60 SO-5 Surface2001Mean (N = 13) SO-5 Bottom2001Mean (N = 13) MB-1 Surface
0
20
000
500
000
650
500
300
200
100
200
300
500
650
000
500
000
Su ace2001Mean (N = 5)MB-1 Bottom 2001Mean (N = 5) SS-1 Surface2001
1500
-200
1000
-150
650-1
0050
0-65
300-5
020
0-30
100-2
0
0-10
100-2
020
0-30
300-5
050
0-65
650-1
0010
00-15
015
00-20
0
Downcoast Distance from Dredge (feet) Upcoast
2001(N = 1) SS-1 Bottom 2001(N = 1)
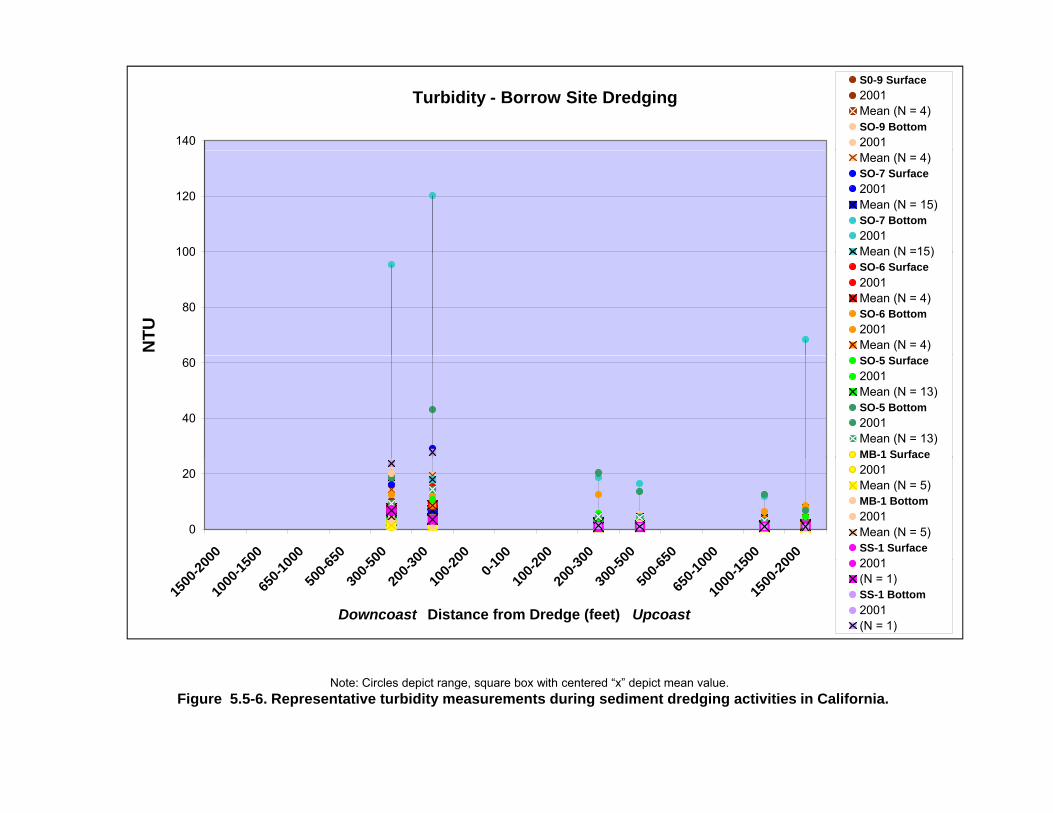
Note: Circles depict range, square box with centered “x” depict mean value. Figure 5.5-6. Representative turbidity measurements during sediment dredging activities in California.

Final RemarksFinal Remarks
67

Workshop Process and ProductsWorkshop Process and Products
WorkshopsWorkshopspp
Summarize Received InputSummarize Received Input
Develop Draft GuidelinesDevelop Draft Guidelines Develop Draft GuidelinesDevelop Draft Guidelines
Guideline ReviewGuideline Review
Incorporate Guidelines into Documents Incorporate Guidelines into Documents – BIA Document
U ’ G id– User’s Guide
68

Next StepsNext Steps
•• WorkshopsWorkshops -- FebFeb--August 2010August 2010pp gg
•• Draft GuidelinesDraft Guidelines -- Oct 2010Oct 2010
•• Guideline ReviewGuideline Review OctOct Nov 2010Nov 2010•• Guideline ReviewGuideline Review -- OctOct--Nov 2010Nov 2010
•• Finalize BIA DocumentFinalize BIA Document -- DecDec--Jan 2010Jan 2010
’ G’ G•• User’s GuideUser’s Guide -- Dec 2010 Dec 2010 -- Jan 2011Jan 2011
•• Work Plan Work Plan -- Dec 2010 Dec 2010 –– Jan 2011Jan 2011
69

Workshop Series
Date (2010) Location Key TopicsFebruary 18 Long Beach General Approach to Guideline Development,
NOAA Resource Agency Coordination
February 24 SacramentoEPA
Water Quality, Water-Sediment Resource Protection in Watersheds, Resource Protection Managed AreasResource Protection Managed Areas
June 16 CarlsbadUSFWS
Habitats: Sandy Beach, Dune/Strand, Sandy Subtidal
July 1 Monterey Habitats: Rocky Intertidal Rocky SubtidalJuly 1 MontereyMBARI
Habitats: Rocky Intertidal, Rocky Subtidal, Surfgrass, Kelp Beds
July 13 OaklandSEI
Habitats: Bays, Lagoons, EelgrassSEI
July 14 EurekaHumboldt BRCD
Habitats: Bays/Wetlands and Commercial Fisheries
August 4 San Diego Impact Assessment, Monitoring, Database Tools
70
August 4 San Diego SCCWRP
Impact Assessment, Monitoring, Database Tools

Next Steps
Workshop ParticipationWorkshop Participation
ContactsContacts• Karen d green@saic com; greenka@saic com• [email protected]; [email protected]• [email protected]• [email protected]
Document LinksDocument Links• http://www.dbw.ca.gov/CSMW/default.aspx
71


![1 3 4 Reference: ZDHC wastewater guidelines, Pg. 9 ......2370-65-7 76057-124] 877-11-2 RepŒti 2B: 8260B, Dich ISO losn usEPA ISO 1 USEPA USEPA 1 "4 g. usEPA usEPA usEPA usEPA usEPA](https://img.pdfslide.net/doc/110x75/610e853285f7f7713133afc2/1-3-4-reference-zdhc-wastewater-guidelines-pg-9-2370-65-7-76057-124.jpg)