Embed Size (px)
Citation preview

Resource Use and Habitat Utilization of Malayan Sun Bear (Helarctos malayanus) in Harapan
Rainforest, Sumatra
SUPPORTED BY
The Bear Conservation Fund of the International Association for Bear Research and Management
End of project report
July 2011
TABLE OF CONTENTS
Project summary………………………………………………………………………………………………………………… 1 Objectives………………………………………………………………………………………………………………………….. 1 Summary of results……………………………………………………………………………………………………………. 1 Methods……………………………………………………………………………………………………………………………. 2 Map of study area…………………………………………………………………………………………………………….. 3 Results……………………………………………………………………………………………………………………………… 4 Tree species data……………………………………………………………………………………………………………. 4 Habitat characteristics…………………………………………………………………………………………………… 7 Tree structural data………………………………………………………………………………………………………. 11 Germination trials…………………………………………………………………………………………………………. 12 Capacity building………………………………………………………………………………………………………….. 12 Recommendations………………………………………………………………………………………………………… 13 Future work………………………………………………………………………………………………………………….. 13 References……………………………………………………………………………………………………………………. 14 Project budget……………………………………………………………………………………………………………… 15 Project photographs……………………………………………………………………………………………………. 16

1
Resource Use and Habitat Utilization of Malayan Sun Bear (Helarctos malayanus) in Harapan Rainforest, Sumatra.
PROJECT SUMMARY
The dry lowland forests of Sumatra represent one of the most diverse yet threatened habitats on earth. Harapan Rainforest (HRF) is an initiative, based in the southeast of Sumatra that will conserve and restore the largest remaining tract of this habitat. The site contains a population of Malayan Sun Bear (Helarctos malayanus), which is considered a high research priority as it is the least known bear species in the world and is likely to play an important role in seed dispersal and, hence, forest restoration at the site. This research project received a grant of $5,100 from The International Bear Association in June 2010 to assess habitat characteristics and resource use of sun bears in HRF, a previously logged, dry lowland forest in Sumatra. Studies of sun bear resource use in logged habitat are extremely important as the future of the Malayan Sun Bear is (sadly) likely to depend increasingly on this degraded habitat type in the future. The results from this study will help inform replanting schemes and generate management recommendations for the Malayan Sun Bear population in HRF, and international conservation measures for the species.
OBJECTIVES
The overall aim is to advance our knowledge of Malayan Sun Bear within HRF so that a viable self-sustaining population can be protected within the site, thus improving the conservation status of the species. This will be achieved by the specific objectives to:
Identify the use of different trees by Malayan sun bears
Assess characteristics of trees used by sun bears
Initiate germination trials to assess the success rate of seeds found in sun bear scats
Build the capacity of Indonesian students, and project staff through training and direct involvement in survey methods and data management
Provide additional recommendations for the management of the sun bear population within HRF and incorporate this within forest restoration plans
SUMMARY OF RESULTS
Fifteen percent of trees within bear plots were utilized by sun bears
Trees utilized by sun bears came from 19 families, 60 genera and over 30 tree species
Forty percent of sun bear signs were found on trees from the Olacaceae family, specifically on the tree species Ochanostachys amentacea
Bears appear to preferentially select trees of the Olacaceae and Fabaceae families, while under-selecting trees of the Euphorbiaceae, Burseraceae and Dipterocarpaceae families
The height and width of large trees does not influence their use by sun bears, although their architecture may influence their use by sun bears

2
Bear signs tended to be found in taller, drier closed canopy forest with a higher density of large trees and saplings, a greater prevalence of climbers and less herbaceous ground cover
But, because of multicolinearity between habitat variables, the habitat data were reduced to four Principal Component Analysis factors
PCA Factor 1 (increasing forest quality) had a significant positive effect on the presence of sun bear signs; PCA Factor 3 had a significant negative effect on the presence of sun bear signs
Sun bears utilize less disturbed forest areas more than heavily disturbed forest habitats within HRF
Nine Indonesians were trained in sun bear and habitat survey methods along with tree identification and herbarium techniques
METHODS
Field searches for bear scats and trees used by sun bears focused on camera trap locations where bears had already been detected and bird habitat plots (25 m radius plots) where bear signs had previously been recorded. Sun bear habitat plots (50 m x 50 m; 0.25 ha) were set up in two study areas (Figure 1), encompassing a range of forest types. Each study area included 24 plots: 12 plots containing trees with bear signs; and 12 random, control plots with no bear signs present. Field teams, consisting of the HRF research team, and forest patrol staff and two Indonesian students conducted intensive searches for scats and trees (standing or fallen) with bear signs (claw marks, torn open trunks and nests) in these habitat plots.
The ten largest trees (>20 cm diameter at breast height, DBH) in each plot were tagged and their position mapped using a GPS. A total of 480 trees were tagged in these 48 plots. For each tree tagged in the bear and control plots, the DBH, tree and canopy height, canopy cover, tree architecture, including branching pattern (Jones et al. 1995), and whether it had a cavity and was living or decaying was recorded. The presence/absence of bear signs on each tree was also recorded. The age of signs was classified as either ‘new’ (e.g. claw marks with clean, damp bark), ‘recent’ (e.g. dry claw marks) or ‘old’ (e.g. claw marks already healed over) (Steinmetz 2009). An index of tree use by sun bears was produced based on the number of sets of bear claw marks recorded in a 1m wide band centered at breast height on the tree trunk, i.e. from 0.8-1.8m above ground level (Augeri 2005).
Trees tagged within the plots were identified to species/genus level along with their seed dispersal mechanism by a botanical consultant, Mr Deden Girmansyah from the Indonesian Institute of Sciences (LIPI). All trees were identified to genus, but not all could be identified to species. Comparisons of relative abundance of trees in different habitat types and with and without bear signs were conducted for genera for which at least 10 stems were recorded in the habitat plots.
In addition to the measurements made for the ten largest trees, a number of other habitat measurements were recorded in each plot. These reflected the habitat data collection protocols followed at bird survey points and camera trapping locations across HRF. Additional habitat measurements included: elevation, number of climbers, rattans and palms, ground cover and numbers of saplings.

3
Any bear scats found in the bear habitat plots was recorded and these were taken back to the HRF nursery to be processed. Bear scats were also collected ad hoc during general forest survey work.
Seed germination trials were conducted under the same nursery conditions, e.g. substrate, light regime. The number of seeds that germinated and how quickly they did so was recorded, enabling ongoing development of germination curves for particular species, and seedling specimens made to assist future species identification. Each scat sample containing seeds was split so that half were washed and planted and half were left within the scats and planted.
Figure 1 – Maps showing the two study sites in HRF. The red squares show the position of bear plots and blue squares the position of control plots.

4
RESULTS
OBJECTIVE 1 - Identify the use of different trees by Malayan sun bears
OBJECTIVE 2 - Assess characteristics of trees used by sun bears
Summary
Of the 480 trees tagged in the two study areas, 15% (n = 71) had bear signs present. Of these signs, 82% (n = 58) were classified as ‘old’, 17% (n = 12) as ‘medium’ and 1% (n = 1) as ‘new’. Seven percent (n = 5) of trees had a high density of bear signs, 20% (n = 14) had a medium sign density and 73% (n = 52) had a low sign density. The majority of signs (85%) were present from the base of the tree up to canopy level with only 15% (n = 11) stopping below the canopy of the tree
Tree species data
Overall, of the 480 trees tagged within the two study sites, 35 different families were represented, consisting of 71 genera and at least 35 species. The 409 trees without bear signs consisted of 32 families, 69 genera and at least 34 species. Of these, 17 families, 53 genera and at least 24 species never had any bear signs on them.

5
The 71 trees with bear signs consisted of 19 families, 60 genera and over 30 different species. The majority of signs (40%, n = 27) were found on trees of the family Olecaceae, 13% (n = 9) were from the family Fabaceae, and 6% (n = 4) on the families Lauraceae and Euphorbiaceae. The most commonly utilized tree species was Ochanostachys amentacea. Of the 34 stems of this species tagged within plots, 79% (n = 27) had bear signs present. Another prominent species utilized by sun bears was Paraserianthes falcataria. Of the 16 stems of this species identified within the plots, 38% (n = 6) had bear signs present.
The relative abundances of four of the 14 tree genera for which at least 10 stems were recorded in the habitat plots were significantly different between the four habitat types (Table 1). Diospyros spp. and Shorea spp. were more abundant in least disturbed forest, while Evodia spp. were more abundant in more heavily disturbed habitats. Using Tukey-Kramer multiple comparisons with p < 0.05 (q = 3.79, df = 3), the abundance of Geunsia stems was significantly higher in scrub than in medium and high secondary forests. Macaranga stems were more abundant in scrub and low secondary forest than in medium secondary forest.
Table 1 – Mean relative abundances (± SE) of the 14 most abundant tree genera in the habitat plots. ‘nr’ = not recorded in that habitat type, ‘NS’ = not significant.
Tree genus SCR LSF MSF HSF T-statistic
(p value)
Artocarpus nr 0.39 ± 0.14 0.16 ± 0.09 0.13 ± 0.13 NS
Dacryodes nr 0.39 ± 0.21 0.42 ± 0.14 0.25 ± 0.16 NS
Dialium nr 0.23 ± 0.12 0.37 ± 0.14 0.13 ± 0.13 NS
Diospyros nr 0.23 ± 0.12 0.26 ± 0.17 1.10 ± 0.33 3.94 (0.015)
Endospermum nr 0.15 ± 0.15 0.37 ± 0.11 0.25 ± 0.16 NS
Evodia 1.50 ± 0.50 0.77 ± 0.28 0.16 ± 0.16 nr 3.90 (0.016)
Geunsia 4.00 ± 1.00 1.54 ± 0.61 0.26 ± 0.19 0.13 ± 0.13 6.47 (0.001)
Koompassia nr 0.15 ± 0.10 0.47 ± 0.18 0.38 ± 0.18 NS
Macaranga 2.50 ± 1.50 2.39 ± 0.72 0.42 ± 0.18 0.75 ± 0.25 4.42 (0.009)
Ochanostachys nr 0.31 ± 0.13 1.01 ± 0.27 1.00 ± 0.33 NS
Paraserianthes nr nr 0.53 ± 0.53 nr NS
Scaphium 1.0 ± 1.0 0.39 ± 0.14 0.16 ± 0.09 0.13 ± 0.13 NS
Shorea nr nr 1.11 ± 0.28 0.88 ± 0.52 3.32 (0.030)
Syzygium 0.50 ± 0.50 0.46 ± 0.22 0.42 ± 0.14 0.25 ± 0.16 NS
When considering the utilization of specific tree stems, previous studies have found that large trees of Dipterocarpaceae (e.g. Shorea), Euphorbiaceae, Fagaceae (e.g. Lithocarpus), Lauraceae, Moraceae (e.g. Ficus), Myrtaceae and Sapindaceae are most frequently climbed by sun bears (Wong et al. 2002; Augeri 2005). Ficus and Lithocarpus stems are most frequently selected for fruit, with Santiria species also selected, while Shorea species are selected for bedding sites (Wong et al. 2002).
Our study found that stems of Fabaceae and Olacaceae appear preferentially selected by sun bears in this previously logged, dry lowland Sumatran forest (Table 2). Olacaceae is

6
represented by a single species, Ochanostachys amentacea (Petaling), which is known to flower and fruit throughout the year, with mast fruiting also observed in this animal-dispersed species. Like the Fabaceae genera Koompassia and Paraserianthes, it is also more abundant in less disturbed forest in HRF.
Ebenaceae, Moraceae, Myrtaceae, Rutaceae, Sterculiaceae and Lamiaceae appear to be neither preferentially selected nor avoided by sun bears in our study site (Table 2). Euphorbiaceae appear under selected by sun bears, possibly due to the greater abundance of Macaranga trees in more heavily disturbed habitats, while Burseraceae and Dipterocarpaceae stems appear preferentially avoided by bears compared to other tree families. These latter two families include genera identified elsewhere as being selected for fruit and bedding sites, respectively (Wong et al. 2002).
Table 2 – Number of tree stems with and without bear signs in the 11 most abundant tree families. The main genera (>10 stems) are listed, with other genera in parentheses. Chi-square test results are based against the number of stems of all other families in habitat plots with and without signs. ‘NS’ = not significant.
Family Genera Number of stems (%) X2 statistic
(p value) With signs Without signs
Burseraceae Dacryodes (Canarium, Santiria)
0 (0) 31 (100) 6.70 (0.010)
Dipterocarpaceae Shorea (Vatica) 1 (3.1) 32 (97.9) 4.15 (0.042)
Ebenaceae Diospyros 0 (0) 16 (100) NS
Euphorbiaceae
Endospermum,
Macaranga
(Aporosa, Baccaurea, Blumeodendron)
4 (5.8%) 69 (94.2) 6.15 (0.013)
Fabaceae
Dialium, Koompassia,
Paraserianthes
(Archidendron, Parkia, Sindora)
8 (17.4) 46 (82.6) 5.60 (0.018)
Lamiaceae Geunsia (Vitex) 2 (5.7) 35 (94.3) NS
Moraceae Artocarpus (Ficus)
2 (16.7) 12 (83.3) NS
Myrtaceae Syzygium 3 (16.7) 18 (83.3) NS
Olacaceae Ochanostachys 27 (79.4) 34 (20.6) 112.6 (<0.001)
Rutaceae Evodia 1 (5.6) 18 (94.4) NS
Sterculiaceae Scaphium (Sterculia)
0 (0) 12 (100) NS

7
Habitat descriptions of plots with and without bear signs
Habitat variables were collected in plots to classify habitat type and link the presence of bears to habitat characteristics. A number of these were significantly different between plots with bear signs and those without, and these are summarized in Table 3.
Table 3 – Descriptive statistics for habitat variables that were significantly different between plots with and without bear signs.
Variable Plot with bear signs
Mean (± SE) T-statistic
(p value)
Elevation (m) Y 77.5 ± 1.6
2.53 (0.013) N 72.9 ± 1.6
Presence of swamp Y 0.02 ± 0.01
2.04 (0.043) N 0.07 ± 0.01
Tree height Y 21.6 ± 0.7
3.25 (0.001) N 19.1 ± 0.4
Canopy height Y 14.2 ± 0.5
3.40 (0.001) N 12.2 ± 0.3
Density of large trees (per ha)
Y 123.4 ± 8.3 3.86 (<0.001)
N 88.1 ± 3.8
Proportion of Type A trees
Y 0.51 ± 0.03 2.21 (0.028)
N 0.44 ± 0.02
Basal area of large trees (m2/ha)
Y 14.2 ± 1.2 3.99 (<0.001)
N 9.1 ± 0.4
Above ground biomass of large trees (kg)
Y 359 ± 41 3.38 (0.001)
N 213 ± 13
Number of climbers Y 2.5 ± 0.1
4.89 (<0.001) N 2.1 ± 0.1
Canopy cover (%) Y 90.1 ± 1.0
2.45 (0.015) N 86.9 ± 0.8
Density of saplings (per m2)
Y 1.3 ± 0.3 3.86 (<0.001)
N 0.9 ± 0.1
Herbaceous ground cover (%)
Y 0.7 ± 0.3 5.19 (<0.001)
N 4.9 ± 0.7
Count of rattans1 Y 2.8 ± 0.2 2.64 (0.009)
N 2.3 ± 0.1
Count of palms1 Y 1.9 ± 0.2 4.07 (<0.001)
N 1.5 ± 0.1

8
1 0 = no rattans/palms; 1 = rattans/palms present in 25% of plot; 2 = rattans/palms present in 50% of plot; 3 = rattans/palms present in 75% of plot; 4 = rattans/palms present in 100% of plot
Bear signs were found in habitat plots at higher elevations and with taller trees and canopy heights, higher densities of large trees and saplings, greater basal areas and above ground tree biomass, more climbers, rattans and palms, greater canopy cover, less herbaceous ground cover, and a greater proportion of Type A trees (Jones et al. 1995) than plots with no bear signs (Table 3).
However, there were also a number of strong correlations between these variables. To correct for this issue of multicolinearity and to classify quantitatively the habitat type of each plot, we used a Principal Component Analysis (PCA) and then Discriminant Analysis (DA) based on the habitat variables collected in the plots.
Principal Component Analysis was used to reduce the set of original habitat variables into a smaller number of derived components or axes of variation, while retaining much of the original information. Fifteen habitat variables were entered into PCA (Table 4). The analysis was set to calculate four factors
The four factors accounted for 62.9% of the original variation. Habitat plots with high scores along Factor 1 (28.7% of the original variability) are characteristic of forest with a high density of large and tall trees exhibiting architecture indicative of closed canopy forest, and with rattans and climbers. Factor 2 (14.6%) identifies the relationship between numbers of understorey stems and the presence of large trees. High scores represent plots with high numbers of saplings, rattans and palms and few large trees and these were often found at higher elevations. Factor 3 (11.2%) describes forest increasingly dominated by a few very large trees with little understorey. Habitat plots with high scores along this axis are characterized by having few understorey stems (saplings, rattans, palms) and climbers and large trees; the remaining large trees are very large. These plots are likely indicative of recently cleared forest where the largest trees have been left standing. Factor 4 (8.4%) describes increasingly dry forest. Low scores along this axis represent swampy areas, lower elevation areas, while high scores are more representative of ridge top forests, which have a relatively disturbed understorey and open canopy.
Table 4 – Extraction results of Principal Component Analysis of the habitat variables (Rotation method: varimax with Kaiser Normalization). Only factor loadings (measure of the correlation between a variable and a factor) > 0.2 are displayed and all are significantly correlated (r) with the original variables at p < 0.01 (two-tailed).
Variable Factor 1 Factor 2 Factor 3 Factor 4
Eigenvalue 4.30 2.19 1.69 1.26
Percentage variance 28.7 14.6 11.2 8.4
Elevation +0.225 +0.410
Swamp -0.416
Mean tree height +0.365 +0.389
Mean canopy height +0.354 +0.335
9
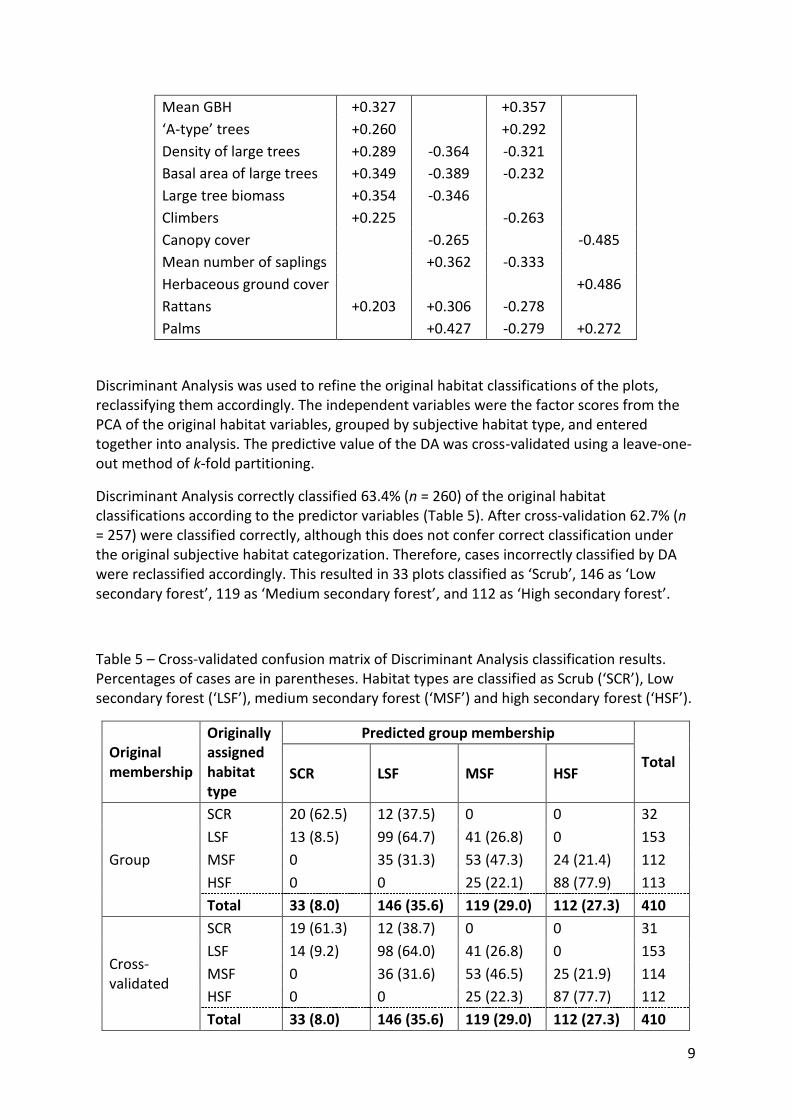
Mean GBH +0.327 +0.357
‘A-type’ trees +0.260 +0.292
Density of large trees +0.289 -0.364 -0.321
Basal area of large trees +0.349 -0.389 -0.232
Large tree biomass +0.354 -0.346
Climbers +0.225 -0.263
Canopy cover -0.265 -0.485
Mean number of saplings +0.362 -0.333
Herbaceous ground cover +0.486
Rattans +0.203 +0.306 -0.278
Palms +0.427 -0.279 +0.272
Discriminant Analysis was used to refine the original habitat classifications of the plots, reclassifying them accordingly. The independent variables were the factor scores from the PCA of the original habitat variables, grouped by subjective habitat type, and entered together into analysis. The predictive value of the DA was cross-validated using a leave-one-out method of k-fold partitioning.
Discriminant Analysis correctly classified 63.4% (n = 260) of the original habitat classifications according to the predictor variables (Table 5). After cross-validation 62.7% (n = 257) were classified correctly, although this does not confer correct classification under the original subjective habitat categorization. Therefore, cases incorrectly classified by DA were reclassified accordingly. This resulted in 33 plots classified as ‘Scrub’, 146 as ‘Low secondary forest’, 119 as ‘Medium secondary forest’, and 112 as ‘High secondary forest’.
Table 5 – Cross-validated confusion matrix of Discriminant Analysis classification results. Percentages of cases are in parentheses. Habitat types are classified as Scrub (‘SCR’), Low secondary forest (‘LSF’), medium secondary forest (‘MSF’) and high secondary forest (‘HSF’).
Original membership
Originally assigned habitat type
Predicted group membership
Total SCR LSF MSF HSF
Group
SCR 20 (62.5) 12 (37.5) 0 0 32
LSF 13 (8.5) 99 (64.7) 41 (26.8) 0 153
MSF 0 35 (31.3) 53 (47.3) 24 (21.4) 112
HSF 0 0 25 (22.1) 88 (77.9) 113
Total 33 (8.0) 146 (35.6) 119 (29.0) 112 (27.3) 410
Cross-validated
SCR 19 (61.3) 12 (38.7) 0 0 31
LSF 14 (9.2) 98 (64.0) 41 (26.8) 0 153
MSF 0 36 (31.6) 53 (46.5) 25 (21.9) 114
HSF 0 0 25 (22.3) 87 (77.7) 112
Total 33 (8.0) 146 (35.6) 119 (29.0) 112 (27.3) 410

10
The ordination of habitat plots reclassified using DA and based on their PCA factor scores is presented in Figure 2. Less disturbed forest (high and medium secondary forests; ‘HSF’, ‘MSF’) is characterized by high Factor 1 scores, while low secondary forest (LSF’) and scrub (‘SCR’) have low Factor 1 scores.
Figure 2 – PCA ordination of habitat plots based on their Factor 1 and Factor 2 scores. Habitat types are reclassified using DA. Habitat types are classified as Scrub (‘SCR’), Low secondary forest (‘LSF’), medium secondary forest (‘MSF’) and high secondary forest (‘HSF’).
1050-5-10
5.0
2.5
0.0
-2.5
-5.0
-7.5
Factor 1
Fact
or
2
HSR
HSS
HST
SEM
Habitat
Relating the presence/absence of bear signs to habitat
We modeled the presence/absence of bear signs in habitat plots against the four PCA factors (predictor variables) using binary logistic regression. Of the four factors, two had a significant effect on the presence of bear signs: Factor 1 had a positive effect (ß = 0.367, Z = 4.75, p < 0.001), while Factor 3 had a negative effect (ß =- 0.218, Z =-2.09, p = 0.036). The model appears to fit the data adequately (H405 = 412.5, p = 0.387). The clear positive relationship between the predicted probabilities of bear sign occurrence with Factor 1 is shown in Figure 3 with bears more likely to occur in forest characterized by a high density of taller, larger trees with rattans and climbers present. Overall, the presence or absence of bear signs is associated with general habitat type (Pearson X2
3 = 17.38, p = 0.001; Likelihood Ratio X2
2 = 18.72, p < 0.001). Bears utilize more than expected large trees within medium and high secondary forests, and utilize less than expected large trees in low secondary forest and scrub habitats.
LSF
MSF
HSF
SCR

11
Figure 3 – Scatterplot of predicted probabilities from the binary logistic regression model of the presence of bear signs in relation to habitat Factor 1.
1050-5-10
1.0
0.8
0.6
0.4
0.2
0.0
Factor 1
Pred
icte
d p
rob
abili
ty o
f occ
ure
nce
Structural data for trees with and without bear signs
A square root transformation was used on tree, canopy and branch heights as they were all slightly positively skewed. A 1/x transformation was used on DBHs and basal areas as they were more strongly positively skewed.
There were no differences in tree, canopy and main branch heights, and DBHs and basal areas between large trees (>20 cm DBH) that had bear signs and those that did not (Table 6). This suggests bears are not selecting large trees based on their structural dimensions.
Table 6 – Descriptive statistics for structural habitat variables of large trees with and without bear signs.
Variable Bear tree
Mean (± SE) T-statistic
(p value)
Tree height (m) Y 18.4 ± 0.3
0.15 (0.883) N 18.2 ± 1.5
Canopy height (m) Y 10.9 ± 0.2
0.09 (0.926) N 10.8 ± 1.1
Main branch height (m) Y 8.9 ± 0.3
0.66 (0.520) N 8.1 ± 1.2
DBH (cm) Y 34.0 ± 1.0 0.60 (0.556)

12
N 32.3 ± 4.3
Basal area (m2) Y 0.11 ± 0.01
0.83 (0.414) N 0.09 ± 0.02
The presence or absence of bear signs on large trees appears to be associated with particular tree architectures (Pearson X2
2 = 9.70, p = 0.008; Likelihood Ratio X22 = 7.44, p =
0.024). Sun bears seem to utilize more than expected large trees with a main horizontal branch below half their height, which are indicative of trees having grown up in open canopied areas (Type B; Jones et al. 1995). They tend to utilize less than expected trees that branch above half their height, and indicative of having grown up under the closed canopy of primary forest (Type A; Jones et al. 1995). They show no preference for trees characteristic of regenerating forest, which have either branching above half their height and major scarring, reflecting a dropped branch, or vertical branching below half their height (Types C and D; Jones et al. 1995). However, this relationship may actually reflect the preferential selection of tree species of a particular architecture rather than the tree architecture itself, particularly Ochanostachys amentacea.
OBJECTIVE 3: Initiate germination trials to assess the success rate of seeds found in sun bear scats
In the mid-term report we reported on eleven scat samples collected by the team and taken back to the HRF nursery to be processed. Seed germination trials were initiated under the same nursery conditions, e.g. substrate and light regimes. The team started to collect germination data for these seeds, with a view to supporting wider data collection on developing germination curves for particular species and making seedling specimens to assist future species identification.
During this project, Harapan Rainforest’s nursery underwent a major redesign. All existing planting material – seeds, seedlings, saplings – were moved around during these improvements to the nursery. Unfortunately, during this process the project’s seeds and seedlings were either destroyed or lost by HRF staff not involved in this project. Consequently, the germination trials stopped soon after they began and no data can be presented on them.
More positively, the project staff has been trained in the relevant nursery techniques and are now conducting ad hoc searches for bear scat to begin seed germination trials in the future.
OBJECTIVE 4: Build the capacity of Indonesian students, and project staff through training and direct involvement in survey methods and data management
Two Indonesian graduates, Dani Ramdani and Dedi Rehman, joined the sun bear project in September 2010. Their four-month involvement with the project was due to come to an end at the end of December 2010 but they were both offered full-time contracts as Research Assistants by HRF as we were extremely impressed with their work on this project.

13
Their training involved an initial presentation on the sun bear project, practical field experience showing them how to mark out habitat plots, practical training on the identification of sun bear signs and ageing of these signs and the planting and monitoring of seedlings found in sun bear scats. They also received a manual on surveying sun bears (see attached document).
Seven members of the research team were also fully trained in the necessary techniques and have assisted with this work.
All participants received training in tree identification from Mr Deden Girmansyah of the Indonesian Institute of Sciences Herbarium in Bogor, and in collecting specimens and preparing botanical specimens from the Head of Research and Conservation at HRF, Dr David Lee.
OBJECTIVE 5: Provide additional recommendations for the management of the sun bear population within HRF and incorporate this within forest restoration plan
This project emphasizes the importance of less disturbed forest habitats for Malayan sun bears, and a lack of utilization by bears of more heavily disturbed habitats in this previously logged forest. This, coupled with the results of a previous IBA-funded project at HRF, provides good evidence for protecting existing forest cover in the site and, through collaboration with local partners and government offices, preventing any further habitat degradation. Furthermore, natural regeneration of protected forest and active restoration of degraded forest areas will improve the quality and quantity of habitat available to sun bears, supporting their conservation in this highly threatened landscape.
To support this, Malayan Sun Bear is listed in the 20-year management plan of HRF as a key species for conservation through site protection and regeneration. Long-term monitoring activities are designed to track changes in the population and distribution of sun bears within HRF and relative to active management. The results of this project also support the management plan and inform the restoration strategies for the site, including identifying key areas for forest restoration that will benefit sun bears and tree species for which sun bears show a preference towards.
FUTURE WORK
Following the loss of seedlings in the germination trials, the research team are continuing to collect any sun bear scats they find during surveys and seeds from these will be planted in the camp nursery for future germination trials.
A scientific paper discussing the findings of this research will be produced and submitted to Ursus.

14
REFERENCES
Augeri, D.M. 2005. On the Biogeographic Ecology of the Malayan Sun Bear. PhD Thesis, University of Cambridge, UK.
Jones, M.J., Linsley, M.D. and Marsden, S.J. 1995. Population sizes, status and habitat associations of the restricted-range bird species of Sumba, Indonesia. Bird Conservation International 5: 21-52.
Steinmetz, R.G. 2009. Ecological overlap of sympatric sun bears and Asiatic black bears in tropical forest, Thailand. PhD thesis, University of Minnesota.
Wong, S.T., Servheen, C. and Ambu, L. 2002. Food habit of Malayan sun bears in lowland tropical forest of Borneo. Ursus 13: 127-136.

4
Project budget and expenditure
BUDGET TASK COMPONENTS MAY '10
JUN '10
JUL '10
AUG '10
SEP '10
OCT '10
NOV '10
DEC '10
JAN ‘11
FEB ‘11
MAR ‘11
APR ‘11
UP TO DATE
BUDGET BALANCE
1,500 Salary Project Supervisor
1,500 0 0 0 0 0 0 0 0 0 0 0 1,500 0
400 Student stipend 0 0 0 0 100 100 100 100 0 0 0 0 400 0
400 Student stipend 0 0 0 0 100 100 100 100 0 0 0 0 400 0
1,050 Botanical consultant (1 x month)
0 0 0 0 0 0 0 0 0 1,050 0 0 1,050 0
360 Student meals x 4 months @ $3/day
0 0 0 0 90 90 90 90 0 0 0 0 360 0
360 Student meals x 4 months @ $3/day
0 0 0 0 90 90 90 90 0 0 0 0 360 0
90 Botanist meals x 1 month @ $3/day
0 0 0 0 0 0 0 0 0 90 0 0 90 0
80 Seed collection equipment
0 0 48.80 0 0 0 0 0 0 0 0 0 48.80 31.20
130 Tree measuring equipment
0 0 138.52 0 0 0 0 0 0 0 0 0 138.52 -8.52
160 1 x tent – Coleman Avior
172.46 0 0 0 0 0 0 0 0 0 0 0 172.46 -12.46
80 1 x digital camera (samsung ES15) & memory card
79.09 13.39 0 0 0 0 0 0 0 0 0 0 92.48 -12.48
210 3 x 200km trips Jambi & HRF camp
0 0 0 0 70 0 0 70 0 70 0 0 210 0
150 1 x return trip Bogor & Jambi
0 0 0 0 0 0 0 0 0 150 0 0 150 0
130 Fuel costs for 2 x motorbikes
0 0 0 0 0 25 20 15 10 35 25 0 130 0
$5,100.00
$5,102.26 $- 2.26

5
Avior X3 tent used whilst surveying bear plots
Marking and surveying bear plots
Elva Gemita providing training to Dedi and Dani on plot marking and identification of bear signs

6
LIPI botanist, Deden Girmansyah, identifying tree species within the bear plots
Botanical surveys and specimen collection
Wahyudin collecting specimens for identification purposes
Iwan engraving tree tags

7
Germination trials of seeds found within sun bear scat samples