Embed Size (px)
Citation preview

JUNE QUARTER 2015
Resources and Energy Quarterly
WWW.INDUSTRY.GOV.AU

Further Information For more information on data or government initiatives please access the report from the Department’s website at: www.industry.gov.au. Acknowledgements Individual commodity notes have identified authors. Cover image source: Thinkstock © Commonwealth of Australia 2015 ISSN 1839-5007 [ONLINE] Vol. 4, no. 4
This work is copyright. Apart from any use as permitted under the Copyright Act 1968, no part may be reproduced or altered by any process without prior written permission from the Australian Government. Requests and inquiries concerning reproduction and rights should be addressed to:
Department of Industry and Science, GPO Box 9839, Canberra ACT 2601 or by emailing [email protected]
Creative Commons licence With the exception of the Coat of Arms, this publication is licensed under a Creative Commons Attribution 3.0 Australia Licence. Creative Commons Attribution 3.0 Australia Licence is a standard form license agreement that allows you to copy, distribute, transmit and adapt this publication provided that you attribute the work.
A summary of the licence terms is available from: http://creativecommons.org/licenses/by/3.0/au/deed.en
The full licence terms are available from: http://creativecommons.org/licenses/by/3.0/au/legalcode
The Commonwealth’s preference is that you attribute this publication (and any material sourced from it) using the following wording: Source: Licensed from the Commonwealth of Australia under a Creative Commons Attribution 3.0 Australia Licence.
industry.gov.au Resources and Energy Quarterly, June 2015 1

Foreword The Resources and Energy Quarterly provides data on the performance of Australia’s resources and energy sectors and analysis of key commodity markets. This release of the Resources and Energy Quarterly contains an update to the Office of the Chief Economist’s short-term commodity forecasts and overviews of key commodity market issues.
Global commodity prices are clearly in a downturn and many of the factors that supported the ‘supercycle’ that commenced in the 21st century have now reversed. Strong resources sector investment has resulted in a surplus of both mining and refining capacity, consumption growth has moderated to lower levels and the US monetary policies that affected US dollar dominated prices are starting to shift.
Australia’s domestic production of key commodities is continuing to expand in this environment of lower prices. The widespread fall in commodity prices through 2014 and early 2015 have led producers to shift focus from production expansion to managing costs and productivity. As a result exploration expenditure, employment and capital spending are all down in Australia.
In the short term, market conditions are likely to be challenging for many producers. However, in the longer term the continued rise of highly populated emerging economies will continue to drive growth in consumption of both mineral and energy resources. Mark Cully Chief Economist Department of Industry and Science industry.gov.au Resources and Energy Quarterly, June 2015 2

industry.gov.au Resources and Energy Quarterly, June 2015 3
Contents Foreword 2
Macroeconomic outlook 4
Steel 12
Iron ore 18
Metallurgical coal 24
Thermal coal 28
Gas 35
Oil 39
Gold 43
Aluminium 47
Copper 52
Nickel 57
Zinc 62

Macroeconomic outlook
The global economy In 2015 the global economy is forecast to grow 3.4 per cent, a rate broadly consistent with the previous year but still far below pre-GFC levels. In its latest World Economic Outlook the IMF noted that global economic growth has been moderated by declining business investment which is not expected to reverse in the near or short term. This is likely to result in slower growth in commodities consumption and limit the prospect of any significant price recoveries this year.
Global commodity prices are clearly in a downturn and many of the factors that supported the ‘supercycle’ that commenced in the 21st century have now reversed. Strong resources sector investment has resulted in a surplus of both mining and refining capacity, consumption growth has moderated to lower levels and the US monetary policies that affected US dollar dominated prices are starting to shift.
In 2016 world GDP growth is forecast to increase marginally to 3.7 per cent, underpinned by higher growth in advanced economies. This level of economic growth is still not expected to be enough to stimulate a demand-driven recovery in commodity prices and, subsequently, most commodity prices are forecast to remain below recent high levels. Price rebounds in the near term are more likely to come from supply cuts associated with higher cost producers exiting the market or general production curtailments.
Outlook for key economies
United States
The performance of the US economy reversed in the March quarter of 2015 with GDP contracting by 0.7 per cent as seasonal and weather factors constrained business activity and consumer spending. Continued strengthening of the US dollar has put pressure
1
2
3
4
5
6
2000 2002 2004 2006 2008 2010 2012 2014 2016
%
Figure 1.1 World economic growth
Source: IMF.
on trade flows and domestic manufacturing, facilitating a 8 per cent decrease in exports in the March quarter, although the growth of imports slowed.
Other economic indicators have been modest; however more positive performance is anticipated for coming quarters. Inflation has stayed low, increasing by 0.1 per cent in April, being constrained by low energy prices, increasingly affordable imports and moderate consumer spending growth. Unemployment levels were maintained at 5.5 per cent in May, without significant progress towards the maximum employment target.
With moderate economic activity expected for the remainder of the year, economic growth is forecast to be 2.5 per cent for 2015. Provided inflation remains low, making only steady progress towards the 2 per cent target, it is expected no change will be made to the reserve interest rate (currently targeting 0-0.25 per cent) until the third or, more likely, the fourth quarter. In 2016 economic growth is forecast to increase slightly to 2.8 per cent.
industry.gov.au Resources and Energy Quarterly, June 2015 4

China
China’s GDP growth slowed to 7 per cent in the March quarter, driven by persistent weakness in the property sector, falling exports, weak industrial output and lower fixed asset investment. In order to stabilise growth, the People’s Bank of China reduced interest rates three times in the last six months; and reduced the reserve requirement ratio. There are indications that these actions, along with other measures directed at the property sector over the past year, are starting to have an effect. Property sales in major cities increased in April and May and average property prices are beginning to recover. However, the large inventory of unsold homes will prevent a rapid recovery in the sector.
The National Development and Reform Commission has noted that investment will play a key role in stabilising China’s economic growth. To this effect, the Chinese Government has announced plans to invest in infrastructure. In 2015, the government aims to invest 800 billion yuan (US$129 billion) to add more than 8000 kilometres of rail and 124 billion yuan towards affordable housing.
5
10
15
20
25
30
35
40
Manufacturing Railways Real Estate Electricity Total
%ytd
Figure 1.2: Growth in China’s fixed asset investment
Mar-14 Jun-14 Sep-14 Dec-14 Mar-15
Source: CEIC.
-40
-20
20
40
60
80
100
120
Nov-08 Nov-09 Nov-10 Nov-11 Nov-12 Nov-13 Nov-14
%yr
Figure 1.4: China’s residential sales and starts
Starts SalesData is three month moving average of monthly growth rate. Source: CEIC.
-2
2
4
6
8
10
12
Mar-11 Dec-11 Sep-12 Jun-13 Mar-14 Dec-14
%
Figure 1.3: China’s quarterly contribution to GDP
final consumption expenditure gross capital formation net exports
Source: CEIC.
industry.gov.au Resources and Energy Quarterly, June 2015 5

India
The Indian economy grew by an estimated 7.3 per cent for the fiscal year ending March 2015, the fastest growth since 2011. Growth was supported by a 7 per cent increase in manufacturing output, a 12 per cent expansion of the services sector and a 62 per cent increase in foreign direct investment. These sectors and infrastructure investment are forecast to continue growing and support 7.4 per cent growth in the 2015 and 2016 calendar years. The economy is also expected to be boosted by further economic reform to the power and resources sector. However, India’s recent below average monsoon rains may reduce farm output (which accounts for around 16 per cent of GDP) and drag down economic growth in 2015.
Japan
Japan’s GDP is forecast to increase 0.9 per cent in 2015 and 1.2 per cent in 2016. Slowing export growth due to weaker demand from China as well as weaker domestic consumption influenced by a consumption tax increase in April 2014 are likely to keep economic growth low over 2015. Economic growth in 2016 is expected to still be lower than the past but higher relative to 2015, as a depreciating yen may make exports more attractive.
Europe
Economic growth in the EU28 increased by 0.4 per cent (seasonally adjusted) in the March quarter 2015. Spain, France, the UK, Italy and Germany all recorded growth which offset declines in Greece and Finland. Growth was driven by household consumption, which increased 0.5 per cent, and fixed asset investment, which increased 0.8 per cent. EU economic growth is forecast to increase by 1.4 per cent in 2015, supported by continued growth in several economies. The future of Europe’s growth in the short term is expected to be influenced by the European Central Bank’s (ECB) quantitative easing programme, which will last at least until September 2016. The ECB plans to purchase sovereign bonds and securities from European institutions and national agencies. However, macroeconomic contagion over Greece’s sovereign debt status remains a key risk to Europe’s growth.
industry.gov.au Resources and Energy Quarterly, June 2015 6
Table 1.1: Key world macroeconomic assumptions % 2014 2015 a 2016 a Economic growth b OECD 1.8 2.3 2.4
United States 2.4 2.5 2.8 Japan -0.1 0.9 1.2 European Union 28 1.4 1.4 1.5
Germany 1.6 1.9 2.0 France 0.4 1.0 1.5 United Kingdom 2.5 2.7 2.5
South Korea 3.3 3.5 3.8 New Zealand 3.2 3.0 2.8
Emerging economies 4.6 4.4 4.7 Non-OECD Asia 6.8 6.5 6.4
South East Asia d 4.6 5.0 5.2 China e 7.4 6.8 6.8 Chinese Taipei 3.7 3.5 3.8 India 7.2 7.4 7.4
Latin America 1.3 1.0 2.0 Middle East 2.6 2.8 3.5
World c 3.4 3.4 3.7 Inflation rate b United States 2.2 2.3 2.3
a assumption. b Change from previous period. c Weighted using 2012 purchasing power parity (PPP) valuation of country gross domestic product by IMF. d Indonesia, Malaysia, the Philippines, Thailand and Vietnam. e Excludes Hong Kong. Sources: ABS; IMF; OECD.
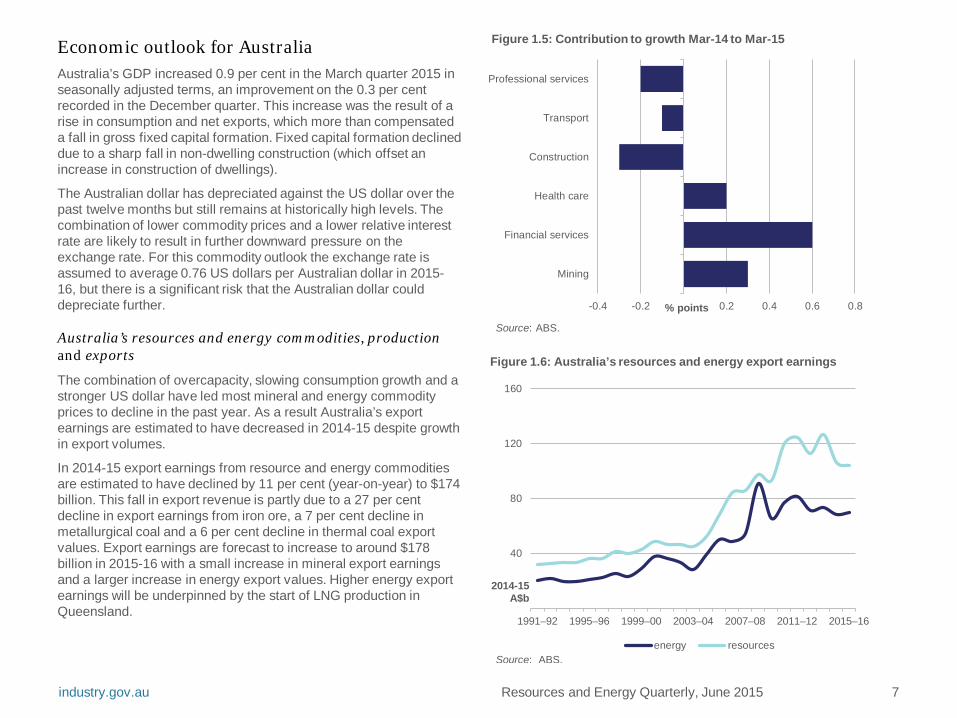
Economic outlook for Australia Australia’s GDP increased 0.9 per cent in the March quarter 2015 in seasonally adjusted terms, an improvement on the 0.3 per cent recorded in the December quarter. This increase was the result of a rise in consumption and net exports, which more than compensated a fall in gross fixed capital formation. Fixed capital formation declined due to a sharp fall in non-dwelling construction (which offset an increase in construction of dwellings).
The Australian dollar has depreciated against the US dollar over the past twelve months but still remains at historically high levels. The combination of lower commodity prices and a lower relative interest rate are likely to result in further downward pressure on the exchange rate. For this commodity outlook the exchange rate is assumed to average 0.76 US dollars per Australian dollar in 2015-16, but there is a significant risk that the Australian dollar could depreciate further.
Australia’s resources and energy commodities, production and exports
The combination of overcapacity, slowing consumption growth and a stronger US dollar have led most mineral and energy commodity prices to decline in the past year. As a result Australia’s export earnings are estimated to have decreased in 2014-15 despite growth in export volumes.
In 2014-15 export earnings from resource and energy commodities are estimated to have declined by 11 per cent (year-on-year) to $174 billion. This fall in export revenue is partly due to a 27 per cent decline in export earnings from iron ore, a 7 per cent decline in metallurgical coal and a 6 per cent decline in thermal coal export values. Export earnings are forecast to increase to around $178 billion in 2015-16 with a small increase in mineral export earnings and a larger increase in energy export values. Higher energy export earnings will be underpinned by the start of LNG production in Queensland.
industry.gov.au Resources and Energy Quarterly, June 2015 7
-0.4 -0.2 0.2 0.4 0.6 0.8
Mining
Financial services
Health care
Construction
Transport
Professional services
% points
Figure 1.5: Contribution to growth Mar-14 to Mar-15
Source: ABS.
40
80
120
160
1991–92 1995–96 1999–00 2003–04 2007–08 2011–12 2015–16
2014-15 A$b
energy resourcesSource: ABS.
Figure 1.6: Australia’s resources and energy export earnings

Exploration
Exploration expenditure declined 9 per cent year-on-year to $1.3 billion in the March quarter, as falling commodity prices removed the incentive to develop new sites. With most commodity prices forecast to remain low through 2015 and 2016 exploration expenditure appears unlikely to rebound in the short term. The decline in exploration expenditure was driven by a 22 per cent year-on-year fall in mineral exploration and a 4.7 per cent fall in petroleum exploration.
Exploration at existing deposits fell 21 per cent in the March quarter 2015 (year-on-year) and exploration at new deposits fell 25 per cent. Exploration expenditure fell in every state and territory in the March quarter (year-on-year), led by Queensland which recorded a 47 per cent fall to $53 million, Western Australia which fell 11 per cent to $184 million and South Australia which fell by 13 per cent to $22 million.
500
1000
1500
2000
2500
Dec-10 Sep-11 Jun-12 Mar-13 Dec-13 Sep-14
A$m
Figure 1.8: Australia’s exploration expenditure
Petroleum Mineral
Source: ABS.
200
400
600
800
1000
1200
Dec-10 Sep-11 Jun-12 Mar-13 Dec-13 Sep-14
A$m
Figure 1.9: Exploration expenditure, by deposit type
Existing deposits New depositsSource: ABS.
50
100
150
200
250
300
350
WA QLD NSW, Vic, Tas SA NT
A$m
Figure 1.7: State exploration expenditure
Mar-14 Jun-14 Sep-14 Dec-14 Mar-15Source: ABS.
Resources and Energy Quarterly, June 2015 8 industry.gov.au

Capital expenditure
Over the past decade global consumption of commodities grew rapidly which in turn led to an increase in prices and an escalation in investment in resource and energy projects. However, with global consumption growth slowing and production of most commodities increasing prices steadily fell through the second half of 2014 and through 2015. This fall in commodity prices has caused mining companies to shift their focus from expanding production to cutting costs. Lower capital expenditure has been one of the principal indicators of this shift in focus.
In the March quarter 2015 total capital expenditure was down 13 per cent year-on-year and 22 per cent quarter-on-quarter to $17 billion. The fall was caused by a 13 per cent fall (year-on-year) in building and structures and a 15 per cent fall in plant and equipment expenditure. Given prices for most commodities are forecast to continue declining through 2015 and 2016, the outlook for mining sector capital expenditure is also for further falls. It is worth noting that the downturn in investment activity has come from a historically high base and there are still a number of substantial projects in the resource and energy development pipeline.
Mining sector employment
Mining sector employment was 229 156 people in the June quarter 2015, down 13 per cent year-on-year. In the wake of falling prices and profitability many producers have reduced staff numbers. Miners have also been consolidating and cutting the price of service contracts, which has led to a fall in the number of employees providing services to the mining sector. Mining sector employment is not expected to rebound in the short term as a fall in construction labour, associated with declining capital expenditure, is likely to fully offset any increases in employment associated with rising production.
5
10
15
20
25
30
Mar-09 Mar-10 Mar-11 Mar-12 Mar-13 Mar-14 Mar-15
A$b
Figure 1.10: Mining industry capital expenditure
Buildings & structures Equipment, plant & machinery
Source: ABS.
50
100
150
200
250
300
Jun-06 Jun-08 Jun-10 Jun-12 Jun-14
‘000 people
Figure 1.11: Total mining employment
Source: ABS.
Resources and Energy Quarterly, June 2015 9 industry.gov.au

Table 1.4: Australia’s resources and energy commodity exports, by selected commodities Volume Value
unit 2014-15 f 2015-16 f CAGR unit 2014-15 f 2015-16 f CAGR Alumina kt 17 025 17 376 2.1 A$m 6 387 7 516 17.7 Aluminium kt 1 385 1 352 –2.4 A$m 3 632 3 422 –5.8 Copper kt 1 037 1 106 6.7 A$m 8 765 9 442 7.7 Gold t 284 289 2.0 A$m 13 958 14 628 4.8 Iron ore Mt 733 795 8.4 A$m 54 306 52 211 –3.9 Nickel kt 253 264 4.3 A$m 3 751 3 828 2.1 Zinc kt 1 597 1 549 –3.0 A$m 2 900 3 347 15.4 LNG Mt 26 38 49.3 A$m 17 901 24 416 36.4 Metallurgical coal Mt 186 191 3.0 A$m 21 694 20 095 –7.4 Thermal coal Mt 201 202 0.4 A$m 15 621 14 631 –6.3 Oil kbd 291 301 3.3 A$m 9 295 8 768 –5.7 Uranium t 6 239 5 884 –5.7 A$m 669 714 6.8 f forecast. CAGR is compound annual growth rate, in percentage terms. Source: ABS.
industry.gov.au Resources and Energy Quarterly, June 2015 10
Table 1.3: Outlook for Australia’s resources and energy commodities unit 2013–14 2014–15 f 2015–16 f % change
Value of exports Resources and energy A$m 195 001 173 859 177 648 2.2 – real a A$m 200 266 173 859 173 316 –0.3 Energy A$m 71 462 68 087 71 287 4.7 – real a A$m 73 392 68 087 69 548 2.1 Resources A$m 123 538 105 772 106 361 0.6 – real a A$m 126 874 105 772 103 767 –1.9 Mine production Gross value A$m 187 201 166 904 170 542 2.2
a In current financial year Australian dollars. f forecast. Source: ABS.
Table 1.2: Key macroeconomic assumptions for Australia unit 2013–14 2014–15 a 2015–16 a
Inflation rate b % 3.0 2.7 2.5 Interest rate c % 2.5 2.4 2.3 Exchange rate d US$/A$ 0.92 0.84 0.76
a assumption b Change from previous period. c Median RBA cash rate. d Average of daily rates. Sources: ABS; RBA.
industry.gov.au
A$2.0b
A$2.4b
A$3.5b
A$3.2b
A$5.7b
A$8.7b
A$11.1b
A$13.0b
A$16.7b
A$16.3b
A$23.3b
A$74.7b
A$1.6b
A$2.9b
A$3.6b
A$3.8b
A$6.4b
A$8.8b
A$9.3b
A$14.0b
A$15.6b
A$17.9b
A$21.7b
A$54.3b
15 30 45 60 75 90
Lead
Zinc
Aluminium
Nickel
Alumina
Copper
Crude oil
Gold
Thermal coal
LNG
Metallurgical coal
Iron ore and pellets
A$b 2014–15 f 2013–14
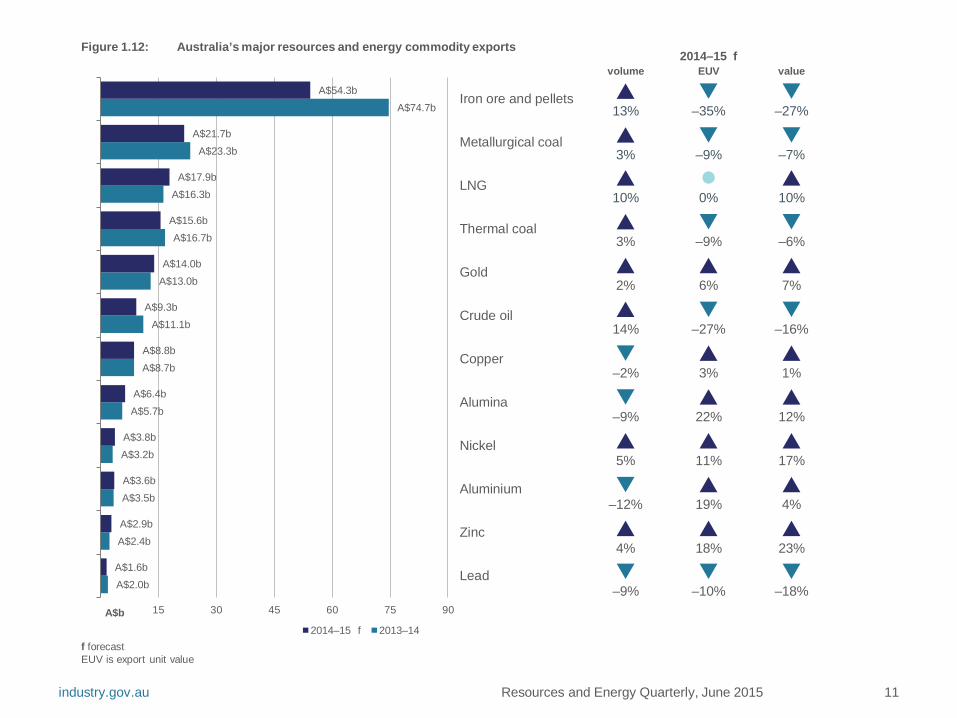
Figure 1.12: Australia’s major resources and energy commodity exports
f forecast EUV is export unit value
Resources and Energy Quarterly, June 2015 11
2014–15 f volume EUV value
13% –35% –27%
3% –9% –7%
10% 0% 10%
3% –9% –6%
2% 6% 7%
14% –27% –16%
–2% 3% 1%
–9% 22% 12%
5% 11% 17%
–12% 19% 4%
4% 18% 23%
–9% –10% –18%

Steel Ben Witteveen
A downturn in residential construction is offsetting increased spending on other forms of steel intensive fixed asset investment in China and resulting in lower steel consumption and production. China’s steel exports remain elevated against expectations but in the absence of a housing recovery, China’s steel production is likely to drop in the short term.
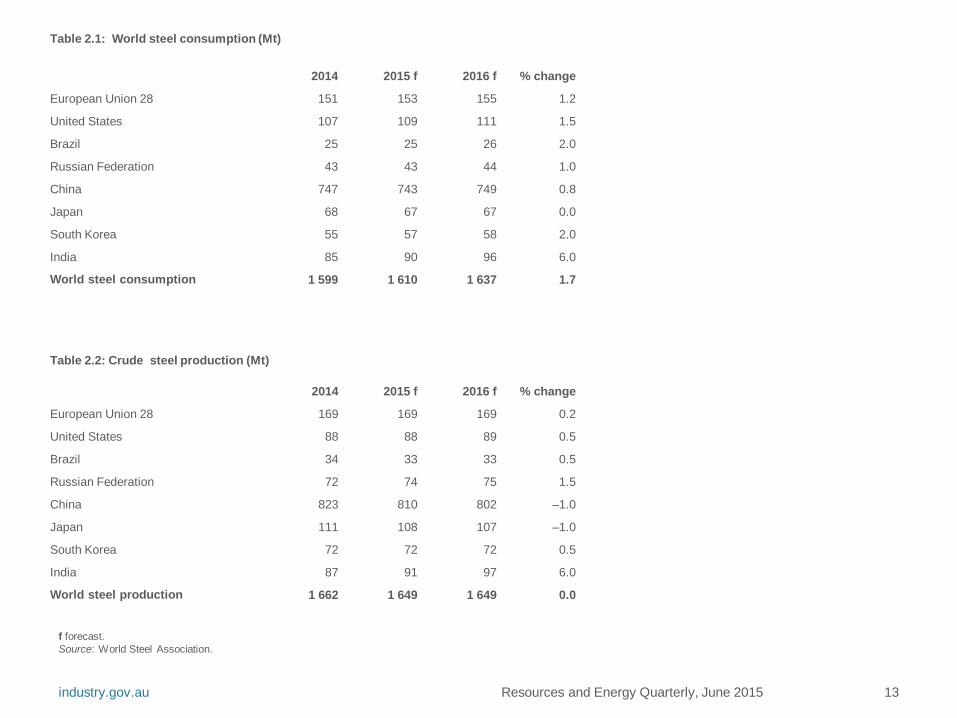
World steel overview World steel consumption in 2015 is forecast to increase by 0.7 per cent, relative to 2014, and to total 1.61 billion tonnes (see Table 2.1). A small decrease in China’s consumption is expected to be offset by higher consumption in India, where the pace of economic growth is picking up, and small gains in most other regions. World steel production is forecast to fall by 0.8 per cent in 2015 to 1.65 billion tonnes.
In 2016 world steel consumption is forecast to increase by 1.7 per cent (year-on-year) to 1.64 billion tonnes. Growth is forecast to be supported by an increase in China’s residential construction growth rate, infrastructure investment in India and economic growth in the US and Europe. World steel production in 2016 is forecast to remain stable at 1.65 billion tonnes.
China China’s steel prices have fallen through 2015, weighed down by overcapacity and a slump in consumption growth. During the first five months of 2015 the price of hot-rolled sheet and rebar declined 19 per cent and 13 per cent (year-on-year) respectively. Steel prices in China are forecast to remain low through 2015 and into 2016. The impact of forecast minor rebounds in steel consumption are likely to be negated by a continued surplus of production capacity.
Resources and Energy Quarterly, June 2015 12
400
800
1200
1600
2000
2013 2014 2015 2016
Figure 2.1: World steel consumption
China Rest of world European Union 28 United States India Japan
Source: World Steel Association.
Mt
400
800
1200
1600
2000
2013 2014 2015 2016
Figure 2.2: World steel production
China Rest of world European Union 28 Japan United States India
Mt
Source: World Steel Association.
industry.gov.au
Resources and Energy Quarterly, June 2015 13
Table 2.1: World steel consumption (Mt)
2014 2015 f 2016 f % change
European Union 28 151 153 155 1.2
United States 107 109 111 1.5
Brazil 25 25 26 2.0
Russian Federation 43 43 44 1.0
China 747 743 749 0.8
Japan 68 67 67 0.0
South Korea 55 57 58 2.0
India 85 90 96 6.0
World steel consumption 1 599 1 610 1 637 1.7
Table 2.2: Crude steel production (Mt)
2014 2015 f 2016 f % change
European Union 28 169 169 169 0.2
United States 88 88 89 0.5
Brazil 34 33 33 0.5
Russian Federation 72 74 75 1.5
China 823 810 802 –1.0
Japan 111 108 107 –1.0
South Korea 72 72 72 0.5
India 87 91 97 6.0
World steel production 1 662 1 649 1 649 0.0
f forecast. Source: World Steel Association.
industry.gov.au
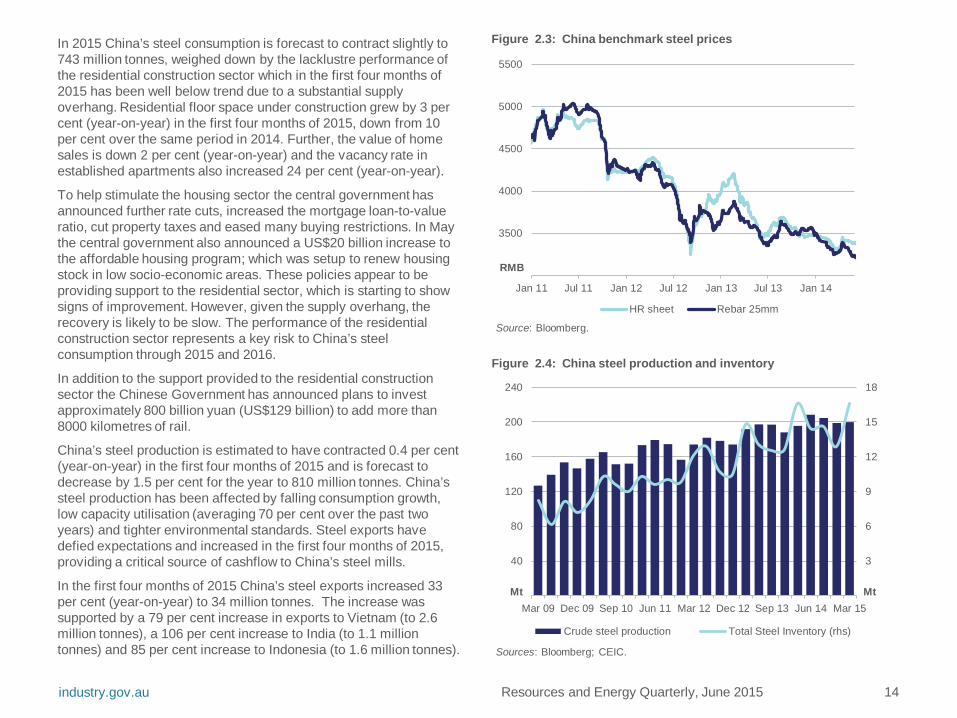
In 2015 China’s steel consumption is forecast to contract slightly to 743 million tonnes, weighed down by the lacklustre performance of the residential construction sector which in the first four months of 2015 has been well below trend due to a substantial supply overhang. Residential floor space under construction grew by 3 per cent (year-on-year) in the first four months of 2015, down from 10 per cent over the same period in 2014. Further, the value of home sales is down 2 per cent (year-on-year) and the vacancy rate in established apartments also increased 24 per cent (year-on-year).
To help stimulate the housing sector the central government has announced further rate cuts, increased the mortgage loan-to-value ratio, cut property taxes and eased many buying restrictions. In May the central government also announced a US$20 billion increase to the affordable housing program; which was setup to renew housing stock in low socio-economic areas. These policies appear to be providing support to the residential sector, which is starting to show signs of improvement. However, given the supply overhang, the recovery is likely to be slow. The performance of the residential construction sector represents a key risk to China’s steel consumption through 2015 and 2016.
In addition to the support provided to the residential construction sector the Chinese Government has announced plans to invest approximately 800 billion yuan (US$129 billion) to add more than 8000 kilometres of rail.
China’s steel production is estimated to have contracted 0.4 per cent (year-on-year) in the first four months of 2015 and is forecast to decrease by 1.5 per cent for the year to 810 million tonnes. China’s steel production has been affected by falling consumption growth, low capacity utilisation (averaging 70 per cent over the past two years) and tighter environmental standards. Steel exports have defied expectations and increased in the first four months of 2015, providing a critical source of cashflow to China’s steel mills.
In the first four months of 2015 China’s steel exports increased 33 per cent (year-on-year) to 34 million tonnes. The increase was supported by a 79 per cent increase in exports to Vietnam (to 2.6 million tonnes), a 106 per cent increase to India (to 1.1 million tonnes) and 85 per cent increase to Indonesia (to 1.6 million tonnes).
Resources and Energy Quarterly, June 2015 14
3500
4000
4500
5000
5500
Jan 11 Jul 11 Jan 12 Jul 12 Jan 13 Jul 13 Jan 14
Figure 2.3: China benchmark steel prices
HR sheet Rebar 25mm
Source: Bloomberg.
RMB
3
6
9
12
15
18
40
80
120
160
200
240
Mar 09 Dec 09 Sep 10 Jun 11 Mar 12 Dec 12 Sep 13 Jun 14 Mar 15
Figure 2.4: China steel production and inventory
Crude steel production Total Steel Inventory (rhs)
Mt
Sources: Bloomberg; CEIC.
Mt
industry.gov.au

This growth was against expectations as China’s exports had increased by 50 per cent in 2014 to 94 million tonnes—more steel than was produced in the United States. In response the Chinese Government removed a tax rebate on steel that contained boron (in January 2015) and many countries, including the European Union and the United States, implemented anti-dumping duties on China’s steel exports.
India Growth in steel imports, particularly from China, weighed down India’s steel prices through the first five months of 2015. Benchmark prices for pig iron and rebar have both declined 5 per cent since the start of the year. Tightening quality controls on steel imports and strong demand growth are expected to provide some support to prices through 2015 and 2016.
India’s steel consumption is forecast to increase by 6 per cent in 2015 to 90 million tonnes and by 6 per cent again in 2016 to 96 million tonnes. Ongoing urbanisation, a developing manufacturing sector and the Government’s infrastructure initiatives, which include improving the rail network, are expected to support this growth. The Indian Government’s ‘Make-in-India’ campaign is also expected to support growth in the domestic manufacturing sector and underpin higher steel consumption.
India’s steel production is forecast to grow by 6 per cent in 2015 to 91 million tonnes and 6 per cent in 2016 to 97 million tonnes. Improved access to key steel making inputs such as iron ore and electricity is expected to support the increase. The Government has promised to continue reforming the regulation system (also known as the ‘license raj’) that governs access to these inputs; however, the ability of the Government to do so presents a key risk to this assessment.
Resources and Energy Quarterly, June 2015 15
5
10
15
20
25
30
Mar 09 Dec 09 Sep 10 Jun 11 Mar 12 Dec 12 Sep 13 Jun 14 Mar 15
Figure 2.5: China steel exports
Mt
Source: CEIC.
400
500
600
700
800
900
Jan 10 Jan 11 Jan 12 Jan 13 Jan 14 Jan 15
Figure 2.6: India benchmark steel prices
Pig iron RebarSource: CEIC.
US$/t
industry.gov.au

Japan Japan’s steel consumption is forecast to decline 1.0 per cent in 2015 to 67 million tonnes and remain around this level in 2016. The decline is due to a forecast fall in steel intensive exports, which is the result of strong competition from South Korea and China, and weak economic growth.
Steel production is also forecast to decline 2.0 per cent in 2015 to 108 million tonnes and 1.0 per cent in 2016 to 107 million tonnes. Falling domestic demand following a curtailment in fiscal stimulus and the continued relocation of steel intensive manufacturing is expected to cause the fall.
However, a prolonged period of currency depreciation presents an upside risk to Japan’s steel production. The yen has depreciated 40 per cent against the US dollar over the past year and recorded a 12 year low in May. The fall in the yen’s value has improved the competiveness of Japan’s steel intensive exports and over time this may encourage manufacturers to relocate back to Japan.
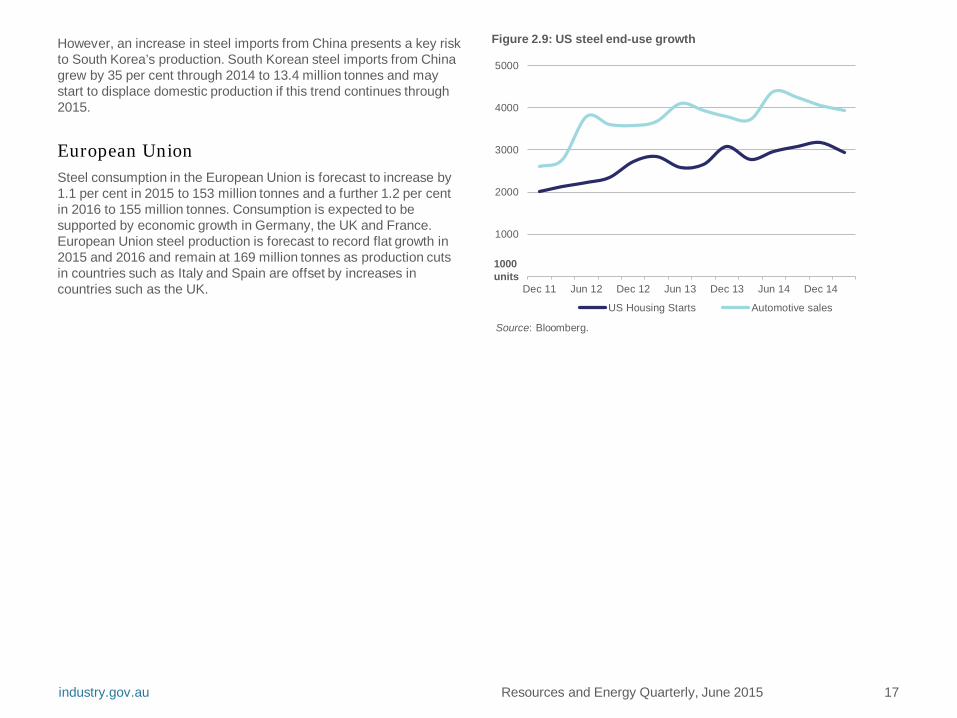
United States US steel production is forecast to increase by less than 1 per cent in 2015 and 2016 to 89 million tonnes. A fall in input prices including gas (for power) and iron ore is expected to support this growth. US steel consumption is forecast to grow by 2.0 per cent in 2015 to 109 million tonnes and 1.5 per cent in 2016 to 111 million tonnes. Ongoing growth in the residential construction and car manufacturing sectors, which account for 40 per cent and 25 per cent of steel use, respectively, are forecast to support this assessment.
South Korea South Korea’s steel production is forecast to increase by less than 1per cent in 2015 to 72 million tonnes and remain at about this level in 2016. Growth in steel intensive exports like cars and ships is expected to support South Korea’s steel production.
Resources and Energy Quarterly, June 2015 16
2
4
6
8
10
Jan 08 Jan 09 Jan 10 Jan 11 Jan 12 Jan 13 Jan 14 Jan 15
Figure 2.7: India’s steel production
Source: CEIC.
Mt
20
40
60
80
100
120
140
1995 1998 2001 2004 2007 2010 2013 2016Production Consumption
Mt
Source: World Steel Association.
Figure 2.8: Japan’s steel production and consumption
industry.gov.au
Resources and Energy Quarterly, June 2015 17
However, an increase in steel imports from China presents a key risk to South Korea’s production. South Korean steel imports from China grew by 35 per cent through 2014 to 13.4 million tonnes and may start to displace domestic production if this trend continues through 2015.
European Union Steel consumption in the European Union is forecast to increase by 1.1 per cent in 2015 to 153 million tonnes and a further 1.2 per cent in 2016 to 155 million tonnes. Consumption is expected to be supported by economic growth in Germany, the UK and France. European Union steel production is forecast to record flat growth in 2015 and 2016 and remain at 169 million tonnes as production cuts in countries such as Italy and Spain are offset by increases in countries such as the UK.
1000
2000
3000
4000
5000
Dec 11 Jun 12 Dec 12 Jun 13 Dec 13 Jun 14 Dec 14
Figure 2.9: US steel end-use growth
US Housing Starts Automotive sales
Source: Bloomberg.
1000 units
industry.gov.au

Iron ore Ben Witteveen
Higher iron ore production in Australia and Brazil combined with falling domestic production in China is forecast to raise world trade through 2015 and 2016. However an expected fall in exports from higher cost, lower quality producers will partly offset this growth. Steel market conditions in China are expected to weigh on iron ore prices in the short term.
Prices A fall in China’s steel production drove the price of iron ore down 25 per cent over the first four months of 2015 to average US$57.80 (FOB) in the March quarter 2015 and a low of US$42.30 (FOB) in early April. However, during this time stocks at China’s ports fell 16 per cent to 78 million tonnes in May (a two year low). Faced with a potential shortfall in stock amidst the traditional building season China’s steel mills began purchasing ore on the spot market, which led to an 18 per cent increase in the price of iron ore through May to finish the month at $56 (FOB). At the low prices recorded in early 2015 many smaller iron ore mines around the world are expected to have been loss making. In response closures are already occurring that are providing some moderate price support.
China’s steel production is forecast to contract in 2015 and 2016 as the seaborne supply of iron ore increases. These factors are forecast to drive the price of iron ore down 38 per cent in 2015 to average US$54 and a further 4.2 per cent in 2016 to average US$52 (FOB).
Housing construction in China remains a key area of uncertainty. Although residential construction is forecast to remain moribund through 2015 and into 2016 a rebound in activity could significantly boost domestic steel consumption and demand for seaborne iron ore. A fall in the value of the Australian dollar against the US is also a key risk to the price. A lower exchange rate brought on by interest rate differentials between the two countries may result in a lower US dollar iron ore price but leave the Australian dollar price unchanged.
Resources and Energy Quarterly, June 2015 18
225
450
675
900
50
100
150
200
Jul 10 Jan 11 Jul 11 Jan 12 Jul 12 Jan 13 Jul 13 Jan 14 Jul 14 Jan 15
Figure 3.1: Iron ore and steel prices
TSI 62% CFR rebar (rhs)Source: Bloomberg.
Iron Ore
US$/t
China steel US$/t
300
600
900
1200
1500
1800
2013 2014 2015 2016
Figure 3.2: World iron ore import destinations
China Japan European Union 28 Rest of world South Korea
Mt
Source: AME.
industry.gov.au

Resources and Energy Quarterly, June 2015 19
World trade in iron ore Global trade in iron ore is forecast to increase by 1.0 per cent in 2015 (year-on-year) to 1.37 billion tonnes. In 2016 world trade in iron ore is forecast to increase by 3.6 per cent to 1.4 billion tonnes as Australia and Brazil increase supply by 10 and 6 per cent, respectively. This rise in iron ore trade is expected to displace some of China’s higher cost domestic production but the price required to stimulate such a supply shift are clearly lower than the prevailing spot price. The increase in exports from Australia and Brazil will also be offset by a decline in other higher cost iron ore exporters. These companies are generally smaller and lack the financial resources or political backing to withstand a period of strong price competition.
Iron ore imports In 2014 imports into China accounted for approximately 69 per cent of the world trade in iron ore. In the first four months of 2015 China’s imports increased by 1 per cent (year-on-year) to 307 million tonnes. Over the full year 2015 China’s imports are forecast to increase slightly (year-on-year) to 936 million tonnes due to a fall in domestic iron ore production and an increase in the use of seaborne iron ore in steel making.
China’s raw production of iron ore declined 10 per cent (year-on-year) in the first four months of 2015 to 38 million tonnes. China’s iron ore industry typically produces high cost concentrate, as the grade of mined ore is too low to feed directly into a blast furnace. The falling price of seaborne iron ore has placed many of these mines under pressure and in May the Secretary General of China’s Metallurgical Mines Association stated that domestic iron ore concentrate output is expected to fall by 60 million tonnes in 2015.
Falling steel prices and over capacity are currently impacting the profitability of China’s steel mills. In order to remain viable China’s steel mills are expected to use increasing amounts of low-cost, high quality seaborne ore at the expense of higher cost domestic concentrate.
40
80
120
160
200
40
60
80
100
120
Jan 13 Jul 13 Jan 14 Jul 14 Jan 15
Figure 3.3: Iron ore price and China port stocks
China iron ore port stocks TSI 62% CFR (rhs)
US$/t
Source: Bloomberg.
Mt
300
600
900
1200
1500
1800
2013 2014 2015 2016
Figure 3.4: World iron ore export sources
Australia Brazil Rest of world India (net exports) South Africa
Mt
Source: AME.
industry.gov.au
Resources and Energy Quarterly, June 2015 20
f forecast. Source: World Steel Association.
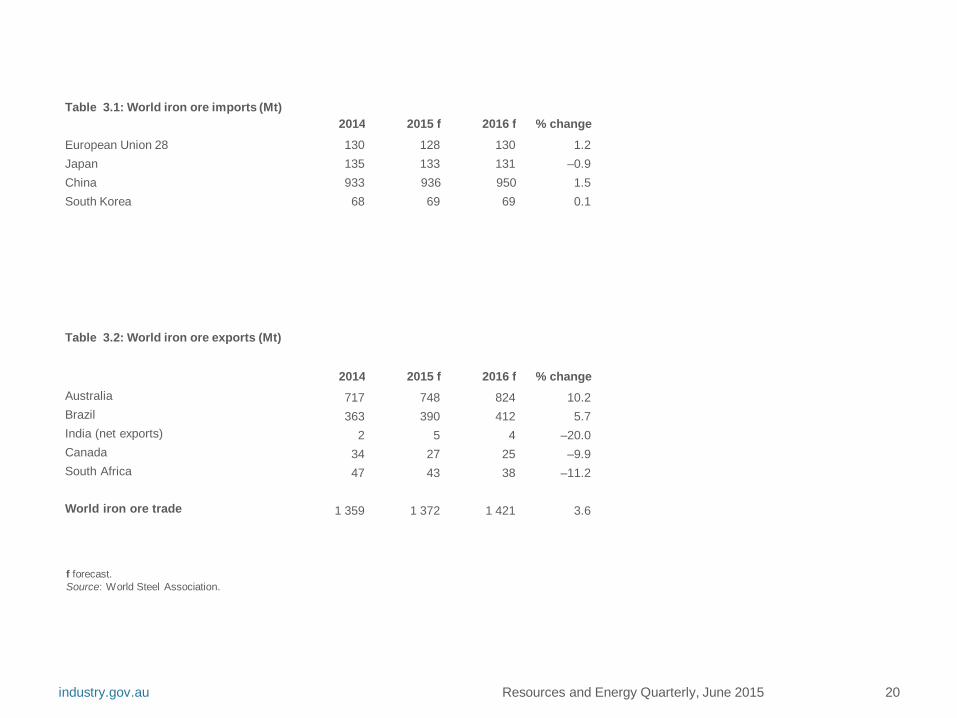
Table 3.1: World iron ore imports (Mt) 2014 2015 f 2016 f % change
European Union 28 130 128 130 1.2 Japan 135 133 131 –0.9 China 933 936 950 1.5 South Korea 68 69 69 0.1
Table 3.2: World iron ore exports (Mt)
2014 2015 f 2016 f % change Australia 717 748 824 10.2 Brazil 363 390 412 5.7 India (net exports) 2 5 4 –20.0 Canada 34 27 25 –9.9 South Africa 47 43 38 –11.2
World iron ore trade 1 359 1 372 1 421 3.6
industry.gov.au
Resources and Energy Quarterly, June 2015 21
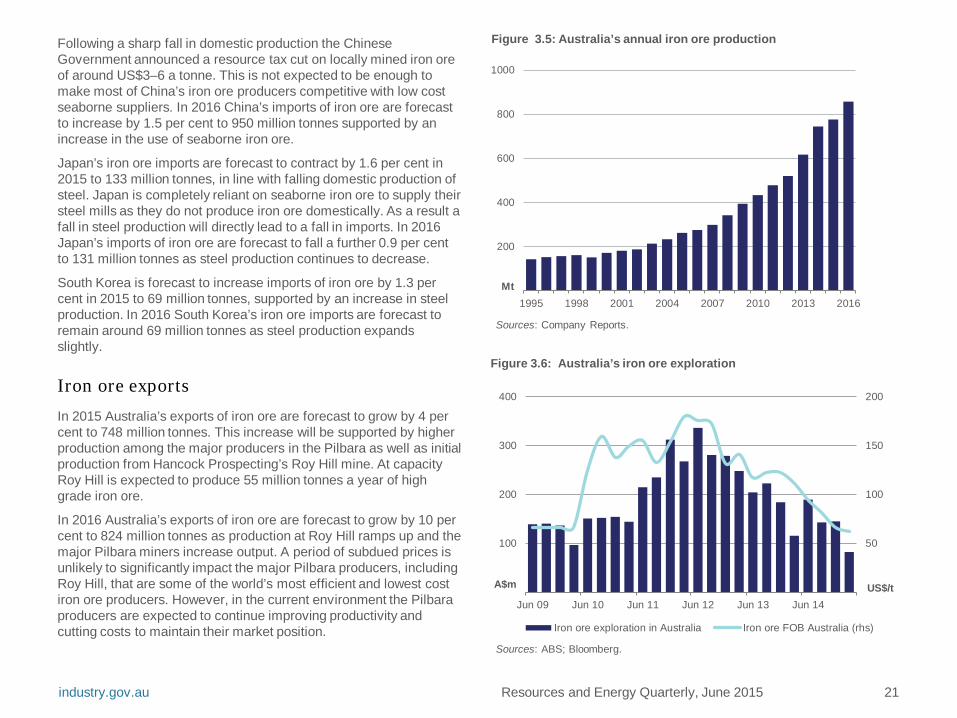
Following a sharp fall in domestic production the Chinese Government announced a resource tax cut on locally mined iron ore of around US$3–6 a tonne. This is not expected to be enough to make most of China’s iron ore producers competitive with low cost seaborne suppliers. In 2016 China’s imports of iron ore are forecast to increase by 1.5 per cent to 950 million tonnes supported by an increase in the use of seaborne iron ore.
Japan’s iron ore imports are forecast to contract by 1.6 per cent in 2015 to 133 million tonnes, in line with falling domestic production of steel. Japan is completely reliant on seaborne iron ore to supply their steel mills as they do not produce iron ore domestically. As a result a fall in steel production will directly lead to a fall in imports. In 2016 Japan’s imports of iron ore are forecast to fall a further 0.9 per cent to 131 million tonnes as steel production continues to decrease.
South Korea is forecast to increase imports of iron ore by 1.3 per cent in 2015 to 69 million tonnes, supported by an increase in steel production. In 2016 South Korea’s iron ore imports are forecast to remain around 69 million tonnes as steel production expands slightly.
Iron ore exports
In 2015 Australia’s exports of iron ore are forecast to grow by 4 per cent to 748 million tonnes. This increase will be supported by higher production among the major producers in the Pilbara as well as initial production from Hancock Prospecting’s Roy Hill mine. At capacity Roy Hill is expected to produce 55 million tonnes a year of high grade iron ore.
In 2016 Australia’s exports of iron ore are forecast to grow by 10 per cent to 824 million tonnes as production at Roy Hill ramps up and the major Pilbara miners increase output. A period of subdued prices is unlikely to significantly impact the major Pilbara producers, including Roy Hill, that are some of the world’s most efficient and lowest cost iron ore producers. However, in the current environment the Pilbara producers are expected to continue improving productivity and cutting costs to maintain their market position.
200
400
600
800
1000
1995 1998 2001 2004 2007 2010 2013 2016
Figure 3.5: Australia’s annual iron ore production
Sources: Company Reports.
Mt
50
100
150
200
100
200
300
400
Jun 09 Jun 10 Jun 11 Jun 12 Jun 13 Jun 14
Figure 3.6: Australia’s iron ore exploration
Iron ore exploration in Australia Iron ore FOB Australia (rhs)
Sources: ABS; Bloomberg.
A$m US$/t
industry.gov.au

Resources and Energy Quarterly, June 2015 22
In 2015 Brazil’s iron ore imports are forecast to increase by 7 per cent to 390 million tonnes, supported by expansions in infrastructure and a ramp-up in production at the Minas-Rio mine. In 2016 Brazil’s exports are forecast to increase by a further 6 per cent to 412 million tonnes. Brazil’s exports into Asia are expected to grow in the short term through improved domestic transport infrastructure and the use of the Valemax bulk freight vessels, which were recently approved to dock at ports in China.
Vale’s 95 million tonne Serra Sul (S11D) mine is scheduled to begin production in late 2016; however, the amount mined is not expected to materially impact Brazil’s output in 2016.
India is forecast to resume exporting small quantities of iron ore as mines in Goa, Karnataka and Odisha gradually resume production in 2015 and 2016. India was the third largest exporter of iron ore (after Australia and Brazil) in 2010; however, following a court imposed restriction on iron ore mining India became a net importer in 2014. India is forecast to export around 5 million tonnes in 2015 and 4 million tonnes in 2016, although the ability to do so profitably in a low cost environment is a key risk to this assessment.
In the short term exports from countries such as South Africa, Ukraine and Canada are forecast to decrease. Infrastructure constraints and lower grade ore combined with falling prices are anticipated to make it difficult for these countries to export profitably.
Australia
Exploration
Iron ore exploration fell 29 per cent (year-on-year) in the March quarter, to a five year low of $82 million. The falling price of ore combined with increasing supply has removed the incentive to undertake exploration and producers have been more focused on cutting costs than identifying new deposits.
Exports
In 2014-15 Australia’s iron ore export volumes are estimated to have increased by 13 per cent to 733 million tonnes, supported by an increase in output from the major Pilbara producers. Over the last couple of years the major Pilbara producers have invested heavily in infrastructure and productivity improvements and the completion of this infrastructure is expected to increase exports substantially over the short term. However, export values are estimated to have fallen by 27 per cent to $54.3 billion as a result of lower prices more than offsetting the increased volume.
In 2015-16 Australia’s iron ore exports are forecast to increase by 8 per cent to 795 million tonnes as production from Roy Hill ramps up and the Pilbara producers continue to increase output. Export values are forecast to fall by a further 3.9 per cent in 2015-16, to $52.2 billion weighed down by a further drop in the price of iron ore.
20
40
60
80
100
200
400
600
800
1000
1998–99 2002–03 2006–07 2010–11 2014–15
Figure 3.7: Australia’s iron ore exports
volume value (rhs)Source: ABS.
Mt 2014-15 A$b
industry.gov.au

Resources and Energy Quarterly, June 2015 23
Table 3.3: Iron ore outlook unit 2014 2015 f 2016 f % change
World Prices b Iron ore c – nominal US$/t 88.1 54.4 52.1 –4.2 – real d US$/t 90.1 54.4 50.9 –6.4
2013–14 2014–15 f 2015–16 f % change Australia Production Iron and steel gs Mt 4.43 4.33 4.29 –0.9 Iron ore Mt 677.4 765.5 823.5 7.6 Exports Iron and steel gs Mt 0.87 0.85 0.82 –3.4 – nominal value A$m 724 692 677 –2.2 – real value h A$m 743 692 661 –4.6 Iron ore Mt 651.4 733.2 795.0 8.4 – nominal value A$m 74 671 54 306 52 211 –3.9 – real value h A$m 76 687 54 306 50 937 –6.2
b fob Australian basis c Spot price, 62% iron content basis. d In current calendar year US dollars. e Contract price assessment for high-quality hard coking coal. g Includes all steel items in ABS, Australian Harmonized Export Commodity Classification, chapter 72, ‘Iron and steel’, excluding ferrous waste and scrap and ferroalloys. h In current financial year Australian dollars. f forecast. Sources: ABS; World Steel Association; AME.
industry.gov.au

Metallurgical coal Kate Penney
After remaining relatively steady throughout 2014, metallurgical spot prices declined substantially in the first half of 2015 as surplus supply and weaker Chinese import demand weighed on prices. The market is expected to remain oversupplied until announced production cuts materialise and demand growth begins to recover.
Prices Metallurgical coal spot prices declined substantially in the first half of 2015, reflecting surplus supply, lower demand and lower production costs that reduced the price required for operations to remain viable. Spot prices for low volatility hard coking coal FOB Australia declined from around US$110 a tonne in early January to a low of US$82 in mid-May. Prices recovered marginally in late May in response to low port inventories in China, announced cuts to China’s metallurgical coal production and reduced credit being extended to Chinese steel mills. Spot prices averaged around US$95 a tonne in the first six months of 2015, around 18 per cent lower than in 2014.
Australian benchmark contract prices for high-quality metallurgical coal delivered in the June quarter 2015 settled at US$109.50 a tonne, down from US$117 a tonne in the March quarter. Contract prices are expected to remain weak over the remainder of 2015 owing to continued surplus supply and weak steel prices. For 2015 as a whole, contract prices are forecast to average around US$104 a tonne, 17 per cent lower than 2014.
Sustained low prices have encouraged several companies to announce plans to close capacity or reduce output, particularly in North America and Australia. Despite these announcements, the market is forecast to remain oversupplied until demand growth recovers and announced production cuts materialise. In 2016, high quality hard coking coal contract prices are forecast to average US$103 a tonne.
industry.gov.au Resources and Energy Quarterly, June 2015 24
100
150
200
250
300
Sep-11 Mar-12 Sep-12 Mar-13 Sep-13 Mar-14 Sep-14 Mar-15US$/t
Figure 4.1: Metallurgical coal spot prices
Prem Low Vol HCC FOB Low Vol PCI FOB Semi Soft FOB
Source: Platts.
100
200
300
400
1999 2003 2007 2011 2015
2015 US$/t
high quality hard coking semi-soft coking
Figure 4.2: Metallurgical coal benchmark prices, FOB Australia

World trade World trade of metallurgical coal is forecast to decrease by 2.9 per cent to 301 million tonnes in 2015, driven largely by lower import demand from China. In 2016 world trade is forecast to increase by 1.4 per cent to 305 million tonnes.
Imports China’s imports of metallurgical coal declined by 25 per cent year-on-year in the first four months of 2015 to around 15 million tonnes owing to weak growth in steel output and increased use of domestically-sourced coal. Steel mills were also reluctant to import coal in early 2015 because of the risk of prices declining rapidly during transit.
China’s domestic coal producers have struggled to remain viable in an environment of lower prices. Heilongjiang Longmay Mining Holding Group, one of China’s top four metallurgical coal producers, announced it will close eight of its mines because of low margins, low prices and the exhaustion of economic reserves.
Growth in China’s metallurgical coal use is expected to be subdued in 2015 and 2016 reflecting a forecast contraction in steel production. While China is expected to remain a large importer, the introduction of policies to support the domestic industry will ensure that most of China’s demand will be met by domestic supply in the short term. As a result, China’s metallurgical coal imports are forecast to decline by 31 per cent to 45 million tonnes in 2015 and remain around that level in 2016.
The China-Australia Free Trade Agreement was signed in mid-June. Once enacted, the 3 per cent tariff levied on metallurgical coal imports from Australia will be removed. This is likely to improve the competitiveness of Australian coal relative to other major producers and may result in Australia gaining an increased share of China’s imports.
India has announced its intention to rapidly expand steel production to support investment in infrastructure as the economy develops. While India has some domestic metallurgical coal, it relies mostly on
industry.gov.au Resources and Energy Quarterly, June 2015 25
2
4
6
8
10
Oct-11 Apr-12 Oct-12 Apr-13 Oct-13 Apr-14 Oct-14 Apr-15
Mt
Figure 4.3: China’s imports of metallurgical coal, by source
Australia Mongolia Canada Russia Other
Source: IHS.
Table 4.1: Metallurgical coal trade 2014 2015 f 2016 f
Metallurgical coal imports (Mt)
European Union 28 40 41 43 Japan 48 48 48 China 65 45 45 South Korea 34 34 34 India 46 52 53
Metallurgical coal exports (Mt)
Australia 186 185 189 Canada 32 33 33 United States 58 54 51 Russia 22 22 23
World trade 310 301 305
imports to meets its requirements. India’s imports of metallurgical coal are forecast to increase by 13 per cent in 2015 and by a further 2.7 per cent in 2016 to 52 million tonnes and 53 million tonnes, respectively.
Exports Lower prices have encouraged companies to reduce output or close capacity and removed the incentive to invest in new projects. In May, Teck Resources, one of the world’s largest metallurgical coal exporters, announced that it would idle six of its mines in Canada for three weeks during the September quarter in response to lower prices and weak demand. The exercise is expected to reduce Teck Resources’ 2015 output by 1.5 million tonnes. The competitiveness of US production has been eroded by the strength of the US dollar relative to the currencies of other major producers. It is estimated that more than 60 per cent of US production is at risk of closure. US metallurgical coal exports are forecast to decrease by 6 per cent in 2015 and by a further 6 per cent in 2016 to 54 million tonnes and 51 million tonnes, respectively.
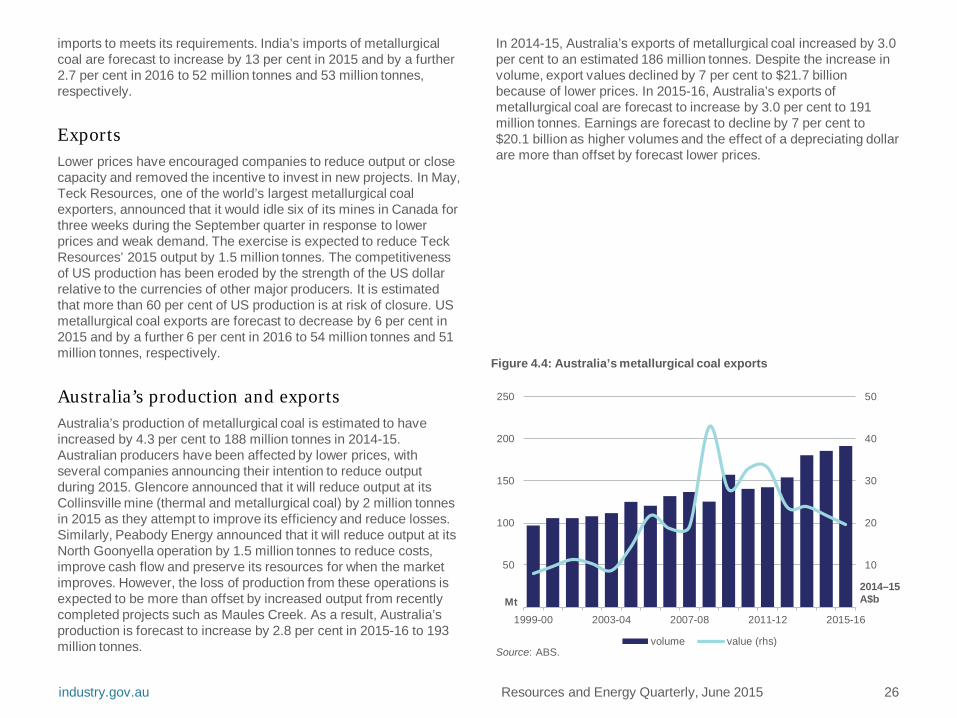
Australia’s production and exports Australia’s production of metallurgical coal is estimated to have increased by 4.3 per cent to 188 million tonnes in 2014-15. Australian producers have been affected by lower prices, with several companies announcing their intention to reduce output during 2015. Glencore announced that it will reduce output at its Collinsville mine (thermal and metallurgical coal) by 2 million tonnes in 2015 as they attempt to improve its efficiency and reduce losses. Similarly, Peabody Energy announced that it will reduce output at its North Goonyella operation by 1.5 million tonnes to reduce costs, improve cash flow and preserve its resources for when the market improves. However, the loss of production from these operations is expected to be more than offset by increased output from recently completed projects such as Maules Creek. As a result, Australia’s production is forecast to increase by 2.8 per cent in 2015-16 to 193 million tonnes.
In 2014-15, Australia’s exports of metallurgical coal increased by 3.0 per cent to an estimated 186 million tonnes. Despite the increase in volume, export values declined by 7 per cent to $21.7 billion because of lower prices. In 2015-16, Australia’s exports of metallurgical coal are forecast to increase by 3.0 per cent to 191 million tonnes. Earnings are forecast to decline by 7 per cent to $20.1 billion as higher volumes and the effect of a depreciating dollar are more than offset by forecast lower prices.
industry.gov.au Resources and Energy Quarterly, June 2015 26
10
20
30
40
50
50
100
150
200
250
1999-00 2003-04 2007-08 2011-12 2015-16
2014–15 A$b Mt
Figure 4.4: Australia’s metallurgical coal exports
volume value (rhs)Source: ABS.

industry.gov.au Resources and Energy Quarterly, June 2015 27
b fob Australian basis c Contract price assessment for high-quality hard coking coal. d In current calendar year US dollars. e In current financial year Australian dollars. f forecast. Source: ABS.
Table 4.2: Metallurgical coal outlook unit 2014 2015 f 2016 f % change
World Contract prices bc – nominal US$/t 125.5 103.6 103.0 –0.6 – real d US$/t 128.4 103.6 100.7 –2.8
2013–14 2014–15 f 2015–16 f Australia Production Mt 180.3 188.1 193.4 2.8 Export volume Mt 180.5 185.8 191.4 3.0 – nominal value A$m 23 254 21 694 20 095 –7.4 – real value e A$m 23 882 21 694 19 605 –9.6

Thermal coal Kate Penney
The thermal coal market continues to be plagued by oversupply despite announced reductions in capacity worldwide. Spot prices will also be affected by forecast weakness in China’s imports because of reduced economic activity, higher hydropower output and measures to support the domestic industry.
Prices Thermal coal prices continued on a downward trajectory in the first half of 2015 in response to surplus supply and lower import demand from China. Newcastle free on board prices began 2015 at around US$62 a tonne and declined progressively to around US$54 a tonne in mid-April. Prices have since recovered to around US$60 a tonne.
Many producers have struggled to remain viable in an environment of lower prices. However, the supply response has been delayed because of limitations to changing infrastructure supply services, the depreciation of the US dollar relative to the currencies of other major producers, and lower energy prices. After a period of sustained low prices, some companies are beginning to announce their intention to cut production. Despite this, there has not been a sufficient reduction in capacity to reduce the supply overhang. As such, spot prices are expected to remain under pressure over the remainder of 2015 and into 2016.
Benchmark prices for the Japanese Fiscal Year 2015 (JFY, April 2015 to March 2016) settled at US$67.80, a strong premium over the prevailing spot price of US$57 a tonne at the time of settlement. Although the benchmark price was 17 per cent lower than JFY 2014, the depreciation of the Australian dollar meant that the price received by Australian producers was around $1 a tonne higher. Benchmark prices for JFY 2016 are forecast to settle at 9 per cent lower at around US$62 a tonne, underpinned by continued oversupply and an assumed depreciation of the Australian dollar.
industry.gov.au Resources and Energy Quarterly, June 2015 28
70
90
110
130
150
170
Jul-11 Jan-12 Jul-12 Jan-13 Jul-13 Jan-14 Jul-14 Jan-15
US$/t
Figure 5.1: Thermal coal spot prices
Newcastle 6000kcal Richard's Bay 6000kcal QHD 5800kcal
Source: Bloomberg.
40
80
120
160
2000 2004 2008 2012 2016
2015 US$/t
Figure 5.2: JFY thermal coal prices

World trade World trade in thermal coal is forecast to decline by 4.6 per cent to 1010 million tonnes in 2015, reflecting a forecast decline in China’s imports. World trade is forecast to increase by 2.6 per cent to 1036 million tonnes in 2016, supported by growth in imports into India.
Imports
China
The Chinese Government has announced a series of measures targeting the use of coal in an attempt to improve air quality, particularly in highly populated cities. While this will slow the growth in China’s coal use, coal will remain an important part of the energy mix with 96.2 gigawatts of coal-fired capacity under construction or approved (almost twice Australia’s total installed capacity across all energy types). In early 2015, China’s coal consumption has been affected by reduced economic activity and continued strength in hydroelectric output. In the first five months of 2015, hydroelectric generation increased by 14 per cent year-on-year, while thermal generation declined by 0.7 per cent.
Coal production in China continued to decline in the first half of 2015 in response to weaker demand, lower prices and government directives. Chinese state-owned producers have been encouraged to reduce output as part of efforts to stabilise domestic coal prices. Shenhua, China’s largest coal company has committed to reduce its output by 34 million tonnes in 2015 to 273 million tonnes.
China’s imports of thermal coal declined by 32 per cent to 54 million tonnes in the first four months of 2015 because of lower thermal generation and increased use of domestically-sourced coal following the introduction of measures to support the domestic industry. The China National Coal Association estimates that 90 per cent of their members’ production is unprofitable at current prices.
Over the remainder of 2015 and in 2016, China’s import growth will continue to be challenged by slowing economic growth, strong hydroelectric output and measures to support the domestic industry.
industry.gov.au Resources and Energy Quarterly, June 2015 29
50
100
150
200
250
300
350
coal hydro gas nuclear otherrenewables
oil
GW
OECD Non-OECDSource: Enerdata, www.enerdata.net.
Figure 5.3: World electricity capacity under construction or approved
300
600
900
1200
1500
Dec-10 Dec-11 Dec-12 Dec-13 Dec-14
Billion kWh
thermal hydro nuclear windSource: CEIC.
Figure 5.4: China’s quarterly electricity generation

China’s imports are forecast to decline by 31 per cent to 157 million tonnes in 2015, before recovering slightly to 160 million tonnes in 2016.
India
India has around 113 gigawatts of new coal-fired capacity under construction or approved. These investments form the backbone of the Indian Government’s plan to improve electricity access and stimulate economic growth. India’s coal production has not kept pace with the rapid increase in its demand associated with the expansion of coal-fired capacity, contributing to a rise in imports over the past few years. Coal India Limited, the largest coal producer in India, has been successful in increasing production in early 2015. However, growth in production is not expected to be sufficient to meet demand in the short term.
In early 2015, India’s coal imports were mostly of high energy coal that can be blended with lower quality domestic coal to meet power plant specifications. This affected the volume of imports from Indonesia, India’s primary source of coal. India’s thermal coal imports in 2015 are forecast to increase by 11 per cent to 174 million tonnes, overtaking China as the world’s largest importer of thermal coal. In 2016, imports are forecast to increase by a further 8 per cent to 188 million tonnes.
Japan
Japan’s imports of thermal coal in early 2015 continued to be supported by the absence of nuclear power. In May the Japanese Government released a draft plan for Japan’s energy mix by 2030, which indicated a continued role for nuclear power over the medium to longer term. Under the plan, nuclear power is expected to account for 20–22 per cent of the energy mix, gas 27 per cent, coal 26 per cent, renewables 22-24 per cent and oil 3 per cent. Although a few reactors have received approval to restart from the Nuclear Regulatory Authority, there still remains uncertainty over the timing of restarts in the short term which is likely to support Japan’s coal imports. Japan’s thermal coal imports are forecast to increase by 2.8 per cent in 2015 to 148 million tonnes before declining to 145 million tonnes in 2016. industry.gov.au Resources and Energy Quarterly, June 2015 30
10
20
30
40
50
60
70
80
Dec-10 Sep-11 Jun-12 Mar-13 Dec-13 Sep-14
Mt
Figure 5.5: China’s quarterly coal imports by source
Indonesia Australia OtherSource: IHS.
50
100
150
200
250
300
350
coal hydro nuclear gas oil otherrenewable
GW
operational under construction approved
Source: Enerdata, www.enerdata.net.
Figure 5.6: India’s electricity generating capacity >50MW

South Korea
South Korea’s Seventh Power Generation Master Plan is under development and will provide some guidance on the future structure of South Korea’s electricity generation mix. There has been some shift in sentiment away from coal-fired generation because of concerns over emissions near highly populated cities. Four plants with a combined capacity of 3.7 gigawatts have been delayed or cancelled. Nonetheless, the remaining investment in new coal-fired capacity indicates South Korea’s total coal-fired capacity is likely to expand.
From 1 July, the import tax on coal in South Korea will be increased by around US$4.40. The tax increase is likely to reduce the competitiveness of low energy content coal, such as that from Indonesia. South Korea’s thermal coal imports are forecast to increase by 2.0 per cent in 2015 and 2016 to 100 million tonnes and 102 million tonnes, respectively.
Exports
Indonesia
Indonesian producers have struggled to remain viable in the face of lower prices and reduced import demand in key export markets. The cost of production for many producers is denominated in US dollars and the strengthening US dollar has contributed to deteriorating competitiveness. There are indications that some small to mid-size producers are starting to reduce output in response to reduced profitability. Output was also affected by heavy rainfall in early 2015. Reflecting this, Indonesia’s production was reported to have declined by 21 per cent in the March quarter to 97 million tonnes.
The Indonesian Government has announced its intentions to begin to consolidate the coal industry. They will begin by reviewing coal mines without ‘clear certification’. It is estimated that more than 40 per cent of 10 000 licences issued do not comply with government rules, including payment of administration fees and royalties, and could be revoked.
industry.gov.au Resources and Energy Quarterly, June 2015 31
10
20
30
40
50
60
70
Dec-10 Sep-11 Jun-12 Mar-13 Dec-13 Sep-14
Mt
Japan South KoreaSource: IHS.
Figure 5.7: Japan and South Korea’s quarterly imports
200
400
600
800
1000
2000 2002 2004 2006 2008 2010 2012 2014 2016
Mt
Figure 5.8: Major thermal coal importers
EU 27 Japan South Korea India China
Source: IEA.

Indonesia has been adversely affected by lower demand in China and India as they favour higher energy coal from other sources. Lower demand, combined with lower production, tighter regulation of exports and increased domestic use are expected to contribute to lower exports in 2015 and 2016. Indonesia’s exports of thermal coal are forecast to decline to 405 million tonnes and 403 million tonnes in 2015 and 2016, respectively.
Colombia
In the March quarter, Colombia’s coal production declined by 5 per cent year-on-year to 23 million tonnes because of labour disputes and transport limitations. The introduction of a night time rail restriction on the Fenoco coal railway to reduce noise pollution has affected the operations of three major coal mines: Drummond, Prodeco and Colombia Natural Resources. Accordingly, the Colombian Government has revised its 2015 production forecast to 87 million tonnes. Colombia’s exports of thermal coal are forecast to decline by 4.2 per cent to 68 million tonnes in 2015 and then recover by 10 per cent to 75 million tonnes in 2016.
Australia
Exploration
Australia’s coal exploration expenditure in the March quarter was around $44 million, down 44 per cent on the December quarter and 57 per cent on the March quarter 2014. Low coal prices and persistent oversupply continued to reduce the incentive to invest in coal exploration.
Production
Australia’s thermal coal production is estimated to have declined by 0.7 per cent to 246 million tonnes in 2014-15 as announced reductions in capacity more than offset higher production from recently completed projects. In February, Glencore announced its intention to reduce output at its Australian operations by 15 million tonnes in 2015. In 2015-16, Australia’s thermal coal production is forecast to increase by 1.4 per cent to 249 million tonnes. industry.gov.au Resources and Energy Quarterly, June 2015 32
80
160
240
320
400
50
100
150
200
250
Mar-10 Mar-11 Mar-12 Mar-13 Mar-14 Mar-15
US$/t A$m
Figure 5.10: Australia’s coal exploration expenditure
exploration expenditure Hard Coking Coal contract (rhs)Newcastle spot (rhs)
Sources: ABS; Bloomberg.
200
400
600
800
1000
2000 2002 2004 2006 2008 2010 2012 2014 2016
Mt
Figure 5.9: Major thermal coal exporters
South Africa Colombia Russia Australia Indonesia
Source: IEA.

Exports
Although the current operating environment has been more challenging for Australian coal producers, Australia’s thermal coal exports remained resilient. Demand for Australian coal in key markets including Japan, South Korea and Chinese Taipei remained relatively steady during 2014-15. As a result, Australia’s exports of thermal coal increased by 3.2 per cent to 201 million tonnes in 2014-15. Despite higher volumes, the value of these exports declined by an estimated 7 per cent to $15.6 billion because of lower prices.
In 2015-16, Australia’s thermal coal exports are forecast to increase by 0.4 per cent to 202 million tonnes. Earnings from thermal coal exports are forecast to decline by 6 per cent to $14.6 billion as forecast lower prices more than offset higher volumes and an assumed depreciating Australian dollar.
industry.gov.au Resources and Energy Quarterly, June 2015 33
5
10
15
20
25
50
100
150
200
250
1999-00 2003-04 2007-08 2011-12 2015-16
2014–15 A$b Mt
Figure 5.11: Australia’s thermal coal exports
volume value (rhs)Source: ABS.

industry.gov.au Resources and Energy Quarterly, June 2015 34
b Japanese Fiscal Year (JFY), starting April 1, fob Australia basis. Australia–Japan average contract price assessment for steaming coal with a calorific value of 6700 kcal/kg gross air dried. c In current JFY US dollars. d In current financial year Australian dollars. f forecast. Sources: ABS; IEA; Coal Services Pty Ltd; Queensland Department of Natural Resources and Mines.
Table 5.1: Thermal coal outlook unit 2014 2015 f 2016 f % change
World Contract prices b – nominal US$/t 82 68 62 –8.6 – real c US$/t 84 68 61 –10.6 Coal trade Mt 1 058 1 010 1 036 2.6 Imports Asia Mt 762 718 738 2.8
China Mt 229 157 160 1.9 Chinese Taipei Mt 61 62 62 0.5 India Mt 157 174 188 8.1 Japan Mt 144 148 145 –2.0 South Korea Mt 98 100 102 2.0
Europe Mt 228 222 224 1.2 European Union 27 Mt 178 172 171 –0.6 other Europe Mt 50 50 53 7.3
Exports Australia Mt 201 195 205 4.8 Colombia Mt 71 68 75 10.3 Indonesia Mt 406 405 403 –0.6 Russia Mt 120 122 125 2.5 South Africa Mt 74 75 77 2.7 United States Mt 31 25 23 –8.0
2013–14 2014–15 f 2015–16 f Australia Production Mt 247.8 246.1 249.4 1.4 Export volume Mt 194.6 200.8 201.7 0.4 – nominal value A$m 16 705 15 621 14 631 –6.3 – real value d A$m 17 156 15 621 14 274 –8.6

Gas Tom Willcock
New Australian liquefaction capacity will support global LNG market growth over the next year. Australia’s gas production and exports will also grow, but sustained contract and spot price weakness will temper increasing export values.
Prices March quarter LNG prices into Northeast Asia began to respond to the fall in oil prices that occurred in the second half of 2014. The landed price in Japan has declined in each consecutive month since October last year. It averaged $US14.20 a gigajoule in the March quarter, down from US$16.60 in December. Prices in South Korea and China were also down. Most LNG contracts into Asia are linked to a 3–9 month lagged average oil price – hence LNG prices falling despite flatter oil prices. Asian spot prices remain subdued in the US$7–8 a gigajoule range as new supply enters the market, even though opportunistic utilities are buying more.
Oil prices are forecast to remain relatively flat which will result in slight falls to contracted LNG prices in the June quarter before levelling out through the remainder of 2015 and into 2016. Spot prices are expected to remain weak as extensive new regional supply continues to come online. Prices for landed LNG are therefore expected to remain weak over the next 18 months, likely hovering around US$10–12 a gigajoule in Japan, and most price risk will be to the downside.
Eastern Australian gas prices have been mixed since the start of the year. Commissioning at Queensland Curtis LNG (QCLNG) resulted in sharp spikes at the Wallumbilla hub and Brisbane short term trading market (STTM). Prices have since moderated as wells feeding QCLNG have come online, but are expected to remain volatile over the remainder of the year and into 2016. CSG well ramp-up and management in support of new LNG plants will be a key determinant of short term Eastern Australian spot gas prices.
industry.gov.au Resources and Energy Quarterly, June 2015 35
25
50
75
100
125
5
10
15
20
25
Oct-2012 Apr-2013 Oct-2013 Apr-2014 Oct-2014 Apr-2015
US$/ bbl
US$ /GJ
Japan landed LNG China landed LNG
North Asia Spot LNG Japan Customs-cleared Crude (rhs)
Figure 6.1: Monthly Asian LNG and oil prices
Sources: Argus and Petroleum Association of Japan.
2
4
6
8
Oct-2012 Apr-2013 Oct-2013 Apr-2014 Oct-2014 Apr-2015
$/GJ
Sydney STTM Brisbane STTM Adelaide STTM
Victoria wholesale Wallumbilla hub
Figure 6.2: Indicative monthly Eastern Australian gas prices
Notes: STTM prices are ex ante, and tend to cover less than 10 per cent of the gas consumed in those markets. The Victoria wholesale price is ex post, and typically 10 to 20 per cent of the gas consumed in Victoria is exposed to that price. Source: AEMO.

Global LNG developments
Japan imported 24.3 million tonnes of LNG in the March quarter, a record volume. Imports by China and South Korea also increased over the quarter. Cheap spot LNG has resulted in increased gas consumption in Japan, but competition from pipeline gas imports in China – which exceeded LNG over the March quarter – and coal in South Korea are stymieing growth in those countries.
The global LNG market is on the precipice of massive change. A prolonged period of tightness has stimulated large investment in supply, most of which is located in the Pacific Basin. One of the largest ever expansions in liquefaction capacity is expected to occur in 2016, increasing from 252 to 287 million tonnes. The major sources of new supply will be QCLNG, Australia Pacific, Gladstone LNG and Gorgon in Australia, Sabine Pass in the US and a number of Indonesian and Malaysian projects.
China is expected to be one the world’s major sources of incremental demand over the forecast period, growing from 18 million tonnes in 2014 to 28 million tonnes in 2016, yet downside risks appear to be growing. Competition from pipeline supplies, mainly from Central Asia (where the Line C expansion will almost double capacity by the end of the year), is proving fierce. Increasing coal and renewable electricity generation capacity will also squeeze LNG – still a relatively high cost energy source. Imports in the March quarter 2015 were the first since China began importing LNG in 2006 that were lower than the corresponding quarter a year before. If, as early signs suggest, Chinese importers are unable to accommodate new contracted volumes over the short term, a global supply glut could quickly emerge.
In order to generate cash flow, operators of new LNG projects will strive to maximise output regardless of whether buyers take contracted volumes. This is likely to promote spot market competition and underpin growing imports of uncontracted LNG into Europe and emerging regions (such as ASEAN and India) – from a combined total of 95 million tonnes in 2014 to 116 million tonnes in 2016. Total global LNG imports are expected to grow strongly, from 239 to 271 million tonnes between 2014 and 2016, but not enough to prevent a short term supply overshoot.
industry.gov.au Resources and Energy Quarterly, June 2015 36
20
40
60
80
100
2010 2011 2012 2013 2014 2015 2016
Mt
Australia Middle East Africa ASEAN Rest of the world
Figure 6.3: Global LNG supply capacity
Note: Outlook includes allowances for plant downtime and maintenance. Sources: Nexant and IEA.
10
20
30
40
50
60
70
80
90
2010 2011 2012 2013 2014 2015 2016
Mt
Japan South Korea China Europe Rest of the world
Figure 6.4: Global LNG imports
Sources: Nexant and IEA.

Australia Australian gas production rose slightly in the March quarter to 16.0 billion cubic metres as increased CSG production associated with Queensland LNG projects offset flat conventional gas production. Australia is estimated to have produced 65.7 billion cubic metres of gas in 2014–15 (equivalent to 48 million tonnes of LNG), a 4.4 per cent increase on 2013–14. The ramp-up of train 1 at QCLNG will be supplemented by commissioning at APLNG and GLNG as the main sources of additional gas production in 2014–15.
In 2015–16, new LNG plants will remain the predominant source of gas production growth in Australia, driving a 30 per cent rise in output to 85.1 billion cubic metres (62 million tonnes). GLNG, currently around 95 per cent complete, is expected to achieve first-LNG in coming months and will be followed later in 2015 by APLNG, now 91 per cent complete, and Gorgon LNG, around 90 per cent complete. These three projects will ramp-up production and bring trains online throughout 2015–16, resulting in strong quarter to quarter growth over the outlook period.
industry.gov.au Resources and Energy Quarterly, June 2015 37
10
20
30
40
50
2011-12 2012–13 2013–14 2014–15 2015-16
Bcm
Eastern market Western market Northern market
Figure 6.6: Australian gas production outlook by market
Note: Gas production associated with Darwin LNG is not included in the Northern market as it comes from the Bayu-Undan Joint Petroleum Development Area.
10
20
30
40
50
60
70
80
90
2011-12 2012–13 2013–14 2014–15 2015–16
Bcm
Conventional CSG Total
Figure 6.7: Australian gas production outlook by type
10
20
30
40
50
2005-06 2007-08 2009-10 2011-12 2013-14 2015-16Mt
Existing New
Figure 6.5: Australian LNG production capacity

Quarterly LNG exports reached an all-time high of 6.6 million tonnes in March due to higher loadings from the North West Shelf and Pluto projects and the start-up of QCLNG. Australian LNG exports are estimated to have reached 25.5 million tonnes – also a record – in 2014–15 and are forecast to continue growing to 38.1 million tonnes in 2015–16. The start-up of APLNG, GLNG and Gorgon, along with ramp-up at QCLNG, are underpinning that 49 per cent growth.
Australia exported $4.6 billion worth of LNG in the March quarter, slightly below the December quarter as lower oil prices offset higher volumes. Exports are estimated to reach $18.0 billion in 2014–15 and $24.4 billion in 2015–16 due to strong volume growth and modest currency depreciation effects.
industry.gov.au Resources and Energy Quarterly, June 2015 38
5
10
15
20
25
8
16
24
32
40
2005-06 2007-08 2009-10 2011-12 2013-14 2015-16
2014-15 $Ab Mt
Volume Value (rhs)
Figure 6.8: Australian LNG exports
b Production includes both sales gas and gas used in the production process (i.e. plant use). d 1 million tonnes of LNG is equivalent to approximately 1.36 billion cubic metres of gas. e In current financial year Australian dollars. f Forecast. Sources: ABS; Company reports and World Bank.
Table 6.1: Gas outlook unit 2013–14 2014–15 f 2015–16 f % change
Australia Production b Bcm 62.9 65.7 85.1 29.5 – Eastern market Bcm 22.2 23.5 38.2 62.0 – Western market Bcm 40.1 41.5 46.2 11.5 – Northern market Bcm 0.7 0.7 0.7 -2.1 LNG export volume Mt d 23.2 25.5 38.1 49.1 – nominal value A$m 16 305 17 901 24 416 36.4 – real value e A$m 16 745 17 901 23 821 33.1
Sources: ABS.

Oil Kieran Bernie
The value of Australia’s exports of crude oil and condensate will fall in the near term as the effect of lower prices outweighs increasing export volumes. Prices will continue to increase moderately from recent lows as a result of slower growth in non-OPEC supply.
Prices After falling considerably in the second half of 2014 oil prices stabilised somewhat in the first quarter of 2015 as stronger consumption countered steady supply. The price of West-Texas Intermediate (WTI) averaged US$49 a barrel in the March quarter, while the price of Brent averaged US$54 a barrel.
Prices are forecast to increase moderately throughout 2015 in line with slowing growth in non-OPEC supply. For the year as a whole, WTI is forecast to average US$54 a barrel, while Brent is forecast to average US$59 a barrel.
Oil prices are expected to continue to increase over the outlook period as the effect of reduced upstream investment begins to weigh on production growth. In real terms, the price of WTI is forecast to increase to US$62 a barrel in 2016, while the price of Brent is forecast to reach US$66 a barrel.
The outlook for prices remains subject to considerable uncertainty in the near term due to a number of factors, including the possible revocation of international sanctions limiting supply from Iran.
World oil consumption Global oil consumption is forecast to increase by 1.3 per cent in 2015 to average 93.7 million barrels a day, up considerably from the sluggish 0.7 per cent increase observed in 2014.
Resources and Energy Quarterly, June 2015 39 industry.gov.au
30
60
90
120
May 2014 Aug 2014 Nov 2014 Feb 2015 May 2015
Figure 7.1: Weekly oil prices
Brent WTI
2015 US$/
bbl
30
60
90
120
150
2000 2002 2004 2006 2008 2010 2012 2014 2016
Figure 7.2: Annual oil prices
Brent WTI
2015 US$/
bbl
Source: Bloomberg.
Source: Bloomberg.

The expected increase in growth is the result of stronger consumption in OECD economies, particularly those in Europe, which experienced particularly cold weather in the first quarter of 2015, leading to increased demand for heating. OECD consumption is forecast to increase by 0.4 per cent in 2015 to reach 45.8 million barrels a day, reversing the 0.9 per cent decline recorded in 2014.
World oil consumption is expected to continue to increase in 2016, by 1.2 per cent to average 94.8 million barrels a day.
Net growth will be driven by increased consumption in non-OECD economies that largely offsets slowing growth in OECD consumption. Increases in non-OECD consumption will continue to be concentrated in Asian and Middle Eastern economies, which together, are forecast to consume an additional 900 thousand barrels a day in 2016.
World oil production Global oil production is forecast to increase by 1.1 per cent in 2015 to reach 94.3 million barrels a day, down from the strong 2.1 per cent increase recorded in 2014.
The slower rate of growth is the result of a smaller increase in non-OPEC production, which largely reflects the response of unconventional producers in North America to the lower price environment. Output from non-OPEC producers is forecast to increase by 1.3 per cent in 2015 to average 57.8 million barrels a day, significantly lower than the 3.6 per cent increase observed in 2014.
OPEC supply is forecast to increase by 0.8 per cent in 2015, reversing declines in 2013 and 2014, to reach 37.0 million barrels a day.
World oil production is expected to continue to grow in 2016 but at a slower rate of 0.9 per cent, to average 95.2 million barrels a day in line with smaller increases in non-OPEC output. Increases in OPEC supply will continue to be supported by expanding production of natural gas liquids, which are projected to provide an additional 240 thousand barrels a day in 2016.
Resources and Energy Quarterly, June 2015 40 industry.gov.au
-2
-1
0
1
2
3
2007 2008 2009 2010 2011 2012 2013 2014 2015 2016mbd
Figure 7.3: Growth in world oil consumption
OECD Non-OECD Total
-2
-1
0
1
2
3
2007 2008 2009 2010 2011 2012 2013 2014 2015 2016
mbd
Figure 7.4: Growth in world oil production
OPEC Non-OPEC Total
: Source: IEA
Source: IEA
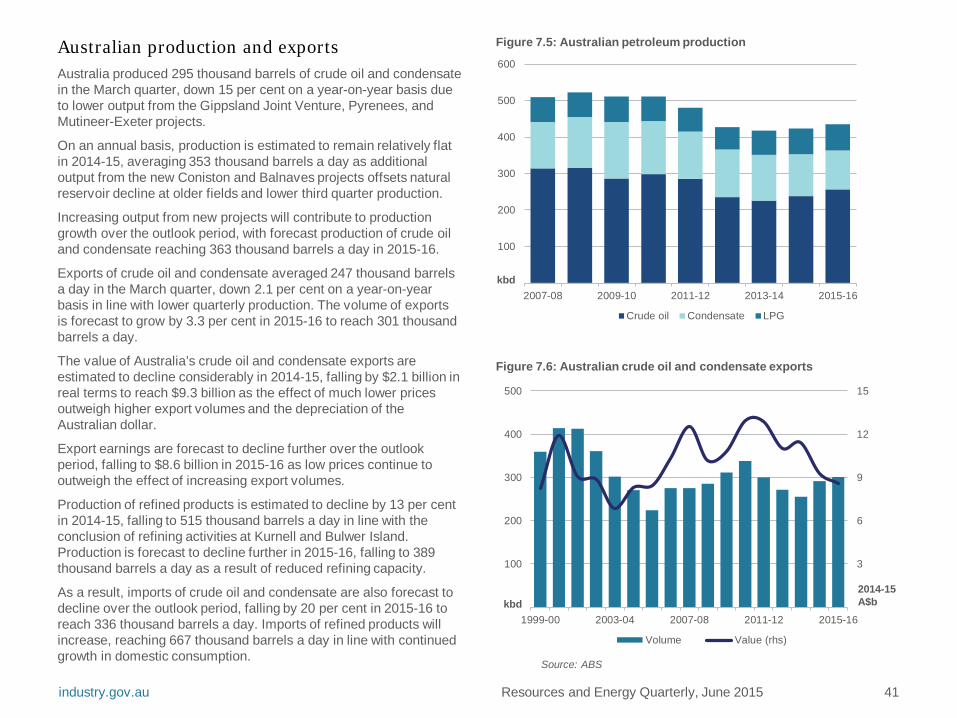
Australian production and exports Australia produced 295 thousand barrels of crude oil and condensate in the March quarter, down 15 per cent on a year-on-year basis due to lower output from the Gippsland Joint Venture, Pyrenees, and Mutineer-Exeter projects.
On an annual basis, production is estimated to remain relatively flat in 2014-15, averaging 353 thousand barrels a day as additional output from the new Coniston and Balnaves projects offsets natural reservoir decline at older fields and lower third quarter production.
Increasing output from new projects will contribute to production growth over the outlook period, with forecast production of crude oil and condensate reaching 363 thousand barrels a day in 2015-16.
Exports of crude oil and condensate averaged 247 thousand barrels a day in the March quarter, down 2.1 per cent on a year-on-year basis in line with lower quarterly production. The volume of exports is forecast to grow by 3.3 per cent in 2015-16 to reach 301 thousand barrels a day.
The value of Australia’s crude oil and condensate exports are estimated to decline considerably in 2014-15, falling by $2.1 billion in real terms to reach $9.3 billion as the effect of much lower prices outweigh higher export volumes and the depreciation of the Australian dollar.
Export earnings are forecast to decline further over the outlook period, falling to $8.6 billion in 2015-16 as low prices continue to outweigh the effect of increasing export volumes.
Production of refined products is estimated to decline by 13 per cent in 2014-15, falling to 515 thousand barrels a day in line with the conclusion of refining activities at Kurnell and Bulwer Island. Production is forecast to decline further in 2015-16, falling to 389 thousand barrels a day as a result of reduced refining capacity.
As a result, imports of crude oil and condensate are also forecast to decline over the outlook period, falling by 20 per cent in 2015-16 to reach 336 thousand barrels a day. Imports of refined products will increase, reaching 667 thousand barrels a day in line with continued growth in domestic consumption.
Resources and Energy Quarterly, June 2015 41 industry.gov.au
100
200
300
400
500
600
2007-08 2009-10 2011-12 2013-14 2015-16
Crude oil Condensate LPG
kbd
Figure 7.5: Australian petroleum production
3
6
9
12
15
100
200
300
400
500
1999-00 2003-04 2007-08 2011-12 2015-16
Volume Value (rhs)
kbd 2014-15 A$b
Figure 7.6: Australian crude oil and condensate exports
Source: ABS
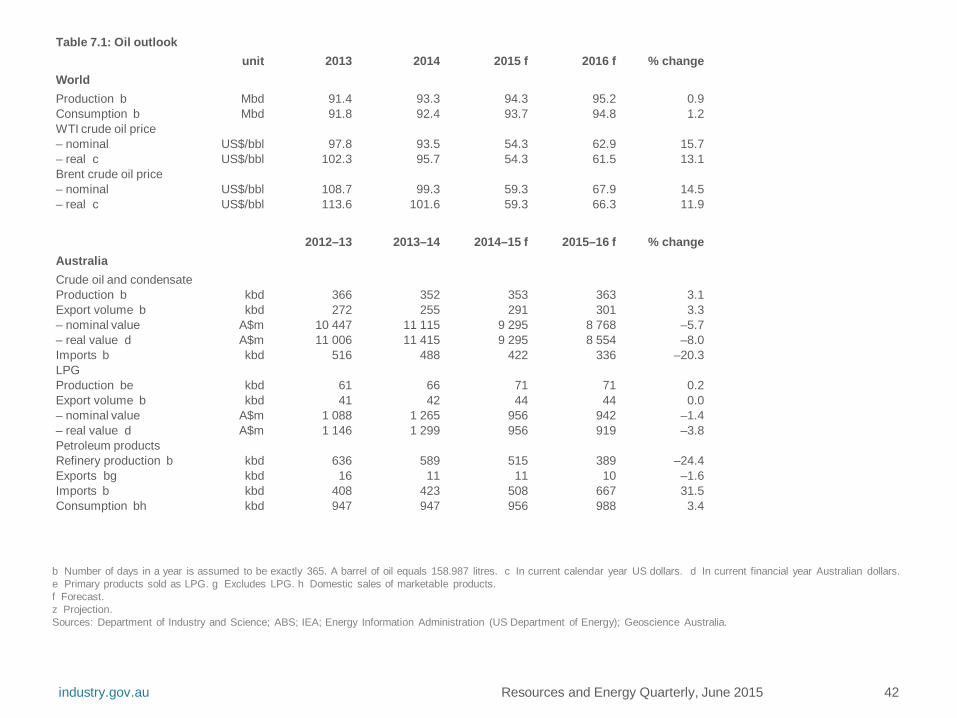
Resources and Energy Quarterly, June 2015 42
b Number of days in a year is assumed to be exactly 365. A barrel of oil equals 158.987 litres. c In current calendar year US dollars. d In current financial year Australian dollars. e Primary products sold as LPG. g Excludes LPG. h Domestic sales of marketable products. f Forecast. z Projection. Sources: Department of Industry and Science; ABS; IEA; Energy Information Administration (US Department of Energy); Geoscience Australia.
industry.gov.au
Table 7.1: Oil outlook unit 2013 2014 2015 f 2016 f % change
World Production b Mbd 91.4 93.3 94.3 95.2 0.9 Consumption b Mbd 91.8 92.4 93.7 94.8 1.2 WTI crude oil price – nominal US$/bbl 97.8 93.5 54.3 62.9 15.7 – real c US$/bbl 102.3 95.7 54.3 61.5 13.1 Brent crude oil price – nominal US$/bbl 108.7 99.3 59.3 67.9 14.5 – real c US$/bbl 113.6 101.6 59.3 66.3 11.9
2012–13 2013–14 2014–15 f 2015–16 f % change Australia Crude oil and condensate Production b kbd 366 352 353 363 3.1 Export volume b kbd 272 255 291 301 3.3 – nominal value A$m 10 447 11 115 9 295 8 768 –5.7 – real value d A$m 11 006 11 415 9 295 8 554 –8.0 Imports b kbd 516 488 422 336 –20.3 LPG Production be kbd 61 66 71 71 0.2 Export volume b kbd 41 42 44 44 0.0 – nominal value A$m 1 088 1 265 956 942 –1.4 – real value d A$m 1 146 1 299 956 919 –3.8 Petroleum products Refinery production b kbd 636 589 515 389 –24.4 Exports bg kbd 16 11 11 10 –1.6 Imports b kbd 408 423 508 667 31.5 Consumption bh kbd 947 947 956 988 3.4

Gold Gayathiri Bragatheswaran
Positive economic data from the US continues to support the case for the US Federal Reserve to increase interest rates. This is expected to result in lower gold prices and more than offset any uncertainty in financial markets regarding the potential Greek exit from the Eurozone and rising physical demand for gold in emerging economies.
Prices In 2015 the average gold price is forecast to decrease 4.8 per cent compared to 2014 to US$1205 an ounce. While US interest rates remain unchanged so far in 2015 the flow of positive economic data continues to support expectations for a rate increase in the near term. These expectations as well as better returns on other asset classes are more than offsetting the market concerns over the potential Greek exit from the EU and impact of rising physical gold demand.
In 2016 the average gold price is forecast to decrease a further 1.1 per cent to US$1193 an ounce based on the expectation that the US Federal Reserve starts raising interest rates. While in the medium term physical gold demand is likely to support higher prices, in the short term (over 2016) the effect of increasing physical demand for gold as incomes rise in developing countries such as China and India is likely to be outweighed by the impact of rising US interest rates.
Consumption World gold consumption is forecast to increase 0.8 per cent to 2868 tonnes in 2015 relative to 2014. This increase in consumption is expected to be supported by higher jewellery purchases in emerging economies. According to the World Gold Council, jewellery
industry.gov.au Resources and Energy Quarterly, June 2015 43
400
800
1200
1600
2000
2000 2004 2008 2012 2016
2015 US$/oz
Figure 8.1: Quarterly gold prices
Source: LBMA.
purchases accounted for 58 per cent of world gold consumption in 2014, similar to 2013 when jewellery purchases accounted for 60 per cent of gold consumption.
Increased consumer confidence in India as a result of the Modi Government’s continued economic reforms are likely to boost domestic gold jewellery demand in 2015 and are being supported by lower gold prices. Gold consumption in China is also expected to remain at high levels as low gold prices are expected to lead jewellery consumers to increase purchases.
Between 2009 to 2014 investment in total bar and coin has increased at an average rate of 9 per cent. However in 2014 total investment dropped a substantial 41 per cent to 1004 tonnes relative to 2013. Large drops were registered in all major gold consuming countries, including China (57 per cent decline) and India (43 per cent decline). Total bar and coin consumption is forecast to continue to decline in 2015 as an expected increase in US interest rates and higher returns on equity assets as well as the allure of low risk higher return bond assets keep investors away from gold.

In 2016 world gold consumption is forecast to increase a further 2.8 per cent to 2947 tonnes. This forecast increase is underpinned by higher jewellery consumption in response to lower gold prices and an increase in purchases of gold bullion by Central Banks, particularly those in emerging economies that are aiming to diversify their asset holdings. However, private bullion investment is expected to be lower in response to lower prices, low inflation and better returns on other low risk assets.
Production World gold mine production is forecast to increase 1.0 per cent to 3147 tonnes in 2015, relative to 2014. Production at Goldcorp’s Eleonore mine in Northern Quebec is expected to ramp up production in 2015, with annual production of 8 tonnes, new mines in Kazakhstan are also expected to come online in 2015, boosting production.
In 2015 gold production in China is forecast to increase around 4.4 per cent to 470 tonnes, lower than the previous five year (2009-2014) average growth of around 8 per cent. With domestic consumption in China forecast to increase and domestic ore grades expected to continue to decline, China’s gold producers are seeking partnerships with global producers. Zijin Mining Group, China’s largest gold producer, in May announced a strategic partnership and 50 per cent equity stake with Barrick Gold Corporation involving the Porgera joint venture mine in Papua New Guinea. Porgera is Papua New Guinea’s second largest producing gold mine with production expected to reach up to 550 000 ounces in 2015.
In 2016 world gold production is forecast to increase to 3158 tonnes. Growth in mine production is forecast to slow to 0.3 per cent from 2015 to 2016. This increase is lower than the growth rate over the previous five years (2009-2014) of 4.4 per cent, reflective of lower gold prices affecting producers’ willingness to explore and develop projects.
150
300
450
600
750
900
UK &Italy
Russia Turkey US MiddleEast
Rest ofWorld
India Chinatonnes
2008 2014
Source: World Gold Council.
Figure 8.2: Gold jewellery consumption
industry.gov.au Resources and Energy Quarterly, June 2015 44
50
100
150
200
250
300
350
400
450
US Turkey Thailand Germany India China
tonnes
2012 2013 2014Source: World Gold Council.
Figure 8.3: Gold bar and coin purchases

However, mines expected to come online in 2016 include Asanko Gold, and Chesapeake Gold Corporations’ Metates mine (one of the largest undeveloped gold and silver projects in the world) located in Mexico. Production at Asanko is expected to be around 5 tonnes in 2016 before doubling to 10 tonnes a year after phase two of the project is complete. Production at Metates is expected to start at around 9 tonnes in 2016 and will be minimally offset by expected closures of small mines including the Lapa mine in Canada and Kettle River-Buckhom in the US.
Australia
Exploration
Despite a rebound in the Australian dollar price of gold over the past year, Australia’s gold exploration expenditure in the March quarter 2015 continued to decline and totalled $91.5 million. This was 10 per cent lower than December quarter 2014. While a number of gold mines have changed ownership, most producers remain focused on reducing costs and improving production at existing sites.
Production
Australia’s gold production in 2014-15 is estimated to have declined 0.9 per cent relative to 2013-14 to 272 tonnes. Production remained steady with moves to reduce costs and a more favourable exchange rate supporting industry profits against a backdrop of lower gold prices. While interest in exploration is decreasing, the rise in mid-tier gold producers in Australia such as Evolution Mining is evident through their recently announced plan to acquire Barrick Gold’s Cowal mine, one of Australia’s largest producing mines.
Gold production in 2015-16 is forecast to remain relatively flat compared to 2014-15, increasing a moderate 1.5 per cent to 276 tonnes. The forecast increase reflects new projects such as Doray Minerals Deflector mine, and Black Oak Minerals’ Marda mine, expected to come online towards the end of 2015-16 as well as the redevelopment of Metal X’s Central Murchison mine, expected to come online in the first half of 2015-16.
industry.gov.au Resources and Energy Quarterly, June 2015 45
400
800
1200
1600
2000
50
100
150
200
250
Dec-09 Mar-11 Jun-12 Sep-13 Dec-14
US$ /oz A$m
Figure 8.4: Australia’s gold exploration
Exploration expenditure Gold price (rhs)Sources: Bloomberg, ABS.
4
8
12
16
20
100
200
300
400
500
1999-00 2004-05 2009-10 2014-15
2014-15 A$m tonnes
Figure 8.5: Australia’s gold exports
Volume Value (rhs)Source: ABS.
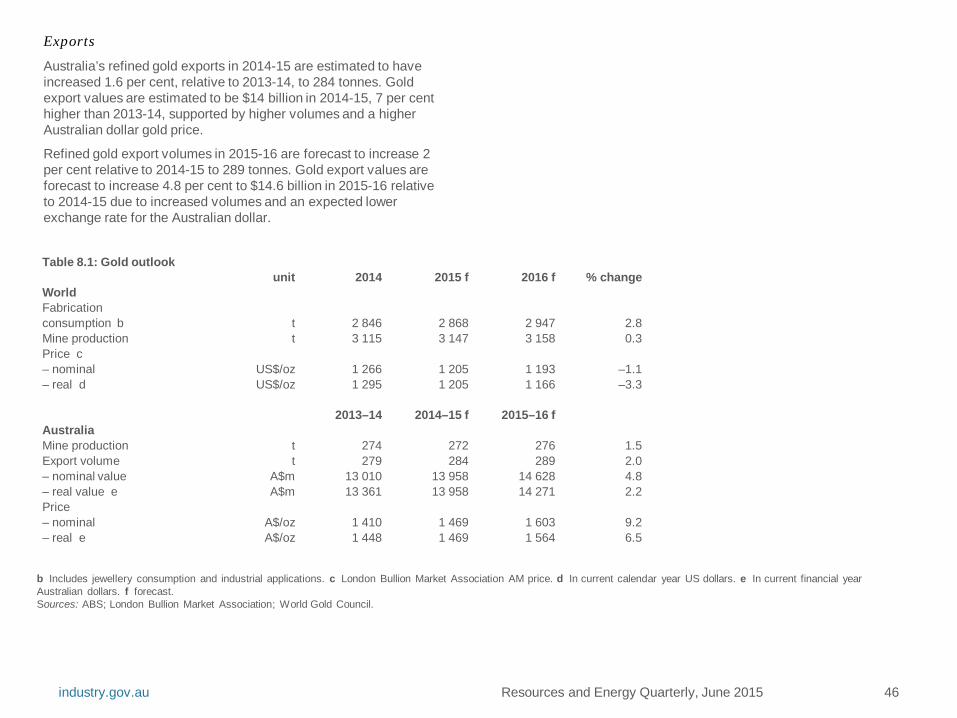
industry.gov.au Resources and Energy Quarterly, June 2015 46
Exports
Australia’s refined gold exports in 2014-15 are estimated to have increased 1.6 per cent, relative to 2013-14, to 284 tonnes. Gold export values are estimated to be $14 billion in 2014-15, 7 per cent higher than 2013-14, supported by higher volumes and a higher Australian dollar gold price.
Refined gold export volumes in 2015-16 are forecast to increase 2 per cent relative to 2014-15 to 289 tonnes. Gold export values are forecast to increase 4.8 per cent to $14.6 billion in 2015-16 relative to 2014-15 due to increased volumes and an expected lower exchange rate for the Australian dollar.
Table 8.1: Gold outlook unit 2014 2015 f 2016 f % change
World Fabrication consumption b t 2 846 2 868 2 947 2.8 Mine production t 3 115 3 147 3 158 0.3 Price c – nominal US$/oz 1 266 1 205 1 193 –1.1 – real d US$/oz 1 295 1 205 1 166 –3.3
2013–14 2014–15 f 2015–16 f Australia Mine production t 274 272 276 1.5 Export volume t 279 284 289 2.0 – nominal value A$m 13 010 13 958 14 628 4.8 – real value e A$m 13 361 13 958 14 271 2.2 Price – nominal A$/oz 1 410 1 469 1 603 9.2 – real e A$/oz 1 448 1 469 1 564 6.5
b Includes jewellery consumption and industrial applications. c London Bullion Market Association AM price. d In current calendar year US dollars. e In current financial year Australian dollars. f forecast. Sources: ABS; London Bullion Market Association; World Gold Council.
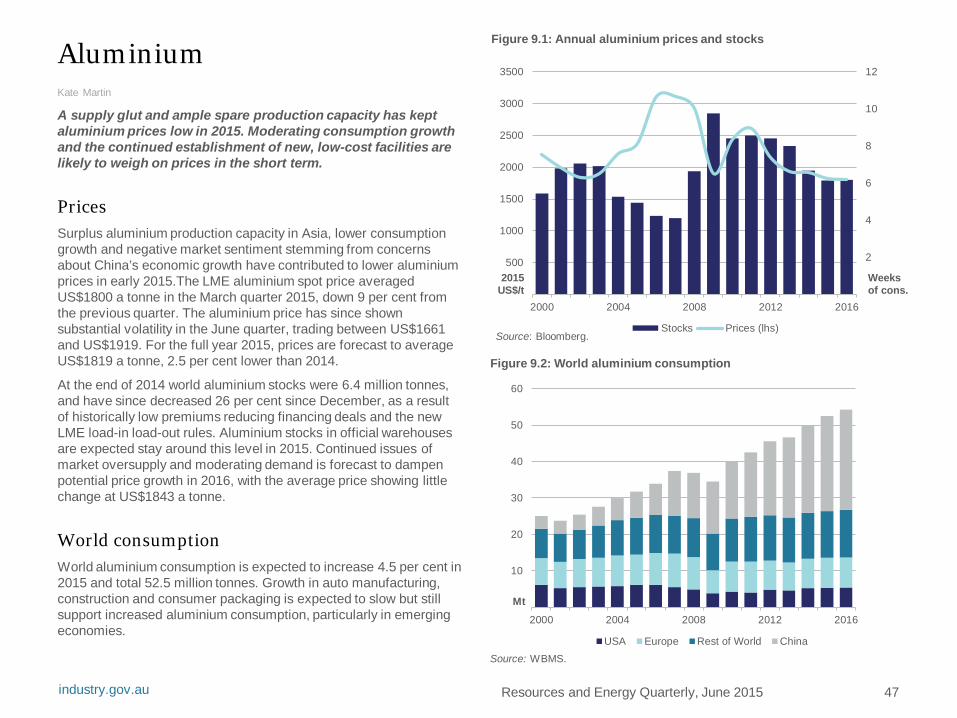
Aluminium Kate Martin
A supply glut and ample spare production capacity has kept aluminium prices low in 2015. Moderating consumption growth and the continued establishment of new, low-cost facilities are likely to weigh on prices in the short term.
Prices Surplus aluminium production capacity in Asia, lower consumption growth and negative market sentiment stemming from concerns about China’s economic growth have contributed to lower aluminium prices in early 2015.The LME aluminium spot price averaged US$1800 a tonne in the March quarter 2015, down 9 per cent from the previous quarter. The aluminium price has since shown substantial volatility in the June quarter, trading between US$1661 and US$1919. For the full year 2015, prices are forecast to average US$1819 a tonne, 2.5 per cent lower than 2014.
At the end of 2014 world aluminium stocks were 6.4 million tonnes, and have since decreased 26 per cent since December, as a result of historically low premiums reducing financing deals and the new LME load-in load-out rules. Aluminium stocks in official warehouses are expected stay around this level in 2015. Continued issues of market oversupply and moderating demand is forecast to dampen potential price growth in 2016, with the average price showing little change at US$1843 a tonne.
World consumption World aluminium consumption is expected to increase 4.5 per cent in 2015 and total 52.5 million tonnes. Growth in auto manufacturing, construction and consumer packaging is expected to slow but still support increased aluminium consumption, particularly in emerging economies.
2
4
6
8
10
12
500
1000
1500
2000
2500
3000
3500
2000 2004 2008 2012 2016
Weeks of cons.
2015 US$/t
Figure 9.1: Annual aluminium prices and stocks
Stocks Prices (lhs)Source: Bloomberg.
10
20
30
40
50
60
2000 2004 2008 2012 2016
Mt
Figure 9.2: World aluminium consumption
USA Europe Rest of World ChinaSource: WBMS.
industry.gov.au Resources and Energy Quarterly, June 2015 47
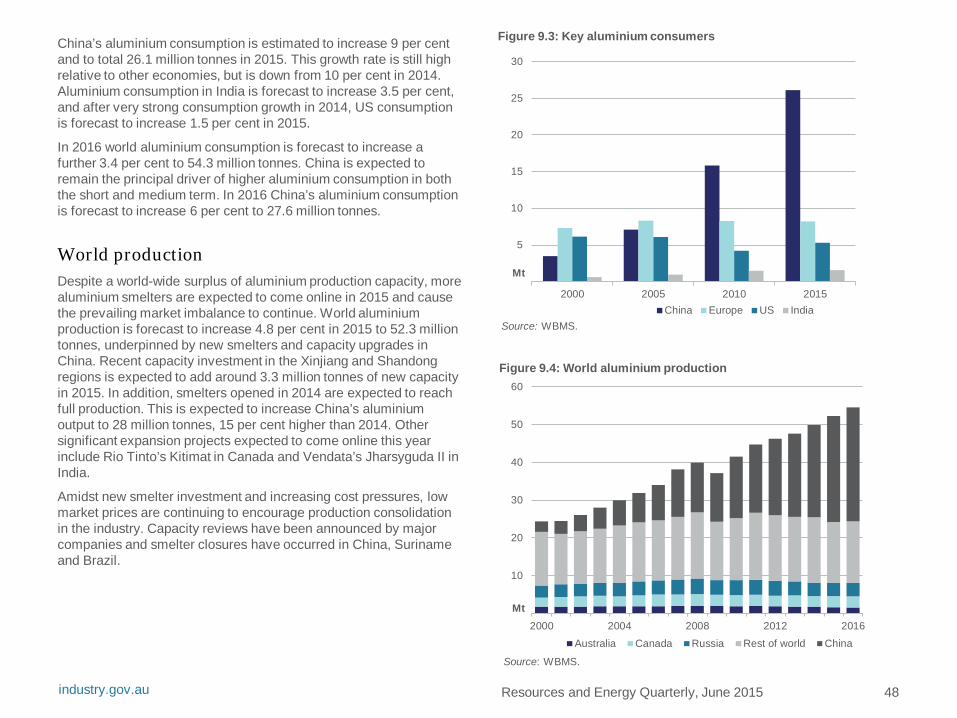
China’s aluminium consumption is estimated to increase 9 per cent and to total 26.1 million tonnes in 2015. This growth rate is still high relative to other economies, but is down from 10 per cent in 2014. Aluminium consumption in India is forecast to increase 3.5 per cent, and after very strong consumption growth in 2014, US consumption is forecast to increase 1.5 per cent in 2015.
In 2016 world aluminium consumption is forecast to increase a further 3.4 per cent to 54.3 million tonnes. China is expected to remain the principal driver of higher aluminium consumption in both the short and medium term. In 2016 China’s aluminium consumption is forecast to increase 6 per cent to 27.6 million tonnes.
World production Despite a world-wide surplus of aluminium production capacity, more aluminium smelters are expected to come online in 2015 and cause the prevailing market imbalance to continue. World aluminium production is forecast to increase 4.8 per cent in 2015 to 52.3 million tonnes, underpinned by new smelters and capacity upgrades in China. Recent capacity investment in the Xinjiang and Shandong regions is expected to add around 3.3 million tonnes of new capacity in 2015. In addition, smelters opened in 2014 are expected to reach full production. This is expected to increase China’s aluminium output to 28 million tonnes, 15 per cent higher than 2014. Other significant expansion projects expected to come online this year include Rio Tinto’s Kitimat in Canada and Vendata’s Jharsyguda II in India.
Amidst new smelter investment and increasing cost pressures, low market prices are continuing to encourage production consolidation in the industry. Capacity reviews have been announced by major companies and smelter closures have occurred in China, Suriname and Brazil.
10
20
30
40
50
60
2000 2004 2008 2012 2016
Mt
Figure 9.4: World aluminium production
Australia Canada Russia Rest of world China
Source: WBMS.
5
10
15
20
25
30
2000 2005 2010 2015
Mt
Figure 9.3: Key aluminium consumers
China Europe US IndiaSource: WBMS.
Resources and Energy Quarterly, June 2015 48 industry.gov.au

In 2016 world aluminium production is forecast to increase 4.3 per cent to 54.5 million tonnes, with China’s production expanding by an expected 7.5 per cent.
Australia’s production and exports Australia’s production of aluminium in 2014-15 is estimated to be 1.6 million tonnes, 8 per cent lower than 2013-14, due to the closure of Alcoa’s Point Henry smelter in August 2014. Production at other domestic smelters is likely to remain at current levels, with confirmed electricity supply arrangements supporting ongoing production. Production in 2015-16 is forecast to remain broadly unchanged at 1.6 million tonnes.
In 2014-15 aluminium exports are estimated to be 1.4 million tonnes, 12 per cent lower than 2013-14, resulting from lower domestic production. Export values are estimated to be $3.6 billion, 4.4 per cent higher than the previous year, as a result of the lower exchange rate underpinning a higher Australian dollar price. Aluminium exports are forecast to remain at around 1.4 million tonnes in 2015-16 but with export values decreasing 6 per cent to $3.4 billion due to lower aluminium prices.
Alumina Prices In 2015 the alumina spot price is forecast to increase by 3.6 per cent compared to 2014, to average US$343 a tonne. After dropping in the March quarter 2015, alumina prices have shown some recovery, although lacklustre demand in China, where supply has increased and smelter costs have declined, is expected to contribute to moderated price growth for the remainder of the year. Alumina prices are forecast to increase slightly in 2016, averaging US$348 a tonne for the year.
2
4
6
8
0.5
1
1.5
2
1999-00 2003-04 2007-08 2011-12 2015-16
Mt
Figure 9.5: Australia’s aluminium exports
Volume (lhs) Value (rhs)
2014-15 A$b
Source: ABS.
150
300
450
600
750
2000 2004 2008 2012 2016
2015 US$/t
Figure 9.6: World alumina price
Source: Bloomberg.
Resources and Energy Quarterly, June 2015 49 industry.gov.au

Australia In 2014-15 Australia’s alumina production is estimated to be 20 million tonnes, almost 8 per cent lower than 2013-14. This was due to the closure of Rio Tinto’s Gove refinery in May 2014. This more than offset marginally higher production at the remaining domestic alumina producers. Alumina production is forecast to increase by 2.5 per cent in 2015-16 to 20.5 million tonnes, as capacity constraints are addressed.
As a result of lower domestic production, alumina exports are estimated to have dropped 9 per cent in 2014-15 and to have totalled 17 million tonnes. Export values are estimated to have increased around 12 per cent to $6.4 billion with the more favourable Australian dollar exchange rate supporting higher prices for domestic exporters. In 2015-16 Australia’s alumina export volumes are forecast to increase 2.1 per cent to 17.4 million tonnes reflecting marginally higher production. Export values are forecast to increase 18 per cent to $7.5 billion, supported by a lower Australian dollar and forecast higher alumina prices.
Bauxite Australia’s bauxite exports are estimated to have increased 31 per cent in 2014-15 to 19.9 million tonnes, as mine production increased in an environment of lower domestic demand. Export values are estimated to have increased 59 per cent to $866 million in 2014-15, supported by a depreciating Australian dollar. Production ramp-ups at Rio Tinto’s Weipa and Gove mines are expected to support higher production going forward.
In 2015-16 bauxite exports are forecast to be 21.4 million tonnes, 8 per cent higher than 2014-15, with export values forecast to remain around 2014-15 levels.
200
400
600
800
1000
1200
4
8
12
16
20
24
1999-00 2003-04 2007-08 2011-12 2015-16
2014-15 A$m Mt
Figure 9.8: Australia’s bauxite exports
Volume Value (rhs)Source: ABS.
4
8
12
16
20
1999-00 2003-04 2007-08 2011-12 2015-16
2
4
6
8
10
Mt
Figure 9.7: Australia’s alumina exports
Volume (rhs) Value (lhs)
2014-15 A$b
Source: ABS.
Resources and Energy Quarterly, June 2015 50 industry.gov.au

Table 9.1: Aluminium, alumina and bauxite outlook
unit 2014 2015 f 2016 f % change World Primary aluminium Production kt 49 862 52 262 54 532 4.3 Consumption kt 50 218 52 497 54 272 3.4 Closing stocks b kt 6 428 6 193 6 452 4.2 – weeks of consumption 6.7 6.1 6.2 0.8 Prices World aluminium c – nominal US$/t 1 866 1 819 1 843 1.3 – real d US$/t 84.7 82.5 83.6 1.3 Alumina spot – nominal US$/t 331 343 348 1.5 – real d US$/t 338 343 340 –0.8
2013–14 2014–15 f 2015-16 f Australia Production Primary aluminium kt 1 773 1 635 1 596 –2.4 Alumina kt 21 532 19 905 20 408 2.5 Bauxite Mt 80.3 80.2 81.8 2.0 Consumption Primary aluminium kt 197 239 167 –30.2 Exports Primary aluminium kt 1 576 1 385 1 352 –2.4 – nominal value A$m 3 479 3 632 3 422 –5.8 – real value e A$m 3 573 3 632 3 339 –8.1 Alumina kt 18 614 17 025 17 376 2.1 – nominal value A$m 5 711 6 387 7 516 17.7 – real value e A$m 5 865 6 387 7 332 14.8 Bauxite kt 15 146 19 915 21 411 7.5 – nominal value A$m 546 866 869 0.4 – real value e A$m 561 866 848 –2.0 Total value – nominal A$m 9 737 10 884 11 807 8.5 – real e A$m 9 999 10 884 11 519 5.8
b Producer and LME stocks. c LME cash prices for primary aluminium. d In current calendar year US dollars. e In current financial year Australian dollars. f forecast. Sources: ABS; LME; World Bureau of Metal Statistics.
Resources and Energy Quarterly, June 2015 51 industry.gov.au

Copper Gayathiri Bragatheswaran
An estimated 90 per cent increase in LME copper stocks over the past 12 months and growing concerns about China’s consumption have pushed copper prices lower.
Prices In 2015 the average LME copper price is forecast to decline 14 per cent to US$5905 a tonne, underpinned by a market surplus and growing stocks. Global production downgrades in large copper producing regions such as Chile have caused speculation about the magnitude of the expected market surplus; however, slowing global demand growth from key consumers such as China is expected to limit the size of the supply overhang. LME copper inventories have reflected this changing market balance and are up 82 per cent in the twelve months to May 2015 to 311 000 tonnes.
Copper prices are forecast to decline a further 1.2 percent in 2016 and to average US$5831 a tonne. Robust mined and refined copper output in 2016 combined with slowing consumption growth, particularly in China, is expected to result in an increase in stock levels and lower prices. However, the ongoing risk of supply disruptions at key mines could result in upward pressure on prices.
Consumption World copper consumption in 2015 is forecast to increase 4.4 per cent relative to 2014 to 23.8 million tonnes. This forecast increase in consumption is underpinned by increasing fixed asset investment in highly populated emerging economies such as India and China. China’s copper consumption growth has averaged 15 per cent over the past five years (2009-2014) but is expected to slow. China’s copper consumption is forecast to continue to grow in 2015, albeit at a lower rate of 7 per cent, significantly lower than the 16 per cent growth in 2014.
industry.gov.au Resources and Energy Quarterly, June 2015 52
2000
4000
6000
8000
10000
12000
2000 2002 2004 2006 2008 2010 2012 2014US$/t
Monthly LME spot 6 month moving averageSources: LME; Bloomberg.
Figure 10.1: Monthly LME copper price
1.5
3
4.5
6
7.5
2000
4000
6000
8000
10000
2000 2002 2004 2006 2008 2010 2012 2014 2016
2015 US$/t
Stocks (rhs) Price (lhs)
Sources: Bloomberg.
Figure 10.2: Annual copper prices and stocks
Weeks of cons.

Investment in sectors that utilise large amounts of copper, such as the utilities and housing construction sectors is expected to support higher copper consumption. Copper consumption in India is forecast to increase 24 per cent in 2015 relative to 2014 and total 537 000 tonnes. Government policies supporting copper intensive investment are expected to provide stronger support for growth in consumption in the medium term but have a lesser impact in 2015. In most advanced economies, lower economic growth rates are expected to keep copper consumption at similar levels to 2014.
In 2016, world copper consumption is forecast to increase 5 per cent relative to 2015 to nearly 25 million tonnes. Moderating GDP growth in China is expected to result in lower growth in copper consumption. Growth in world copper consumption will still be supported by higher consumption in other emerging economies, such as India and ASEAN countries. However, this growth is not expected to sustain the historically high levels recorded in the last few years.
Production
Mined
Despite declining ore grades as well as heavy rains and mudslides in Chile, the world’s largest copper producing nation, world copper production is forecast to increase 4.5 per cent to 19.3 million tonnes in 2015. Copper production in Chile is expected to decline in 2015 because of unplanned and planned stoppages in production such as a scheduled maintenance shutdown at Glencore’s Collahuasi mine, causing a 9 per cent decline in its production relative to the March quarter 2014.
Although impacted by bad weather conditions in the March quarter, Escondida, the world’s largest producing copper mine in Chile is expected to increase production in 2015 underpinned by good operating performance and an increase in truck utilisation resulting in more material mined. Any declines in production in Chile are expected to be more than offset by increases in production in a number of other countries including Russia and the Democratic Republic of Congo.
industry.gov.au Resources and Energy Quarterly, June 2015 53
2000
4000
6000
8000
10000
12000
14000
2000 2004 2008 2012 2016
Figure 10.3: China's copper consumption
Sources: WBMS.
kt
World copper mine production in 2016 is forecast to increase a further 1.7 per cent to 19.7 million tonnes. Improved productivity across most copper mines and production from several new projects will support this forecast increase. MMG’s Las Bambas mine is expected to begin production in 2016 and become a significant supplier to world markets. The Las Bambas mine is expected to become one of the largest copper mines in Peru with ore reserves of 6.9 million tonnes of copper at an ore grade of 0.73 per cent copper.
Refined
World refined copper production is forecast to increase by 4.5 per cent to 24 million tonnes in 2015. Increasing refined production at the majority of refineries across the world, particularly China, with a forecast 13 per cent increase in refined production in 2015, are expected to keep total refined production up for the year. With China accounting for around 35 per cent of world refined copper production its ongoing surplus of underutilised capacity is likely to have a stronger impact on copper markets in the short term.
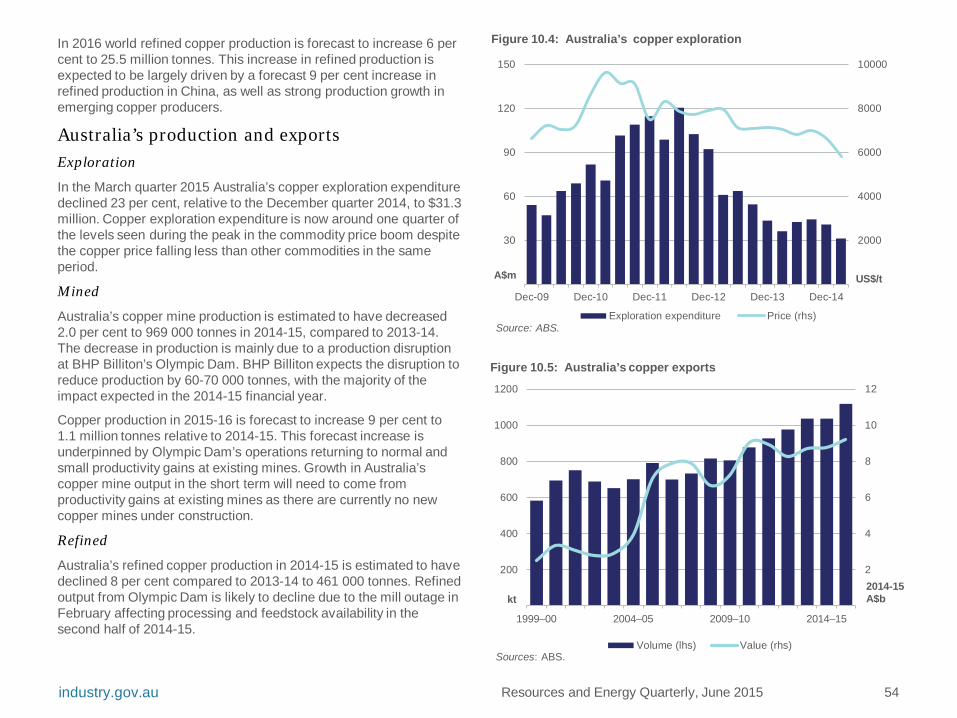
In 2016 world refined copper production is forecast to increase 6 per cent to 25.5 million tonnes. This increase in refined production is expected to be largely driven by a forecast 9 per cent increase in refined production in China, as well as strong production growth in emerging copper producers.
Australia’s production and exports Exploration
In the March quarter 2015 Australia’s copper exploration expenditure declined 23 per cent, relative to the December quarter 2014, to $31.3 million. Copper exploration expenditure is now around one quarter of the levels seen during the peak in the commodity price boom despite the copper price falling less than other commodities in the same period.
Mined
Australia’s copper mine production is estimated to have decreased 2.0 per cent to 969 000 tonnes in 2014-15, compared to 2013-14. The decrease in production is mainly due to a production disruption at BHP Billiton’s Olympic Dam. BHP Billiton expects the disruption to reduce production by 60-70 000 tonnes, with the majority of the impact expected in the 2014-15 financial year.
Copper production in 2015-16 is forecast to increase 9 per cent to 1.1 million tonnes relative to 2014-15. This forecast increase is underpinned by Olympic Dam’s operations returning to normal and small productivity gains at existing mines. Growth in Australia’s copper mine output in the short term will need to come from productivity gains at existing mines as there are currently no new copper mines under construction.
Refined
Australia’s refined copper production in 2014-15 is estimated to have declined 8 per cent compared to 2013-14 to 461 000 tonnes. Refined output from Olympic Dam is likely to decline due to the mill outage in February affecting processing and feedstock availability in the second half of 2014-15.
industry.gov.au Resources and Energy Quarterly, June 2015 54
2000
4000
6000
8000
10000
30
60
90
120
150
Dec-09 Dec-10 Dec-11 Dec-12 Dec-13 Dec-14
Figure 10.4: Australia’s copper exploration
Exploration expenditure Price (rhs)
A$m US$/t
Source: ABS.
2
4
6
8
10
12
200
400
600
800
1000
1200
1999–00 2004–05 2009–10 2014–15
2014-15 A$b
Figure 10.5: Australia’s copper exports
Volume (lhs) Value (rhs)
kt
Sources: ABS.
Refined copper production in 2015-16 is forecast to increase 5 per cent to 486 000 tonnes. The return to normal output at Olympic Dam following repairs to the mill is expected to increase production.
Exports
Australia’s total copper metal content exports in 2014-15 are estimated to remain similar to the previous year at 1 million tonnes. Export values are estimated to increase 0.7 per cent to $8.8 billion due to lower exchange rate more than offsetting the effect of the decline in copper prices.
In 2015-16 copper exports are forecast to increase 8 per cent to 1.1 million tonnes (metal content). Increased domestic production will support higher export volumes, and export values are forecast to increase 8 per cent to $9.4 billion reflecting a forecast higher Australian dollar price in 2016.
industry.gov.au Resources and Energy Quarterly, June 2015 55

b In current calendar year US dollars. c Quantities refer to gross weight of all ores and concentrates. d In current financial year Australian dollars. f forecast. Sources: ABS; International Copper Study Group; LME; World Bureau of Metal Statistics.
Table 10.1: Copper outlook
unit 2014 2015 f 2016 f % change World Production – mine kt 18 502 19 338 19 670 1.7 – refined kt 23 011 24 048 25 453 5.8 Consumption kt 22 774 23 785 24 970 5.0 Closing stocks kt 725 988 1 471 48.9 – weeks of consumption 1.7 2.2 3.1 41.9 Price LME – nominal US$/t 6 863 5 905 5 831 –1.2
USc/lb 311 268 265 –1.2 – real b US$/t 7 021 5 905 5 700 –3.5
USc/lb 318 268 259 –3.5
2013–14 2014–15 f 2015–16 f Australia Mine output kt 988 969 1 057 9.2 Refined output kt 500 461 486 5.4 Exports – ores and conc. c kt 2 122 2 109 2 399 13.8 – refined kt 456 442 446 1.0 Export value – nominal A$m 8 707 8 765 9 442 7.7 – real d A$m 8 942 8 765 9 212 5.1
industry.gov.au Resources and Energy Quarterly, June 2015 56

Nickel Ben Witteveen and Thomas Redmond
Nickel prices have fallen in 2015 against most market expectations. LME nickel stocks are at high levels which has alleviated concerns over supply availability in the wake of the Indonesian ban on exports of unprocessed ore.
Prices The average LME nickel price decreased 9 per cent in the March quarter 2015, relative to the previous quarter, to US$14 338. Nickel prices have continued to fall since then and reached a six year low of US$12 260 a tonne in mid-April. The price rebounded 3.4 per cent to US$12 675 a tonne by the end of May but elevated LME warehouse stocks are placing downward pressure on prices. However, the recent increase in LME warehouse stocks has not been universal, with stocks at the warehouses in South Korea and Chinese Taipei declining.
For the full year 2015 the LME spot price is forecast to average US$13 667 a tonne, down 19 per cent from 2014, as high stocks and lower consumption growth weigh on prices. While stocks are forecast to fall from April’s record high they are expected to remain historically high through most of 2015. Prices are forecast to increase 4.3 per cent in 2016 to average US$14 250 supported by falling stocks.
World Consumption In 2015 world nickel consumption is forecast to increase 3.1 per cent to 1.9 million tonnes and a further 3.5 per cent in 2016 to 2 million tonnes. Growth in China’s stainless steel production is expected to support this growth.
Resources and Energy Quarterly, June 2015 57
5000
10000
15000
20000
25000
30000
Dec 10 Jun 11 Dec 11 Jun 12 Dec 12 Jun 13 Dec 13 Jun 14 Dec 14 Jun 15
Figure 11.1: Nickel daily prices
Nickel LME 90 day moving average
US$/t
Source: Bloomberg.
3
6
9
12
15
10000
20000
30000
40000
50000
1999 2003 2007 2011 2015
Weeks of cons.
2015 US$/t
Figure 11.2: Nickel prices and stocks
stocks (rhs) price
Source: LME.
industry.gov.au
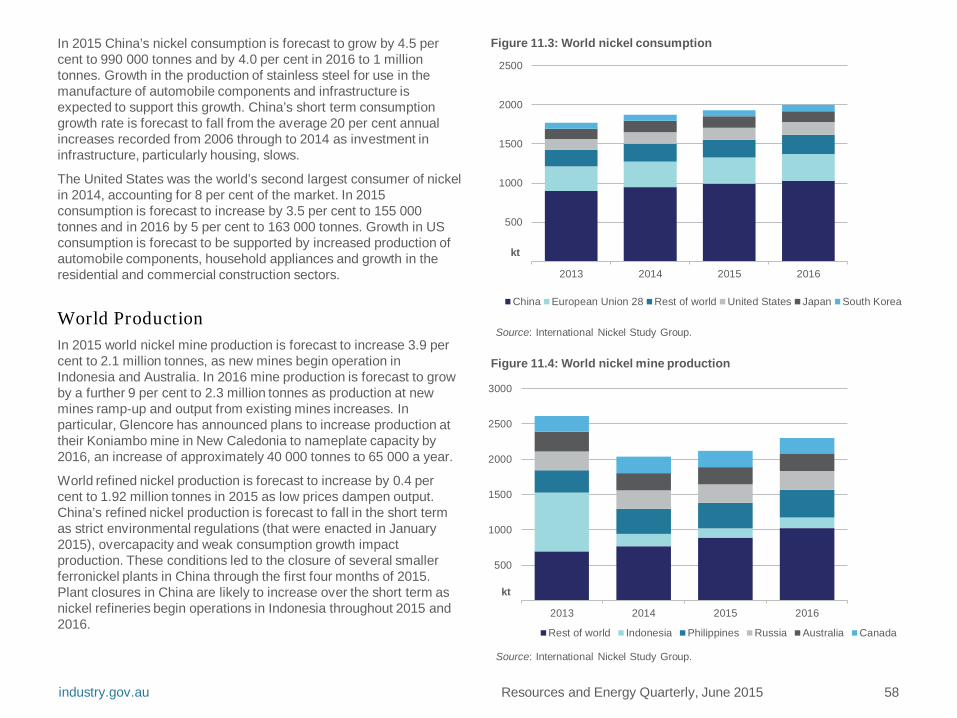
Resources and Energy Quarterly, June 2015 58
In 2015 China’s nickel consumption is forecast to grow by 4.5 per cent to 990 000 tonnes and by 4.0 per cent in 2016 to 1 million tonnes. Growth in the production of stainless steel for use in the manufacture of automobile components and infrastructure is expected to support this growth. China’s short term consumption growth rate is forecast to fall from the average 20 per cent annual increases recorded from 2006 through to 2014 as investment in infrastructure, particularly housing, slows.
The United States was the world’s second largest consumer of nickel in 2014, accounting for 8 per cent of the market. In 2015 consumption is forecast to increase by 3.5 per cent to 155 000 tonnes and in 2016 by 5 per cent to 163 000 tonnes. Growth in US consumption is forecast to be supported by increased production of automobile components, household appliances and growth in the residential and commercial construction sectors.
World Production In 2015 world nickel mine production is forecast to increase 3.9 per cent to 2.1 million tonnes, as new mines begin operation in Indonesia and Australia. In 2016 mine production is forecast to grow by a further 9 per cent to 2.3 million tonnes as production at new mines ramp-up and output from existing mines increases. In particular, Glencore has announced plans to increase production at their Koniambo mine in New Caledonia to nameplate capacity by 2016, an increase of approximately 40 000 tonnes to 65 000 a year.
World refined nickel production is forecast to increase by 0.4 per cent to 1.92 million tonnes in 2015 as low prices dampen output. China’s refined nickel production is forecast to fall in the short term as strict environmental regulations (that were enacted in January 2015), overcapacity and weak consumption growth impact production. These conditions led to the closure of several smaller ferronickel plants in China through the first four months of 2015. Plant closures in China are likely to increase over the short term as nickel refineries begin operations in Indonesia throughout 2015 and 2016.
industry.gov.au
500
1000
1500
2000
2500
2013 2014 2015 2016
Figure 11.3: World nickel consumption
China European Union 28 Rest of world United States Japan South Korea
kt
Source: International Nickel Study Group.
500
1000
1500
2000
2500
3000
2013 2014 2015 2016
Figure 11.4: World nickel mine production
Rest of world Indonesia Philippines Russia Australia Canada
kt
Source: International Nickel Study Group.

The first shipment of refined nickel from an Indonesian refinery, constructed in the wake of the export ban on unprocessed ore, occurred in April 2015. This new refinery (Delapan) is a joint venture between Chinese companies Tsingshan and Bintang and at full capacity (planned for 2017) can produce 30 000 tonnes of refined nickel a year. This is just the first of several refineries in Indonesia that are due to begin operation in 2015 and 2016.
The opening of these refineries signals a potential shift of refined production from China to Indonesia. However, any transfer of refined production is unlikely to be smooth or quick. While Indonesian refineries have access to high quality, cheap laterite deposits of nickel they also need to build transport infrastructure in remote areas; a challenge that refineries in China do not face. As a result any transfer of production from China is likely to take several years. The start and ramp-up of operations at two Indonesian smelters in 2016 is forecast to increase world refined nickel production by 1.2 per cent to 1.94 million tonnes.
Australia
Exploration
Australia’s expenditure on nickel and cobalt exploration in the March quarter increased 16 per cent (year-on-year) to $19.5 million. This increase is anticipated to only be temporary as many producers have indicated in their quarterly reports that they are planning to cut costs in response to lower nickel prices.
Production
In 2014-15 Australia’s mined nickel production is estimated to have decreased 7 per cent (year-on-year) to 242 000 tonnes, following production curtailments at several mine sites and the suspension of operations at the Perseverance mine. BHP Billiton permanently shut the Perseverance mine following a suspension of operations due to safety concerns in late 2013.
Resources and Energy Quarterly, June 2015 59 industry.gov.au
50
100
150
200
250
300
2005 2007 2009 2011 2013 2015
Figure 11.6: Australia nickel mine production
WA QLD TAS
Source: ABS.
kt
5000
10000
15000
20000
25000
30000
15
30
45
60
75
90
Mar-10 Dec-10 Sep-11 Jun-12 Mar-13 Dec-13 Sep-14
Nickel exploration a Nickel price (rhs)a. Includes cobalt. Sources: ABS; LME.
A$m US$t
Figure 11.5: Australia nickel exploration expenditure
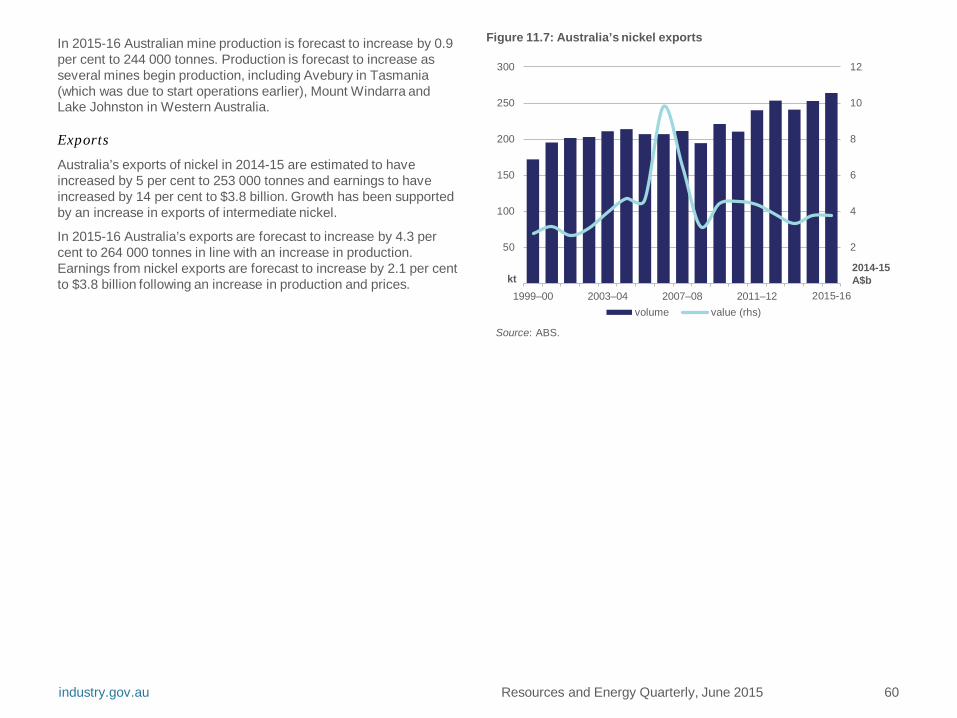
industry.gov.au Resources and Energy Quarterly, June 2015 60
In 2015-16 Australian mine production is forecast to increase by 0.9 per cent to 244 000 tonnes. Production is forecast to increase as several mines begin production, including Avebury in Tasmania (which was due to start operations earlier), Mount Windarra and Lake Johnston in Western Australia.
Exports
Australia’s exports of nickel in 2014-15 are estimated to have increased by 5 per cent to 253 000 tonnes and earnings to have increased by 14 per cent to $3.8 billion. Growth has been supported by an increase in exports of intermediate nickel.
In 2015-16 Australia’s exports are forecast to increase by 4.3 per cent to 264 000 tonnes in line with an increase in production. Earnings from nickel exports are forecast to increase by 2.1 per cent to $3.8 billion following an increase in production and prices.
2
4
6
8
10
12
50
100
150
200
250
300
1999–00 2003–04 2007–08 2011–12 2015-16volume value (rhs)
Source: ABS.
kt 2014-15 A$b
Figure 11.7: Australia’s nickel exports
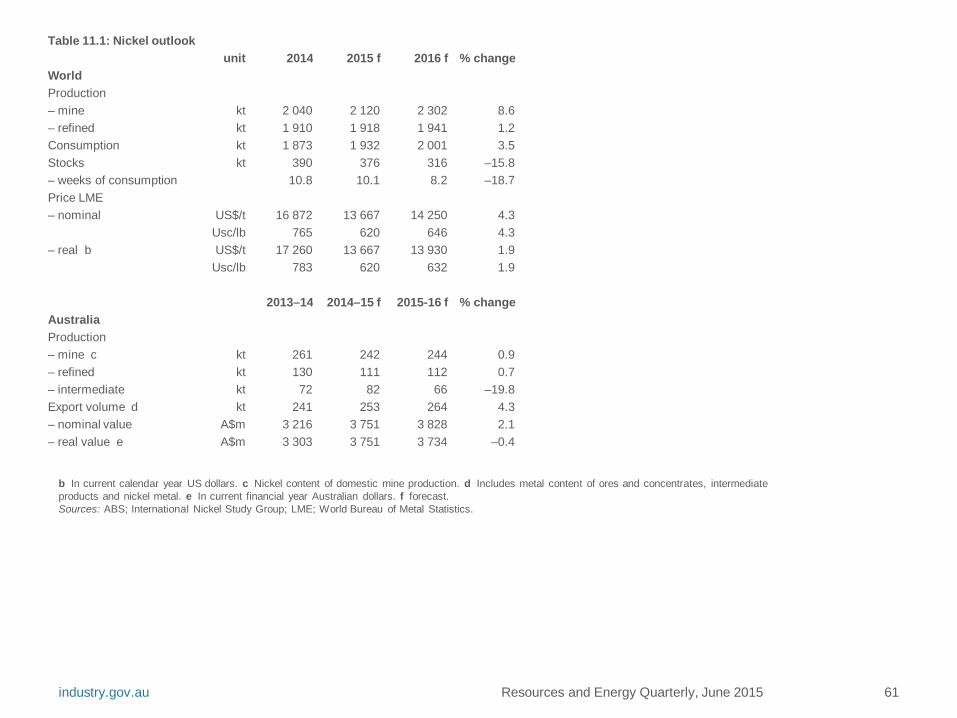
industry.gov.au Resources and Energy Quarterly, June 2015 61
Table 11.1: Nickel outlook unit 2014 2015 f 2016 f % change
World Production – mine kt 2 040 2 120 2 302 8.6 – refined kt 1 910 1 918 1 941 1.2 Consumption kt 1 873 1 932 2 001 3.5 Stocks kt 390 376 316 –15.8 – weeks of consumption 10.8 10.1 8.2 –18.7 Price LME – nominal US$/t 16 872 13 667 14 250 4.3
Usc/lb 765 620 646 4.3 – real b US$/t 17 260 13 667 13 930 1.9
Usc/lb 783 620 632 1.9
2013–14 2014–15 f 2015-16 f % change Australia Production – mine c kt 261 242 244 0.9 – refined kt 130 111 112 0.7 – intermediate kt 72 82 66 –19.8 Export volume d kt 241 253 264 4.3 – nominal value A$m 3 216 3 751 3 828 2.1 – real value e A$m 3 303 3 751 3 734 –0.4
b In current calendar year US dollars. c Nickel content of domestic mine production. d Includes metal content of ores and concentrates, intermediate products and nickel metal. e In current financial year Australian dollars. f forecast. Sources: ABS; International Nickel Study Group; LME; World Bureau of Metal Statistics.

Zinc Thomas Redmond
A small surplus emerged in zinc markets at the start of 2015. However declining stocks, growing consumption and reduced availability of mined zinc are expected to support higher zinc prices in the short term.
Prices LME zinc prices averaged US$2080 in the March quarter, up 2.4 per cent year-on-year based around expectations of supply tightness. Coinciding with this price increase, LME zinc stocks fell 30 per cent year-on-year in the March quarter to 511 000 tonnes. Despite these year-on-year price gains and stock movements the International Lead and Zinc Study Group estimated that monthly refined zinc production has exceeded consumption since December 2014.
For 2015 as a whole zinc prices are forecast to average US$2180, 1.0 per cent higher than 2014. Relatively tight supply of mined zinc as a result of large mine closures is expected to provide some price support; however the prevailing market surplus and spare production capacity are likely to limit the prospects of significantly higher prices. World zinc stocks (comprising metals exchange and reported privately held stocks) are forecast to decrease 23 per cent to the equivalent of 4.4 weeks of consumption.
Prices are forecast to increase by 6 per cent to average US$2303 in 2016 in response to tighter mined zinc supply and continued growth in zinc consumption. While new mining projects and expansions are being developed over 2015 and 2016, this is expected to be offset by the closure of existing capacity as projects reach the end of their economic life. Many new zinc mine projects are also targeting deposits that are deeper underground and are more complex and expensive to develop. World zinc stocks are forecast to decline to the equivalent of 3 weeks of consumption at the end of 2016 and provide further price support.
industry.gov.au Resources and Energy Quarterly, June 2015 62
1700
1900
2100
2300
2500
2700
Jun 10 Jun 11 Jun 12 Jun 13 Jun 14 Jun 15
Figure 12.1: Zinc daily price
LME spot price 90 day moving average
US$/t
Source: Bloomberg.
2
4
6
8
10
1000
2000
3000
4000
5000
1999 2003 2007 2011 2015
Figure 12.2: Annual zinc prices and stocks
stocks (rhs) price
2015 US$/t
Weeks of cons.
Source: LME, International Lead and Zinc Study Group.
Consumption In 2015 world refined zinc consumption is forecast to increase by 3.6 per cent to 14.3 million tonnes. This growth, albeit at a lower rate than previous years, will be underpinned by continued demand for galvanised steel in emerging Asian economies. In 2016, world zinc consumption is forecast to increase 2.7 per cent to 14.7 million tonnes. China is expected to remain the largest refined zinc consumer in 2016 and continue to drive growth in world zinc consumption.
Production
Mined
World mined zinc production increased by 2 per cent year-on-year in the March quarter to an estimated 3.1 million tonnes according to the International Lead and Zinc Study Group. Increased zinc production in Europe (up 11 per cent to 234 000 tonnes), as well as Canada (up 13 per cent to 80 200 tonnes), India (up 14 per cent to 204 900 tonnes), Peru (up 18 per cent to 291 100 tonnes) and Turkey (up 25 per cent to 40 100 tonnes) more than offset lower zinc production in China (down 8 per cent to 1.1 million tonnes) and Kazakhstan (down 19 per cent to 107 400 tonnes).
World mined zinc production is forecast to increase by 3.4 per cent in 2015 to 13.8 million tonnes, reflecting the continued increase in production from operations commissioned in Peru, the United States and China in 2014. Several zinc projects are also expected to be commissioned during 2015 in the United States, Russia and Canada.
India’s zinc output is also forecast to increase following capacity expansions at Vedanta Resources’ Sindesar Khurd mine (35 000 tonnes), Zawar mine (28 000 tonnes) and Rampura Agucha mine (70 000 tonnes). New capacity from these operations is expected to be partially offset by the closure of some major zinc mines later this year.
World mined zinc production is forecast to increase by 2.2 per cent to 14.1 million tonnes in 2016. In response to forecast higher zinc prices, many companies are expected to expand output through the completion of capacity expansions. However, this is expected to be partially offset by loss in production associated with the closure of large zinc mines such as MMG’s Century mine (490 000 tonnes a year) in Australia and Vedanta Resources’ Lisheen mine (120 000 tonnes) in Ireland.
Refined
In the March quarter 2015, world refined zinc production increased by 6 per cent year-on-year to an estimated 3.4 million tonnes according to the International Lead and Zinc Study Group. Lower refined zinc production in the United States (down 29 per cent to 40 000 tonnes), Russia (down 46 per cent to 131 700 tonnes) and parts of Africa (as a whole decreased 46 per cent to 20 700 tonnes) were more than offset by increased production in India (up 8 per cent to 208 100 tonnes) and China (up 16 per cent to 1.5 million tonnes), where much of the quarterly increase has been attributed to higher zinc smelter production rates.
World refined zinc production is forecast to increase by 4.9 per cent to 14 million tonnes in 2015. China is expected to remain the main driver of increased refined zinc supply as it continues to commission smelters. However, the zinc smelter production rates of the March quarter are not expected to be sustained over the whole year, and reduced zinc concentrate availability later in the year is expected to moderate refined production growth over the year.
In 2016, world refined zinc production is forecast to increase by 2.7 per cent to 14.3 million tonnes. The ramp-up of production from projects commissioned during 2015 is expected to contribute to continued production growth.
industry.gov.au Resources and Energy Quarterly, June 2015 63
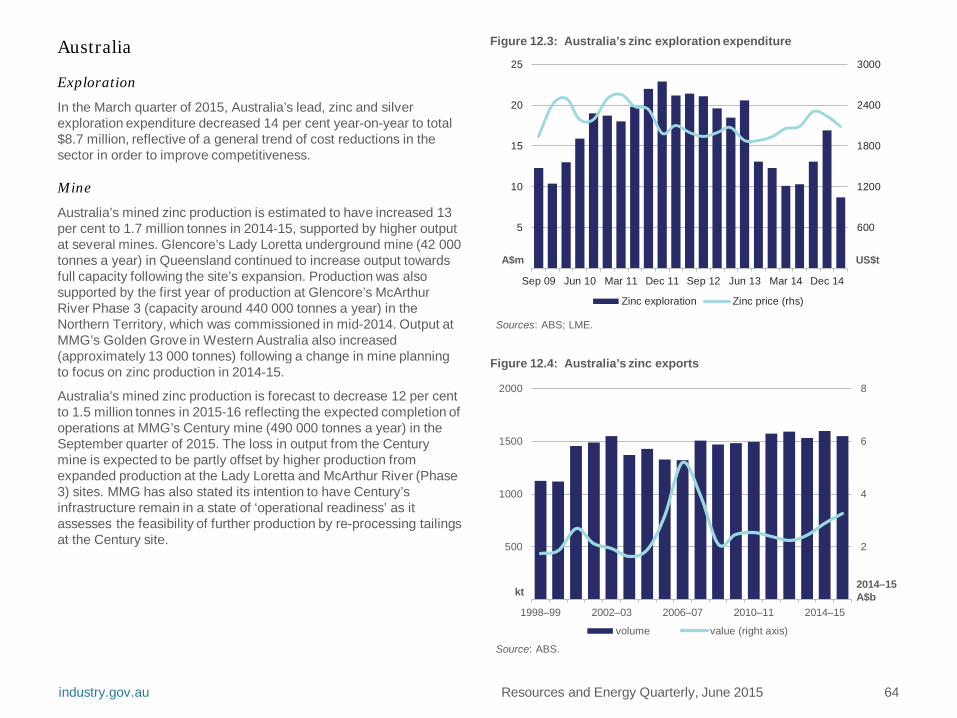
Australia
Exploration
In the March quarter of 2015, Australia’s lead, zinc and silver exploration expenditure decreased 14 per cent year-on-year to total $8.7 million, reflective of a general trend of cost reductions in the sector in order to improve competitiveness.
Mine
Australia’s mined zinc production is estimated to have increased 13 per cent to 1.7 million tonnes in 2014-15, supported by higher output at several mines. Glencore’s Lady Loretta underground mine (42 000 tonnes a year) in Queensland continued to increase output towards full capacity following the site’s expansion. Production was also supported by the first year of production at Glencore’s McArthur River Phase 3 (capacity around 440 000 tonnes a year) in the Northern Territory, which was commissioned in mid-2014. Output at MMG’s Golden Grove in Western Australia also increased (approximately 13 000 tonnes) following a change in mine planning to focus on zinc production in 2014-15.
Australia’s mined zinc production is forecast to decrease 12 per cent to 1.5 million tonnes in 2015-16 reflecting the expected completion of operations at MMG’s Century mine (490 000 tonnes a year) in the September quarter of 2015. The loss in output from the Century mine is expected to be partly offset by higher production from expanded production at the Lady Loretta and McArthur River (Phase 3) sites. MMG has also stated its intention to have Century’s infrastructure remain in a state of ‘operational readiness’ as it assesses the feasibility of further production by re-processing tailings at the Century site.
industry.gov.au Resources and Energy Quarterly, June 2015 64
600
1200
1800
2400
3000
5
10
15
20
25
Sep 09 Jun 10 Mar 11 Dec 11 Sep 12 Jun 13 Mar 14 Dec 14
Zinc exploration Zinc price (rhs)
Sources: ABS; LME.
Figure 12.3: Australia’s zinc exploration expenditure
A$m US$t
2
4
6
8
500
1000
1500
2000
1998–99 2002–03 2006–07 2010–11 2014–15
Figure 12.4: Australia’s zinc exports
volume value (right axis)
kt 2014–15 A$b
Source: ABS.
Refined
Australia’s refined zinc production in 2014-15 is estimated to have decreased by 1 per cent to 487 000 tonnes. This was largely due to the closure of Nystar’s zinc operations at its Port Pirie site in July 2014, which is expected to resume zinc operations in 2016 with the completion of the Port Pirie Redevelopment project. This production decrease was partly offset by increased production at Sun Metals Corporation’s Townsville refinery. In 2015-16, Australia’s refined zinc production is forecast to decrease by 2.7 per cent 474 000 tonnes.
Exports
In 2014-15 Australia’s zinc exports (total metallic content) are estimated to have increased by 4.3 per cent to 1.6 million tonnes, reflecting higher mined zinc production. Ores and concentrates export volumes increased by 24 per cent to an estimated 1.4 million tonnes, while exported refined zinc fell 18 per cent to an estimated 360 000 tonnes in 2014-15. Export earnings increased by an estimated 23 per cent to $2.9 billion supported by higher zinc prices, greater ores and concentrates export volumes, and a weaker Australian dollar.
In 2015-16 Australia’s total zinc exports are forecast to decrease 3 per cent to 1.5 million tonnes, reflecting lower forecast mine production. The value of these exports is forecast to increase by 15 per cent in 2015-16 to $3.3 billion, underpinned by forecast higher prices and an expected depreciation of the Australian dollar.
industry.gov.au Resources and Energy Quarterly, June 2015 65
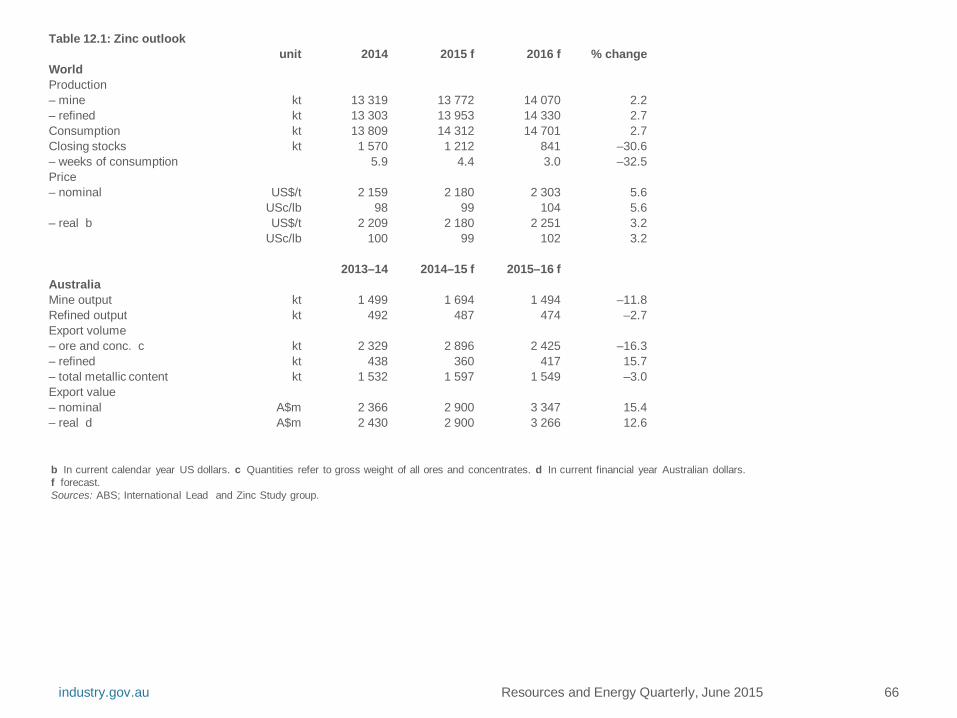
industry.gov.au Resources and Energy Quarterly, June 2015 66
Table 12.1: Zinc outlook unit 2014 2015 f 2016 f % change
World Production – mine kt 13 319 13 772 14 070 2.2 – refined kt 13 303 13 953 14 330 2.7 Consumption kt 13 809 14 312 14 701 2.7 Closing stocks kt 1 570 1 212 841 –30.6 – weeks of consumption 5.9 4.4 3.0 –32.5 Price – nominal US$/t 2 159 2 180 2 303 5.6
USc/lb 98 99 104 5.6 – real b US$/t 2 209 2 180 2 251 3.2
USc/lb 100 99 102 3.2
2013–14 2014–15 f 2015–16 f Australia Mine output kt 1 499 1 694 1 494 –11.8 Refined output kt 492 487 474 –2.7 Export volume – ore and conc. c kt 2 329 2 896 2 425 –16.3 – refined kt 438 360 417 15.7 – total metallic content kt 1 532 1 597 1 549 –3.0 Export value – nominal A$m 2 366 2 900 3 347 15.4 – real d A$m 2 430 2 900 3 266 12.6
b In current calendar year US dollars. c Quantities refer to gross weight of all ores and concentrates. d In current financial year Australian dollars. f forecast. Sources: ABS; International Lead and Zinc Study group.

Trade Summary Charts and Tables
Resources and Energy Quarterly, June 2015 67 industry.gov.au

76%
6%
7%
9% 3%
2003–04
Services
Mining
Building and construction
Manufacturing
Agriculture, forestry and fishing
$1549.6b
Figure 13.1: Contribution to GDP, 2013-14 dollars
75%
8%
8% 6%
2%
2013–14
Services
Mining
Building and construction
Manufacturing
Agriculture, forestry and fishing
$1558.4b
12%
15%
12%
4% 6% 4% 4%
43%
2003-04
China
United States
Japan
Singapore
Germany
South Korea
Malaysia
Other
$172.1b
Figure 13.2: Principal markets for Australia’s total imports 2013-14 dollars
20%
10%
7%
5% 5% 4% 4%
44%
2013-14
China
United States
Japan
Singapore
Germany
South Korea
Malaysia
Other
$252.7b
Resources and Energy Quarterly, June 2015 68 industry.gov.au
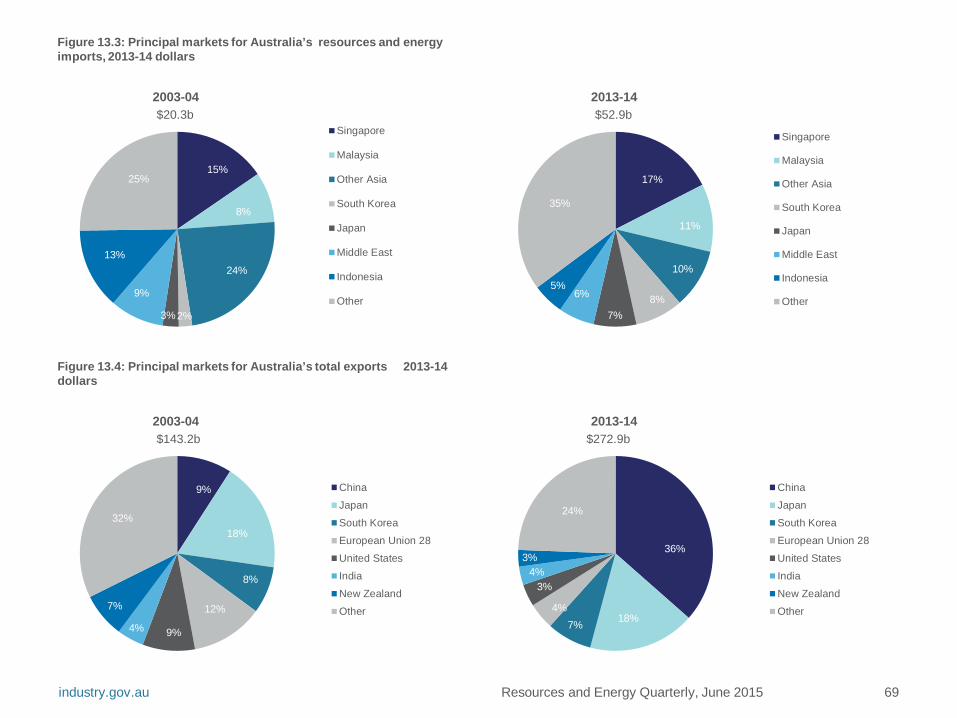
9%
18%
8%
12%
9% 4%
7%
32%
2003-04
China
Japan
South Korea
European Union 28
United States
India
New Zealand
Other
$143.2b
Figure 13.4: Principal markets for Australia’s total exports 2013-14 dollars
36%
18% 7% 4%
4% 3%
3%
24%
2013-14
China
Japan
South Korea
European Union 28
United States
India
New Zealand
Other
$272.9b
15%
8%
24%
2% 3%
9%
13%
25%
2003-04
Singapore
Malaysia
Other Asia
South Korea
Japan
Middle East
Indonesia
Other
$20.3b
Figure 13.3: Principal markets for Australia’s resources and energy imports, 2013-14 dollars
17%
11%
10%
8% 7%
6% 5%
35%
2013-14
Singapore
Malaysia
Other Asia
South Korea
Japan
Middle East
Indonesia
Other
$52.9b
Resources and Energy Quarterly, June 2015 69 industry.gov.au

10%
14%
11%
8% 8% 9%
3%
36%
2003-04
China
Japan
Other Asia
Korea, Rep. of
European Union 28
India
Thailand
Other
$43.8b
Figure 13.5: Principal markets for Australia’s resources exports, 2013-14 dollars
60%
11%
8%
7%
2% 1%
1% 9%
2013-14
China
Japan
Other Asia
Korea, Rep. of
European Union 28
India
Thailand
Other
$123.5b
38%
6% 13%
12%
5%
9%
17%
2003-04
Japan
China
Other Asia
South Korea
India
European Union 28
Other
$27.2b
Figure 13.6: Principal markets for Australia’s energy exports, 2013-14 dollars
41%
14% 12%
9%
7%
4%
13%
2013-14
Japan
China
Other Asia
South Korea
India
European Union 28
Other
$71.5b
Resources and Energy Quarterly, June 2015 70 industry.gov.au

13.9%
72.0%
14.1%
Proportion of merchandise exports
Rural
Mineral resources
Other merchandise
Figure 13.7: Contribution to exports by sector, 2010-11
11.5%
59.6%
11.7%
17.1%
Proportion of exports of goods and services
Rural
Mineral resources
Other merchandise
Services
14.1%
71.8%
14.1%
Proportion of merchandise exports
Rural
Mineral resources
Other merchandise
Figure 13.8: Contribution to exports by sector, 2011-12
11.8%
60.2%
11.8%
16.3%
Proportion of exports of goods and services
Rural
Mineral resources
Other merchandise
Services
Resources and Energy Quarterly, June 2015 71 industry.gov.au

15.7%
70.0%
14.3%
Proportion of merchandise exports
Rural
Mineral resources
Other merchandise
Figure 13.9: Contribution to exports by sector, 2012-13
13%
58%
12%
18%
Proportion of exports of goods and services
Rural
Mineral resources
Other merchandise
Services
15.2%
70.9%
13.9%
Proportion of merchandise exports
Rural
Mineral resources
Other merchandise
Figure 13.10: Contribution to exports by sector, 2013-14
12.6%
58.6%
11.5%
17.3%
Proportion of exports of goods and services
Rural
Mineral resources
Other merchandise
Services
Resources and Energy Quarterly, June 2015 72 industry.gov.au

Principal markets for Australia’s thermal coal exports, 2013-14 dollars
2009-10 2010-11 2011-12 2012-13 2013-14
Japan A$m 6 703 7 405 8 619 7 934 7 670
China A$m 1 185 1 702 2 851 2 932 3 455
South Korea A$m 2 399 2 746 3 064 2 774 2 759
Chinese Taipei A$m 1 867 1 963 1 907 1 707 1 652
Malaysia A$m 159 338 373 278 344
Thailand A$m 163 202 179 243 288
Total A$m 13 155 14 979 17 960 16 587 16 705
Principal markets for Australia’s metallurgical coal exports, 2013-14 dollars
2009-10 2010-11 2011-12 2012-13 2013-14
China A$m 4 386 3 021 3 759 4 724 5 857
Japan A$m 7 624 9 175 9 255 6 110 5 500
India A$m 6 052 7 597 6 779 4 706 4 811
South Korea A$m 2 754 4 010 4 019 2 492 2 458
Chinese Taipei A$m 1 007 1 812 1 928 1 184 1 165
Netherlands A$m 722 1 021 1 330 997 1 004
Total A$m 27 143 31 977 32 210 23 014 23 254
Resources and Energy Quarterly, June 2015 73 industry.gov.au

Principal markets for Australia’s oil and gas exports, 2013-14 dollars
2009-10 2010-11 2011-12 2012-13 2013-14
Japan A$m 9 609 11 311 13 531 14 803 17 818
China A$m 1 963 3 202 3 809 2 781 3 823
South Korea A$m 2 650 2 815 1 828 2 224 3 118
Singapore A$m 2 402 2 017 2 862 2 760 2 297
Thailand A$m 1 290 1 883 1 025 844 1 641
India A$m 554 987 310 181 127
Total A$m 21 021 25 386 27 018 27 144 29 231
Principal markets for Australia’s gold exports, 2013-14 dollars
2009-10 2010-11 2011-12 2012-13 2013-14
China A$m 0 679 4 472 6 140 8 110
Singapore A$m 191 1 197 1 177 969 2 273
United Kingdom A$m 4 607 3 758 4 745 2 684 640
Turkey A$m 0 0 67 479 537
Thailand A$m 1 454 2 540 1 686 1 304 445
Switzerland A$m 13 9 35 294 345
Total A$m 14 383 13 970 16 222 15 445 13 009
Resources and Energy Quarterly, June 2015 74 industry.gov.au

Principal markets for Australia’s iron ore exports, 2013-14 dollars
2009-10 2010-11 2011-12 2012-13 2013-14
China A$m 27 856 42 887 45 602 43 021 57 039
Japan A$m 6 640 11 098 11 410 8 838 9 664
South Korea A$m 3 181 6 495 6 785 5 055 6 097
Chinese Taipei A$m 1 002 2 079 1 883 1 535 1 710
Indonesia A$m 0 0 0 0 110
India A$m 16 0 0 49 41
Total A$m 38 818 62 667 65 778 58 549 74 681
Principal markets for Australia’s aluminium exports, 2013-14 dollars
2009-10 2010-11 2011-12 2012-13 2013-14
Japan A$m 1 442 1 506 1 387 1 030 1 114
South Korea A$m 860 933 614 695 680
Chinese Taipei A$m 501 558 390 468 443
Thailand A$m 428 348 344 374 303
China A$m 133 147 199 153 233
Indonesia A$m 265 279 317 255 195
Total A$m 4 247 4 484 3 984 3 361 3 477
Resources and Energy Quarterly, June 2015 75 industry.gov.au

Principal markets for Australia’s copper exports, 2013-14 dollars
2009-10 2010-11 2011-12 2012-13 2013-14
China A$m 2 269 2 637 2 619 3 115 3 939
Japan A$m 1 309 1 467 1 559 1 657 1 621
India A$m 1 306 1 446 1 523 1 138 945
Malaysia A$m 321 696 736 694 611
South Korea A$m 893 1 083 903 450 580
Philippines A$m 185 197 20 144 285
Total A$m 7 200 9 039 8 919 8 251 8 697
Principal markets for Australia’s iron and steel exports, 2013-14 dollars
2009-10 2010-11 2011-12 2012-13 2013-14
United States A$m 299 288 172 132 105
New Zealand A$m 107 95 89 81 94
Thailand A$m 119 153 116 103 36
Indonesia A$m 44 56 52 45 36
Philippines A$m 1 2 2 3 19
Brazil A$m 73 39 87 16 18
Total A$m 1 240 1 399 1 032 842 724
Resources and Energy Quarterly, June 2015 76 industry.gov.au