Embed Size (px)
Citation preview

RESOURCES FOR LEARNING ROBOTS: ENVIRONMENTS AND FRAMINGS
CONNECTING MATH IN ROBOTICS
by
Eli Michael Silk
B.A., Swarthmore College, 2001
Submitted to the Graduate Faculty of
the School of Education in partial fulfillment
of the requirements for the degree of
Doctor of Philosophy
University of Pittsburgh
2011

ii
UNIVERSITY OF PITTSBURGH
SCHOOL OF EDUCATION
This dissertation was presented
by
Eli Michael Silk
It was defended on
June 13, 2011
and approved by
Kevin Crowley, Associate Professor, Education, University of Pittsburgh
James Greeno, Visiting Professor, Education, University of Pittsburgh
Kenneth Koedinger, Professor, Human-Computer Interaction, Carnegie Mellon University
Dissertation Advisor: Christian Schunn, Associate Professor, Psychology, University of
Pittsburgh

iii
Copyright © by Eli Michael Silk
2011

iv
RESOURCES FOR LEARNING ROBOTS: ENVIRONMENTS AND FRAMINGS
CONNECTING MATH IN ROBOTICS
Eli Michael Silk, PhD
University of Pittsburgh, 2011
How do learning environments influence the ways that middle school students use math to
engage with and learn about robotics? Data from two observational studies suggest that existing
formal (scripted inquiry) and informal (competitions) learning environments in this domain are
limited in their support for connecting math with robotics. In light of the evaluation of these
existing learning environments, two additional studies were conducted documenting the design,
implementation, and redesign of a new learning environment intended to more effectively align
learning and engagement with the connection between math and robots. Pre-post assessments
and analyses of student work support the hypothesis that a model eliciting learning environment
can facilitate learning while maintaining interest in both disciplines, and facilitate the
development of a greater sense of the value of math in robotics. Two additional studies expanded
on the previous work. The first study identified two contrasting approaches for connecting math
with robots in the context of the model-eliciting learning environment from the previous studies.
One approach used mathematics as a calculational resource for transforming input values into
desired output values. The second approach used mathematics as a mechanistic resource for
describing intuitive ideas about the physical quantities and their relationships. The second study
manipulated instructional conditions across two groups of students that encouraged the students

v
to take on one of these approaches or the other. Both groups engaged in high levels of productive
mathematical engagement: designing, justifying, and evaluating valid strategies for controlling
robot movements with connections to mathematics. But only the mechanistic group made
significant learning gains and they were more likely to use their invented robot math strategies
on a transfer competition task. All six studies taken together provide a rich description of the
range of possibilities for connecting math with robots. Further, the results suggest that in addition
to carefully crafting environments and associated tasks to align math and robots, that
instructional designers ought to pay particular attention to helping students frame their
approaches to using math productively as a tool for thinking about situations.

vi
TABLE OF CONTENTS
PREFACE ................................................................................................................................. XIV
1.0 INTRODUCTION ........................................................................................................ 1
2.0 PART 1 – ENVIRONMENTS FOR LEARNING ROBOTS ................................... 9
2.1 OVERVIEW OF STUDIES .............................................................................. 11
2.2 BACKGROUND ................................................................................................ 13
2.2.1 Learning and engagement .......................................................................... 13
2.2.2 Opportunities for robotics learning environments .................................. 14
2.2.3 Challenges for robotics learning environments ....................................... 15
2.2.4 Introductory robotics as controlling robot movements ........................... 16
2.2.5 Robot movements and the math of proportional reasoning ................... 20
2.2.6 Research questions on environments for learning robots ....................... 26
2.3 STUDY 1 – SCRIPTED INQUIRY .................................................................. 27
2.3.1 Activity context ............................................................................................ 27
2.3.2 Method ......................................................................................................... 34
2.3.2.1 Participants .......................................................................................... 34
2.3.2.2 Data sources ......................................................................................... 35
2.3.2.3 Study design ......................................................................................... 39
2.3.2.4 Procedure ............................................................................................. 40

vii
2.3.3 Results .......................................................................................................... 41
2.3.3.1 Problem solving assessment ............................................................... 41
2.3.3.2 Attitudes survey ................................................................................... 42
2.3.3.3 Student work ....................................................................................... 44
2.3.3.4 Whole-class discussions ...................................................................... 45
2.3.3.5 Interviews ............................................................................................. 58
2.3.4 Discussion..................................................................................................... 64
2.4 STUDY 2 – DESIGN BASED ........................................................................... 66
2.4.1 Activity context ............................................................................................ 68
2.4.2 Method ......................................................................................................... 73
2.4.2.1 Participants .......................................................................................... 73
2.4.2.2 Data sources ......................................................................................... 74
2.4.2.3 Study design ......................................................................................... 75
2.4.2.4 Procedure ............................................................................................. 76
2.4.3 Results .......................................................................................................... 76
2.4.3.1 Problem solving assessment ............................................................... 76
2.4.3.2 Attitudes survey ................................................................................... 77
2.4.3.3 Student work ....................................................................................... 78
2.4.4 Discussion..................................................................................................... 85
2.5 STUDY 3 – COMPETITION ........................................................................... 86
2.5.1 Activity context ............................................................................................ 87
2.5.2 Method ......................................................................................................... 89
2.5.2.1 Participants .......................................................................................... 89

viii
2.5.2.2 Data sources ......................................................................................... 91
2.5.2.3 Study design ......................................................................................... 92
2.5.2.4 Procedure ............................................................................................. 93
2.5.3 Results .......................................................................................................... 94
2.5.3.1 Problem solving assessment ............................................................... 94
2.5.3.2 Attitudes survey ................................................................................... 96
2.5.3.3 Student work ....................................................................................... 98
2.5.4 Discussion................................................................................................... 104
2.6 STUDY 4 – MODEL ELICITING ................................................................. 104
2.6.1 Activity context .......................................................................................... 108
2.6.2 Method ....................................................................................................... 109
2.6.2.1 Participants ........................................................................................ 109
2.6.2.2 Data sources ....................................................................................... 110
2.6.2.3 Study design ....................................................................................... 111
2.6.2.4 Procedure ........................................................................................... 111
2.6.3 Results ........................................................................................................ 112
2.6.3.1 Problem solving assessment ............................................................. 112
2.6.3.2 Attitudes survey ................................................................................. 113
2.6.3.3 The Competition group ...................................................................... 115
2.6.3.4 The Model Eliciting group ................................................................ 116
2.6.4 Discussion................................................................................................... 116
2.7 GENERAL DISCUSSION .............................................................................. 117
3.0 PART 2 – LEARNING FRAMES FOR MATH IN ROBOTS ............................ 120

ix
3.1 OVERVIEW OF STUDIES ............................................................................ 120
3.2 BACKGROUND .............................................................................................. 122
3.3 STUDY 5 – IDENTIFYING CONTRASTING FRAMES ........................... 127
3.3.1 Method ....................................................................................................... 127
3.3.1.1 Participants ........................................................................................ 127
3.3.1.2 Data sources ....................................................................................... 129
3.3.1.3 Study design ....................................................................................... 129
3.3.2 Results ........................................................................................................ 129
3.3.3 Discussion................................................................................................... 134
3.4 STUDY 6 – MANIPULATING THE CONTRASTING FRAMES ............ 137
3.4.1 Method ....................................................................................................... 138
3.4.1.1 Participants ........................................................................................ 138
3.4.1.2 Data sources ....................................................................................... 138
3.4.1.3 Study design ....................................................................................... 140
3.4.1.4 Procedure ........................................................................................... 141
3.4.2 Results ........................................................................................................ 143
3.4.2.1 Problem solving assessment ............................................................. 143
3.4.2.2 Attitudes survey ................................................................................. 144
3.4.2.3 Student work ..................................................................................... 145
3.4.2.4 Posters ................................................................................................ 146
3.4.2.5 High level mathematics in the Calculational group ....................... 149
3.4.2.6 Post-interviews and the competition task ....................................... 151
3.4.3 Discussion................................................................................................... 154

x
4.0 GENERAL DISCUSSION AND CONCLUSIONS .............................................. 156
4.1 SUMMARY OF RESULTS ............................................................................ 156
4.2 MODELING AND MECHANISTIC THINKING ....................................... 160
4.2.1 Empowering beginning roboticists as systematic designers.................. 160
4.2.2 Concreteness versus abstractness in math-to-robot connections ......... 162
4.2.3 Epistemological frames for connecting math to robots ......................... 163
4.3 DESIGNING LEARNING ENVIRONMENTS ............................................ 166
4.3.1 Targeting the connections between math and robots ............................ 166
4.3.2 Targeting engagement and learning........................................................ 168
4.4 CONCLUSION ................................................................................................ 171
APPENDIX A ............................................................................................................................ 172
APPENDIX B ............................................................................................................................ 174
APPENDIX C ............................................................................................................................ 194
APPENDIX D ............................................................................................................................ 201
APPENDIX E ............................................................................................................................ 243
APPENDIX F ............................................................................................................................ 269
BIBLIOGRAPHY ..................................................................................................................... 278

xi
LIST OF TABLES
Table 1. Scripted Inquiry problem solving outcomes results ....................................................... 42
Table 2. Scripted Inquiry attitudes outcomes results .................................................................... 43
Table 3. Features of contrasting Scripted Inquiry whole-class discussions .................................. 56
Table 4. Design Based attitudes outcomes results ........................................................................ 77
Table 5. Competition problem solving outcomes results .............................................................. 94
Table 6. Competition attitudes outcomes results .......................................................................... 97
Table 7. Competition observed strategies ..................................................................................... 99
Table 8. Model Eliciting problem solving outcomes results ....................................................... 113
Table 9. Model Eliciting attitudes outcomes results ................................................................... 114
Table 10. Contrasting teams’ group composition ....................................................................... 128
Table 11. Summarized differences between contrasting teams’ approaches in the RSD unit .... 135
Table 12. Instructional differences between Calculational and Mechanistic groups ................. 142
Table 13. Calculational and Mechanistic groups problem solving outcomes results ................ 143
Table 14. Calculational and Mechanistic groups attitudes outcomes results ............................. 145
Table 15. Mechanistic score of the group posters ....................................................................... 148
Table 16. Quality score of the group posters .............................................................................. 149

xii
LIST OF FIGURES
Figure 1. Theoretical space of learning and engagement with typically associated activities ..... 14
Figure 2. LEGO MINDSTORMS NXT 2.0 robot ........................................................................ 17
Figure 3. LEGO MINDSTORMS NXT programming software .................................................. 19
Figure 4. The basic robot movement problem .............................................................................. 20
Figure 5. Scripted Inquiry sequence of activities .......................................................................... 29
Figure 6. Scripted Inquiry “Wheels & Distance” investigation introduction screen .................... 30
Figure 7. Scripted Inquiry “Close Shave” challenge description sheet ........................................ 33
Figure 8. Scripted Inquiry post-investigation whole-class discussion data table ......................... 47
Figure 9. Scripted Inquiry post-challenge whole-class discussion data table ............................... 51
Figure 10. Two RSD robot dancers out of sync when using the same motor rotations ................ 70
Figure 11. A programming environment that makes the numerical parameters salient ............... 71
Figure 12. An initial guess-and-check strategy ............................................................................. 80
Figure 13. Two other strategies labeled as guess-and-check, but with other aspects ................... 84
Figure 14. Competition game board .............................................................................................. 89
Figure 15. Distribution and mean (+) of ranks in the Competition based on strategy used ....... 101
Figure 16. Scatter plot of scores in the Competition based on strategy used .............................. 103
Figure 17. Design goal as (a) a set of movements versus (b) a coordination of features ........... 107

xiii
Figure 18. Math-based solution by the Competition team in Study 4 ........................................ 115
Figure 19. Effects of the environments on learning and engagement ......................................... 118
Figure 20. (a) Team A2’s and (b) Team B1’s first synchronizing distance strategies ............... 131
Figure 21. (a) Team A2’s and (b) Team B1’s revised synchronizing distance strategies .......... 133
Figure 22. (a) Team A2’s and (b) Team B1’s final synchronizing toolkits ................................ 134
Figure 23. Simplified competition transfer task ......................................................................... 140
Figure 24. Typical (a) Calculational versus (b) Mechanistic posters ......................................... 146
Figure 25. Effects of the environments and framings on learning and engagement ................... 157

xiv
PREFACE
I would like to express my gratitude to so many people without whom the completion of this
dissertation would certainly not have been possible. Thank you to the students who worked so
hard when it wasn’t required of them. Thank you to their parents who sought out challenging
opportunities, allowed their children to participate, and made sure they showed up. Thank you to
the teachers, coaches, directors, and administrators who graciously welcomed me into their
classrooms and programs. Thank you to the Robotics Academy for introducing me to the
wonderful world of educational robotics and providing me a well-traveled path for navigating
through it. Thank you to the Schunn Nokes Lab for regularly being willing to listen and provide
me with feedback on my very rough ideas. Thank you to my committee for their willingness to
engage with my ideas and push me to move them forward. Thank you to Chris Schunn for
providing substantial and unwavering support at every level throughout this entire process. And
thank you to my family for giving me the time, space, and encouragement to see this through.

1
1.0 INTRODUCTION
This research is located in the broad field of the learning sciences with a particular focus on the
cognition and learning involved in coordinating between the disciplines of mathematics and
robotics. The goal of this dissertation project was to investigate the alternative ways in which
mathematics might be positioned within a task involving physical and technological
components—in this case, controlling basic robot movements. Particular attention was paid to
investigating math as a useful tool for problem solving and improved understanding within that
situation. Features of designed learning environments were evaluated in terms of the extent to
which they facilitated students in valuing and using math in their robot problem solving.
Robotics as a fun and challenging engineering and technological design activity
Robots are an increasingly common context for K-12 students to participate in engineering and
technological design activities. The largest example of this sort of activity is the robot
competitions sponsored by FIRST (For Inspiration and Recognition of Science and Technology).
FIRST estimates that over 212,000 students from age 6-18 participated in their four levels of
robotics programs in 2009 (FIRST, 2010). A stated goal of FIRST is to get young people to
celebrate students who build and innovate with engineering and technology with the same energy
and enthusiasm that is more commonly reserved in today’s culture for professional athletes and
entertainers. As the title of a recently-released popular-press book—The New Cool (Bascomb,

2
2011)—suggests, robotics competitions may be a promising context for encouraging students to
pursue further study and careers in STEM (Science, Technology, Engineering, and Mathematics)
fields precisely because the competitions effectively blend a focus on excitement and fun with an
opportunity to engage in an extended and challenging activity from which to learn valuable
STEM-related skills. When students have positive experiences participating in robot
competitions, they then may be more likely to build sustained interest in STEM fields, to elect to
take additional and more advanced courses in high school and college, to persist in those courses
even when they are difficult, and then to seek STEM-related career opportunities. Indeed, when
compared to a matched comparison group from an existing national dataset, alumni participants
of the high-school level FIRST Robotics Competition (FRC) were more likely to attend college,
to major in a STEM-related field, and to expect to pursue a STEM-related career (Melchior,
Cohen, Cutter, & Leavitt, 2005). Evaluations of the FIRST program have been primarily
concerned with measuring that program’s impact on fostering confidence and sustained interest
in robotics (Melchior, Cutter, & Deshpande, 2009). But, building STEM-related skills is also a
stated part of FIRST’s mission, and it is ultimately a combination of both interest and
competence that is likely to impact students’ STEM-related education and career choices
(Wigfield & Eccles, 2000).
The potential of robotics as a context for students to participate in challenging
engineering and technological design opens many questions of value to the learning sciences and
STEM education research fields. One such question is whether and how students’ initial interests
in working with robots and in “making the robot do what I want” (Petre & Price, 2004) might
lead to the development of more general understanding about the robot context and problem-
solving strategies for navigating it. It is not yet certain what are the most effective ways to

3
structure these particular experiences in robotics—or more general experiences in other
challenging engineering and technological design contexts—so that even while sustaining or
enhancing students’ interest in STEM, students also become more competent designers in those
specific contexts and acquire more general understandings that can be flexibly and innovatively
applied in other similar situations.
Coordinating engineering and technological design with mathematical thinking
In these robot competitions and in K-12 settings more generally, although some exceptions
almost certainly do occur, traditional boundaries between disciplines make it unlikely that if a
student has an experience doing some sort of engineering or technological design that they will
be encouraged to draw on mathematics to help understand, justify, revise, or communicate their
design ideas. They are more likely to focus their efforts on building a solution and tinkering with
it till it satisfies some unspecified criteria (and then demonstrating it without explanation). Not
drawing on mathematics as a tool for designing is most likely even more common at the middle
and elementary school level, when students are first being introduced to these robot competitions
and may be perceived as not having a sophisticated enough background to use math in their
designing. But authentic engineering design is characterized more by systematic design
accompanied by careful quantitative analyses utilizing both given and invented mathematical
models of the physical reality and the technological adaptations available for working within that
reality (Gainsburg, 2006). Understanding the ways in which a novice designer is able to
coordinate aspects of specific situations—a physical sense of the situation and awareness of the
technological tools for adapting it—with models of the general structural characteristics of those
situations—a mathematical sense of the situation—is therefore important to inform the design of

4
instructional activities that better prepare students for participating in authentic engineering and
technology practice.
Cognitive and epistemological resources perspective
One theoretical perspective for examining this issue is a cognitive perspective in which the
conceptual resources that students draw on in design tasks determine the learning outcomes that
result. Cognitive resources may include knowledge components about important features of the
situation, the relationships between features, and strategies for solving problems that act on these
features (Siegler & Chen, 2008). One interesting finding is that informal strategies that are
attuned to specific aspects of problem-solving situations are valid and in many cases less error
prone than more efficient, abstracted, formal procedures (Koedinger, Alibali, & Nathan, 2008).
A prominent example is a so-called guess-and-test strategy, or empirical solution method, which
contrasts with more formal analytic methods that usually involve algebra (Levin, 2009). This
guess-and-test method, similar to other informal strategies such as building-up methods in
proportional reasoning (Ben-Chaim, Fey, Fitzgerald, Benedetto, & Miller, 1998), is successful
because students are acting on quantities with well-understood referents in the physical situation
and are therefore unlikely to make abstract errors that would violate situational constraints
(Nhouyvanisvong, 1999). As a result, although these informal strategies may be limited in their
applicability as the complexity of the task increases, their meaningfulness and usefulness within
certain limited situations can serve as a cognitive resource for building more sophisticated and
powerful strategies. The cognitive perspective suggests that a careful task analysis of students’
strategies for problem-solving in robotics and how those strategies can be generalized to more
sophisticated methods could help guide the design of effective learning activities.

5
An alternative perspective, emerging from situative accounts of learning, recognizes that
students have many different cognitive resources that have the potential to be productively used
in different situations, but which cognitive resources students activate is very much dependent
upon their perception about what sort of understanding is called for in the task (Hammer, Elby,
Scherr, & Redish, 2005). Greeno (2009) has referred to this as epistemological framing, and calls
for more explicit attention to resources available to the student in this sense. For example, two
ways in which students may frame their activity are a conceptual orientation versus a
calculational orientation (Thompson, Philipp, Thompson, & Boyd, 1994). In a conceptual
orientation, an individual is focused on making meaning and connections with more general
structural aspects of situations that may apply beyond the specific instance. In a calculational
orientation, the ultimate objective is to obtain a particular answer to a particular problem, and so
efforts are focused on that narrower goal. diSessa (1985) provides a rich description of these
contrasting epistemologies by analyzing two MIT freshman taking a freshman physics class. The
first case—“Results Man”— was focused on numerical results and solutions to problems without
recognizing the value of qualitative analyses or connecting to intuitive understandings. The other
student—“Real Understanding”—employed a problem-solving process that put much more
emphasis on making sense of what was going on in the situation before applying any equations
or focusing on numerical results. This student expressed that his ultimate goal for problem
solving was to figure something out about the world and not “getting a number” (diSessa, 1985,
p. 104). Thus, according to an epistemological framing perspective, activating relevant cognitive
resources for making sense of robot design tasks may be ineffectual if students view the task as
requiring them only to design a particular solution to a particular problem rather than to develop
a more general understanding.

6
The cognitive and epistemological perspectives together may provide a sufficient
framework for investigating the opportunities and challenges that middle school students may
have as novice designers in a robot context. In this context, students may be encouraged to
coordinate their intuitive understanding of the physical reality and of their technological tools for
adapting it with mathematical models that help them to understand, justify, and revise their
designs.
Why robotics?
In addition to the increasing popularity of robot competitions, robotics was chosen as the context
for this study for a number of reasons that make it a discipline especially suited for investigating
the role of mathematics in the development of physical and technological understanding for
improving design solutions. In this study, I focus further within the discipline of robotics on how
students come to understand and design simple robot movements. The first reason this focus on
robot movements is appropriate is the high occurrence of non-mathematical guess-and-test
strategies employed by novice students when attempting to program the robots to move straight
specified distances or turn specified angles in specified amounts of time. At the same time, this
context is appropriately modeled using concepts of proportional reasoning—a foundational idea
in middle school mathematics (Lamon, 2007)—relating the quantities of the physical
construction of the robot to quantities used to program the robot in predicting the magnitude of
the robot movements. By using proportional reasoning strategies, students can more efficiently
program their robots to move in particular ways that they specify, but can also more flexibly
adapt their strategies to different movements and robots of different physical designs. A related
advantage of this context is that proportional reasoning consists of a wide range of informal and

7
formal strategies (and valid and invalid strategies) that are well studied in the literature both in
formal schooling (Ben-Chaim et al., 1998) and in real-world contexts (Hoyles, Noss, & Pozzi,
2001). Thus, the context affords a wide range of strategies, both non-mathematical and
mathematical that vary in their power for guiding design solutions.
Another advantage of this robot context for investigating students’ coordination of
mathematical thinking in their engineering and technological design is the blend of complexity
with control in a real-world context (Schauble, 1996). The robots are reliable, manipulable, and
inspectable. At the same time they are not simply a made-up or imagined entity, but instead they
do real things out in the physical world, and so a person’s own intuitive knowledge of the
physical world will apply to the robots as well.
The plan for the dissertation
I pursued the goal of investigating how beginning robotics students coordinate mathematical
thinking in their robot designs in this dissertation project in two parts. Each part had a different
research focus and method, but both made use of a mix of quantitative and qualitative analyses.
In the first part, I used both observational and design experiment methods to identify the nature
and extent of the ways that students connect math in robotics and to analyze the effect of
designed environments for supporting students’ learning of those connections. The focus of the
investigations was on identifying features of environments that were not only effective at helping
students learn those ideas, but also at maintaining their interest in both disciplines and enhancing
their sense of the connections between the disciplines. The findings from this part suggest that
activities which are carefully designed to favor strategies that include math as a central rather
8
than supplemental part of the activity have the best chance for achieving learning gains while
sustaining engagement.
In the second part, I used an experimental research design to pursue a more differentiated
understanding of the ways students connect math with robotics, and how they may connect math
with physical situations more generally. This included identifying alternative ways students
made this math-to-situation connection, manipulating the environment so that students took up
these different ways, and investigating the results when they did so. The findings from this part
suggest that the most common way for students to connect math with robotics is as a way to
work with and manipulate the numbers in the situation. Although less common, the alternative
way consists of students who frame the use of math as a representational tool for being explicit
about their ideas of the way the robots work. This alternative way for connecting math in
robotics leads to greater learning and a deeper sense of the connections between the two
disciplines.
Taken together, this dissertation project provides an initial map of the landscape of the
place of math in introductory robotics. The results have implications for cognitive and learning
science research and for research in STEM disciplines that are focused on understanding how
students integrate knowledge across disciplinary boundaries. In addition, the findings may be
useful and informative for designers of learning environments for introductory robotics and the
teachers and coaches responsible for guiding their students through those environments.

9
2.0 PART 1 – ENVIRONMENTS FOR LEARNING ROBOTS
The major issue addressed in this first part of the dissertation project is how to motivate
systematic analysis of situations in a learning environment where students may initially approach
the situation in a much less formal manner. In most environments for learning robots, students
are free to choose to participate or not, because these environments are rarely a part of the
standard school curricula. Robots, although often thought of as having educational potential
(Petre & Price, 2004), are more likely to be used in elective activity periods during school or in
after-school enrichment programs than as a part of core content in formal school classrooms. In
these settings, students choose to engage in an activity involving robots because they have some
interest in technology in general or in robotics in particular. But the students’ initial interest is
often at a level associated with fun rather than work, and so they may be resistant to efforts that
push them to engage at a more reflective and conceptually difficult level. It is thus a challenge to
designers of these environments to maintain that interest while also bridging that interest into a
deeper, more conceptually productive form of engagement. The design of learning environments
that lead effectively to productive disciplinary engagement (Engle & Conant, 2002) is
challenging and not well specified for well-studied formal classroom environments that target
core disciplinary areas, and so designing environments that target the learning of robotics is no
exception.

10
The first part of this dissertation was set within the context of a reporting of the design
history of the Robot Synchronized Dancing (RSD) unit. The goal of the RSD unit was to be a
learning environment for introductory robotics that effectively helped students connect math
with robots while sustaining their engagement in both disciplines. In the development of this
particular unit, along with investigations of contrasting units, there were lessons learned about
the broader set of opportunities for learning introductory robotics. These lessons learned have
implications for more general issues related to the design of environments that push students to
be more intentional learners while maintaining high levels of engagement.
This part of the dissertation included four studies, each focused on identifying the
features of an environment that influence the connection of math in learning introductory
robotics. Study 1 and Study 3 were observational studies in the context of already-established
environments that target introductory robotics. These two contrasting environments—a formal
classroom unit and an informal competition setting—helped to define the space of problems that
students need to solve in this discipline and their common solution approaches. The contrasting
environments also helped to define instructional possibilities for facilitating those solutions.
Study 2 and Study 4 were design experiment studies in the context of a first and then a revised
version of the RSD unit. Embedded in this design and redesign were conjectures about the key
features of environments that promote learning while maintaining engagement.
11
2.1 OVERVIEW OF STUDIES
Because of the breadth of territory covered in this part of the dissertation project, the following is
a brief summary of the main findings from each study and the connections between them, which
can serve as a guide for the reader:
Study 1 – Scripted Inquiry. I examined a formal classroom unit, in which the explicit
instructional goal was to help students learn math concepts. Observing in this environment, I
found that although the activities were structured such that students did attend to math, in many
cases the connections to math were misaligned, decontextualized, and primarily procedural in
nature. There was little development of the usefulness of the math for actually doing things with
robots even though the robots were the sole context within which the math was being targeted.
As a result, the students did make some learning gains, but also ended with a diminished level of
engagement in robotics and math and a limited view of the connections between them.
Study 2 – Design Based (RSDv1). I designed an alternative formal learning environment,
in which the goal was to more explicitly highlight the value of math as a tool for solving robotics
problems. Designing this environment provided an initial test of the idea that better aligning the
math ideas with actual robot design problems would not only lead to learning, but also to
maintained engagement in robots and math, and a stronger sense of the connections between
them. Although the design experiment did not include measures reliable enough to test this idea
quantitatively, qualitative assessment of students’ participation in the unit suggested that they
indeed did engage with challenging math in the service of solving their robot problems.
Furthermore, careful inspection of their ideas helped to better understand the particular ways in
which the more general math of proportional reasoning is situated within both a developing and

12
more sophisticated understanding of controlling robot movements. This led to possibilities for
redesigning the unit to more immediately and more substantively build from students’ common
ideas and strategies that do include math and that are productive building blocks for more
sophisticated understanding.
Study 3 – Competition. With a better understanding of the concepts and strategies that
students employed to connect math with controlling robot movements, I observed an informal
environment for learning robots—a robot competition—to investigate the extent to which those
same ideas are present and useful in that context. Indeed, the problem of precisely controlling
robot movements was a central aspect in the competition tasks, but in contrast to the formal
environments, student teams rarely attended to the relevant math when inventing their solutions.
The design of the competition environment favored fine-tuned solutions regardless of
consideration of the more general ideas. Unsurprisingly, students were highly engaged in
creating solutions and maintained their interest in robots as a result of preparing and participating
in the competition, but they did not exhibit gains in learning. On the other hand, there were cases
of teams that did appear to use math, some successfully and others unsuccessfully, but when they
did make an attempt, it did result in learning in addition to maintaining engagement. This
suggested that when students chose to use math in context, it was possible to obtain positive
effects on both learning and engagement simultaneously.
Study 4 – Model Eliciting (RSDv2). The observations in the competition setting
suggested that the challenge for environments focused on learning robots was not just general
conceptual math difficulties. They were also about helping students move beyond a tendency to
focus on developing fine-tuned solutions for particular problems in place of attempting to
understand the more general features and underlying structure of the way the robots work. In this

13
study, the RSD unit was redesigned using a model-eliciting activity framework so that the focus
of students’ activities in the unit would be more clearly and more immediately aligned with the
goal of attending to the general structures of the problem. This redesigned unit resulted in similar
learning gains as the scripted inquiry unit but also resulted in a positive change in the perception
of the value of math for robotics. The model-eliciting framework thus served as a closer
approximation to the ideal of “hard fun”—an environment within which the engaging part for the
student is the learning itself.
2.2 BACKGROUND
2.2.1 Learning and engagement
Engle and Conant (2002) describe the goal of instruction as productive disciplinary engagement,
possibly implying that engagement is necessary for learning. Alternatively it may be that
engagement is better characterized as a dimension independent of learning. In this model,
learning and engagement may be thought of as orthogonal dimensions that define a space of
outcomes for learning environments. Figure 1 illustrates this two-dimensional space as well as
characterizations of the sorts of activities that would be likely lead to outcomes within that space.
A main challenge in this space from an instructional design perspective is to figure out
how it is possible to balance pushing students to both use more systematic, explicit, and
generalizable strategies in their problem solving while maintaining their engagement – what can
be called “hard fun”.

14
Figure 1. Theoretical space of learning and engagement with typically associated activities
2.2.2 Opportunities for robotics learning environments
Robots provide an interesting case of a discipline that integrates and connects with many other
disciplines. In this dissertation project, I focus on coordinating aspects of math as a tool within
the robot domain that actually helps understanding and designing with the robots. Math may be
used as a tool for understanding a physical situation in a number of ways. For example,
numerical analysis of empirical data may help students to separate explainable patterns from
random error, and algebraic modeling of structural features and their relations may help students
to be explicit about what aspects are relevant and the implications when those aspects are
modified.

15
Schwartz et al. have provided compelling examples of how math may be used as a tool
for thinking about developing knowledge of physical situations (Schwartz, Martin, & Pfaffman,
2005; Schwartz & Moore, 1998). By adapting situations minimally, such as by making quantities
harder or easier to measure and simply prompting to “show your math,” Schwartz et al. have
shown how the math aids in developing understanding.
But questions remain about whether situations themselves have these properties of being
amenable to improved understanding through the application of math. In which case simply
setting up the conditions where students would be encouraged and motivated to explicitly use
math in a robot context should be sufficient to facilitate developing understanding. An alternative
view, however, is that the ability of robots as a context to realize the benefit of math as tool for
thinking about the situation is entirely dependent upon the features of the environment in which
the math is being used. I will set out to show that the answer is more likely and to a greater
extent the latter one. Furthermore, the key features of learning environments that make it
possible for robots to realize these opportunities to connect with math are subtle to get right from
an instructional design perspective.
2.2.3 Challenges for robotics learning environments
Four challenges and associated questions guide the evaluations of environments for learning
robots in this dissertation project:
1. Focused content. How do you make it so the activity that students actually do aligns
with the disciplinary ideas that are the intended targets?

16
2. Motivated activity. How do you get students to actually care about the task and want
to see the result?
3. Accessible problems. How do you make the task accessible so that students actually
can “see” the problem that needs to be resolved?
4. Useful resources. How do you provide them with the resources (information and
tools) they need to solve it?
2.2.4 Introductory robotics as controlling robot movements
In this section I identify more clearly the particular set of robotics challenges that are the focus of
this dissertation project, as well as the particular math ideas that can be used as tools to think
about and solve these robotics challenges. I used the LEGO MINDSTORMS NXT 2.0 robot
platform as the context for this research as it is the most popular platform for students to get
introduced to mobile robots. The robot itself comes as part of a kit that includes building parts,
wheels, motors, sensors, a battery, and a microcomputer brick. There is also associated drag-and-
drop software for programming the brick. Although the robot parts can be configured in
countless ways, a typical configuration and the one used here is as a robot with two wheels each
connected to a separate motor so that they can be controlled independently (Figure 2). The
wheels are connected directly to the motors so that each rotation of the motor corresponds to one
rotation of the wheel. A third, smaller wheel is set up in the back of the robot for balance. It is set
up on a pivot so that it will automatically align itself in the direction of motion and does not need
to be powered by a motor. To move straight forward, both motors are programmed to move in
the same direction at the same speed. To turn, the motors are programmed at different speeds.

17
For example, if the right motor is turned on, but the left motor is still, then the robot will pivot
around the left wheel and make a turn to the left. There are a number of sensors that can be
attached, such as a touch sensor, a sound sensor, and a light sensor, and these sensors can be used
to make actions by the robot conditional upon some sensed event. For example, a robot could
move forward until its touch sensor is triggered, such as when it runs into a wall.
Figure 2. LEGO MINDSTORMS NXT 2.0 robot
Many aspects of learning about these robots could have been the focus. Introductory
robotics includes a wide range of varying challenges that roughly correspond to the categories of
either building or programming challenges. In building, the goal is to design structures (both the
robot’s base and its attachments) that function stably, efficiently, and reliably under weight stress
(the robot itself plus the objects in the world it manipulates) and when the robot and its parts are
in motion. The programming aspect is focused more on specifying actions that break down and
solve multi-step goals in environments that are dynamically changing while the robot’s position
within that environment is also changing. Each of these categories may be broken down further
in many ways and both are important for success in introductory robotics. Indeed, research that

18
focuses on relating proportional reasoning to robots through issues of building, such as gear
ratios, has been conducted (Norton, 2006). However, a smaller and narrower aspect of
introductory robotics was chosen as the focus of this dissertation project based on the criteria of
identifying a challenge that is both a common one that students encounter and an accessible one
in terms of being open to lots of solution approaches from students with and without prior
robotics experience.
All students who work with mobile robots must attend at some level to solving the
problem of how to program the robot to move forward a certain distance and to turn in a certain
direction. Also, although less common, they have to figure out how to do each of those moves in
a certain amount of time. This aspect of controlling robot movements is the most basic challenge
in introductory robotics, but nevertheless one that is not trivial. Even further for the purposes of
this research, this challenge affords a range of solution approaches that are both mathematical
and non-mathematical in nature, so it is an opportunity to investigate what influences the types of
strategies that students use. For this dissertation project, I approach this task from the
programming perspective in the sense that I assume the building of the robot has already been
completed, and so the challenge is to figure out how to program the robot so its movement
actions are the intended ones. I also minimize the relevance of the programming logic, in the
sense that the sequence of conditions and actions is not the primary issue. Ultimately, the
problem is reduced to figuring out how many motor rotations and what motor power level is
needed for each desired movement.
Students typically program these robots using an associated drag-and-drop interface.
Figure 3 is a screenshot of this interface. Students can drag blocks to the middle grid-like portion
of the interface called the Programming Area. This indicates what action they want the robot to

19
perform and in what order. In this case, one move block has been dragged to the Programming
Area. When the student clicks on a programming block, the parameters for that block appear at
the bottom of the interface in the Configuration Panel. For the Move Block, students can control
the direction of the motors, whether one or both motors should be powered, the power level, and
the duration. The duration indicates how long to rotate the motors and can be set in units of
rotations, degrees, seconds, or unlimited (to make the motor duration conditional upon the result
of some other block). When the program is complete, the student connects the robot to a
computer with a USB cable and downloads the program to the robot by pressing the download
button located in the bottom right of the Programming Area. They then get the robot ready to
run, and navigate through a menu system on the robot brick to start the program.
Figure 3. LEGO MINDSTORMS NXT programming software

20
Although programs can get very complex when they include iteration and conditionals, in
the cases considered here students programs consist mostly or entirely of a simple sequence of
move blocks. Within each block, students have to make an intentional choice about what
duration value and power level to use so that their robot moves in the desired way.
2.2.5 Robot movements and the math of proportional reasoning
In deciding the number of motor rotations and the motor power level to make their robots move
certain amounts, students can approach the task using a variety of strategies, some of which may
take advantage of the underlying structure of the situation more than others. Figure 4 is an
illustration of this task to help contextualize the strategies that are possible and their connections
to math. However, before I review particular strategies, I review a number of math concepts that
are relevant to the task, all of which can be seen as component concepts of the big idea in
mathematics of proportional reasoning (Lamon, 2007).
(a) (b)
Figure 4. The basic robot movement problem
The ability to reason proportionally is a culmination of elementary school math focused
on arithmetic. At the same time, it is a critical building block for high school level math and
science beginning with algebra and extending far beyond (Lesh, Post, & Behr, 1988). As a result,

21
problems that involve proportional reasoning are especially suited for middle school age
students, but can be accessible to students in upper elementary school and can also be
challenging for high school students and adults. Proportional reasoning is conceptually
demanding because it requires one to think carefully about what is changing and what is staying
the same from one situation to the next, to describe relationships between quantities in
multiplicative terms rather than in additive terms, and to keep track of multiple pieces of
information at one time. In addition to being a foundational mathematics concept, proportional
reasoning relates to a wide range of situations in everyday life (Schliemann & Carraher, 1992)
and in the workplace (Hoyles et al., 2001), such as those that involve unit rates, mixtures, or
scaling (Langrall & Swafford, 2000). Proportional reasoning is also central in understanding how
robot movements can be controlled, as the relationships between the physical construction of the
robot, the values used to program the robot, and how the robot actually moves are often
proportional in nature.
The first math concept that relates to this situation is the very general idea of covariance
and quantitative relations. This math concept involves a recognition that as one quantity changes
there is a corresponding change in another related quantity. This sense of two quantities varying
together is not necessarily causal or directional. The fundamental aspect is being able to identify
and differentiate two quantities, each with their own distinct measure, and then be capable of
observing, predicting, and manipulating one with the expectation of change in the other. A
student might represent that covarying relationship verbally. For example, in the situation in
Figure 4, a student might respond that as the motor rotations increases the distance the robot
moves forward also increases. Other sorts of representations might include a mathematical
equation in which a variable corresponding to one quantity is on one side of the equation and a

22
variable corresponding to the other quantity is on the other side of the equation. Alternatively, a
student could capture the covarying relationship in a table that shows how the two quantities
change together in a variety of instances. Difficulties that students have with covarying
relationships may be less about the general idea that quantities can change together, and more
about being able to isolate the quantity from other related aspects. For example, when trying to
decide which of two characters were traveling faster, high school students suggested that both
characters went the same speed because they both went the same number of steps in the same
amount of time (Lobato & Thanheiser, 2002). This response suggested that they were focused on
speed in terms of how fast legs move, rather than the intended aspect of the situation, which was
how fast the whole objects (the characters) were moving in space. Similarly in this context,
students need to be able to distinguish a robot’s movement in space from the movement of its
wheels. This may be especially confusing when working with turning movements, since in that
situation both the wheels and the robot’s body are turning and the student needs to differentiate
those two to figure out how they relate to each other.
The second math concept that relates to this robot movement situation is the idea of
relative change. This math concept involves a sense that in some situations it is less appropriate
to ask “how many” more (or less) of some quantity there is in one situation compared to the next,
since that suggests that the relevant contrast between quantities in a situation is some absolute
count (Lamon, 1995; Sowder et al., 1998). Again referring to the situation in Figure 4, our prior
experience with this robot is that it moved forward 40 centimeters, so a student might respond
that there are 20 more centimeters to move forward in this move compared to the previous move.
Instead, it is more appropriate to approach some situations by asking the question “how much”
more (or less) of some quantity there is in one situation compared to the next (Lamon, 1995;

23
Sowder et al., 1998). This suggests that the relevant contrast between quantities in a situation is
some relative amount. Back to the example situation, a student who has recognized that relative
thinking would better apply in this robot situation might instead respond that the robot has to
move forward 1.5 times the number of centimeters in this move compared to the previous move.
A student with a strong understanding of relative change would be able to employ multiplicative
operations (multiplication and division) rather than additive operations (addition and subtraction)
in their representations of the relationships between quantities and in their problem solving when
using those quantities. Correspondingly, a student would reason about the situation with mental
operations of iterating and scaling (multiplication operations) and partitioning (division
operation). However, even though a student may be able to recognize and reason with relative
change in simple scenarios, such as when they want a robot to move twice as far as it did a
previous time, they may have difficulty applying those same ideas to situations that are more
complex numerically. Research on levels of proportional reasoning and associated strategies
suggests that indeed problems that involve integer ratios are easier for students than those that
involve non-integer ratios (e.g., ratios of 3/2 or 5/2), and even that problems involving halving
and doubling are easier still (Misailidou & Williams, 2003; Tourniaire & Pulos, 1985). Hybrid
sorts of reasoning are possible as well. For example, a strategy observed in some situations is
that a student will attempt to use a multiplicative strategy in a non-integer ratio problem by
scaling up from one situation to the other using the nearest integer multiple, but then will fall
back to an addition strategy to handle the remainder (Misailidou & Williams, 2003; Tourniaire &
Pulos, 1985). In the robot context, very few of the measurable quantities turn out to be “clean”
numbers, and so to apply relative thinking effectively, students will have to be able to problem
solve with and reason about non-integer relative amounts.

24
The third math concept that relates to this robot movement situation is the idea of
invariance. Although related to the concept of covariance, invariance suggests a different idea.
This concept is about recognizing that even as some aspects of the situation are varying, other
aspects of the situation stay the same. The invariant aspects of a set of situations can be used to
apply knowledge about one instance of the situation (or a set of instances) to a new instance in
which some aspects are unknown. In proportional situations, the invariant relationship between
quantities is always of a multiplicative nature, either a ratio or a product of two quantities. In the
situation in Figure 4, a student might recognize not only that the new distance is some relative
amount more than the previous distance (1.5 times as far), but also that that relative amount
should be the same for the corresponding quantity of motor rotations. Hence, the number of
motor rotations for the robot to move forward the new distance should also be 1.5 times as many
motor rotations as in the previous move (12 motor rotations). Other invariants exist as well. In
fact, in directly proportional situations there are two distinct invariant aspects. The first one is
that the relationship comparing two different instances of the same measure, referred to as a
comparison within measure spaces or a scalar operator, is invariant across the two instances.
This is the 1.5 times aspect of the example. A second aspect is that the relationship, referred to as
a comparison between measure spaces or a functional relationship, is also invariant. In the
example, because the same robot is being used in both moves, and because it moves at a constant
rate, the ratio of motor rotations to distance should also be the same in both moves. Simplifying
the ratio in this case it would be reasonable to conclude that since for 8 motor rotations the robot
moves 40 centimeters then for every 1 motor rotation it must have moved 5 centimeters.
Applying this same functional relationship to the new move, it is possible to figure out that using
12 motor rotations to move forward 60 centimeters would preserve that same 1 to 5 relationship.

25
A student with a strong understanding of invariance in proportional situations would be able to
recognize and use both invariants within and between measure spaces. In the robot context, the
functional rate also has an additional correspondence in the situation, since how far the robot
moves in one rotation is equal to the distance around the wheel (its circumference). A number of
researchers have explored how students (and teachers) come to understand and use a ratio-as-
measure (Lobato & Thanheiser, 2002; Simon & Blume, 1994). In these cases it is difficult to
develop an understanding that the ratio itself has real meaning in the situation and corresponds to
something that can be perceived directly (e.g., steepness or speed) even though in many cases
that ratio is difficult to measure directly and so is only quantifiable as a relationship between two
other quantities (Lobato & Siebert, 2002). It may be challenging for students in the robotics
context to be able to coordinate quantities of different measures, but doing so may have
advantages in understanding and problem solving in which those ratios have consequential
meaning.
A final math concept—and perhaps a more concrete rather than conceptual part of this
analysis of the domain—is the particular strategies that students use which are evidence of
understanding the proportional structure within robot movements. Although research has
documented a wide range of proportional reasoning strategies (Tourniaire & Pulos, 1985), the
most common valid strategies fall into two categories: scalar and functional strategies, which
were described in the previous paragraph. Hoyles, Noss, and Pozzi (2001) showed how these
different categories of solutions are both used by practicing nurses in place of formally taught
strategies. In addition, they show how the use of the strategies is influenced by both the
numerical structure of the problem but also by contextual factors specific to the workplace they
studied, such as the ways different drugs tend to be packaged. This situated aspect to the solution

26
strategies suggests that there may be a lot to learn and understand about the particular situational
factors that are involved in middle school students learning to connect proportional reasoning in
problem solving about robot movements. As a result, a focus for the studies described here won’t
be just about the answers that students get, but also about their strategies for arriving at those
answers and the extent to which they take advantage of the underlying proportional structure.
2.2.6 Research questions on environments for learning robots
The goal of the research studies in this part of the dissertation was to answer the following
questions about the ways in which introductory robotics students connect the math of
proportional reasoning with learning to control robot movements:
1. Do students connect math with their robot activities (focusing on the math of
proportional reasoning and its connections to controlling robot movements)?
2. If they do connect math with robots, what is the nature and level of those
connections?
3. What are the features of the learning environment that influence students’ ability to
engage with and make progress on making those connections?
4. What are the effects of the learning environment on learning and on engagement with
respect to math in robotics?

27
2.3 STUDY 1 – SCRIPTED INQUIRY
Study 1 was an observational study focused specifically on a formal learning setting—a
technology education classroom—that implemented a commercially available robotics unit. The
formal learning setting is characterized by providing a considerable amount of structure to the
learning environment. This is evident from a learning environment design perspective in that the
goal of making the connection between math and robots is much more explicitly valued and
targeted. The structure is also evident from a learning environment implementation perspective
in the sense that students are placed in learning situations in which they are strongly guided to
make those connections and so there will likely be many opportunities to observe those
connections being made.
2.3.1 Activity context
The robotics unit that was analyzed for this study was designed for a wide range of students from
upper elementary school grades to early high school grades as an introductory experience to
learning robots in a structured, step-by-step manner. Because of the level of structure provided
and because the activities were framed as “discovering” ideas, I will refer to this learning
environment as the Scripted Inquiry environment. Although the focus for this study was on a
classroom implementation with ninth- and tenth-graders, I have observed this same unit in other
settings with younger students and found a similar implementation in terms of the organization
of the activities and the types of student work that gets produced.

28
The designers of the unit were collaborators in the larger research program of which this
dissertation project is a part. The unit designers were from a nationally recognized robotics
education organization. Among other things, this organization develops curricula, leads teacher
professional development sessions, and hosts robotics competitions. The director of the
organization stated that the explicit purpose of this unit was to address, “technological literacy
and mathematical competency using robotics as the organizer” (Email, January 31, 2008). In that
sense, the unit had a very clear goal to teach students math with robots serving as the context.
All of the materials for the Scripted Inquiry unit were specifically designed to utilize the
LEGO MINDSTORMS NXT platform and programming software (Figure 2 and Figure 3). The
students built their robots using explicit instructions that would give them a common design that
was tailored to the activities in the unit. For example, one activity has the students build an
attachment that holds a marker right behind the wheel. When the robot makes a turning
movement the marker traces the path that the wheel moved. Students are then able to measure
the angle of movement as part of a unit activity on measuring turns. The robot was also designed
to support gears so that gear ratios could be the focus of one of the lessons. Thus, a key aspect of
the unit was to provide a carefully designed robot that could directly support the range of
activities in the unit and the targeted concepts.

29
Figure 5. Scripted Inquiry sequence of activities
The Scripted Inquiry unit was organized around a set of multimedia lessons (text,
animations, video, see Figure 5). The lessons were to be completed in order, alternating between
a behavior programming module (e.g., program the robot to move forward, program the robot to
follow a line using its light sensor, use gears to speed up the robot) and a related investigation of
a STEM conceptual idea (e.g., the relationship of distance traveled to wheel size and number of
wheel rotations, the proportionality between driving and driven gears in controlling the speed of
a robot). In this sense, the unit was carefully sequenced so that students were explicitly guided
toward building some behavior into the robot (e.g., creating and running a program to make the
robot move straight forward) and then subsequently transitioned to a related investigation which

30
attempted to clarify and connect the math ideas that underlie that behavior (e.g., the distance a
robot moves straight forward is equal to the number of motor rotations multiplied by the
circumference of the wheel). The STEM investigation units were the activities in the unit that
were intended to target the central mathematical concepts. For example, the “Wheels &
Distance” investigation targeted the math concepts of diameter and circumference, ratios and
proportions, means, and unit conversions (see Figure 6). The investigations also targeted science
ideas, such as experimental design and error analysis, but the focus of this study was on the
targeted math ideas.
Figure 6. Scripted Inquiry “Wheels & Distance” investigation introduction screen

31
Only the first four lessons of the unit were observed for this study. The lessons included:
(1) a building lesson involving learning how to program the robot to move straight; (2) an
investigation involving learning how the size of the wheels is related to the distance a robot
moves; (3) a building lesson involving learning how to program the robot to turn; and (4) an
investigation on how to measure turns and control how far a robot turns based on fractions of the
distance that the wheel has to travel to make the robot complete a full 360° turn. These four
lessons were chosen because the unit designers highlighted these particular lessons as those that
were best aligned with math concepts. The later lessons targeted other STEM concepts. These
lessons specifically targeted ratios and proportions in the form of unit rates and equivalent
fractions used both in the straight and turning investigations, but also connected to ideas of
measurement and data analysis as well. Although each investigation lesson had a different story
and targeted different concepts, all the lessons and activities in the Scripted Inquiry unit followed
an approach in which students were given very explicit instructions at each step and asked to
verify or test given relationships with provided representations and methodologies rather than
generating their own.
The students completed the lessons in teams of two or three. Each team had one robot
with which to work. In addition to the set of instructional screens viewed in a web browser that
led students through the activities, each lesson was also supplemented by paper-and-pencil
worksheets on which the students were to record their results and answer explicitly prompted
questions. The typical and most common mode of interaction for students in the Scripted Inquiry
environment was to be working with their team members around a shared computer terminal and
a robot. They then followed along with the instructions in the lesson to complete the activities.
On occasions when a unit task required them do so, they would run the robot on the floor or on a

32
nearby table, observe the results, answer questions on their worksheets, and then continue with
the unit activities. The teacher served primarily in a helper role, facilitating only when students
did not understand the instructions on the screen or were not able to implement the instructions
properly.
For this implementation, the unit designers took active roles in the everyday activities.
Although not part of the standard curriculum, the unit designers felt it was appropriate to provide
supplemental activities to the existing multimedia resources for this implementation. The main
additions and the justifications for each were: (1) add robot challenges that served to motivate
and contextualize the problems that were the focus of the multimedia units; (2) add daily warm-
up exercises of math problems both in robot and non-robot contexts to get students on-task from
the start of class period and focused on thinking about mathematics generally; and (3) lead a
number of whole-class discussions to introduce and then follow-up key activities in the unit
lessons that they anticipated would be difficult for students to understand fully just from their
teamwork and interaction with the standard unit activities.
An example of an added activity that was not part of the standard unit was the “Close
Shave” challenge (Figure 7). This challenge was added as an introduction to the first pair of
programming and investigation multimedia lessons that targeted moving straight distances. In
this challenge, students were to create a set of programs so that their robot could move straight
either 1, 2, or 3 floor tile lengths. The target number of floor tile lengths was randomly selected
at run time for each team, a LEGO minifig was placed at the end of the selected number of floor
tiles, and the team whose robot got the closest to the figure without tipping it over would win the
challenge. In addition to setting the context for teams to start the “Wheels & Distance”
investigation as a standard part of the unit, this challenge was also the focus of a follow-up

33
discussion about the results of the challenge intended to help students make some of the target
math ideas explicit.
Figure 7. Scripted Inquiry “Close Shave” challenge description sheet

34
In sum, the Scripted Inquiry environment was highly structured in terms of the activities
and steps that students engaged in when working with the robots, the order and connection of the
activities with each other, and the explicit connections to math that were made as part of those
activities. In addition, the tasks themselves were focused on building the capacity to program a
simple behavior, and then following up that with an investigation focused on verifying some
conceptual aspect of that behavior. But, supplemental challenges and whole-class discussions
altered the features of the standard environment, providing a natural contrast to observe the
resulting differences in how students connected the math ideas with those activities under those
changed conditions.
2.3.2 Method
2.3.2.1 Participants
A total of 16 ninth- and tenth-grade students participated from 1 section of an introductory
robotics course in an urban high school. The students worked in groups of 2 or 3 students per
group, which resulted in a total of 7 groups.
The study took place within the context of an elective robotics magnet program within
the school district. Because the program was open to all students throughout the district, the
participants were from a wide geographic range of neighborhoods from the city. This was their
introductory course for the program.
There were 20 total students in the class, but 4 students were excluded from the analyses
because they did not complete the pre- and post-assessments.

35
2.3.2.2 Data sources
Problem solving assessment
Disciplinary learning is the first of the two key outcomes of learning environments evaluated
within this framework. The Problem Solving Assessment was created to measure students’ ability
to solve quantitative problems in robotics and non-robotics contexts that aligned with the
instructional goals of the unit. The items for the measure consisted of a combination of released
items from the National Assessment of Educational Progress (NAEP) and isomorphic versions of
those same items that were modified to use a robotics cover story. NAEP items were selected for
inclusion in the measure that targeted concepts of proportional reasoning and concepts of
measurement. Measurement items were included in addition to the proportional reasoning items
based on the learning objectives associated with each of the prototypes and investigations in the
unit. Eight items were selected for each content category and a corresponding eight items were
created using a robotics context. Except for a few items that were grouped together, the items
were then randomly ordered. Finally, two forms of the assessment each with sixteen items were
created by alternating between the robotics and non-robotics form of each item except in the case
of the grouped items. Each student was assigned randomly to one of the two forms at pre and the
other form at post. The items used in both forms of this assessment are included in
Appendix B.1.
Based on the sample in this study, each of the two assessment forms was adequately
reliable (Cronbach’s α = 0.78 for Form A; Cronbach’s α = 0.84 for Form B). The forms were
also adequately reliable within the content categories (Cronbach’s α = 0.62 for the measurement
items in Form A; Cronbach’s α = 0.67 for the proportional reasoning items in Form A;

36
Cronbach’s α = 0.77 for the measurement items in Form B; Cronbach’s α = 0.75 for the
proportional reasoning items in Form B).
Attitudes survey
Disciplinary engagement is the second of the two key outcomes of learning environments
evaluated within this framework. Although disciplinary engagement may be measured in
particular moments of activity (Engle & Conant, 2002), it is less clear how to measure it as the
outcome of a whole unit or sequence of activities. In this series of studies, disciplinary
engagement was operationalized as an individual student’s ratings of their interest in the
disciplines of robotics and math. In addition, because the focus of these studies was on
facilitating students in making connections between these two disciplines, another aspect of
disciplinary engagement was considered to be an individual student’s ratings about the value of
one discipline in service of the other, in this case, math in service of robotics. The Attitudes
Survey was created to measure these two aspects of disciplinary engagement.
The engagement measure was adapted from validated scales of personal domain-specific
interest in mathematics (Köller, Baumert, & Schnabel, 2001; Marsh, Trautwein, Ludtke, Köller,
& Baumert, 2005) and of attitudes toward mathematics (ATMI, Tapia & Marsh, 2004). The
version of the math domain-specific interest scale used in prior research consisted of five items
for measuring interest or intrinsic motivation (Köller et al., 2001; Marsh et al., 2005). Three of
those items were selected for this study focusing on different facets of interest and intrinsic
motivation: “I enjoy working on mathematical problems” (affect), “I would even give up some
of my spare time to learn new topics in mathematics” (self-determination), “While working on a
mathematical problem, it sometimes happens that I don't notice time passing” (experiencing

37
flow). A fourth item from a separate inventory (Tapia & Marsh, 2004) was added in order to
include an item that was negative on the construct: “Mathematics is dull and boring”
(enjoyment). This item was reverse coded. These four items together made up the math interest
(MI) subscale for this study. A parallel set of items was created by replacing the term
“mathematics” with “robotics” in each of the items from the math interest subscale. The
resulting four items made up the robotics interest (RI) subscale for this study.
To capture students’ engagement in the connections between the disciplines of math and
robotics, an additional subscale was created to measure students’ attitudes about the relationship
of math to robotics. The value subscale of the ATMI (Tapia & Marsh, 2004) was modified so
that instead of measuring the students’ beliefs about the usefulness, relevance, and worth of math
in their life generally, it measured those same beliefs of math more specifically in robotics.
Similar to the two interest subscales, three of the original items that were positive on the
construct were selected. An additional item was modified so that it was negative on the construct
and so was reverse coded. The phrase “in robotics” or “about robotics” was incorporated in each
of the original items in place of more general phrases, such as “outside of school” or “in other
areas.” These four items made up the math value for robotics (MVR) subscale for this study.
In sum, the Attitudes Survey included three subscales: robotics interest (RI), math interest
(MI), and math value for robotics (MVR). Each subscale contained 4 items for a total of 12
items. The survey was administered in a paper-and-pencil format. Students responded to each
item on a 5-point Likert scale with response categories, −2 = Strongly Disagree, −1 = Disagree,
0 = Neutral, 1 = Agree, and 2 = Strongly Agree, such that positive values indicated a greater
interest or value and negative values indicated a lower interest or value. Individual scores on

38
each of the attitude subscales were constructed by calculating the mean of the ratings on the
items for that subscale. The items used in the Attitudes Survey are included in Appendix A.
Based on the sample in this study, the survey was adequately reliable both at the overall
level (Cronbach’s α = 0.80) and on the three subscales: robotics interest (Cronbach’s α = 0.65),
math interest (Cronbach’s α = 0.81), and math value for robotics (Cronbach’s α = 0.62).
Student work
Student work consisted of worksheets that followed along and supplemented the steps from the
multimedia screen. Students worked in teams on completing the worksheets, writing down their
answers to questions prompted by the multimedia screen, and showing their work when multiple
steps were needed. Other work included additional worksheets that students completed
documenting their strategies and results for challenges.
Observations and video of class activities
The author observed all whole-class and teamwork sessions. All of the whole-class sessions were
video recorded. The video camera was stationary and focused on the front of the room where the
instructor was leading the sessions. The unit designer (Mr. S) led all of the sessions as the
primary instructor, but was occasionally assisted by the organization director who attended the
whole-class sessions irregularly. The regular classroom teacher and the researcher participated
primarily as observers. The whole-class sessions occurred both to introduce units and activities
on which the students were about to start and to follow-up units and activities that they had
completed. Although there were some explicit instructions and guidelines for these discussions
in the teacher materials distributed with the unit, the focus of the discussions in this study were

39
adaptively chosen by the unit designer based on what was most relevant for the students at the
time, especially when discussing the challenges. The structure and substance of these sessions
varied considerably from one to the next. When the unit designer created some artifact in
preparation for or in the course of the whole-class session, that artifact was also collected and
used to supplement analysis of the video.
Interviews
Five students were interviewed after completing all of the activities in the robot unit. The
interviews were semi-structured with a focus on understanding what about the unit activities
were interesting to the students, their views about the connection between robots and math in the
unit activities and more generally, and their sense of how to improve the unit activities. See
Appendix C.1 for the list of questions. The students were chosen to reflect a range of
achievement levels based on their performance on the post Problem Solving Assessment.
Interviews were conducted with three higher-achieving students (two female and one male) and
two lower-achieving students (both male). A lower-achieving female student was approached
about participating, but elected not to participate in the interview part of the study.
2.3.2.3 Study design
Performance on the Problem Solving Assessment and responses on the Attitudes Survey were
used as the dependent measures of disciplinary learning and disciplinary engagement
respectively. The other data sources were used to identify the nature of the connections that
students made between math and robots, and to identify the features of the learning
environment’s structure that influenced those connections.

40
2.3.2.4 Procedure
The class under study met every day of the week for forty minutes during the last class period of
the day. The robotics unit was started on the first day of the second semester of the school year.
In that first day, one of the unit designers made a presentation to the students introducing them to
the unit and the pre Attitudes Survey was administered. Students were given 5 minutes to
complete the Attitudes Survey. The students then spent the next several days building the robots
that they would use for the unit activities. On the sixth day the pre Problem Solving Assessment
was administered. Students were instructed to give an answer for every question, to show their
work, and were permitted to use a calculator. They were given 30 minutes for the Problem
Solving Assessment. The students then participated in the standard unit activities plus the
additional activities supplemented by the unit designers, which included challenges, whole-class
discussions, and warm-up problems. At the conclusion of the first two sets of behavior
programming and STEM investigation units (after 30 class periods), the post assessments for
both attitudes and problem solving were administered during the same class period. The students
then continued to work through the remaining prototype and investigation activities from the
standard unit, but with less direct intervention from the unit designers. Individual interviews with
selected students (video recorded) were conducted after the students had completed all of the
standard unit activities (after 50 class periods).

41
2.3.3 Results
2.3.3.1 Problem solving assessment
The first primary outcome of the study was students’ changes in problem solving ability.
The assessment included items targeting both proportional reasoning and measurement in both
robotics and non-robotics contexts. Descriptive data from the Problem Solving Assessment are
reported in Table 1. The data were analyzed using a multivariate repeated measures ANOVA
with three dependent measures (proportion correct on the overall assessment, the proportional
reasoning items, and the measurement items) and two within-subjects factors: time (pre, post)
and context (non-robotics, robotics). For the overall multivariate ANOVA there was a marginally
significant main effect of time, F(3,13) = 2.59, p = 0.10, η2 = 0.37, but no significant main effect
of context, F(3,13) = 0.31, p = 0.82, and no significant interaction between time and context,
F(3,13) = 0.84, p = 0.50. This indicates that participation in the Scripted Inquiry unit may have
had only a small positive effect on students’ overall problem solving from pre to post.
Follow-up tests on each of the dependent measures revealed that there was a significant
main effect of time on the measurement problems, F(1,15) = 8.62, p = 0.01, η2 = 0.37, and a
marginally significant effect on the overall assessment, F(1,15) = 3.16, p = 0.10, η2 = 0.17, but
no significant effect on the proportional reasoning problems, F(1,15) = 1.01, p = 0.33. Post-hoc
comparisons using a Bonferroni adjustment indicate that mean difference from pre to post for the
non-robotics measurement problems was significantly greater than zero (M = 0.2, 95% CI [0.03,
0.35]). The difference between pre and post for robotics measurement problems was not
significant, nor were any other pairwise comparisons. This suggests that there were not enough
evidence to conclude that students’ experiences in the Scripted Inquiry unit had a positive impact

42
on their problem solving specifically in the robotics context or on their understanding
specifically of proportional reasoning. However, the positive impact of the unit on students’
problem solving in non-robotics measurement problems may indicate that the students learned
more general skills related to measurement, but that those skills may not have been strongly-
connected with their knowledge of robots.
Table 1. Scripted Inquiry problem solving outcomes results
Pre Post
Measure M (SD) M (SD) r d
Overall
Non-robotics 0.5 (0.2) 0.6 (0.3) 0.4 0.5
Robotics 0.5 (0.3) 0.6 (0.2) 0.6 0.2
Measurement
Non-robotics 0.5 (0.2) 0.7 (0.3) 0.4 0.7*
Robotics 0.6 (0.3) 0.6 (0.3) 0.4 0.1
Proportional Reasoning
Non-robotics 0.4 (0.2) 0.5 (0.4) 0.3 0.4
Robotics 0.4 (0.3) 0.5 (0.4) 0.5 0.1
+ p < .10. * p < .05. ** p < .01. *** p < .001.
2.3.3.2 Attitudes survey
The second primary outcome of the study was students’ changes in attitudes about robots and
math. Descriptive data from the Attitudes Survey administered pre and post are reported in

43
Table 2. The data were analyzed using a multivariate repeated measures ANOVA with four
dependent measures (average rating on the overall scale, and on the robotics interest, math
interest, and math value for robotics subscales) and one within-subjects factor: time (pre, post).
Although both at the overall level and on each subscale, students’ attitudes changed negatively
from pre to post, on the overall multivariate ANOVA there was no significant main effect of
time, F(4,12) = 1.05, p = 0.42. A follow-up test revealed that for the math interest subscale there
was a significant effect of time, F(1,15) = 5.21, p = 0.04, η2 = 0.26, but there was not a
significant effect on the overall scale, F(1,15) = 2.28, p = 0.15, or on either of the other subscales
(F(1,15) = 0.69, p = 0.42 for the robotics interest subscale, and F(1,15) = 0.17, p = 0.68 for the
math value for robotics subscale). This indicates that there was not enough evidence to suggest
that participation in the Scripted Inquiry unit had a negative impact on students’ level of
engagement with robotics overall, but participation in the unit did have a significant detrimental
impact on students’ engagement with the discipline of math specifically.
Table 2. Scripted Inquiry attitudes outcomes results
Pre Post
Measure M (SD) M (SD) r d
Overall 0.2 (0.6) 0.1 (0.6) 0.7 −0.3
Robotics Interest 0.0 (0.8) −0.2 (0.9) 0.7 −0.2
Math Interest 0.4 (0.9) 0.1 (0.9) 0.8 −0.4*
Math Value for Robotics 0.3 (0.7) 0.3 (0.6) 0.5 −0.1
+ p < .10. * p < .05. ** p < .01. *** p < .001.

44
2.3.3.3 Student work
Student work from the standard unit materials consisted of completed worksheets that were
provided as supplements to the multimedia activities. In all cases, the work included records of
numerical measurements and the results of calculations based on activities completed with the
robots. In that sense, all of the work included some sort of mathematical activity. Only in rare
cases did students include verbal explanations along with their measurements and calculations,
and these were mostly limited to direct prompts from the worksheet rather than as explanations
of a recorded numerical value. In many cases, the written work was exclusively the numerical
result placed in the appropriate spaces on the worksheet. In some cases, students showed their
work by also recording their operations when obtaining a calculated value. This provided
evidence that all students participating in the activity did participate in some form of
mathematical activity. However, most of that mathematical activity consisted of working with
and recording numerical values (both measured and calculated).
Student teams did, however, also document some of their work in the additional
challenge activities. For example, in the “Close Shave” challenge they were asked complete a
worksheet in which they were to fill in the three duration values they used in their programs for
each of the three distances, explain their strategy for finding their values, and then transfer their
strategy to a new distance (7.5 tiles). Recall that this challenge activity occurred prior to
engaging in the standard unit activities on straight distance. In this challenge activity, the
solution strategies did vary substantively. One team used seconds as the units for their duration
value, two other teams used rotations units, and the remaining two teams used degrees as their
units. Their explanations of their strategies also varied and almost never included only numerical
values or calculations. All five teams that completed the worksheet reported doing an initial

45
guess and then adjusting the value till they got the movement distance correct. Of those five, two
of the teams reported using doubling and tripling from that correct value to get a value for the 2-
tile and 3-tile distances (a scalar-based strategy). One of those two teams used that calculated
value as their final value; whereas the other team adjusted that calculated value further by fine-
tuning it until the results were satisfactory at each tile distance. A third team reported that they
guessed “it took 1 second for each tile,” and their results suggest they used that unit rate as the
initial basis for their guesses for all three tile lengths, but then fine-tuned that value until the
timing was right for each one. The responses to the transfer question were harder to classify,
presumably since most of the teams guessed in the first place, and only the team that used a
scalar strategy in the initial challenge was able to apply their strategy directly in this transfer
problem. It is not surprising that many of the students used guessing initially given that this
activity took place prior to the standard instruction units, but it is notable that the challenge was
designed to make the patterns salient when scaling distance up from a base value, and three of
the five teams did try to incorporate that aspect into their solution strategies at some level
without being given such a strategy directly. In sum, for this more open-ended activity three of
the five teams utilized some sort of mathematical activity based on scaling in their strategies.
2.3.3.4 Whole-class discussions
The whole-class discussions from the robotics unit did include lots of math. That is, the talk dealt
directly with concepts such as percents, operations on decimal numbers, and statistics of central
tendency, among many other math concepts. And each of those math concepts did follow
directly from the activities of the unit. In the implementation for this study, however, some other
important themes emerged about the substance of the whole-class discussions, their connections

46
to the activities of the unit, and the way in which they connect math and robots. I explore those
themes with two contrasting whole-class discussions. The first discussion occurred right after the
students completed the first STEM investigation—“Wheels & Distance”—as a way to review the
main ideas for that unit activity. The second discussion occurred two days later in response to the
“Close Shave” challenge that was completed prior to beginning the “Wheels & Distance”
investigation. The winner of that challenge had not yet been announced, and so the unit designer
took that as an opportunity to plan a discussion around how to determine which team was the
closest team given that the teams were not all required to move the same distance. I describe
each discussion in turn and then compare between them.
Post-investigation discussion
The goal of the “Wheels & Distance” investigation was to understand the relationship between
wheel size, motor rotations, and distance traveled, and ultimately be able to use that information
to make a robot move a given distance forward. The approach taken in the robotics unit was to
have the students test a hypothesis equation that was generated by a fictional robotics researcher.
Students were to calculate out theoretical values based on the hypothesis equation and test those
values against actual values they measure from testing out on the robots. They were to use two
different sets of wheels to see if the hypothesis equation worked for different wheel sizes.

47
Figure 8. Scripted Inquiry post-investigation whole-class discussion data table
In this discussion, the students have completed the investigation activities, so the unit
designer wants to review what they found and focus on percent error as a statistic for
determining whether the actual and theoretical values are the same. An empty version of the data
table in Figure 8 is projected onto a screen in the front of the classroom and the class fills out the
cells together, the result of which is the completed data table in Figure 8. After completing all
but the rightmost cell in the first data row, the unit designer introduces the problem as:
125. Mr. S: So, we said, we gotta check that value, that 34.54, the theoretical. And we got this measurement, 36, are they close enough?
126. Students: Yes.
127. Mr. S: How do you know?
128. Lance: Not that close, but…
129. Mr. S: What if it was 37, would they be close enough?
130. Lance: Yeh.

48
131. Mr. S: How about 38?
132. Students: No.
133. Mr. S: 39?
134. Students: No.
135. Mr. S: 38 and a half?
136. Students: No.
137. Mr. S: What about like thirty-nine point, or thirty-seven point nine?
138. Students: No … Yeh … Maybe
139. Lance: No, that’s too close to 38.
140. Mr. S: Okay, so, the point I am trying to make here is there’s not like a line, where we say, yes/no. It’s actually kind of a grey area. The farther you get, the more you kind of go, uh [puts up hands weighing both sides]. And if it’s real close, you know, then it’s really obvious. Okay, so this thing called percent error is just there to tell us, how close are you. What percent is the difference? Like how different are they? Okay?
The unit designer used questioning to elicit the idea that the absolute difference between the
theoretical values and the average of the actual values is not sufficient for determining whether
the actual and theoretical are indeed different. He then proposes percent error as a better way to
solve this issue. The unit designer then walks the students through a calculation of the percent
error for the first row of data—the data on the robot with the standard wheel moving two motor
rotations.
Together, the class calculates the percent error for that row as 4.2% using the calculations
recorded in the rightmost cell of the first data row in Figure 8. Then the unit designer returns to
the original question now framed around the percent error statistic:

49
141. Mr. S: Okay, so what is that number, it is 4.2%. That means that these two numbers, the theoretical and the actual are 4.2% different from each other. Is that a lot? Does that sound like a lot?
The students give a range of “yes” and “no” responses, but most students do not take a position,
and only one student articulates reasoning about the magnitude of percents:
142. Tanisha: Percents are a lot, but that’s not a lot different. It’s like in between. Oh, out of 100.
So the unit designer decides that each student should vote. Presumably he did this to make sure
that each student was engaged with the question, but it becomes clear in the ensuing discussion
that not all students know how to make an informed choice. Lance articulates this reasoning:
143. Lance: It all depends on what you are talking about here. You know what I’m saying? It’s not that easy.
144. Mr. S: It’s 4.2. Okay.
145. Tanisha: 4.2 out of 100.
146. Mr. S: If you think that they are not different, wait, did I just do that? Not different, raise your hand.
147. Students: [various responses]
148. Lance: Yeah, they are different, but understand like, it’s hard to pick which one. I don’t know.
149. Mr. S: And then, totally confused, but really paying attention?
150. Tyrone: Oh, I’m, yeh, right here.
151. Kurt: Yeh, that’s what’s up, right there.
152. [Student]: Totally confused. I just…
153. Lance: 4.2 could be a lot in different cases.

50
154. Mr. S: Then let’s look at this then. Let’s do the next one, and we’ll see. Maybe we’ll find out 4.2 is a lot, maybe we’ll find out it’s not. What did you get when you measured the small wheels? You guys are going to guide this one instead of me.
The unit designer recognizes the confusion and decides that moving onto the next row may
alleviate some of the concerns by providing a point of comparison. So the class works through
the calculations for the next row together—the data on the robot with the small wheels, also
doing two motor rotations. They determine that the percent error for the small wheels is 7%,
which they then agree is bigger than the 4.2% percent error for the big wheels. But this is a
questionable conclusion to make given that even though the wheel sizes changed, the hypothesis
equation was the same in both cases, so theoretically should have either been correct or incorrect
in both cases as well. Instead of resolving this issue directly, the unit designer chose to move on
to a set of “made-up” data on a 7-cm diameter wheel. The justification for this was most likely so
that the students could have additional practice with the calculations and procedures for
determining percent error, even though the interpretation of that value was still problematic. The
central question of understanding the relationship between motor rotations, wheel size, and
distance traveled was not addressed directly in the discussion.
Post-challenge discussion
This whole-class discussion occurred two days after the post-investigation whole-class
discussion even though the actual challenge had occurred many days prior. The unit designer sets
up this discussion by providing students a handout with each of the teams “Close Shave”
challenge results including the team ID, the distance the team’s robot had to travel (1, 2, or 3
tiles), the absolute difference between the robot’s final position and the minifig, and a column

51
that he calculated in advance that divided the absolute difference by the number of tiles to get a
more standardized measure. The data table from the handout is included in Figure 9.
Figure 9. Scripted Inquiry post-challenge whole-class discussion data table
The unit designer opens the discussion:
155. Mr. S: Okay, so, you guys asked me yesterday who the winner was, and I went back to what we had recorded and I looked at it. I figured, well, who really is the winner here? Because what we said was, whoever gets closest to the man, right? Or the minifig. And then I took a look at one, how the numbers worked out again, and uh, somebody had brought up that it didn’t seem fair that teams that just rolled an unlucky number or flipped an unlucky coin and got to go the really far one would have to come just as close to one that only had to go this far. So, what I did was, I took a look at the distance that you ended up from the figure versus how far you had to go. And I want you guys, actually, to pick the winner. That’s why I took the team names off of these, so there’s just numbers. So you tell me, who’s actually closest?

52
The students shout out teams that they think should win mostly based on the absolute difference
values (the “Final Distance to Minifig” column in Figure 9), so the unit designer tries to push
them further by asking them to explain their reasoning and then getting them to attend to the
different distances each team had to travel (the “Tiles to Move” column in Figure 9).
156. Lance: I mean, I don’t know what you are saying.
157. Mr. S: Okay, okay, so, let’s, if I gotta get close to this table, right? And it’s right here versus it’s down there. Did you ever play like golf, or something? You know, anything where you gotta get close to something. If it’s really far away, it’s hard to get closer, right?
158. Darren: Yeh.
159. Mr. S: If it’s like right here, well, you should be able to get it in.
160. Lance: Yeh.
161. Mr. S: Same idea. How come the team that had to shoot three squares, should be graded just as far as the one that had to only go one?
162. Lance: Oh! So it ain’t fair, nah.
The analogy with the golf game does seem to work in getting the students to attend to the
different distances each team had to do, but the students don’t immediately see a clear resolution
and advocate instead redoing the challenge. Mr. S, the unit designer, tries to redirect their
thinking to the “% difference” column in Figure 9 as an alternative way to judge teams across
different distances:
163. Tia: No, he’s saying why don’t we do it over and give us all…
164. Mr. S: All the same one?
165. Tia: Yeh.
166. Mr. S: Okay, that might be a fair way to go about it, but I mean, we have already run it, and this is how, this is the data we got. This is the results. So, look at that very last column.

53
167. Tia: You wouldn’t be able to…
168. Mr. S: I don’t know if you guys recognize it, but that’s the same thing you had to do when we were comparing the di…, the way the robot went. We are just comparing how far off you were from the guy, divided by how far you had to go the whole total distance. So if your whole total distance was bigger, and you divided by a bigger number, then even if you had like three times as off, and you had three times as far, you got to [?] the same number. Does that sound fair? Or…
169. Tanisha: Well, why don’t you divide them all by the same number?
170. Mr. S: Well, because they went different distances. Like the one that went one square, divided by one square. The ones that went two squares, divided by two squares. So they could be twice as far off at the end, but still work the same. Does that sound fair or not? Yeh.
171. Tia: No, it’s not going to be fair any way you put it.
172. Tanisha: Well, why don’t you divide then?
173. Mr. S: I did. That’s what that last column is.
Although not all students followed the particular solution that the unit designer offered to
standardize the differences, some students began to pick up on the same idea and offer their own
solutions. For instance, Tia offered a multiplying solution instead of a dividing one:
174. Mr. S: Yes, okay, why Team 5?
175. Tia: Because they had to go further than Team 2 went. And if you would have multiplied the difference by 2, it would have been farther.
176. Tanisha: That’s what I said. Why don’t you just divide them?
177. Mr. S: Multiple the difference by 2? Why 2?
178. Tanisha: Because there’s three tiles…
179. Tia: Because there’s two [?]

54
180. Mr. S: Did you say multiply or divide? I am sorry, I didn’t hear you.
181. Tia: Multiply.
182. Mr. S: Okay, so it should count like a 2.0cm off?
183. Tia: Huh?
184. Mr. S: Well you said multiply it by 2, so I multiplied 1cm by 2.
185. Max: Whose team won? Whose team won?
186. Tia: If you were to, alright if you were to take this and suggest like, okay, if they were to go 2 tiles, then it would be .6cm off. And then you multiply the difference.
187. Mr. S: Okay. Okay, I see what you are saying. So you are saying if you compare Team 3 and Team 5.
188. Tia: Yeah.
189. Mr. S: And you look at Team 3 and you say, well you should double that, because you know, if you scaled it up perfectly it would be twice as far and they would be twice as off. Is that what you are saying? And so the .6 is still less than the 1.0?
In this case, the unit designer understood what Tia was trying to do and so restated her idea so he
could confirm it with her and make the reasoning more visible to the rest of the students in the
class. Ultimately, the class does not come to a full resolution as to the winner and decides to take
a vote, but the talk in the discussion suggested that many of the students were actively engaged
in the idea of trying to find a way to fairly compare across teams that had to travel different
distances. Furthermore, they began to use the ideas of scaling and relative amounts in their
thinking about the situation. But, similar to the post-investigation discussion, this post-challenge
discussion never addressed directly the central robot movement question of understanding the
relationship between motor rotations, wheel size, and distance traveled.

55
Contrasting the discussions
Comparing and contrasting the two discussions, some important differences emerge that may
have influenced the quality of engagement in the discussion. See Table 3 for a summary of the
contrast between the two discussions, but I will discuss each in turn. One difference was that in
the post-investigation discussion, the majority of the discussion happened over only one data
point. Even though they eventually generated other data points, they served mainly as examples
of the same theoretical prediction rather than comparing against a different theoretical prediction.
This made the question of whether the percent error between the actual and predicted values was
large or small a difficult one to answer. In contrast, in the post-challenge discussion there were
five data points to compare from the beginning of the discussion, and all were directly relevant to
the main problem of determining who should be declared the winner of the challenge. In
addition, the unit designer re-represented the data so that students could focus on the most
relevant aspects of the data to determine which group was actually closest relative to the distance
they had to travel. Although the students still needed some assistance in attending to the target
conceptual issue of relative differences, they did eventually do so and engaged productively in a
discussion around that issue.
A second contrast was that in the post-challenge discussion, some time was spent just
trying to understand the problem and question being asked. The unit designer had to improvise in
providing appropriate analogies so that students could attend to the problematic parts that were
connected most closely with the goals of the activity. That was not the case in the post-
investigation discussion, where instead, they went through the activity in a procedural, step-by-
step way. Related to this, students’ seemed to understand the post-challenge problem not just in a
numerical sense, but also in a situational sense as well. The issue that it wasn’t fair for the teams

56
that had to move their robot further to be judged on the same absolute scale as teams that moved
less far was something that the students’ eventually understood well and responded to with
reasonable solutions that had real meaning within that situation. The post-investigation solutions
never achieved that level of meaning, and if anything, seemed to move further away as
discussion went on and they practiced more iterations of the same calculations without making
meaning of the whole activity and generating a solution to the central problem.
Table 3. Features of contrasting Scripted Inquiry whole-class discussions
Feature Post-investigation Post-challenge
Problem resources
One data point initially, later generated two other data points (one real, one fake), but all within the same theoretical hypothesis (varied on wheel size)
Six data points all based on actual data from team performance, at a range of distances, and in a clear table with only relevant data
Problem understanding
Did not directly respond to the “it depends” criticism or provide a way to judge when a percent error was large enough to justify “far” versus “close” (instead, provided more practice of the calculation of percent error)
Improvised analogies (golf) and worked with student questions to develop the problem
Problem engagement
Low level of engagement from students to determine whether fictional character’s hypothesis matches with actual data
High level of engagement from students to determine which team deserved to win the challenge
Target disciplinary content
Percent error as a statistic for determining whether actual data supports a theoretical prediction
Percent error as a standardized way to judge deviation from a target for different distances

57
A third contrast may have been something that was determined prior to the discussion.
That is, students’ engagement in the problem at all. In the post-investigation discussion, the
students’ did not express any interest in determining whether Dr. Turner’s hypothesis equation
captured the actual movement data of the robot. The problem itself was not engaging. In contrast,
in the post-challenge discussion students’ were very interested to know which team had won the
activity and so were in engaged in the overall problem from the start.
Despite these salient contrasts between the two discussions, what was particularly
striking was that neither discussion centered on issues that were related to understanding robot
movements in a direct way. The whole-class discussions were more focused on understanding
variability of collected data—theoretical versus actual measurements, measured versus
calculated values, percent error, etc. Very little attention was paid to using the actual physical
context as a resource for thinking about the data—how the theoretical idea of predicting how far
the robot would go as a function of the number of motor rotations was dependent upon the size
of the wheels of the robot, or how the variability of distances traveled might be larger for larger
distances and larger wheel sizes.
This non-physical-context focus is particularly salient in the post-challenge whole-class
discussion. Recall that this challenge activity was added onto the original unit activities with the
intention of providing an initial exposure to students to some of the proportional patterns, and a
number of teams tried to reflect those patterns in their solution strategies. What was interesting,
however, was that the discussion around the data collected did not focus on this proportional
pattern between rotations and distance. Instead, it turned out to be further illustrative of the non-
physical-context focus as the students tried to sort out which absolute difference would be the
winner given that not all the teams had to do the same distances (a percent error problem as

58
modeled by the designer/teacher). They engaged in a debate in which the teacher helped them to
understand the problem and then they argued for different teams as being the true winner. But
the main idea that distance is related to the number of motor rotations or to the size of the robot’s
wheels was never addressed explicitly. It was also the case, that teams’ actual strategies for
solving the problem were not addressed explicitly, only the final results of their movements. In
sum, although the post-challenge discussion was overall more engaging and the students
presented more meaningful arguments in the discussion compared to the post-investigation
discussion, neither discussion helped students focus on the core issues of understanding how to
make the robot move specified straight distances.
2.3.3.5 Interviews
A couple themes emerged from the interviews with individual students that occurred after
completing the entire robotics unit. The themes included: (1) a feeling that working with the
robots to make them do things is preferable to working only on the computer, but that only
making the robots do simple things was of limited interest even when connecting the math added
challenge to the task; and (2) a sense that math does help with robots, but primarily because there
are numbers involved (the program parameters and measurements) and so the math provides a
more efficient route to getting the answer.
Making the robots do things is interesting, but doing overly simple things is not
Although exceptional, there was one case in which a student was just interested in the activities
without qualification:
190. Tanisha: I’m always interested.

59
191. Mr. E: Always? [Tanisha nods.] Okay. So why are you always interested?
192. Tanisha: Cause I love math. It’s my favorite subject. And I like to work with robots. I like to build things. I like hands-on things.
Most of the interviewed students, however, were more particular about what sorts of activities
they felt were interesting. For example, this student makes a distinction between doing problems
only on the computer versus actually trying them out physically:
193. Tia: I feel like I did a lot more in middle school than I do in high school. A lot more hands-on stuff, and a lot more, like now, I don’t know, everything’s on the computer. Of course, you have to set up the robots and stuff on the computer. This class wise is okay, but my other classes that I have, we sit there. We do the computer the whole day. The whole period.
194. Mr. E: What are those classes? What are they called?
195. Tia: My Robotic Tech II class, we sit on the computer. This is Robotic Tech I.
196. Mr. E: So you don’t work with robots?
197. Tia: In my other class? No. We’re on a computer. We learn about series and parallel circuits. And things like that. And everything’s on the computer. And I feel like, in that class, we can have way more hands-on stuff. Cause I learned about series, and the components, and the capacitors, and things, but I was working with them. Now you just do them on the computer. You sit there.
She expressed that in this unit, they did do a lot of hands-on work with the robots, and she felt
that was positive. Tanisha and Tia were the two high-achieving females interviewed, both of who
said that math was their favorite subject, so they may not have been representative of all the
students in the class. Still, Kurt, a lower achieving male reaffirmed the idea that hands-on

60
activities are better than activities only on the computer by comparing to the activities they did in
the same course during the first semester:
198. Kurt: I’m always interested. I mean like, I like robots and stuff. Like, […mom…] when I’m home I’m always fixing stuff, taking stuff apart. I like robots and stuff. That’s why I signed up for the program. But, like, at the beginning of the year, like I really didn’t like it at all, because it wasn’t really what it said it was. It said it was Robotics Tech, but we was doing nothing with robots. And then when y’all came, I was real interested and stuff, because we could like really work with robots and stuff.
But the other two male interviewees suggested even when working hands-on with robot that the
particular types of robot activities mattered a lot. They both suggested that the work in this
robotics unit was not as interesting as it might have been. Darren, a higher-achieving student
made the distinction between working with robots doing simple tasks versus more complex
tasks:
199. Darren: To do more stuff with a robot. We could make it do different things, instead of just moving forwards and backwards.
200. Mr. E: Like what?
201. Darren: Like, noise level. Like, how to make it, um, follow your commands, and everything.
Lance, a lower-achieving male, articulated a similar idea:
202. Lance: I mean, when they told me, okay, as I go older, stuff was going to get more challenging, do different things, LEGO robots was not nothing that came to my mind. That was something I felt like I should have did back then [in 8th grade].
203. Mr. E: So you don’t feel like it’s challenging?

61
204. Lance: I mean it is challenging, but it’s boring. This ain’t interesting to me. Watching a robot, programming a robot to do something, that’s not, I mean, it all depends. Like we’re programming our robots to follow a light, this, this, and that, like, it’s just boring. Like, I see if we did it every once in a while, but we’re doing this, we’ve been doing this everyday for like a couple months now.
205. Mr. E: So you don’t see programming this robot to do anything that’s really?
206. Lance: No, it can do stuff, but it don’t interest me, that’s all.
Lance goes on to articulate that other activities that he did in middle school, such as building and
racing CO2 racecars and building and launching rockets, were more interesting to him than the
particular tasks that they did in this robotics unit. One interpretation of both Darren and Lance’s
comments would be that the LEGO robots themselves were uninteresting, and there is certainly
that element, but there is reason to believe that more complex tasks and challenges may have
been sufficient to engage them. Overall, across the interviews there was a sense that working
with robots in a hands-on way is engaging, but in order to sustain that engagement the types of
tasks that you do with the robots have to be more complex than trying to understand just basic
movement behaviors.
The role of math in robots is to provide an efficient route to the answer
Another theme that emerged from the interviews related to the students’ views about the role of
math in robotics. Since the interviews were only conducted subsequent to the unit activities it is
not possible to determine whether these views existed prior to participating in the unit. However,
some of their responses do suggest specific parts of the unit activities that influenced their ideas.
In general, the students seemed to hold the belief that math is connected with robotics, and math
can be very helpful in solving robot problems. For example, Tanisha articulated both how math

62
was used to measure and calculate aspects of the robot’s design and behavior and that those
mathematical ideas worked well:
207. Tanisha: Like when we had to find, um, how long the distance, how much, how long, like, how far the robot would go. We had to use, like, calculate the rotations, and use pi, and stuff like that, toward the wheels. And like, most of the time when we did the project with, uh, our projects with, when the people made an educated guess, what do they call it? Hypothesis.
208. Mr. E: Sure, yeah.
209. Tanisha: They were usually right, when we use the math, when we do the math.
210. Mr. E: It worked well?
211. Tanisha: Uh-huh.
She then goes on:
212. Mr. E: Do you think [someone who knew robots, but not math] would not be as good as someone who knew math and robots? [Tanisha nods.] Yeah? So what would that person who knew both, what would, how would they be better?
213. Tanisha: Because they know exactly what they’re doing. Like, if they have a problem, like, with math or anything, they can solve it easily. They figure out the problem in the robot.
Other students made the connection between math and robots as being primarily about working
with numbers. For example, Darren, a higher-achieving male responded to whether math is
helpful for doing robots by saying:
214. Darren: Yes. Cause you gotta get the threshold and everything. And it has numbers. And basically what math is is numbers.
Lance, a lower-achieving male, expressed a similar idea about the connections between math and
robots being about manipulating numbers, but then went further to suggest how the numbers
doesn’t compel the math, but using math with the numbers distinguishes those who know how to

63
get answers compared to those who are just guessing. When asked if he could imagine someone
being good at robots, but not good at math, he responded:
215. Lance: No. That’s just weird. I mean, there can be, but that’s just weird. It’s like the same thing, for real. You gotta use numbers with the robots.
216. Mr. E: Some people just put numbers in. Just try. Is that not doing math?
217. Lance: That’s just guessing. You can guess forever. Instead of just doing the math. You gotta do the math to get the answer.
Tia, the other higher-achieving female expresses an idea about the relationship between math and
robots that is consistent with the rest of the interviewees. She articulates both that the connection
between math and robots is primarily about manipulating numbers, and that someone who didn’t
know how to use math in the robot context successfully would be limited. When asked if math is
helpful for doing robotics, she replied:
218. Tia: It is, cause you have to know the degrees. You have to know things, yeah. And how to add and subtract. So, yeah.
219. Mr. E: Do you think someone could be good at robotics, but not very good at math?
220. Tia: You could, but not that good. You wouldn’t go that far. No.
Tia reported that she thought of herself as being good at math but “okay” with robotics. But then
she went further to explain why she thought of herself as just okay at robotics. She replied that
robots includes math, but is not just math, as it also includes other stuff:
221. Tia: You have to memorize the programs, and the things, and the A wheel and the B wheel, and no. Uh-uh. That stuff will change, and it can change. And math is the same, so.
222. Mr. E: So, I’m trying to say, I’m trying to figure out what do you mean by the same?

64
223. Tia: Like, math, if you add one plus one, it’s always going to be two. But with the wheels, if you add A and B, if you do the A wheel and the B wheel, it might do the same thing, but it will go a distance farther. Or, it’ll, there’s just different, it’s too much. Too much. Then you have to learn different programs, and different, uh-uh.
Again, Tia’s response further illustrates that math is seen as a resource for manipulating and
working with the numerical values that are used with robots. But her elaborated response
suggests that math isn’t used to understand the way robots work directly, such as to be explicit
about the relationships between aspects of the robot and its resulting behavior. Understanding
robots from Tia’s perspective seems to be about memorizing a large set of things without much
in the way to unify them. Her lack of comfort with the “change” associated with robotics
suggests that although the specific tasks that she had to do with robots in this unit were not
difficult for her, she didn’t grasp the underlying, more general ideas that may have consolidated
some of that vast amount of stuff for her. In this sense, the connection of math to robots may
have been limited for her. Given that Tia was a higher-achieving student, it is likely that other
lower-achieving students and less-able math students in the class may have held similar ideas.
2.3.4 Discussion
In sum, the Scripted Inquiry approach had mixed results for helping students productively
engage with and learn about how to control robot movements using math. In terms of learning,
the students did make a significant improvement in their problem solving, but the improvement
was not in proportional reasoning and was not in the robot context problems either. The
qualitative data in the whole-class discussions also suggests that the math that the students were
learning may not have been tightly aligned with their understandings (and misunderstandings) of

65
robot movements. Rather, whole-class discussions focused on other math ideas that didn’t
directly address how to understand the way the robots move, and so even when the discussions
were productive in terms of aligning with some math idea, it would have been unlikely that they
helped students in connecting the math to the robot situation specifically. Using one of those
opportunities to compare and contrast the different strategies that the students used in the “Close
Shave” challenge, some of which took into account the scalar nature of the problem, may have
been better aligned and more productive for this purpose. Furthermore, students’ belief that math
is useful in robotics primarily for getting the “answer” more efficiently, suggests that a
broadening of the role of math in their activities may help develop a fuller sense of the
advantages of mathematics.
In terms of engagement, however, evidence from the Attitudes Survey suggests that
students either made no change or were even more negative about robots and math after
participating in the unit. The reflection interviews provided more support that the students felt
that what they were doing with the robots was not that compelling. It may be that verifying some
fictional character’s abstract idea was not the best approach for making explicit a math idea for
students to try out. Alternatives may include using math ideas not just in abstract verification
experiments, but also as ways to solve actual design challenges or other sorts of activities that
involve making the robot “do different things, instead of just moving forwards and backwards”
(Darren’s response on Transcript line 199). Although the capabilities of these particular robots
are certainly limited, there may be possibilities for incorporating well-crafted robot challenges
that make figuring out simple movements on the robots a more compelling option.
Overall, the structure of the Scripted Inquiry environment did help students use math in
their robotics activities, but a stronger connection of the math to understanding and doing actual

66
robot movements may be a more appropriate focus for getting students to make progress on
using proportional reasoning as a tool for understanding the movements of mobile robots.
2.4 STUDY 2 – DESIGN BASED
Study 2 built off the results from Study 1 in a design experiment that focused on the
development and implementation of an alternative learning environment for helping students
connect the math of proportional reasoning to learning to control simple robot movements. The
results of the Study 1 suggested that the math could be more tightly connected to the robotics
situation in the design of a learning environment, and so an attempt to do that was made in this
alternative learning environment design.
Engineering design based learning (Kolodner et al., 2003; Sadler, Coyle, & Schwartz,
2000) provided a framework for the alternative learning environment design. Scripted inquiry
environments (like the one in Study 1) are carefully crafted such that the tasks are clear and
explicit in ways that students can follow along step-by-step as they build an understanding of an
idea. Design based learning environments are also carefully crafted, but instead of being scripted,
they are focused on providing scaffolding that allow students to take on as much of the
cognitively challenging aspects of the situation as possible while minimizing peripheral aspects
(Kolodner et al., 2003). For example, in the Electrical Alarm System design-based unit, which
targeted electricity concepts, the designers purposefully removed the 9V batteries from the
standard curriculum kits to force students to engage with the problem of how to combine 1.5V
batteries such that enough power enters the system (Mehalik, Doppelt, & Schunn, 2008). Other

67
aspects of successful design based learning environments include having students create their
own design based on a personal need to enhance personal engagement and breaking a complex
task into subsystems so that students can build toward more sophisticated understanding
(Mehalik et al., 2008). Of central importance is having a test against nature be how a student can
assess their own success or failure as well as whether there is a need to revise (Sadler et al.,
2000). The verification tasks used in the Scripted Inquiry environment were relatively abstract,
which may have motivated the need for focusing on percent error as a target math concept for
creating standardized measures that help comparing different data points, rather than
proportional reasoning as a target math concept for understanding movements. But more
importantly, a test against nature may prevent situations like what happened in the post-
investigation discussion in the Scripted Inquiry environment when students had no basis for
deciding whether the calculated percent errors indicated the theoretical and actual predictions
were or were not the same. In sum, a Design Based learning environment may help students
focus conceptually on proportional reasoning in robot movements by carefully crafting a task
and providing resources that motivate the need for attending to proportional relationships in
solving a design problem. Designing, implementing, and evaluating an environment for learning
robots based around a design based framework would then provide a test of whether these
alternative principles for carefully crafting the learning task would better help students engage
with and learn about connecting math with robots.

68
2.4.1 Activity context
I developed the instructional activities and designed them specifically for this study. In order to
better align the things that students do with the robots with the things that they ought to learn to
better understand robotics, I designed the unit using a Design Based framework. After
considerable brainstorming of potential design contexts that would be engaging to students and
motivate them to consider the proportional relationships that underlie how the robots move, I
decided to focus on robot dancing as the context. I designed the Robot Synchronized Dancing
(RSD) unit with the primary objective of helping students connect proportional reasoning with
how robots move and can be programmed to move in precise ways. All of the materials for the
Design Based environment are included in Appendix D. The unit targets middle school students
and highlights proportionality as a mathematical model for understanding how the physical
characteristics of the robot, the parameters used in programming the robot, and the robots’ actual
movements are related. More specifically, the wheel circumference (distance around the wheels)
and track width (distance between the wheels) are critical physical parameters that determine
how many motor rotations are required to make the robot move a certain distance or turn a
certain angle. As the wheel circumference increases, the amount the robot moves for each motor
rotation increases in turn. By providing different robot types that vary on these physical
parameters, students are setup with the opportunity to explore their effects. Furthermore, the goal
of getting different sized robots to dance in sync with each other—do all the same moves at the
same time—makes problematic the relationship between these aspects within an authentic design
problem.

69
RSD is a careful blend of activities that is intended to be fun and accessible to young
students while still being appropriately challenging. RSD attempts to capture students’
experiences and interest in dance and in movements in general and connect it to the
programming of basic robot movements. In the version of the RSD unit used in this study, the
students take on the role of a knowledgeable dance choreographer who designs their own dance
routine that they then program on robots provided to them. The students are provided with
multiple robot “dancers” each with different physical characteristics (some wider, some
narrower, some with smaller wheels, and some with bigger wheels) as part of dance team. Each
team of students is assigned one of the robots and then creates their own dance routine set to a
song of their choice from a list of available songs. Creating a dance routine was intended both to
get students engaged in the overall robot task, but also to provide them with some general
experience programming and adjusting robot movements so that they would have a basis for
building more formal ideas later in the unit, similar to the “messing about” activities used in
other design based learning environments (Kolodner et al., 2003).
In a short period of time, students are able to build creative and individualized dance
routines for a single robot. They then begin to realize some of the difficulties in the task when
they are challenged to use a second robot in order to develop a synchronized dance routine. That
is where the conceptually challenging aspects of the task begin. In line with the tests against
nature principle from design based learning environments research (Sadler et al., 2000), the
differences between robots are perceptually salient to students and it is very clear in this situation
whether the students have successfully synchronized the robots or not (Figure 10).

70
Figure 10. Two RSD robot dancers out of sync when using the same motor rotations
Other features of the learning environment were designed to provide students additional
structure to help them attend to the synchronization task. For example, like in other design-based
learning environments, the overall task was broken up into subtasks (or subsystems) so that
students didn’t have to address the whole problem at once (Apedoe, Reynolds, Ellefson, &
Schunn, 2008). In the RSD unit, after beginning the synchronization aspect of the challenge,
students would first work on synchronizing distance, and then work on synchronizing timing,
and finally on synchronizing turns.
After designing their dance routine, the students created a design specification with
precise measurements for each move in their dance routine so that they could use numerical
values in addition to perceptual cues when trying to get the other robots to be in sync. Another

71
way in which the Design Based environment helped students attend to the quantitative aspects of
the problem was by using an alternative text-based programming environment. The drag-and-
drop programming interface commonly used when programming LEGO MINDSTORMS robots
makes it difficult to attend to the numerical parameters (Figure 3). Instead, for the RSD unit
students programmed using ROBOTC with functions that corresponded to each type of
movement and were specially defined for the RSD unit (Figure 11). Also built in were functions
to run the robot with stops between each move so that students could visually assess (and
measure) whether that move was synchronized independent of other moves, and to only run
certain types of moves (e.g., straights only) to support the subsystem task decomposition that is a
feature of Design Based units.
Figure 11. A programming environment that makes the numerical parameters salient

72
In addition to these features of the environment that were set up as a standard part of the
unit, the RSD context was designed such that it had a number of possible extensions that could
deepen the context over time. For example, students might consider what would be required to
modify if they wanted to enlarge or shrink their dance routine but maintain the overall timing.
They might also consider robots that varied on other physical aspects, such as robots with varied
gear ratios, which essentially changes the 1:1 relationship between motor rotations and wheel
rotations. It was also believed that this text-based programming environment might ultimately
lead to possibilities for using variables rather than just numerical values, as well as other ways of
representing quantities in the situation and their relationships directly in the programming
environment. That was not possible to do in the graphical programming environment.
The students worked in teams of two or three students on creating their dance routines,
making a design specification, and attempting to synchronize their routine across robots. At each
stage, students presented their work by demonstrating their robots. During the synchronization
activities, teams also created posters that described their synchronization strategies and these
were shared in whole-class discussions. The instructor tried to help students articulate their ideas
verbally on paper and out loud, but all of the synchronization strategies were generated by the
students.
In sum, the Design Based learning environment was substantively different than the
Scripted Inquiry learning environment and attempted to address a number of the issues found
when observing that environment. The prediction was that this alternative environment would
better engage students by providing them an opportunity to use simple movements in a fun and
creative way, while also helping them to better connect to the math of proportional reasoning

73
when inventing strategies for synchronizing their dance routine across robots of different
physical dimensions.
2.4.2 Method
2.4.2.1 Participants
A total of 7 sixth- and seventh-grade female students participated from 1 group of an after-school
program in a neighborhood urban middle school. The students worked in groups of 2 or 3
students per groups, which resulted in a total of 3 groups.
There were 3 sixth graders and 4 seventh graders. There were 4 African-American
students (2 sixth, 2 seventh) and 3 Caucasian students (1 sixth, 2 seventh).
The study took place within the context of a community program targeting girls with the
goal to encourage interest in Science, Technology, Engineering, and Mathematics (STEM)
careers. Each of the participants volunteered to be a part of the STEM program and then to
participate in the research study. All the participants attended the middle school in which the
sessions were held.
There were 14 total students in the after-school program group, but 7 students were
excluded from the analyses because they did not complete the pre- and post-assessments. All but
one of the students who did not complete the program, dropped out prior to the activities on
synchronization, and so those students did not experience any of the more mathematically
rigorous activities intended to encourage the students to be more systematic and reflective about
their conceptual understanding of the way the robots worked. Students stopped attending the
program for a variety of reasons. Three of the students stopped attending after only the first two

74
sessions, while the teams were still building their dance routines. They indicated that the
program was not what they had thought it would be or that they were unhappy with their team.
Another three students stopped attending just after teams finished designing their dance routine
and prior to any synchronization attempts. These students indicated that they could no longer
attend because of an after-school conflict with a sports team. The remaining student who stopped
attending did not share her reasons, but all the other team members in her group had stopped
attending, so that may have played a part in her decision. Since all but one of these students
dropped out of the program prior to any activities dealing with the synchronization across robots,
it is unlikely that their attitudes toward mathematics and having to engage in rigorous activity
was the primary motivator for their decision. For the remainder of this study, the analyses will
focus only on the seven students who did complete the program.
2.4.2.2 Data sources
Problem solving assessment
The results from Study 1 helped to focus the Design Based unit on conceptual aspects of
proportional reasoning. As a result, a new assessment was designed that was intended to better
target assessment of a broad set of concepts that would indicate a deep understanding of
proportional reasoning. Ten items were selected from published sources (Misailidou & Williams,
2003; National Assessment of Educational Progress, 2008). All the items targeted an abstracted
understanding of proportionality. The items included a variety of contexts such as scaling,
pricing, and speed, they included both verbal and table representations, and contained both direct
and inversely proportional relationships. None of the items were set in a robotics context.

75
However, based on the sample in this study, the assessment was not adequately reliable
(Cronbach’s α = 0.44), and so inferential statistics were not conducted for this measure in this
study. The items used in this assessment are included in Appendix B.2.
Attitudes survey
The Attitudes Survey was identical to the one used in the Study 1. Based on the sample in this
study, the survey was adequately reliable both at the overall level (Cronbach’s α = 0.73) and on
two of the three subscales: robotics interest (Cronbach’s α = 0.67) and math value for robotics
(Cronbach’s α = 0.81). However, the third subscale was not reliable, math interest
(Cronbach’s α = −0.21), and so inferential statistics were not conducted for this sample on that
subscale.
Observations and student work
All the sessions were video recorded. The video data was used to document the design process
for the student groups and to follow the progression of their synchronization ideas. In addition,
the posters that teams created to share their synchronization strategies were used to assess the
extent to which students connected proportional reasoning in the situation and the nature of those
connections.
2.4.2.3 Study design
A teaching experiment (Steffe & Thompson, 2000) was conducted in order to better understand
the “mathematical realities” of students with respect to their knowledge of how robot movements
can be controlled. The teaching experiment allowed for viewing knowledge in transition as the

76
instructional experiences were intended to prompt students to make connections to mathematics
but also to rethink some of their existing ideas. Disciplinary engagement and disciplinary
learning were assessed both using the pre- and post- survey tools and using qualitative analyses
of the video and poster data.
2.4.2.4 Procedure
The students met with the author after school two days a week in 1-hour sessions for a total of 26
hours. Participating students completed the problem solving and attitudes surveys on the first
session and then on the last session of the program. Students were given 25 minutes for the
Problem Solving Assessment and 5 minutes for the Attitudes Survey, one immediately following
the other. They completed both surveys individually. On the Problem Solving Assessment they
were instructed to give an answer for every question, to show their work, and were permitted to
use a calculator. The first eleven sessions consisted of helping students to build their dance
routines. It was not until the twelfth session that students worked on the synchronization
problem. After that point, the activities were structured so that the students worked on given
subparts of the synchronization problem and then regularly presented their solution methods to
the rest of the group.
2.4.3 Results
2.4.3.1 Problem solving assessment
The students in this study improved only slightly from pre (M = 0.3, SD = 0.2) to post (M = 0.4,
SD = 0.2) on the Problem Solving Assessment. However, as stated above, the low numbers of

77
participating students and the lack of internal consistency in the measure made a difference
difficult to detect. Learning and the use of mathematics as a tool for problem solving can be
assessed further using the qualitative data presented in the sections below.
Table 4. Design Based attitudes outcomes results
Pre Post
Measure M (SD) M (SD) r d
Overall 0.6 (0.5) 0.9 (0.4) 0.6 0.7
Robotics Interest 0.9 (0.6) 1.0 (0.5) 0.5 0.1
Math Interesta 0.4 (0.6) 0.5 (0.6) 0.6 0.1
Math Value for Robotics 0.6 (0.6) 1.3 (0.5) 0.5 1.2*
a No inferential statistics were conducted on the math interest data due to the low level of internal
consistency for that subscale in this sample.
+ p < .10. * p < .05. ** p < .01. *** p < .001.
2.4.3.2 Attitudes survey
Descriptive data from the Attitudes Survey administered pre and post are reported in Table 4.
Similar to Study 1, the data were analyzed using a multivariate repeated measures ANOVA.
Both at the overall level and on each subscale, students’ attitudes changed positively from pre to
post. This was confirmed in the analysis as there was an overall significant main effect of time,
F(3,4) = 7.31, p = 0.04, η2 = 0.85. Follow-up tests revealed that the source of the significant
effect was in the math value for robotics subscale, F(1,6) = 9.85, p = 0.02, η2 = 0.62. There was
not a significant effect on the overall scale, F(1,6) = 3.25, p = 0.12, or on either of the other

78
subscales (F(1,6) = 0.14, p = 0.73 for the robotics interest subscale, and F(1,6) = 0.15, p = 0.72
for the math interest subscale). This indicates that participation in the Design Based unit
maintained students’ overall engagement and interest, but also had a particularly strong positive
influence on students’ appreciation of the role of math in doing robotics.
2.4.3.3 Student work
Qualitative observations of the students indicated that they were very engaged at the start of the
unit when they were creating their own dance routines. All the students were able to program the
robots to do a variety of movements in time with the rhythm of the songs. However, creating the
design specification, when they had to measure out each move, was much less engaging. The
synchronization challenges were not as engaging as building the original dance but were more
engaging than the design specification task.
When considering the nature of the students’ ideas and the extent to which those ideas
connected with the math of proportional reasoning two themes emerged.
Guess-and-check is not a unitary strategy and may have mathematical elements
Guess-and-check strategies dominated students’ work in building their dance routines and also
many of their attempts to do the synchronization as well. A theme that emerged from considering
their work more carefully, though, was that the guess-and-check strategy contained various
levels of mathematics within it. Guess-and-check, as a label for a strategy for working with
robots or any other problem situation, actually refers to many distinct strategies with important
conceptual variations between them, some of which may both be grounded in the situation and
sophisticated mathematically (Nhouyvanisvong, 1999). For example, an initial strategy that

79
makes use of guess-and-check was described by one of the students when trying to get their
second robot to move the same distance as their first robot (see Figure 12):
224. Mr. E: So, tell us what you put on there and explain to us your strategy.
225. Abigail: Um, we used anonymous numbers, such as 9, 7, & 5. When we tried 5 it was close but not exact, then we tried 6 but it was too much, so we tried everything between 5 and 6, and when we tried 5.7 we got it.
226. Olivia: There’s a lot of slashes on there.
227. Sophia: Doesn't anonymous mean unknown?
228. Abigail: Yeah, we used unknown numbers!
229. Mr. E: Maybe a good question to Abigail and Renee would be, ask them “what do you mean by anonymous? Can you explain what you mean by that?”
230. Abigail: Well we didn’t try any particular numbers like half, we just tried any numbers.
231. Olivia: Random
232. Sophia: Yeah, that’s random, anonymous is unknown.
233. Abigail: I said anonymous.
234. Sophia: Okay, okay, I'm just trying to help you out.
235. Mr. E: Ok, do you think random is a better.
236. Abigail: Yeah. Maybe.

80
Figure 12. An initial guess-and-check strategy
Abigail’s strategy does represent what may be commonly understood as a guess-and-check
strategy, since she and her partner don’t seem to have any particular way to determine what
values to try. The next group to present had a different strategy in which they took the number of
motor rotations that worked for a small-wheeled robot, then to get the number of rotations for a
larger-wheeled robot, they divided by two and then subtracted an adjustment. Upon further
questioning, it became apparent that their strategy also incorporated some aspects of guess-and-
check:
237. Sophia: Well, our strategy was dividing the number in half and subtracting a bit. If the wheels were bigger they take less time for rotations so that’s how we really came up with that. And we think this works because the wheels on the second robot are a little less then half of the first robot.

81
238. Mr. E: So how is this different or the same or, um, then first strategy we heard, the random strategy?
239. Sophia: We didn’t use random numbers.
240. Mr. E: Okay.
241. Sophia: We used… we used scientific numbers.
242. Mr. E: Scientific numbers? Okay, do you see any advantages or disadvantages to doing the random strategy or doing this one?
243. Sophia: I'd say a good advantage in doing this one, because this one is exact, and its scientific.
244. Ava: How much did you subtract it by, like how much? They said a bit.
245. Mr. E: Yeah, right, exactly. So a bit here, what is it? How much is “a bit” that’s what Ava is asking.
246. Sophia: A small amount.
247. Ava: Like?
248. Abigail: Did you subtract .2?
249. Ava: 3 or 4?
250. Sophia: Just, just to match it.
251. Rebecca: Just like, keep subtracting.
252. Sophia: Yeah.
253. Rebecca: Like, one each time until you get it.
254. Sophia: So we kind of in a way used part of the random strategy too, but we just took off half.
255. Mr. E: That’s an interesting connection, Sophia I really like that. So maybe what they did is they cut off, they started doing something, what Sophia called scientific, by dividing in half, but then they had to do some random guessing to get it right, so there’s maybe a little of an improvement over all random, but its not quite perfect. Yeah Abigail?

82
256. Abigail: So all y’all did was divide by half and it was kinda close?
257. Sophia: Yeah, and we just kinda had to take some off each time.
An important conceptual variation between these strategies is that the second group was both
able to use the ratio in wheel sizes to make a good prediction, and then only had to use guess-
and-check to account for an additional part that needed to be adjusted further to make the
prediction more precise. The actual ratio of the wheel sizes (5.6/3.0) was close to half and so the
halving strategy was a good approximation of the relative amounts that each robot moved given
the same number of motor rotations. Using this halving strategy, and then recognizing that it
needs to be adjusted further, seems to be an initial attempt by the students to recognize and
incorporate the relevant proportional relationships into their synchronization attempts.
As described earlier, the “half-plus-adjustment” strategy does correspond to general
proportional reasoning strategies that have been observed in the proportional reasoning literature.
Misailidou and Williams (2003) observed an “incorrect build up” strategy that closely
corresponds to this robot strategy. The “incorrect build up” strategy combines elements of
addition and proportion, or as described in Tourniaire and Pulos (1985), “a multiplicative
strategy on non-integer problems and then using a constant difference to handle the remainder”
(p. 186). Thus, although the students did tend to use guess-and-check strategies, the different
types of guess-and-check strategies that were observed may correspond to increasingly
mathematical levels of understanding of the situation and could form the basis for a productive
trajectory toward a more complete understanding.
One additional point, though, on Sophia’s “divide-by-2-then-subtract-a-bit” strategy is
that she actually got the numerical structure of the problem wrong in that the proper adjustment
would have been to divide by two and then add a bit, not subtract. Unfortunately, in the setup of

83
this Design Based learning environment all of the students were trying to synchronize different
movements and with different robots. Because of that, no other group had been working on the
same problem with the same robots as Sophia, and that made it much less likely that someone
else would hold her accountable to her idea. As the unit progressed, I made the choice to include
some movements that all the teams would work on at the same time even though the particular
moves were not in any of their dance routines. This provided some common basis of experience
that helped to make the strategies that students invented more directly comparable when they
were shared with the group.
Seeing and articulating the distinctions between strategies was difficult
Simply coming up with strategies that incorporated mathematics was difficult for the students.
But another theme that emerged was that talking about the strategies, both in descriptive terms
and in explanatory terms, was even more challenging. In many cases the students thought of their
strategies as “guess-and-check” and labeled them like that or some close variant.
The following example shows Abigail again who started with the “anonamous” strategy
(Figure 12). Abigail, who was the primary spokesperson for her two-person team, and her
partner improved on their initial strategy and started to develop a more sophisticated strategy that
used elements of scaling and building up to hone in on the correct value more quickly
(Figure 13a):
258. Mr. E: Team D, if you could label your strategy for distance, what would you call it, guess and check or something else?

84
259. Abigail: Well I don’t know because what we did was that two was the highest so we let it go at two, well, wait, wait … Yeah it was 2.0. We just tried 2.0 the regular number, and it went 40 centimeters, so we knew that if we did 4.0 it would go 80, so we added some and got 5.5. I'm not sure how to explain. It’s just, just too hard
260. Mr. E: Okay, why don’t we try to think of a name for yours. You don’t think its quite guess and check, something a little bit different.
261. Abigail: Search and Find
In her case, although her strategy clearly used more sophisticated mathematical ideas, she did not
have the language to express the mathematical operations that she did and that distinguished her
strategy from other guess-and-check strategies presented prior to this point. Figure 13b shows
another strategy developed later in the sessions. Again, the students who developed this strategy
highlight the guess-and-check aspect of their solution by naming their strategy “Guess & Check”
and rather than highlighting the unit rate that they used to relate motor rotations to distance.
(a) (b)
Figure 13. Two other strategies labeled as guess-and-check, but with other aspects

85
It is promising that within this Design Based learning environment the students were able
to invent such a range of strategies that did include elements of proportional reasoning. On the
other hand, it speaks to the challenge of moving beyond guess-and-check as a strategy to more
formal and sophisticated methods. It may be that both Abigail and many of the others in the
study could have benefited from some timely introduction of terms and strategies by the teacher.
That is, it is possible that their experiences inventing their own strategies that attempted to
capture and take advantage of the regularities that they observed informally may have prepared
them to understand and appreciate some formal canonical strategies if presented to them
(Schwartz & Bransford, 1998; Schwartz & Martin, 2004).
2.4.4 Discussion
In summary, the students’ interest in mathematics and in robotics was maintained after
completing a rigorous experience reflecting on their ideas about the way robots move in
increasingly mathematical ways. In addition, their perception of the value of mathematics for
robotics increased, suggesting that the experience in the Design Based learning environment
provided opportunities for them to see how mathematics was relevant for understanding robot
movements and for other more general aspects of robotics. Although the problem solving
outcome measure was not reliable, the small pre to post gain suggests that these experiences may
not have lead to large gains in general mathematics understanding of proportions outside of the
robot context. However, the nature of their invented strategies did increase over time in the
extent to which they incorporated aspects of proportional reasoning within robotics. This
suggests that their experiences may have served as a foundation for adopting more formal

86
methods and possibly for transfer to other contexts if more explicit and timely scaffolding was
included (Norton, 2006).
Unfortunately, initial pilot experiences with RSD suggest that although students’ do get
engaged in the synchronization task—and find it interestingly problematic—their understanding
of the situation does not necessarily lead them to mathematize the situation right away and does
not necessarily lead them to the level of sophistication of strategies that you would expect from a
high level proportional reasoner. On the contrary, when left to their own devices, students focus
intently on “making the robot do what I want” (Petre & Price, 2004), but their problem solving
behavior is characterized mostly by guess-and-check strategies unless tasks in the learning
environment are carefully crafted and implemented to encourage them to move beyond that. If
they were left to continue, even within the RSD task it seems likely that they would create fine-
tuned solutions to a particular dance routine or set of robots, but have to start from the beginning
whenever given a new routine or new set of robots. This is clearly a suboptimal solution to the
more general synchronization problem and so it is worth continuing to investigate how to
improve on the Design Based learning environment and the RSD unit.
2.5 STUDY 3 – COMPETITION
Study 1 and Study 2 provided a solid basis for understanding how students might learn
introductory robotics. But in both cases, the learning environments were somewhat formal with
very explicit learning goals and lots of structured activities in which the students were expected
to participate. A contrasting environment for learning robots from the more formal classroom
87
environments is the competition setting. Robot competitions are an increasingly popular way for
students to get introduced to robotics. Students solve complex challenges that test their building
and programming skills. Examining this context could significantly broaden the landscape of
possible features of learning environments that target these skills. Similar to Study 1, I took an
observational approach to examining this context in which I both assessed the learning and
engagement of students who participated, documented the ideas and strategies that students used
(especially with respect to connecting to mathematics), and identified the features of the learning
environment that contributed to students’ interaction within it.
2.5.1 Activity context
Robot competitions for grade-school-aged students involve the building and programming of
small robots to solve a specific design challenge. As an example, the most popular annual robot
competition is FIRST® LEGO® League (FLL), which uses the LEGO MINDSTORMS NXT
robot platform. FLL is for students 9 to 14 years old (grades 3-8). A total of 14,725 teams from
56 countries participated in FLL in 2009—with up to 10 students per team (FIRST, 2010).
FIRST also sponsors two competition programs for high school students that involve more
complex robots, and one program for younger students (ages 6-9, grades K-3) called Junior
FIRST LEGO League (Jr. FLL). The Jr. FLL league consists of a simplified version of the FLL
challenge, but where teams present models or prototypes of their ideas to volunteer reviewers
instead of in a competition setting. As a result, the FLL program is where students get their first,
more substantive experience in building and programming robots to accomplish specific tasks,
and so the focus of this study was at that level. Instead of an FLL competition, however, this

88
study was focused on a smaller, local-level robot competition, called “May Madness”. May
Madness was sponsored by the same robotics education organization that had developed the
Scripted Inquiry robotics unit from Study 1. This organization also hosts the annual state FLL
championship, but because FLL only takes place once a year in the fall, it hosts the May
Madness competition to provide a smaller, more informal setting in which teams can compete
during the spring season.
A robot competition challenge at this upper elementary and middle school level consists
of a series of missions—each with their own designated point value—that involve pushing,
retrieving, picking up, and placing objects around a 4’ x 8’ game board. The object is to earn as
many points as possible in a limited time. The missions vary from competition to competition
and change every year, but teams are generally given months to design their solutions. The
challenge for the May Madness competition was adapted from another national-level
competition program (Botball®). The particular challenge in this study was called “Botball
Hybrid II”, and like FLL competitions, it was to be completed with LEGO MINDSTORMS NXT
robots and was geared toward elementary and middle school age students. The specifications of
the challenge were announced nine weeks prior to the competition event, so teams had that entire
time to prepare.
Although not quite as complex as typical FLL challenges in terms of the number of
missions or the variety of objects on the board, the Botball Hybrid II challenge included a
number of elements that required sophisticated solutions (see Figure 14). Two teams were to
occupy the board at the same time, a black team and a white team. Each team could have one
robot on the board at a time and the teams started at opposite ends of the board. The object was
to get the most points possible in a 90-second round. Points were obtained by collecting ping-

89
pong balls and toilet paper tubes of the team’s color and also common nests (small squares made
from PVC pipe) and foam balls. Knocking the ping-pong balls loose gets some points, but the
most points are obtained by bringing the objects back to a team’s end zone. Even more points are
obtained by lifting the objects into gutters on the side of the table.
Figure 14. Competition game board
2.5.2 Method
2.5.2.1 Participants
A total of 21 elementary and middle school students participated. Those students were from 4
teams that were labeled Focus Teams for this study. Each of the Focus Teams was from different

90
circumstances, including both school-based teams and community-based teams. Two of these
Focus Teams were composed of middle school aged students and two of elementary school aged
students. The Focus Teams were labeled with an “E” if they were an elementary-school-age team
and an “M” if they were a middle-school-age team, followed by an integer to distinguish
between the teams within the age groups: Team E1, Team E2, Team M1, and Team M2.
The students worked within their teams in a variety of configurations of groups of
students, but all the analyses for this study were completed at the individual student level or at
the team level. One of the elementary school aged Focus Teams, Team E1, consisted of only one
student working on his own with the help of his father. Because he completed the pre- and post-
assessments, his data were included in the analyses of change focused on the competition as a
whole. But his data were excluded in analyses of change focused at the team level.
There were 28 total students among the Focus Teams, but 7 students were excluded from
the analyses because they did not complete the pre- and post-assessments.
A total of 16 teams, including all of the Focus Teams, consented to participate in the part
of the study that took place on the day of the competition. Of these teams, 9 were middle school
age teams and 7 were elementary school age teams. Although most teams consisted of students
in a mix of grade levels, the oldest team was made up of all eighth graders and the youngest team
was made up of all second graders, so there was a fairly large range in grade levels. On average
there were 7 students per team (SD = 3), with one team made up of a single student and three
teams with the maximum of ten students. There were 22 total teams participating in the
competition, of which 6 teams did not provide consent to participate in the study at all, so they
were not interviewed about their solution strategy.

91
2.5.2.2 Data sources
Problem solving assessment
Because of the issues with reliability in the assessment used in Study 2, a new instrument was
developed to measure students’ ability to use math in robot problems. The revised Problem
Solving Assessment (Appendix B.3) consisted of 10 multiple-choice and short-answer questions
that asked the students to solve problems involving robot motion. The items were adapted from
published sources of problems that assess aspects of proportional reasoning, and then were
modified to focus on robot motion problems. Five missing value problems were selected from a
diagnostic assessment of proportional reasoning (Misailidou & Williams, 2003). One of these
five, the Mr. Short problem, was kept in its original form to serve as a transfer item. Two
quantitative comparison problems were selected from research on classifying levels of reasoning
in the balance scale task (Jansen & van der Maas, 2002). One item was adapted from a review of
proportional reasoning research (Lamon, 2007) to assess the ability to distinguish proportional
from non-proportional situations. Another item was adapted from research on modeling physical
situations (Izsak, 2004) as a conceptual generalization problem. Finally, one more item was
developed by the author to assess the ability to evaluate reasoning as being appropriate or
inappropriate for a proportional situation. The overall assessment was adequately reliable for the
sample in this study, Cronbach’s α = 0.76.
Attitudes survey
The Attitudes Survey was identical to the one used in the previous studies. Based on the sample
in this study, the survey was adequately reliable both at the overall level (Cronbach’s α = 0.87)

92
and on the three subscales: robotics interest (Cronbach’s α = 0.82), math interest
(Cronbach’s α = 0.82), and math value for robotics (Cronbach’s α = 0.67).
Design strategy questionnaire
The Design Strategy Questionnaire (Appendix C.2) was created to gather descriptive
information about each team and to assess the type of solution strategy that they used. It was a
structured interview conducted by a researcher (the author and a collaborator) and included two
parts. In the first part, the team’s coach was interviewed about the number of students and adults
on their team, their grade and experience levels, and the number of hours that the team met in
preparation for the competition event. In the second part, one or two students from the team were
asked to describe their solutions to the challenge and how they came up with those solutions.
2.5.2.3 Study design
Similar to Studies 1 and 2, the primary dependent measures included the change in robot
problem solving as measured by the Problem Solving Assessment and the change in attitudes as
measured by the Attitudes Survey, although these data were only available for a subset of the
teams included in the study. The primary independent measure included the type of strategy that
the team used in the design solution and these data were available for all of the teams
participating in the study. Interviews using the Design Strategy Questionnaire assessed whether
teams used math in their design solutions. An alternative outcome measure that was not available
in the prior studies was teams’ final rank in the competition, which was used as the dependent
measure of engineering design success. Each team participated in three rounds, and their highest
score of those three rounds was used to determine their final ranking in the competition. Further

93
data in interviewing the teams about their preparation activities and in analyzing the competition
task provided insight as to which features of the learning environment contributed to the learning
and engagement results as well as to the types of ideas and strategies teams used.
2.5.2.4 Procedure
The Problem Solving Assessment and Attitudes Survey were administered to the students on the
Focus Teams soon after the competition scenario was released to provide an assessment prior to
the majority of the teams’ preparation activities. The competition scenario was released 9 weeks
prior to the competition event and all of the Focus Teams were surveyed within 4 weeks of that
time. The surveys were administered at each team’s normal meeting location. Students were
given 25 minutes for the Problem Solving Assessment and 5 minutes for the Attitudes Survey, one
immediately following the other. They completed both surveys individually. On the Problem
Solving Assessment they were instructed to give an answer for every question, to show their
work, and were permitted to use a calculator. On the day of the competition, researchers
interviewed all of the teams participating in the study using the Design Strategy Questionnaire.
Finally, in the weeks immediately following the competition, the Problem Solving Assessment
and Attitudes Survey were administered a second time to the students on the Focus Teams. The
paper-and-pencil instruments were unchanged from the previous administration, they were
administered again at each team’s normal meeting location, and the procedure was identical.

94
Table 5. Competition problem solving outcomes results
Pre Post
Team n M (SD) M (SD) r d
All Teams 21 0.6 (0.3) 0.7 (0.3) 0.8 0.3*
Team E2 3 0.3 (0.3) 0.4 (0.2) 0.9 0.8
Team M1 8 0.6 (0.3) 0.6 (0.3) 0.8 0.0
Team M2 9 0.7 (0.1) 0.8 (0.1) 0.4 1.1+
+ p < .10. * p < .05. ** p < .01. *** p < .001.
2.5.3 Results
2.5.3.1 Problem solving assessment
Descriptive data from the Problem Solving Assessment are reported in Table 5. A paired t-test
revealed there was a significant increase in students’ overall problem solving from pre to post
(t(20) = 2.47, p = 0.02, Cohen’s d = 0.3). This indicates that participation in the Competition did
have some positive impact on students’ overall problem solving. Closer inspection suggested that
there might have been large differences in outcomes between the teams. To examine whether this
was true, the data were analyzed using a repeated measures ANOVA with the proportion correct
on the problem solving assessment as the dependent measure, time (pre, post) as a within-
subjects factor, and team (E2, M1, M2) as a between-subjects factor. Using this model, there was
only a marginally significant main effect of time, F(1,17) = 3.31, p = 0.09, η2 = 0.16, but there
was a significant main effect of team, F(1,17) = 5.12, p = 0.02, η2 = 0.38. The interaction term
was not significant, F(2,17) = 2.04, p = 0.16. This suggests that there were some differences

95
between the teams, and that there also may have been some improvement overall from pre to
post.
Follow-up tests on the main effect of time using a Bonferroni correction adjusting for
multiple comparisons suggest that there was a marginally significant mean difference from pre to
post for Team M2, the second middle-school-age team (M = 0.10, 95% CI [−0.01, 0.20],
F(1,17) = 3.96, p = 0.06), but not for the elementary-school-age team, Team E2 (M = 0.13, 95%
CI [−0.05, 0.32], F(1,17) = 2.40, p = 0.14), or the first middle-school-age team, Team M1
(M = 0.03, 95% CI [−0.08, 0.14], F(1,17) = 0.28, p = 0.61). This suggests that there may have
been some improvement made by Team M2, but the low number of students from Team E2 may
have made a statistically significant improvement difficult to detect for that team.
Follow-up tests on the differences between teams suggest that both middle-school-age
teams were significantly greater than the elementary-school-age team, Team E2, at pre test
(difference of Team M1 to Team E2, M = 0.37, 95% CI [−0.03, 0.78], p = 0.08; difference of
Team M2 to Team E2, M = 0.46, 95% CI [0.06, 0.86], p = 0.02), but the only differences at post
test were that Team M2 was significantly greater than Team E2 (M = 0.43, 95% CI [0.04, 0.82],
p = 0.03). The pattern of results at pre test could be explained by the elementary-school-age
students having less background in mathematics compared to the middle-school-age students.
The pattern of results at post test could be explained by Team M2 continuing to make
improvements in their problem solving even though they started at pre test with very high scores
on the problem solving assessment. On the other hand, the lack of pre-post change for Team M1
may mean that they did not make progress and could suggest that the differences between Team
M1 and Team E2 became less over time as a result of participation in the competition.
96
2.5.3.2 Attitudes survey
Descriptive data from the Attitudes Survey administered pre and post are reported in Table 6.
Students’ attitudes changed negatively on the robotics interest subscale and positively on the
value of math for robotics subscale. Similar to Study 1, the data were analyzed using a
multivariate repeated measures ANOVA to investigate whether those changes were significant at
the level of the whole competition. Time was a marginally significant main effect across all of
the measures, F(3,17) = 2.78, p = 0.07, η2 = 0.33, but time was not a significant effect on any of
the measures individually. This indicates that was not evidence to support the conclusion that
participation in the Competition impacted students’ attitudes.
Similar to the Problem Solving Assessment, there may have been differences in changes
in attitudes between the three Focus Teams. So a follow-up analysis was done using a
multivariate repeated measures ANOVA with the proportion correct on each of the Attitudes
Survey subscales and the overall scale as the dependent measures, time (pre, post) as a within-
subjects factor, and team (E2, M1, M2) as a between-subjects factor. In this analysis there were
no significant main effects or interactions both in the overall multivariate test and in the
univariate tests as well. This suggests that there was not enough evidence to conclude that the
Competition environment impacted students’ engagement with robotics and math, and that there
was not enough evidence to suggest differences in engagement between the teams.

97
Table 6. Competition attitudes outcomes results
Pre Post Measure M (SD) M (SD) r d
All Teams
Overall 0.7 (0.7) 0.7 (0.9) 0.6 0.0
Robotics Interest 0.9 (0.8) 0.8 (1.1) 0.5 −0.2
Math Interest 0.3 (1.0) 0.3 (1.2) 0.7 −0.1
Math Value for Robotics 0.7 (0.7) 1.0 (0.8) 0.4 0.3
Team E2
Overall 0.4 (0.5) 1.1 (0.9) 1.0 1.1
Robotics Interest 0.6 (0.1) 1.1 (0.7) 0.5 1.2
Math Interest 0.0 (1.1) 0.7 (1.4) 1.0 0.6
Math Value for Robotics 0.8 (0.3) 1.4 (0.5) 0.2 2.0
Team M1
Overall 0.2 (0.7) 0.2 (0.7) 0.9 0.0
Robotics Interest 0.6 (1.0) 0.5 (1.2) 1.0 −0.1
Math Interest −0.1 (1.2) −0.3 (0.8) 0.8 −0.3
Math Value for Robotics 0.2 (0.7) 0.5 (0.6) 0.6 0.4
Team M2
Overall 1.0 (0.4) 0.9 (1.0) 0.0 −0.2
Robotics Interest 1.2 (0.6) 0.8 (1.2) 0.0 −0.4
Math Interest 0.8 (0.8) 0.6 (1.3) 0.7 −0.1
Math Value for Robotics 1.1 (0.5) 1.3 (0.9) −0.3 0.2
+ p < .10. * p < .05. ** p < .01. *** p < .001.

98
2.5.3.3 Student work
The different strategies
The teams came up with a range of qualitatively different solutions. This range included
choosing which parts of the challenge to pursue and in what order. However, every solution
strategy included at least one common component—moving the robot to the center of the board
to begin scoring points. I focused on the solution strategy for this component in order to compare
across teams. This was also effectively the same basic movement problem that was the focus of
the learning environments in Study 1 and Study 2. Table 7 is a list and description of the
different solution strategies that teams used, and the number of teams that used each approach
out of the 16 teams that were interviewed on the day of the competition.
That only 3 teams used a (non-rotation) Sensor-Based strategy is likely a direct
consequence of the nature of the particular robot challenge. In particular, the toilet paper tubes
were not steady enough for a robot’s touch sensor to contact them without tipping the tubes over.
As a result, teams seeking to score using the tubes had to choose non-contact means of
controlling their robot’s movement. The 3 teams that did use a Sensor-Based strategy on their
first move were all going for the nests, which are much heavier than the toilet paper tubes.
However, for various reasons, even these teams abandoned use of their sensors in their moves
later in the challenge. In addition, the board surface featured few marked lines, making line-
following and line-tracking less attractive.

99
Table 7. Competition observed strategies
Strategy n Description
Guess-Test-Adjust
6 Students guess an initial value for the motor rotations, try it out on the robot, and then adjust the value to be bigger or smaller based on whether the robot went too far or not far enough. It is often not clear how students arrived at their initial guess. Teams who used this strategy also differed in how they made the adjustments: some used a systematic strategy in which they went up by whole numbers first, then smaller numbers, while others used more arbitrary adjustments.
Calculate-Test-Adjust
4 The only strategy that was explicitly math-based. Students measure the distance the robot has to move. They then make a mathematical prediction about the correct rotation value for the movement based on the size of the robot’s wheels or a known distance the robot moves in one rotation. All of the teams who made their initial calculation this way had to fine-tune that value afterwards using adjustments that resemble the Guess-Test-Adjust strategy or the View-Mode strategy.
View-Mode 3 Students use the view mode on the NXT and then “walk” their robot (push it by hand as the wheels roll along the ground) to the desired destination. They read the value displayed and use that value in their program.
Sensor-Based 3 The only strategy in which the robot does not travel a set number of wheel rotations (or duration of time). Students program the robot to move until a physical sensor stimulus provides a cue to stop. For example, running forward until the robot bumps into a nest and a Touch Sensor is triggered.
The remaining 13 teams programmed their initial move using the rotation sensor,
effectively moving a set distance forward. However, those 13 teams used qualitatively different
methods to choose their motor rotation values, especially the initial value. Some teams guessed;
others used the view mode; but 4 teams chose to start with a math-based prediction based on a

100
measurement of the desired robot movement. Although certainly not a majority of teams, 25% of
the teams interviewed did use mathematics explicitly in their design solution in this way.
A math-based strategy for calculating motor rotations
Teams making math-based predictions used several different mathematical relationships to arrive
at their predictions. For example, one group measured how far the robot moved forward with
each motor rotation, and then calculated how many of those 1-motor-rotation distances the robot
needed to move the total distance to the target. The students then entered this value into their
program, tested it, and fine-tuned the value to get the robot to exactly the right spot. One notable
quality of this strategy is that it is not purely mathematical—all 4 teams that used Calculate-Test-
Adjust for their initial motor rotations value ended up having to refine their value with guessing
or with the view mode afterward. A math-based measurement and prediction does not appear to
be sufficient on its own for this type of competition challenge.
The relative success of the different strategies
The ranks of the teams who used each strategy were compared to assess the extent to which each
strategy was related to design success. Figure 15 shows the distribution of ranks in the
competition of the teams who used each strategy. Inspecting the mean ranks, the View-Mode
strategy was on average the most effective and the Sensor-Based strategy was on average the
least effective, and this particular contrast was statistically significant (t(4) = 4.98, p = 0.01). The
Guess-Test-Adjust and the Calculate-Test-Adjust strategies were in the middle and similar to
each other. As stated above, it may have been that this particular challenge was somewhat biased

101
against the use of sensors, and so it is not surprising that teams who used the Sensor-Based
strategy did not perform well.
Figure 15. Distribution and mean (+) of ranks in the Competition based on strategy used
The teams using the View-Mode strategy did perform particularly well. I hypothesize that
this strategy may lead to success for two reasons. First, teams that use this strategy can program
their movements quickly. Figuring out the correct motor rotations value is straightforward and
fast, so that frees the team up to spend their limited time improving other parts of their solution

102
(e.g., making their robot base solid and their attachments functional). Second, the View-Mode
strategy is very reliable, so once teams get a motor rotation value by using this strategy, they
then have a lot of confidence that that value is the right one and will work well. In essence, the
View-Mode strategy is easy to implement quickly and gives very reliable results, which explains
why teams who chose that strategy tended to do well in the competition and there was very little
variance among them.
The success of the math-based strategy
Compared to rolling the robot on the ground and reading a number, both Guess-Test-Adjust and
Calculate-Test-Adjust are slow to implement and potentially less reliable as well. Again
inspecting Figure 15, on average teams who used these strategies performed at an average level
in the competition, and not as well as teams who used the View-Mode strategy. Alternatively
however, when inspecting the variation within strategies, the View-Mode strategy was the least
variable, but the Calculate-Test-Adjust strategy has a large variability spanning almost the entire
range of possible ranks.
A closer look at the 4 teams that used the Calculate-Test-Adjust strategy shows that two
of them were the top ranked teams in the entire competition (ranked #1 and #2 out of 22 teams).
This suggests that using a math-based measure-and-predict strategy can be very powerful. At the
same time, the other two Calculate-Test-Adjust teams were ranked #17 and #21—the complete
opposite end of the spectrum in terms of design success. Figure 16 illustrates this more clearly,
showing each team as an individual point and examining their max score in the competition,
which is what determines their final rank. In this figure, the bi-modal distribution within the
Calculate-Test-Adjust strategy is evident, as well as the relative success in terms of absolute
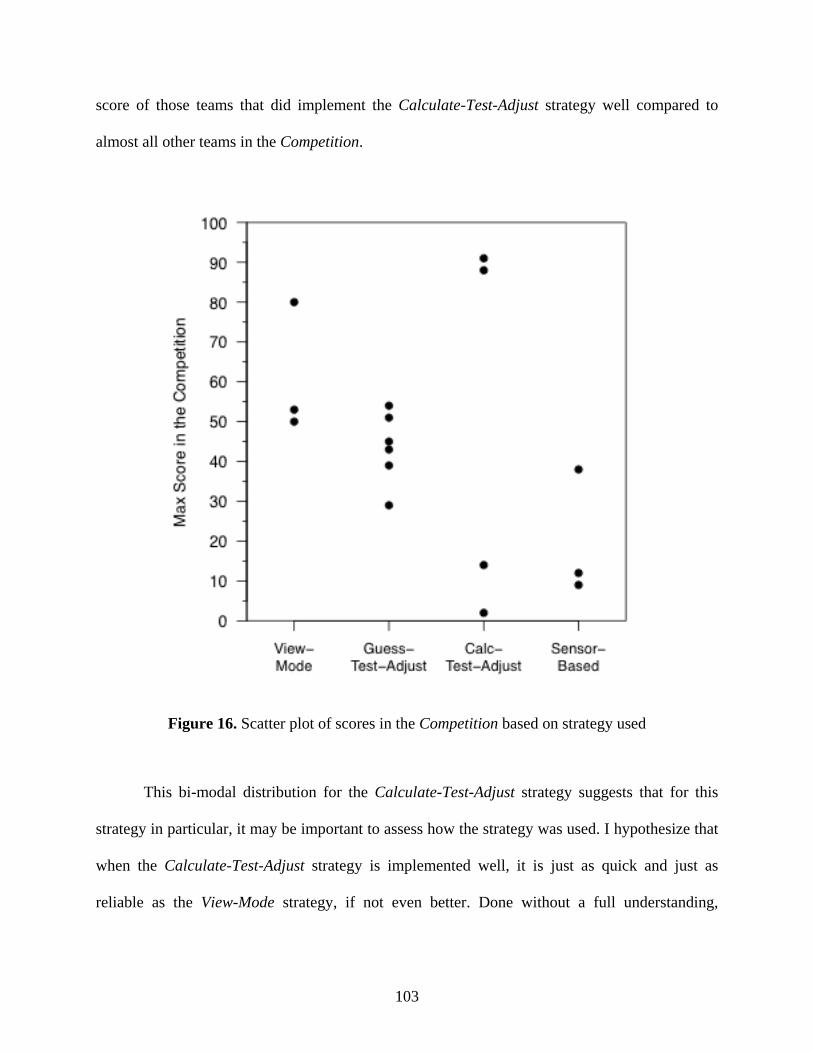
103
score of those teams that did implement the Calculate-Test-Adjust strategy well compared to
almost all other teams in the Competition.
Figure 16. Scatter plot of scores in the Competition based on strategy used
This bi-modal distribution for the Calculate-Test-Adjust strategy suggests that for this
strategy in particular, it may be important to assess how the strategy was used. I hypothesize that
when the Calculate-Test-Adjust strategy is implemented well, it is just as quick and just as
reliable as the View-Mode strategy, if not even better. Done without a full understanding,

104
however, the calculations could involve considerable time and cognitive resources that distract
from committing those resources to other parts of the design solution.
In sum, a plausible explanation is that teams who are fluent with mathematics can use
math-based measurements and predictions to their advantage by determining the correct motor
rotation values for different moves relatively quickly. As with the View-Mode strategy, this
timesaving frees resources for use on building tasks and fine-tuning overall strategy. Teams that
are less fluent in mathematics, however, may take longer to perform the math-based calculations,
and make more errors, thus taking time away from working on other important parts of the task.
2.5.4 Discussion
To summarize the results, only a few teams used math explicitly in their design solutions. The
use of math was found to have a highly variable relationship with design success, with the
highest and very low scoring teams in the competition having used math. But this does suggest
that there is a possible role for math as a tool for controlling robot movements even in situations
that don’t explicitly favor doing so. Given that, the challenge for instructional designers may be
how to get students to choose math-based strategies even when other non-math-based strategies
(e.g., the View-Mode strategy) are readily available and work well.
2.6 STUDY 4 – MODEL ELICITING
Studies 1-3 provided the groundwork for a revised learning environment design. Participation in
robot competitions did not reliably lead to understanding how the robots work more generally as

105
teams often developed solutions fine-tuned for the particular challenge without finding a need to
understand how the general system works. The Design Based learning environment was
reasonably successful at both engaging students and facilitating use of math in their robot
strategies, but was somewhat inefficient as students still spent much of their time-on-task
constructing fine-tuned solutions without attending to the more general conceptual ideas. The
challenge for a revised learning environment would be to put that conceptual focus at the core of
what students did in the unit.
The building of the dance routine in the Design Based unit from Study 2, although an
engaging part of the task for the students, didn’t serve the purpose of getting students to connect
proportional reasoning to robot movements. Students instead put a lot of effort into fine-tuning
their dance routines (using a lot of guess-and-check). The unit then forced them to go through a
lengthy process of measuring their dance routine so they could know when a robot was doing it
right. That activity was not something they enjoyed or thought was useful. Furthermore, the
measuring of the design specification did get the students some sense of how to program the
robot and how to measure its movement, which may be important learning objectives in their
own right, but weren’t the ones that were intended. It wasn’t till the eleventh session that the
students finally did their first synchronization attempt. It wasn’t till the following session that
they started to generate solutions to that synchronization problem. This is possibly too much
peripheral activity when the goal of the instructional design is really to get students focused on
using the mathematics of proportional reasoning as a tool for understanding robot movements.
I was inspired by research on the design of model-eliciting activities (MEAs), which
showed how subtle changes to the framing of problems can have a large effect on the sorts of
solutions that get elicited (Lesh, Hoover, Hole, Kelly, & Post, 2000). Lesh et al. articulated

106
principles for the design of model-eliciting activities (MEAs)—authentic problems carefully
chosen such that the situation itself motivates a need to create a general mathematical model
(Lesh et al., 2000). MEA design principles suggest that many typical activities with robots (e.g.,
robot mazes or more complex robot competition boards) may not be ideal for eliciting conceptual
models for two reasons. First, although the robot tasks can be complex with many different parts,
they don’t encourage students to generalize their understanding in a way that would be reusable
in other situations. Instead, the activity structure encourages students to develop solutions that
are finely tuned to the particular challenge. A second reason is that typical robot activities don’t
provide incentives for students to explain their ideas to others, and as a result, how well the
solution works is valued highly, but how well the solution is understood at a conceptual level is
not. This suggests that the domain of robotics may be especially prone to encouraging guess-and-
check sorts of behaviors in which students are not likely to attend to and reflect on their
underlying situation models. Another implication is that alternative instructional experiences that
are more consistent with MEA principles may be better suited to helping students develop and
refine their understandings, which in turn may motivate the use of mathematics as a tool for that
understanding. This study attempts to put students in an activity structure more consistent with
MEAs, and by doing so, seeks to observe students begin to make the transition from strategies
that focus solely on getting the immediate challenge correctly solved to strategies that reflect on
the underlying conceptual understanding that enables solving more general problems.
I redesigned the RSD unit with the key modification being that the design goal was no
longer about designing a dance routine. If the students believe their goal in the activity is to
design one fine-tuned set of robot movements (i.e., an interesting dance or even a synchronized
dance), then it seems unlikely that the students would be focused on the underlying regularities
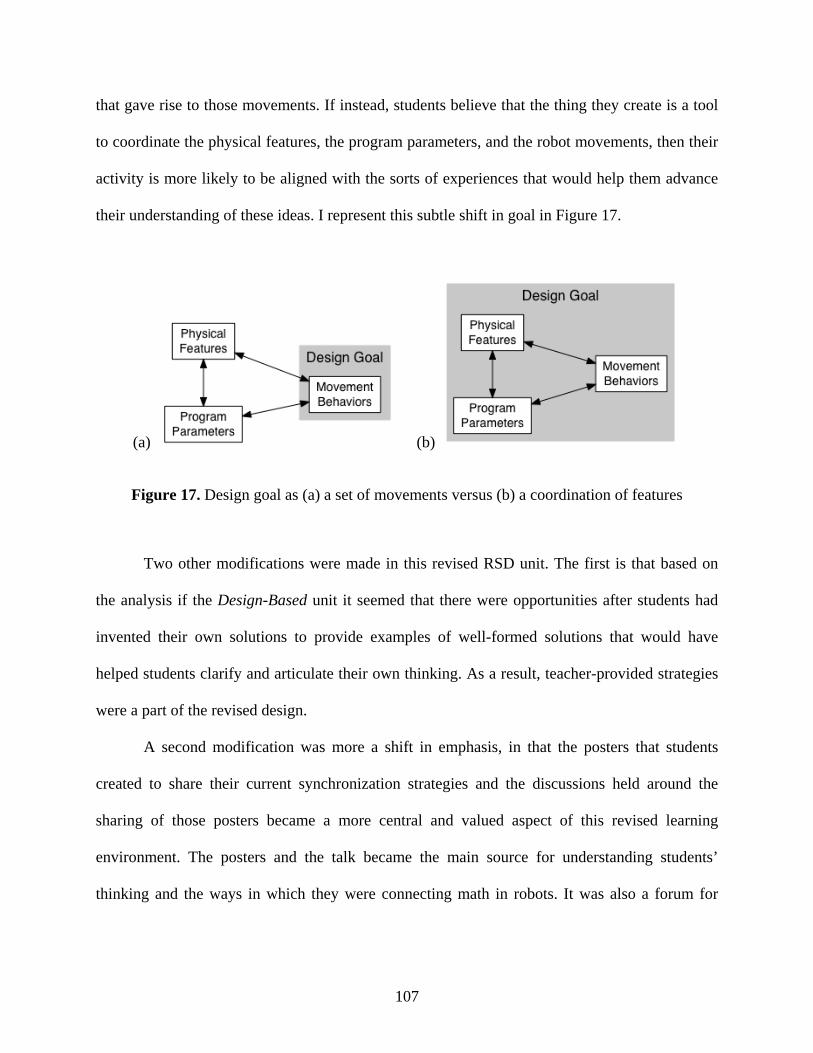
107
that gave rise to those movements. If instead, students believe that the thing they create is a tool
to coordinate the physical features, the program parameters, and the robot movements, then their
activity is more likely to be aligned with the sorts of experiences that would help them advance
their understanding of these ideas. I represent this subtle shift in goal in Figure 17.
(a) (b)
Figure 17. Design goal as (a) a set of movements versus (b) a coordination of features
Two other modifications were made in this revised RSD unit. The first is that based on
the analysis if the Design-Based unit it seemed that there were opportunities after students had
invented their own solutions to provide examples of well-formed solutions that would have
helped students clarify and articulate their own thinking. As a result, teacher-provided strategies
were a part of the revised design.
A second modification was more a shift in emphasis, in that the posters that students
created to share their current synchronization strategies and the discussions held around the
sharing of those posters became a more central and valued aspect of this revised learning
environment. The posters and the talk became the main source for understanding students’
thinking and the ways in which they were connecting math in robots. It was also a forum for

108
disseminating those ideas to the rest of the class, and a way to indicate to the students that their
explanations and justifications for the strategies were at least as important if not more important
than just being able to program the robots to dance in sync.
2.6.1 Activity context
For this study, the Robot Synchronized Dancing (RSD) instructional unit was revised using a
model-eliciting activity framework (Silk, Higashi, Shoop, & Schunn, 2010). As in the Design
Based version of the unit, this RSD unit facilitates students in programming multiple LEGO
robots to dance in sync with each other. To investigate students’ use of mathematics, the unit was
redesigned as a model-eliciting activity (MEA) in which students invent solutions in a series of
express-test-revise cycles (Hamilton, Lesh, Lester, & Brilleslyper, 2008; Lesh et al., 2000).
Students work in teams of 2-3 and create a “toolkit” for a robot dance team captain with a team
of different-sized robots. The captain needs a synchronization solution for any dance routine.
This helps focus the teams on designing a general, adaptable, and explainable solution. All of the
materials for this Model Eliciting environment are included in Appendix E.
Instead of creating their own dance routine, teams are provided with an example dance
routine—set to the “Cupid Shuffle”—that works on one robot—a shared robot accessible to
everyone in the class. But the students’ job is to create a toolkit or set of strategies for getting
other robots to also do the dance the same way. All the other teams have their own robot, and all
are of the same design—a robot with different physical characteristics as the shared robot. As a
result of sharing the same robot type and the same example dance routine, there is a shared
problem that may then be easier to communicate about across teams within the class.

109
Again, the robots and the dance moves in the example dance routine are carefully chosen
to make visible key proportional relationships between the robots’ physical design, the program
parameters, and the magnitude of the robots’ movements. Hence, proportional reasoning
(Lamon, 2007) is still a key mathematical model that teams are facilitated in using. Teams are
presented with the entire problem up front, including a full measurement specification of the
dance routine, but the activities are structured into sub-problems. It was hypothesized that this
unit would encourage mathematical modeling more immediately and to a greater extent than
competition activities, and that this in turn would lead to increases in students’ understanding of
how the robots work. It was also hypothesized that the aspect of synchronization would replace
the aspect of creating a dance routine as the central design goal and that that synchronization
goal itself would be engaging to students.
2.6.2 Method
2.6.2.1 Participants
A total of 29 sixth- through ninth-grade students participated from 3 sections of an elective
robotics course in an urban grade 6-12 school. The students self-selected into one of three
sections, two of which were the Model Eliciting condition (n = 21) where students participated in
the RSD instructional unit, and the other one was the Competition condition (n = 7) where
students worked as a team to prepare and compete in a robot competition—a state FLL
competition. The students in the Model Eliciting condition worked in groups of 2 or 3 students
per group, which resulted in a total of 11 groups. As in Study 3, the students in the Competition
condition worked within their team in a variety of configurations of groups of students, but all

110
the analyses for this study that included the Competition condition were completed at the
individual student level or at the team (section) level.
The study took place within the school context of a STEM-focused magnet program
within an urban school district. Because the program was open to all students throughout the
district, the participants were from a wide geographic range of neighborhoods from the city. This
was their elective course for the program, so was not a formal part of their course of study.
There were 44 total students in the 3 sections of the elective course, but 15 students (12 in
the Model Eliciting condition and 3 in the Competition condition) were excluded from the
analyses because they did not complete the pre- and post-assessments.
2.6.2.2 Data sources
Problem solving assessment
The Problem Solving Assessment was identical to the one used in the previous study (Study 3).
Based on the sample in this study, the assessment was adequately reliable for both groups
(Cronbach’s α = 0.78 for the Model Eliciting group; Cronbach’s α = 0.61 for the Competition
group).
Attitudes survey
The Attitudes Survey was identical to the one used in the previous studies. Based on the sample
in this study, the survey was adequately reliable for both groups at the overall level
(Cronbach’s α = 0.82 for the Model Eliciting group; Cronbach’s α = 0.48 for the Competition
group) and on the three subscales: robotics interest (Cronbach’s α = 0.73 for the Model Eliciting

111
group; Cronbach’s α = 0.78 for the Competition group), math interest (Cronbach’s α = 0.78 for
the Model Eliciting group; Cronbach’s α = 0.53 for the Competition group), and math value for
robotics (Cronbach’s α = 0.71 for the Model Eliciting group; Cronbach’s α = 0.56 for the
Competition group).
Observations and student work
The Model Eliciting group activities were video recorded and the work they produced was
collected, including worksheets and posters describing their evolving RSD toolkits. A final
poster created by the Competition team was also collected. The poster describes their solution for
the competition task that they used to present to judges at the competition.
2.6.2.3 Study design
Performance on the Problem Solving Assessment and responses on the Attitudes Survey were
used as the dependent measures of disciplinary learning and disciplinary engagement
respectively and were contrasted between the learning environments. The other data sources
were used to identify the nature of the connections that students made between math and robots,
and to identify the features of each learning environment that influenced those connections.
2.6.2.4 Procedure
Preparing for the competition requires more time, so the Competition condition participated in 32
hours of robot activities, whereas the Model Eliciting condition participated in 8 hours. The first
author taught the Model Eliciting sections and the school’s engineering instructor taught the
Competition section. Both groups worked with the same LEGO robots; moreover, a large part of

112
the competition required getting their robot to move specific distances and angles, which was the
primary focus of the Model Eliciting group activities. Both groups were given the pre-
assessments on the same day. Students were given 25 minutes for the Problem Solving
Assessment and 5 minutes for the Attitudes Survey, one immediately following the other. They
completed both surveys individually. On the Problem Solving Assessment they were instructed to
give an answer for every question, to show their work, and were permitted to use a calculator.
The post-assessments were administered the day after the conclusion of each condition’s
respective activities. For the Model Eliciting condition that occurred approximately one month
from when the pre-assessments were administered. For the Competition condition that occurred
approximately two months from when the pre-assessments were administered.
2.6.3 Results
2.6.3.1 Problem solving assessment
Descriptive data from the Problem Solving Assessment are reported in Table 8. These data were
analyzed using a repeated measures ANOVA with proportion correct on the problem solving
assessment as the dependent measure, time (pre, post) as a within-subjects factors and condition
(Model Eliciting or Competition) as a between-subjects factor. In this analysis there were no
significant main effects or interactions between time and learning environment condition.
However, adjusting for multiple comparisons using a Bonferroni correction, there was a
significant mean difference from pre to post within the Model Eliciting condition (M = 0.10, 95%
CI [0.01, 0.20]), and the mean difference from pre to post was not significantly different than
zero in the Competition condition (M = 0.02, 95% CI [−0.15, 0.18]). This indicates that

113
participation in the Model Eliciting RSD unit did have a positive effect on students’ overall
problem solving, but the effect was not reliably different from participating in the Competition
environment.
Table 8. Model Eliciting problem solving outcomes results
Model Eliciting (n = 21)
Competition (n = 7)
Pre Post Pre Post
Measure
M (SD)
M (SD) r d
M (SD)
M (SD) r d
Problem Solving 0.5 (0.3)
0.6 (0.3)
0.7 0.4* 0.5 (0.2)
0.5 (0.3)
0.8 0.1
+ p < .10. * p < .05. ** p < .01. *** p < .001.
2.6.3.2 Attitudes survey
Descriptive data from the Attitudes Survey administered pre and post are reported in Table 9.
These data were analyzed using a multivariate repeated measures ANOVA with the mean rating
on each of the attitude scales and subscales as the dependent measure, time (pre, post) as a
within-subjects factors and condition (Model Eliciting or Competition) as a between-subjects
factor. At the overall level there was a significant main effect of time, F(3,24) = 5.09, p < 0.01,
η2 = 0.39, but the effect of condition, F(3,24) = 1.46, p = 0.25, and the interaction were not
significant, F(3,24) = 0.47, p = 0.70. The univariate tests suggest that the overall significant
effect was due to a significant effect of time for the robotics interest, F(1,26) = 7.28, p = 0.01,
η2 = 0.22, and math value for robotics, F(1,26) = 5.51, p = 0.03, η2 = 0.18, subscales, but not for

114
the overall attitudes scale, F(1,26) = 0.01, p = 0.94, or the math interest subscale, F(1,26) = 0.06,
p = 0.82. Further, the only mean differences from pre to post that were significantly different
from zero were a negative change within the Model Eliciting condition for the robotics interest
subscale (M = −0.36, 95% CI [−0.64, −0.07]) and a positive change also within the Model
Eliciting condition but for the math value for robotics subscale (M = 0.36, 95% CI [0.06, 0.65]).
This indicates that participation in the Model Eliciting RSD unit had a negative effect on
students’ interest in robotics, but had a positive effect on their sense of the value of math for
robotics. For the Competition condition, there were no significant differences from pre to post on
their overall attitudes or on any of the individual subscales, which suggests that there is not
enough evidence to determine whether participating in that environment impacts engagement.
Table 9. Model Eliciting attitudes outcomes results
Model Eliciting (n = 21)
Competition (n = 7)
Pre Post Pre Post
Measure
M (SD)
M (SD) r d
M (SD)
M (SD) r d
Overall 0.6 (0.6)
0.6 (0.6)
0.8 0.0 1.0 (0.4)
1.0 (0.4)
0.8 0.0
Robotics Interest
1.1 (0.7)
0.7 (0.6)
0.5 −0.6* 1.5 (0.5)
1.1 (0.9)
0.7 −0.6
Math Interest
0.4 (0.9)
0.3 (0.9)
0.9 −0.1 0.6 (0.7)
0.7 (0.7)
0.9 0.2
Math Value for Robotics
0.4 (0.8)
0.7 (0.7)
0.6 0.5* 0.9 (0.8)
1.2 (0.5)
0.7 0.5
+ p < .10. * p < .05. ** p < .01. *** p < .001.

115
2.6.3.3 The Competition group
The Competition team did very well in the competition finishing 11th out of 72 teams. In
addition, they did use math explicitly in their solution strategy (Figure 18). Based on the
proportion of teams that used math in their solutions in Study 3 (25%), it might be reasonable to
conclude that the Competition team in this study was exceptional relative to other teams in the
competition in terms of their use of math. It was also the case that their coach was aware of the
focus of the RSD unit and so may have inadvertently encouraged the students to incorporate
some of the same math ideas in their competition solution. This sort of cross-contamination
across the study conditions did occur at least once as the Competition team chose to use the same
base robot design that was being used for one of the robot dancers in the RSD unit.
Figure 18. Math-based solution by the Competition team in Study 4

116
2.6.3.4 The Model Eliciting group
In addition to the pre-post gains, one measure of the success of the redesign of the unit was the
immediacy with which students incorporated proportional reasoning into their activities and their
solutions and the sophistication of those solutions in terms of connecting to math. Unlike in the
Design Based environment in which it took more than 11 sessions for the students to first
encounter the synchronization problem, in the Model Eliciting environment the students are
introduced to the synchronization problem on the very first instructional day (after the pre-test
day) and after only a short introduction. Furthermore, although some guess-and-test strategies
were observed at various points in the implementation, the vast majority of invented strategies in
the Model Eliciting condition consisted of complete forms of scalar or functional reasoning. This
suggested that indeed the revised learning environment design did a much better job at providing
a more conceptually focused activity on the connections between math and robots.
2.6.4 Discussion
The implementations of the RSD unit helped students improve their understanding of the way the
robots work. These improvements were the result of providing a context where students’ were
immediately encouraged to connect math to their thinking about the robots in more explicit
terms, a practice less likely to occur when preparing for robot competitions.
One curious finding that is in need of some explanation is the decrease in robotics interest
from pre to post in the Model Eliciting condition. Similarly to the results from the Design Based
environment in Study 2, the students in the Model Eliciting condition did make significant
improvements from pre to post in their sense of the value of math for doing robots. This may

117
indicate that the revisions to the task maintained the core aspects that connected the math to the
robotics in this situation in the same way as was done in the Design Based environment.
However, it may have been that removing the part of the activity where the students get to design
their own dance routines influenced the engagement level in terms of how the Model Eliciting
students felt about the fun of doing robots. It may be that they thought of the revised Model
Eliciting version of the RSD task as being more about “hard work” than “hard fun,” even if they
could better appreciate the value of math in robotics as a result of that experience.
2.7 GENERAL DISCUSSION
The four studies presented in this part provide a rich description of the landscape of opportunities
that are available for students to connect math in robotics that range from formal to informal.
Although the quantitative results of the effect of the Model-Eliciting environment were not
overwhelmingly strong, that environment does a much better job of more immediately aligning
students’ activity with the type of thinking that was desired. In addition, it accomplished this
while overall maintaining students’ engagement levels. There are almost certainly other learning
environment designs that could accomplish similar results. Nevertheless, the analysis of the four
environments suggests that a core principle in the design of learning environments that help
students connect math with robots is about knowing how to fine-tune the tasks such that almost
immediately the students are focused and working on that aspect of the problem.
Returning to the original theoretical graph of learning and engagement presented in the
introduction (Figure 1), I am now in a position to show an empirical version of that graph based

118
on the results from the four studies. Figure 19 shows engagement and learning as mean
normalized gain scores for each group. The normalized gain score was used to control for
correlations between pretest and gain scores.
Figure 19. Effects of the environments on learning and engagement
In this graph it becomes apparent that the Model Eliciting group, although not ideal, is in
a reasonably successful space on the graph. Given that the Competition groups may be
considered the gold standard for engagement, and that very few of those groups are to the right

119
of the 0 line on the engagement axis, it may be that a more reasonable target for learning
environment designs is to maintain existing levels of engagement, especially as those designs try
to encourage students to engage in increasingly more rigorous and challenging forms of activity.
In this case, connecting math with robots is a rigorous and challenging activity, and the Model
Eliciting environment seems to have performed very well according to that standard.

120
3.0 PART 2 – LEARNING FRAMES FOR MATH IN ROBOTS
The second part of this dissertation project focused on different ways that students connect math
with robotics within the Robot Synchronized Dancing (RSD) unit. Since the prior studies
illustrated how the RSD unit is an effective environment for helping students to make
connections between math and robots, it was a useful context for studying differences in
students’ approaches to doing so. This part of the dissertation included two studies. The first
study focused on identifying contrasting approaches observationally from analysis of data
collected in a prior study using the RSD unit. The second study follows directly from the first by
implementing contrasting instructional implementations of the RSD unit that each encourage the
participating students to take on one of the observed approaches.
3.1 OVERVIEW OF STUDIES
The following is a brief summary of the main findings from each study and the
connections between them to help guide the reader:
Study 5 – Identifying Contrasting Frames. I conducted a retrospective analysis of the
student work produced when implementing the RSD unit in Study 4. In this new study, the goal
was to identify more and less productive approaches to the tasks. I engaged in a search for

121
“ontological innovation” (diSessa & Cobb, 2004)—a search to identify a distinctive way to
categorize student approaches such that the category is explanatory of some meaningful aspect of
the learning that is happening in this context. Further, the new category should have implications
for alternative designs of the environment that would likely be consequential for learning. In this
case, I found that students’ epistemological framing of the task appeared to be consequential
even when students’ essentially performed the same numerical operations and procedures. Two
contrasting approaches to the task included one that was much more common: using math as a
calculational tool for performing numerical calculations on numerical values, for defining a
pattern of numerical values, and for reproducing that pattern in a well-specified input-output
function. Students that could do this well seemed to do very well in the RSD task. An alternative
approach, however, emerged even though it was much less common. Some students used the
math not just as a calculational tool, but also as a way to represent their ideas about the way the
robots work—the robot’s mechanisms of movement. They reasoned with mental images and
animations that guided what sorts of quantities in the situation were relevant and what sorts of
operations could be performed on those quantities that would mirror what was happening in the
situation. This finding is consistent with research in mathematics (Thompson et al., 1994) and
science education (Hutchison & Hammer, 2009) that have both identified similar epistemological
frames as consequential for learning in those disciplines.
Study 6 – Manipulating the Contrasting Frames. Following up on Study 5, I then tested
whether these contrasting epistemological frames were consequential for learning by performing
an instructional manipulation between two different implementations of the RSD unit. The
results supported the conclusion that the mechanistic approach condition was the only condition
to show a significant problem solving improvement from pre to post. Coding of the posters

122
created by the teams confirmed that the mechanistic group teams did generate more mechanistic
strategies primarily by including more pictures of the situation in their poster and physical
features of the robot in their strategy. They were also much less likely to include guessing or
adjustments as part of their strategy. Perhaps most powerfully, in a competition task that took
place after all of the RSD activities had concluded, including the post-assessments, the four
mechanistic teams all used the strategies that they had invented in the RSD unit, but only 1 of the
4 calculational teams did so. Analysis of the whole-class discussions revealed that the
calculational group did engage in high-level mathematics as part of the RSD unit, so the
differences were not due to general disengagement from the task or lower levels of mathematics
ability. Rather, the mechanistic teams appeared to activate a greater range of conceptual
explanatory resources available for thinking about the problem. Comparison of the quantitative
results with the environments from Part 1 suggested that the calculational group was equivalent
to the Model Eliciting group from Study 4, and that the mechanistic group improved on those
results, demonstrating higher normalized gains than any other group in the prior studies while
still sustaining engagement levels.
3.2 BACKGROUND
The work presented in this study was influenced by prior theoretical and empirical work both in
mathematics and science education research. One major influence was the contrast between
calculational and conceptual orientations to teaching mathematics (Thompson et al., 1994). In
this framework and as illustrated in contrasting case studies, teachers with calculational

123
orientations tend to speak exclusively in the language of numbers and numerical operations.
They also have a predisposition to frame problem solving as entirely about producing a
numerical answer. In contrast, teachers with conceptual orientations are more focused on
articulating ideas and ways of thinking. They reason with images and have expectations that
problem solving will be intellectually engaging. Thompson et al. (1994) also suggest that even
though the conceptual orientation is by far the more productive for teaching and learning, that it
is incredibly difficult to acquire and once acquired it is difficult to maintain. Although not
explicitly set in a math education context, similar contrasts in orientations have been observed in
the context of the cross-discipline studies reported here. I will argue that that these contrasting
orientations from the mathematics education literature are likely to be consequential for learning
in this context based on prior research on using math as tool for thinking about a physical
situation from cognitive psychology research and on research investigating the effect of
mechanistic reasoning in science education research.
As reported earlier in this paper, Schwartz et al. (2005) demonstrated the positive effect
of math in physical systems in which multiple features must be attended to and coordinated to
predict an outcome. Tools that organize thinking for learners can improve their understanding. In
the Schwartz et al. (2005) study, they showed how mathematics can be such a tool by
manipulating conditions that would make it more or less likely for students to use math in their
strategies for solving the balance scale task in which they have to determine which side of the
balance scale will fall. To explain further, in one study they manipulated whether the balance
scale was displayed using a computer in its default format with easy-to-measure, discrete
quantities for both weight (number of weights on a peg) and distance (number of pegs from the
center) versus in a modified format with difficult-to-measure, continuous quantities for weight

124
(amount of liquid in an unmarked beaker) and distance (distance from the center without any
marked pegs). Ten-year-olds in the easy-to-measure condition exhibited results similar to their
age-group norms in which they attended to both weight and distance across different problems,
but had difficulty choosing which side would balance when both were different and so they were
required to attend to those quantities simultaneously. In contrast, ten-year-olds in the hard-to-
measure condition performed closer to typical five-year-olds, most often paying attention
exclusively to weight in their problem solving and not attending to distance at all. Schwartz et al.
reasoned that the students in the hard-to-measure condition likely were disadvantaged because
they were not able to represent both quantities with the same ontology (numbers) and so that
made it very difficult to attend to both quantities and choose between them. In this sense,
numbers provide a way to organize the data available in a situation in a common form so that
quantities can be compared and potentially combined more easily than in their basic perceptual
forms.
In a second study, Schwartz et al. (2005) gave two groups of eleven-year-olds the easy-
to-measure version of the balance scale task, but in one group students were asked to justify their
answers with the prompt, “Explain your reasoning,” and in the other condition they were
prompted to “Show your math.” In this case, the “Show your math” condition far exceeded their
age-group norms and solved the problem at a level similar to and possibly even exceeding
typical adults, in which they attended to both weight and distance simultaneously. Despite
significant developmental gains simply by encouraging the participants to use math, the majority
of the eleven-year-old participants in that study did not reach the highest level of reasoning in
which they recognized that the most appropriate operation to combine weight and distance was
using a product. Schwartz et al. suggested that the mathematics was beneficial in helping the

125
students to consider possible alternative structures for coordinating features (i.e., mathematical
operators), but did not provide a basis for choosing between those alternatives. Essentially the
students were left to test out each alternative quantitative operator empirically and so it turned
into a game of chance whether or not the students found the correct one. Building on this work, it
is possible that there are conceptual resources that students could draw on that would help them
continue to use math as a tool for organizing their thinking, but then also help supplement that
tool by focusing on testing the quantitative operators that seem most likely to work in the
situation. The conceptual orientation described above, and more appropriately, a mechanistic
orientation as described in the science education literature, may be the sort of supplement to
math that is needed to provide a basis for choosing between alternative mathematical structures.
Orientations that allow for using mathematics in more principled ways may provide an
additional benefit of this type. In a flood prediction task, Kaplan and Black (2003) provided
middle-school-aged students cues about the mechanisms by which each feature may impact
water levels. The mechanistic cues caused students to engage in more mental animations of the
system, which led to more focused investigations of causal effects of individual features and
better predictive accuracy during those investigations. Using mathematics specifically to
represent mechanisms, a combination of the superior conditions from Kaplan and Black (2003)
and Schwartz et al. (2005), may facilitate reasoning beyond what was observed by either in
isolation. Using mathematics as an organizational tool together with mechanistic reasoning to
focus efforts on the most likely organizations for a given situation, may propel development
further as students can rule out many implausible feature effects and interactions using internal
animations and focus on testing only plausible ones.

126
Returning back to the specific situation in the Schwartz et al. (2005) study, the research
on mechanistic approaches Kaplan & Black (2003) suggests that if two groups were both
prompted to use math in easy-to-measure situations like they were in the second Schwartz et al.
(2005) study, but one group was also facilitated in using mechanistic reasoning while the other
group was not, then the mechanistic group may be able to do a more focused search of the
potential mathematical operators and arrive at the correct mathematical relationship sooner. They
would have access to additional cognitive resources that would help them to determine which
operators are possible and eliminate those that wouldn’t make sense within the physical situation.
In contrast, the non-mechanistic group would be more likely to engage in a trial-and-error search
of the possible mathematical operators and so would take longer or be less likely to arrive at the
correct relationship.
The present study used a physical system context in which students were likely to have
intuitions about mechanisms that relate system features—middle school students learning to
program simple robot movements. Students have intuitive ideas about how wheel rotations and
wheel size relate mechanistically to produce movement distances, but these ideas are rarely fully
articulated or connected explicitly to students’ solutions. Thus, I was able to investigate different
orientations for math use: (1) a mechanistic orientation in which math is used as a tool for
modeling physical intuitions about the way the system works; versus (2) a calculational
orientation in which math is used as a tool for describing input-output patterns induced
empirically. I used a teaching experiment design in order to investigate the development in
reasoning and also the interactions between students as they communicated their ideas.

127
3.3 STUDY 5 – IDENTIFYING CONTRASTING FRAMES
Qualitative observations of the solution strategies invented by the teams within the Model
Eliciting condition from Study 4 suggested that there existed meaningful differences in
mathematics use between them and that those may have mapped on to the distinctions between
mechanistic and calculational orientations to using math. Examining contrasting types of
solutions and attempting to characterize the nature of those differences may help identify student
behaviors or that may be more productive for learning. This study adopts that approach.
The particular teams to contrast—Team A2 and Team B1—were selected based on the
completeness of their data and their comparable group characteristics. The two selected teams
were two of only five teams that completed all three posters in the Model Eliciting
implementation, and the only ones of those five of whom all of the team members completed
both the pre and post tests. In addition, both groups contained 1 sixth grade male, 1 seventh
grade male, and 1 ninth grade female, so they were roughly comparable in terms of group
composition.
3.3.1 Method
3.3.1.1 Participants
Each team in Study 4 was assigned a unique label based on the classroom section in which they
participated. The team label was put on each of their posters and other work, so the labels used in
the classroom were the same ones used in this study to identify the two selected teams. The
alphabetic character in the label corresponds to which team within a section that the students

128
were on, with teams “A” through “F” in each section, and the numeral “1” or “2” distinguishes
between the two classroom sections. The teams were assigned their alphabetic character
randomly. Thus, Team B1 and Team A2 were not in the same classroom section.
None of the three students in Team A2 had prior robotics experience. All were in a
typical math class for their grade level, with the ninth grade female enrolled in an Algebra 1
class. In Team B1, neither of the two males had prior robotics experience, but the female
indicated that she had used robots once at an out-of-school girls science program. She was also
enrolled in a more advanced math class for her grade level, having completed Algebra 1 in
seventh grade.
Table 10. Contrasting teams’ group composition
Contrasting Teams Team A2 Team B1
Team Composition Sixth grade male no robot experience grade-level math
Seventh grade male
no robot experience grade-level math
Ninth grade female
no robot experience grade-level math (Algebra 1)
Sixth grade male no robot experience grade-level math
Seventh grade male
no robot experience grade-level math
Ninth grade female
some robot experience (out-of-school girls science program) advanced math (Algebra 1 in seventh grade)

129
3.3.1.2 Data sources
Students worked in teams on creating their RSD solution designs. After each subsystem, the
teams created a poster representing their solution design to share with the rest of the teams in a
whole-class discussion. They did this at multiple times during the RSD unit activities. These
posters were seen as representative of the team’s understanding within the RSD situation at that
point in time and so were evaluated for the level of quality that they exhibited.
3.3.1.3 Study design
A contrasting case of two student teams—A2 and B1—who generated very different solutions to
the RSD task was analyzed. Their solutions were chosen because they both had complete data
and because the composition of the students within each team was similar. The analysis was
focused on characterizing the nature of the connections between math and robots made by each
team and how they differed from each other.
3.3.2 Results
These two teams initially approached the RSD task very differently. Following the structure of
the instructional activities, students were asked to focus first just on getting the different robots
to move the same distance (ignoring timing and turning). Each team was given a robot to inspect,
but rather than permitting them to run the robots independently from the start, all the teams were
asked to modify the motor rotations for that robot an initial time and to test their initial try as a
whole class. Team A2 used a guess-and-check strategy from the beginning in which they
reasoned that their robot was going too fast and so needed to lower its motor rotations. Team B1

130
instead reasoned, “Bigger wheels go farther because one rotation is larger.” They then generated
their own strategy for scaling down the motor rotations for the new robot based on the ratio of
the wheel circumferences between the two robots. Although Team A2 generated a reasonable
test with their guess-and-check strategy, in contrast to Team B1, they don’t make mention of or
try to incorporate any of the robot’s physical features that may have been responsible for the
different movement distances.
All teams were then given time to test further their own ideas and to formalize their best
synchronizing distance strategy on a poster. In this first cycle of the unit, both teams generated
working strategies based on relative scaling (Figure 20). Team A2 adopted a scale factor strategy
proposed by another team based on the ratio of the distances the robots moved with the same
motor rotations. They recognized that this strategy worked and chose to adopt it. They then
created a poster with this strategy, implementing it correctly, but without mention of how the
numerical values correspond to aspects of the physical situation (Figure 20a). Team B1 created a
poster describing their initial wheel size scaling strategy (Figure 20b). The two strategies are
similar in that they are both based on relative scaling between the robots, but one is based on the
ratio of the distances when the robots’ motor rotations are equal and the other is based on the
ratio of the wheel circumferences. Both will work, but Team B1’s is based on a physical aspect
of the robot (wheel size) that is responsible for the distance the robot moves, effectively
incorporating an additional layer of connection to the situation not present in Team A2’s
strategy.

131
(a) (b)
Figure 20. (a) Team A2’s and (b) Team B1’s first synchronizing distance strategies
After working as a team for a little while, they were given a teacher-provided strategy
that described a more formal and more fully explained version of the scaling down strategy
based on the relative distance measurements—Team A2’s adopted strategy. This strategy was
created prior to the implementation based on it being a common strategy used in pilot testing. It
was used to highlight the “relative” aspect of the solution as a multiplicative comparison between
two robots (Lamon, 1993), and to provide an example of a high-quality explanation. Team A2
recognized it is a more elaborated version of their own strategy without further explanation or
critique. Team B1 instead critiqued the teacher-provided strategy as one that “does work” but is
not as preferable as a strategy based on wheel size. Team B1 recognized the necessary relative
multiplicative aspect of the solution, but applied its own additional criteria for choosing a
solution, placing greater value on solutions that incorporate and make explicit physical aspects of
the robot that seem to matter.

132
After presenting their first posters to the whole class, the teams were asked to revise their
strategies to make them more general and easier to explain to others. They were free to modify or
change their strategy and to incorporate ideas from other teams. They were also challenged to
create a strategy that wasn’t “relative” to another robot, but rather was based on just one robot in
order to encourage students to consider functional rather than only scalar mathematical models
(Tourniaire & Pulos, 1985). Both teams engaged in unitizing—another key component of
proportional reasoning (Lamon, 1993)—and generated a unit rate strategy, which is based on
figuring out how far the robot moves forward in one motor rotation and then dividing that value
into the total distance to figure out the total number of motor rotations needed (Figure 21).
However, Team B1 recognized that this unit rate corresponds to the wheel circumference, but
Team A2, if they did recognize this connection, did not make it explicit. In addition to not
referencing wheels in their verbal explanation of their strategy in their poster (Figure 21a), their
picture of the distance the robot moves forward in one rotation also fails to recognize this
constraint as the size of wheels drawn on the robot are not even close to what would be needed to
traverse that entire distance in one motor rotations. As they did with the first strategy, Team A2
appeared to be content connecting motor rotations and distance traveled directly, using empirical
results to test their ideas, and not incorporating physical features of the robot that connect the
two.

133
(a) (b)
Figure 21. (a) Team A2’s and (b) Team B1’s revised synchronizing distance strategies
Over subsequent lessons, the teams generated solution strategies for getting different
robots to not only move the same straight distance, but also to complete those moves in the same
amount of time, and then to synchronize their turning movements as well. Turning is a more
complex situation because the amount the robot turns as a function of the motor rotations is
based on not only the robot’s wheel size, but also on the width of the robot. It is more difficult
for students to recognize this property and then to incorporate it in their strategies. Both teams
generated final toolkits (Figure 22), but in response to this added complexity, Team A2 reverted
back to a guess-and-check strategy. Team B1, on the other hand, makes a reasonable attempt to
extend their scaling idea to the turn movements, although they do not successfully identify the
robot’s width as the key physical parameter that needs to be represented and incorporated.

134
(a) (b)
Figure 22. (a) Team A2’s and (b) Team B1’s final synchronizing toolkits
3.3.3 Discussion
Table 11 summarizes the observed differences between the contrasting teams. Because Team B1
included a student with prior robot experience and an advanced mathematics background, it may
be that access to advanced cognitive resources (e.g., ratios and proportions) explains some of the
differences between the teams. On the other hand, Team A2 was able to use relative thinking and
unit rates (Lamon, 1993) in their intermediate solutions, suggesting that their understanding of
the relevant mathematics was not a limiting factor. Instead, it seems likely that despite of having
access to those mathematical resources, they felt other numerical strategies, including guess-and-
check, were more appropriate for the task.

135
Table 11. Summarized differences between contrasting teams’ approaches in the RSD unit
Contrasting Teams Team A2 – Calculational Team B1 – Mechanistic
Initial Ideas for Synchronizing Distance
Used a guess-and-check strategy
Used ratio of wheel sizes (circumference) to scale down motor rotations
“Because if we picked anything littler than that we though [sic] Madonna would go to [sic] slow” [3 motor rotations]
“Bigger wheels go farther because one rotation is larger”
First Synchronizing Distance Strategy
Adopts a scale factor strategy based on ratio of distances, but doesn’t incorporate any robot physical parameters, or references to the physical situation.
Formalizes their initial “Scale Wheel” strategy with wheel size as the basis
Explaining a Teacher Case The case uses the ratio of distances w/ same motor rotations to scale motor rotations.
Recognizes this as a more formal version of their strategy, but without explanation or critique
“This does work but I would rather use the wheel size because distance doesn’t apply in turns and can be affected by outside factors.”
Revised Synchronizing Distance Strategy
Develops a new strategy with the distance in one rotation as the basis, but without connecting that rate to the wheel size
Continues to use wheel size as the basis
Does adjustment (fine-tuning) beyond the initial calculation
Is less concerned with getting the values exactly correct
Final Toolkit Revert to a guess-and-check method without mention of physical robot parameters
Able to extend scale factor reasoning to turns, although doesn’t incorporate the additional relevant physical robot parameters (robot width)

136
An alternative explanation is that the key distinction between the teams was less about
cognitive resources and more about epistemological resources—their views about the nature of
knowledge and learning that is appropriate for the particular tasks (Louca, Elby, Hammer, &
Kagey, 2004). Based on the types of solutions that they generated and their critiques of other
strategies, it seems likely that Team B1 held a view of the task as being about trying to represent
in their toolkits their ideas of how the robot works. This view is reflected in their use of wheel
size in their explanation for the movements, and their defense of wheel size as being a better
explanation than considering distance alone. It is for these reasons that Team B1 can be labeled
as a mechanistic group (Russ, Coffey, Hammer, & Hutchison, 2008). Students with a
mechanistic orientation focus on identifying causal mechanisms that underlie natural phenomena
and use those mechanisms to focus and constrain the ideas that they consider.
In contrast, Team A2 never feels the need to provide explanations that describe how
motor rotations produces distance. They were concerned primarily with getting the particular
robots to be synchronized in a precise way as evidenced by their continual use of guess-and-
check, and also by their need to fine-tune their obtained values even after applying a math-based
strategy (see Figure 21a). Although this view seems consistent with the textbook correctness
view of tasks from the science education literature (Russ et al., 2008), it may be more
appropriately considered as a calculational orientation (Thompson et al., 1994) in this
environment in which students are connecting math within a physical situation. Students (and
teachers) with a calculational orientation have a tendency to focus almost exclusively on the
language of numbers and numerical operations without connecting how an understanding of the
situation might give rise to those calculations. For these reasons, Team B1 can be labeled as a
calculational group.

137
Although there is evidence to support the epistemological labels chosen for these two
contrasting groups, it is not possible to fully know based on these data what explains their
differences, and even if it were possible, they are only two cases. Other unexamined factors may
be relevant. A follow-up study was then designed to encourage two different instructional groups
to take on these contrasting epistemological orientations and examine the effect on understanding
that results.
3.4 STUDY 6 – MANIPULATING THE CONTRASTING FRAMES
In order to test the hypothesis that a student’s epistemological orientation to the RSD task
mattered as to what they learned, a second design experiment was conducted. This time, the tasks
for the two instructional sections were manipulated so as to encourage one group to take on a
mechanistic orientation and the other to take on a calculational orientation.
I adopt a resources view that epistemologies are not individual and stable, but rather that
they are context-sensitive and malleable (Louca et al., 2004) and so can be activated within
individuals using appropriate instructional moves. This position does not deny that certain
individuals may have more of a propensity toward particular epistemological views in more
contexts than other individuals.
In general, I hypothesize that differences in learning outcomes can be explained not only
by cognitive resources (e.g., prior knowledge, misconceptions, productive conceptual resources,
mathematical skills, etc.), but also by epistemological resources (i.e., what one sees as the
purpose of an activity in terms of how knowledge is best generated and thought of). More

138
specifically, I expect that the students who adopt a mechanistic orientation will make greater
gains in their understanding. I test this hypothesis through a second design experiment.
3.4.1 Method
3.4.1.1 Participants
A total of 18 fifth- through seventh-grade students participated in 2 sections of the RSD
instructional unit. The sections were assigned randomly to conditions—Mechanistic condition
(n = 10) or Calculational condition (n = 8). Students chose their section based on convenience,
but were not informed of the differences between sections. The students worked in groups of 2 or
3 students per group, which resulted in a total of 4 groups per section or 8 total groups.
The students for this study were all recruited from the elementary and middle school
campuses of an independent K-12 school. The head of each school campus sent a notice to all
parents of students graduating fifth through seventh grade that advertised the research study. The
study was conducted in the form of a weeklong educational summer camp, held the week after
the school year had concluded.
All of the participating students completed the pre- and post-assessments, so none were
excluded from the analyses.
3.4.1.2 Data sources
Problem solving assessment
The Problem Solving Assessment was identical to the one used in the previous two studies (Study
3 and Study 4). Based on the sample in this study, the assessment was adequately reliable for

139
both groups (Cronbach’s α = 0.70 for the Calculational group; Cronbach’s α = 0.82 for the
Mechanistic group).
Attitudes survey
The Attitudes Survey was identical to the one used in the previous studies. Based on the sample
in this study, the survey was adequately reliable for both groups at the overall level
(Cronbach’s α = 0.91 for the Calculational group; Cronbach’s α = 0.74 for the Mechanistic
group) and, with only one exception, on the three subscales as well: robotics interest
(Cronbach’s α = 0.91 for the Calculational group), math interest (Cronbach’s α = 0.96 for the
Calculational group; Cronbach’s α = 0.79 for the Mechanistic group), and math value for
robotics (Cronbach’s α = 0.70 for the Calculational group; Cronbach’s α = 0.75 for the
Mechanistic group). The one exception was that for the Mechanistic group the robotics interest
subscale (Cronbach’s α = −0.41) was not adequately reliable, and so inferential statistics were
not conducted for that sample on that subscale.
Student work
Data sources included video records of the RSD tasks, posters of teams’ invented strategies and
other written work, and team post reflection interviews.
In addition, a simplified version of the May Madness competition task (Study 3) was
setup and implemented after all of the RSD instructional and assessment tasks were completed.
The robot was already built for the students using larger wheels that they had not used in the
prior RSD instructional tasks. It had a claw for retrieving toilet paper tubes full of ping-pong
balls (Figure 23). In addition, the measurements for the specification of the board were given in

140
units of inches rather than centimeters as had been true in the RSD tasks up that point. With this
setup, students could focus only on the programming aspects, so it was an opportunity to assess
how they would solve robot movement tasks after instruction in the RSD unit. By sequencing the
task after the final post-tests and introducing it as a “fun” task the students were not biased
toward choosing one of their invented strategies from the week.
Figure 23. Simplified competition transfer task
3.4.1.3 Study design
Performance on the Problem Solving Assessment and responses on the Attitudes Survey were
used as the dependent measures of disciplinary learning and disciplinary engagement
respectively and were contrasted between the manipulated implementations of the RSD unit. The
other data sources were used to identify the nature of the connections that students made between
math and robots, and to identify the features of each learning environment that influenced those
connections. The competition task was used to assess whether students would transfer the
strategies they learned in the RSD unit to a less formal task, and whether that would vary by
condition.

141
3.4.1.4 Procedure
Each condition met five consecutive days, two and a half hours per day at a university research
building. One group met in the morning, the other in the afternoon. The sections were assigned
randomly to conditions. The morning section was assigned to be the Mechanistic condition and
the afternoon section was assigned to be the Calculational condition.
Participating students completed the problem solving and attitudes surveys on the first
session and then on the last session of the program. Students were given 25 minutes for the
Problem Solving Assessment and 5 minutes for the Attitudes Survey, one immediately following
the other. They completed both surveys individually. On the Problem Solving Assessment they
were instructed to give an answer for every question, to show their work, and were permitted to
use a calculator.
The author was the instructor for both sections. The unit was implemented similarly
between sections, except for three distinctions intended to activate the contrasting mathematics
orientations (summarized in Table 12). The first distinction was in the design task setup. Each
cycle was introduced to the students as a design task, with the Mechanistic group asked to
represent their intuitions about how the robots work and the Calculational group asked to
generate steps for getting desired outcome values from input values. The second distinction was
in the teacher-provided cases. After inventing their own strategies, students analyzed example
strategies that illustrated key understandings, with cases given to the Mechanistic group focused
on identifying and incorporating key intermediate physical quantities and cases given to the
Calculational group focused on identifying empirical patterns and numerical operations that
generate the patterns. Finally, the third distinction was in the instructional support provided. The
questions used by the instructor while students invented their strategies were focused on

142
connecting quantities and operations to the physical situation in the Mechanistic group and
focused on correctness of calculations in the Calculational group. All of the materials for the
Mechanistic version of the RSD unit are included in Appendix F.
Table 12. Instructional differences between Calculational and Mechanistic groups
Instructional Manipulation Calculational Mechanistic
Design Task Setup How each task is introduced to the student teams.
Focused on input-output transformations
“Think of how to transform
the motor rotations value into the desired robot distance. Create a strategy for your toolkit that is clear about each of those steps.”
Focused on representing intuitions
“Think of how motor
rotations causes the robot to move forward a specific distance. Create a strategy for your toolkit that captures your ideas about how that works.”
Teacher-Provided Cases Example strategies given to students after they have invented their own strategies.
Focused on identifying empirical patterns
e.g., Scale factor strategy
based on the ratio of the distances when using the same motor rotations.
Focused on identifying intermediate physical quantities
e.g., Scale factor strategy
based on the ratio of the wheel sizes.
Instructional Support Questions instructors use to assess and advance students when they are inventing their own strategies.
Focused on correctness of calculations
“What are the steps you took
to get this value?”
Focused on connecting quantities and operations to the physical situation
“What does this
value/operation correspond to on the robot?”

143
Table 13. Calculational and Mechanistic groups problem solving outcomes results
Calculational
(n = 7) Mechanistic
(n = 9)
Pre Post Pre Post
Measure
M (SD)
M (SD) r d
M (SD)
M (SD) r d
Problem Solving 0.5 (0.2)
0.6 (0.2)
0.7 0.5 0.5 (0.3)
0.7 (0.2)
0.7 0.9**
+ p < .10. * p < .05. ** p < .01. *** p < .001.
3.4.2 Results
3.4.2.1 Problem solving assessment
Descriptive data from the Problem Solving Assessment are reported in Table 13. Similar to
Study 4, these data were analyzed using a repeated measures ANOVA with proportion correct on
the problem solving assessment as the dependent measure, time (pre, post) as a within-subjects
factors and condition (Calculational or Mechanistic) as a between-subjects factor. At the overall
level there was a significant main effect of time, F(1,16) = 11.05, p < 0.01, η2 = 0.41, but the
effect of condition, F(1,16) = 0.29, p = 0.60, and the interaction were not significant,
F(1,16) = 1.71, p = 0.21. Follow-up tests suggest that the effect of time from pre to post was
significant within the Mechanistic condition, F(1,16) = 12.07, p < 0.01, η2 = 0.43, but not within
the Calculational condition, F(1,16) = 1.83, p = 0.20. This indicates that there was not enough
evidence to conclude that participation in the Calculational version of the RSD unit was
beneficial to improving students’ problem solving, but there was a reliable improvement in the

144
Mechanistic version suggesting that that version was a particularly effective environment for
students to learn about robot movements.
3.4.2.2 Attitudes survey
Descriptive data from the Attitudes Survey administered pre and post are reported in Table 14.
These data were analyzed using a multivariate repeated measures ANOVA with the mean rating
on each of the attitude scales and subscales as the dependent measure, time (pre, post) as a
within-subjects factors and condition (Calculational or Mechanistic) as a between-subjects
factor. At the overall level there was a significant main effect of time, F(3,14) = 6.20, p < 0.01,
η2 = 0.57, but the effect of condition, F(3,14) = 1.53, p = 0.25, and the interaction were not
significant, F(3,14) = 1.60, p = 0.23. The univariate tests suggest that the overall significant
effect was due to a significant effect of time for the math value for robotics subscale,
F(1,16) = 14.78, p < 0.01, η2 = 0.48. The overall scale and the other two subscales were not
significant. However, the only mean differences from pre to post that were significantly different
from zero were a negative change within the Calculational condition for the robotics interest
subscale (M = −0.34, 95% CI [−0.76, 0.07], p = .10) and a positive change also within the
Calculational condition but for the math value for robotics subscale (M = 0.66, 95% CI [0.27,
1.04]). This indicates that there was not enough evidence to conclude that participation in the
Mechanistic condition had an impact on students’ disciplinary engagement, but participation in
the Calculational condition led to changes in engagement as both a decrease in interest in
robotics and an increase in a sense of the importance of math for robotics. This pattern of
changes in attitudes observed in the Calculational condition was the same pattern observed for in
the Model Eliciting condition from Study 4.

145
Table 14. Calculational and Mechanistic groups attitudes outcomes results
Calculational
(n = 7) Mechanistic
(n = 9)
Pre Post Pre Post
Measure
M (SD)
M (SD) r d
M (SD)
M (SD) r d
Overall 0.3 (0.9)
0.4 (1.0)
0.9 0.0 1.0 (0.5)
1.0 (0.5)
0.8 0.1
Robotics Interesta
0.4 (1.1)
0.1 (1.4)
0.8 −0.3 1.2 (0.4)
1.2 (0.5)
0.7 0.0
Math Interest
−0.1 (1.5)
−0.4 (1.5)
0.8 −0.2 0.7 (0.8)
0.6 (0.7)
0.6 −0.2
Math Value for Robotics
0.7 (0.8)
1.3 (0.5)
0.6 1.1 1.1 (0.7)
1.4 (0.6)
0.8 0.5
a No inferential statistics were conducted on the robotics interest data for the Mechanistic group
due to the low level of internal consistency for that subscale in that sample.
+ p < .10. * p < .05. ** p < .01. *** p < .001.
3.4.2.3 Student work
Analyses of the whole class discussion posters and talk suggest that math was central to the
activity of both groups, but they connected math to the situation in substantively different ways.
All posters from both groups included explicit numerical operations. No posters in either group
used an entirely guess-and-test strategy (although some had guess-and-check components within
their overall strategy). Taken together, each of these is an indication that overall both groups
engaged directly with the connection between math in robots.
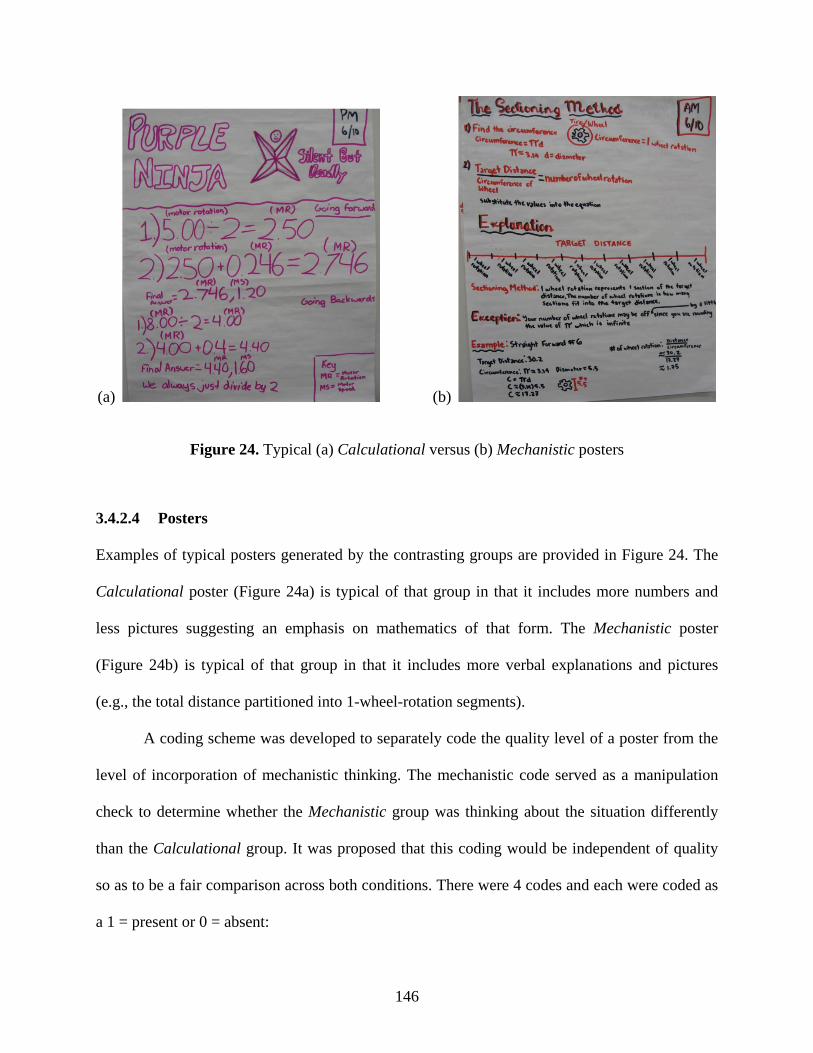
146
(a) (b)
Figure 24. Typical (a) Calculational versus (b) Mechanistic posters
3.4.2.4 Posters
Examples of typical posters generated by the contrasting groups are provided in Figure 24. The
Calculational poster (Figure 24a) is typical of that group in that it includes more numbers and
less pictures suggesting an emphasis on mathematics of that form. The Mechanistic poster
(Figure 24b) is typical of that group in that it includes more verbal explanations and pictures
(e.g., the total distance partitioned into 1-wheel-rotation segments).
A coding scheme was developed to separately code the quality level of a poster from the
level of incorporation of mechanistic thinking. The mechanistic code served as a manipulation
check to determine whether the Mechanistic group was thinking about the situation differently
than the Calculational group. It was proposed that this coding would be independent of quality
so as to be a fair comparison across both conditions. There were 4 codes and each were coded as
a 1 = present or 0 = absent:

147
(a) M1 – Physical Features
The solution uses a physical feature of the robot (wheel size, track width) to connect program parameters (motor rotations, motor speed) with robot movements (distance, angle turned, time), rather than an empirical finding or association based only on the direct connection between program parameters and robot movements.
(b) M2 – Labels Intermediate Values
Each of the intermediate values that are calculated in the strategy has referents in the situation that are explicitly defined in the poster either in words or in pictures.
(c) M3 – Includes Situation Pictures
Includes pictures that illustrate the entities and/or activities that are directly relevant to the strategy. The picture does not count if it illustrates a metaphor or superficial association with the situation.
(d) M4 – Includes an Explanation
Uses words that address why the strategy works using aspect of the situation or general knowledge beyond the effect itself (i.e., that it matches the data or does the right thing).
Table 15 displays the results from the mechanistic coding scheme. The Mechanistic condition
was coded higher on all 4 dimensions indicating that indeed the students in the Mechanistic
condition were thinking about the task more mechanistically than the students in the
Calculational condition. The biggest differences between conditions were that the Mechanistic
condition was more likely to include physical features of the robots in their strategies and to use
situational pictures to illustrate their ideas.

148
Table 15. Mechanistic score of the group posters
Measure Calculational Mechanistic
Physical Features 0 6
Intermediate Values 8 12
Situation Pictures 1 7
Explanations 4 8
A separate coding scheme was developed to code the quality level of a poster. There were
4 codes and each were coded as a 1 = present or 0 = absent:
(a) Q1 – Valid
The strategy will get a reasonably accurate answer every time for the level of the situation that it is addressing. The answer does not have to be exact as long as it is within some reasonable range.
(b) Q2 – Steps Clear
The steps required to implement the strategy are well-defined such that another person could carry them out (even if some guessing would be involved).
(c) Q3 – Fully Specified
All of the used quantities can be calculated/measured; none of the used quantities require guessing or some sort of unspecified “adjustment”. It is not required that they specify exactly how to calculate/measure the quantities as long as they recognize each as calculable/measurable.
(d) Q4 – Generalized
There is some explicit representation (words or pictures) of how the relevant quantities would be found using any robot (or pair of robots).

149
Table 16 displays the results from the mechanistic coding scheme. For this coding scheme both
conditions developed similar quality posters in terms of using valid strategies and being clear
about the steps in their strategies. This is evidence that Calculational condition did engage with
the unit at a high level. Where the conditions differed, however, was on the fully-specified and
generalized dimensions. This indicates that the Calculational condition was more likely to use
adjustments, which is consistent with more of an answer-focus, or guessing, and with not being
able to fully capture the data numerically. Similarly, the generalized dimension is harder to do
when thinking about the situation numerically rather than mechanistically.
Table 16. Quality score of the group posters
Measure Calculational Mechanistic
Valid 13 13
Clear Steps 15 15
Fully Specified 6 15
Generalized 8 11
3.4.2.5 High level mathematics in the Calculational group
A possible explanation for the differences between groups may be that the Calculational group
engaged in only low-level procedural work rather than engaging with the task at a deep level. On
the contrary, qualitative observations of the Calculational group whole-class discussions did
include high-level talk about mathematics that included: (1) connecting math ideas to the
situation, and (2) building off each other’s ideas to find more explicit, general solutions.

150
In this example, Seth, from one of the Calculational teams, is trying to justify to the rest
of the group why his strategy of taking the ratio of the times is a more precise method for
adjusting to synchronize the timing than just dividing by two:
262. Scott: Why do you do that again?
263. Mr. E: Well, first, do we understand what he is dividing? I agree that there is also a why question. But first do we understand, so Seth is suggesting, you take the correct time, which is the time that Beyonce does, that’s what you’re supposed to do for the dance routine, you divide that by the time that, um, Justin took
264. Scott: To get there
265. Mr. E: When he was going to fast.
266. Scott: Okay.
267. Mr. E: And now the question is why. Why would you do that? Frank, this is a question for you too. We are trying to figure out what he did, why it makes sense.
268. Seth: It’s showing the, um, like how, sort of like how the Green team had, divided by two, but we wanted it more exact number, which is gives us the, the exact, um, which gives us the more exact number of how much the time, of how much the speed is. It’s a bit less than half the time.
In line 268 Seth articulates both how his strategy connects with and extends the Green team’s
strategy of dividing by two, and he connects his operation to the quantities in the situation by
suggesting how to interpret the ratio as representing “a bit less than half the time.” Examples of
both justifying and connecting can be found throughout the discussions. On the other hand, as
predicted by the manipulation, the justifications used in the Calculational did not use physical
mechanisms. Instead, they simply described number patterns and the inputs and outputs (in this
case “time” is the output).

151
Another interesting aspect of the Calculational groups solutions that emerged in that
group but not in the Mechanistic group was that they developed language for describing patterns
that they couldn’t explain. The numerical strategies in the Calculational group often became
complex and hard to follow. As a result, they developed the term “too smart” to indicate when a
team did a calculation that was too difficult to follow. I argue that these instances of not being
able to explain their reasoning or to understand some one else’s reasoning were not because the
individuals in this group lacked the mathematical sophistication. On the contrary, they did
capture and explain some very complex patterns. Instead, I argue that they were limited by
framing the task entirely as a calculational one, which led to solution strategies that were
unnecessarily complex for capturing the essential elements of the situation.
3.4.2.6 Post-interviews and the competition task
The post reflection interviews were conduced by a colleague of the author so as not bias students
responses. This interview was conducted with each team at the end of the last day (see
Appendix C.3 for the list of questions). One of the questions asked the teams whether they used
the strategies for robot movements that they had invented during the week on the competition
task. If the team responded affirmatively, then that would be an indication of their recognition
that both the robot dancing and competition tasks are structurally similar and both would benefit
from a math-based strategy.
All four Mechanistic groups but only one Calculational group reported using the
invented RSD strategies in the design competition task. For example, here is a response from a
student in one of the Calculational groups when asked whether they used any of the strategies
they developed during the week in the RSD activities on the competition task:

152
269. S: Not really. No. Cause there isn’t any, like, it isn’t like we are comparing two different robots to do the same thing. All robots are the same in this. We’re not using two different robots to do the same thing. So there really is no need for any strategies like that.
(Calculational Red Team)
A striking aspect to this student’s response is that he sees the RSD situation and the competition
task situation as being different in ways that make the methods unusable in one versus the other.
A similar distinction between the tasks, but for a different reason, was made by another
Calculational group:
270. S1: Cause it’s a different robot. It has bigger wheels.
271. S2: Well, we don’t know like, I don’t really know why we didn’t use one of our strategies. We just decided to use one and didn’t really think about the others.
272. S1: We’re still in the lead.
273. I: So it’s working for you?
274. S1, S2: Yeah
(Calculational Purple Team)
In contrast, all of the Mechanistic groups responded that they did use strategies they developed
during the week in the RSD tasks when developing their solution for the competition task. For
example:
275. S1: We sort of first wanted to find the distance of where it really had to go.
276. S2: So we measured them and divided it and we got the distance.
277. S1: The wheel rotations.
278. S2: Yeah, the wheel rotations.
279. S1: Of how far it was supposed to go.

153
280. …
281. S3: Oh when we got the circumference of the wheel, I thought it would be easier just to measure the thing in centimeters. But everything else was in inches. So I just got the centimeters and divided by 2.5 cause there’s 2.5 centimeters in an inch. And that’s how we got 10.4 as a circumference.
(Mechanistic Red Team)
Not only does this team see the connection and apply the same strategies, but also they recognize
that that the same fundamental ideas are relevant and useful even though some aspects may need
to be adapted (i.e., the unit of measure for length). Here is a second example from a Mechanistic
group:
282. S1: We used the, the strategies that we learned all throughout the week. Um, we, like, for the straights, we, um, used the circumference of the wheel as the rotations and measured it, measured the area.
283. I: What do you mean by measured the area?
284. S2: Like how far it was from here to here. And then we like said, I think the wheel was 26 cm, so we said one rotation would be 26 cm, two would be whatever that is times two.
(Mechanistic Purple Team)
As illustrated in this response, the students in the Mechanistic group still do have ideas that are
not correct (i.e., measuring “area” rather than “distance” or “length”), but they nevertheless are
able to focus on the key aspects that are structurally similar and to apply them appropriately in
this competition task.

154
3.4.3 Discussion
Overall only the Mechanistic group significantly improved their problem solving from pre to
post, whereas the Calculational group did not. In both conditions, students used and reasoned
about mathematics in sensible ways that were well connected to the robot situation. As a result,
both invented valid strategies that were useful in solving the RSD task.
As was expected given that the RSD unit was used in the Calculational condition of this
study in the same form that it was used in Study 4, both the Model Eliciting condition from
Study 4 and the Calculational condition from this study exhibited similar engagement outcomes.
Both groups had decreased interest in robotics as a result of participating in the RSD unit but
more positive views about the value of math for robotics. The decreased interest in robotics is
consistent with the explanation that engaging in rigorous mathematics within a robot activity—as
exemplified by the RSD activity—is hard work and so may negatively affect students’ interest if
they originally thought of robotics as a purely fun and informal activity. The findings that both
the Calculational condition from Study 6 and the Model Eliciting condition from Study 4
exhibited similar engagement outcomes along with the finding that so few teams within both of
those conditions exhibited evidence of mechanistic reasoning in their posters suggests that the
calculational orientation may be the default, dominant, or most common approach for connecting
math with robotics in this situation. Students seem to need further, more explicit supports—as
provided in the Mechanistic condition from this study—to take on the mechanistic approach.
That the calculational orientation is the dominant orientation is consistent with Thompson et al.
(1994) who note that moving out of the calculational orientation is very difficult to do, and even
if one does manage to move out of that orientation for a little while, it is very easy to fall back

155
into it. The calculational orientation may have advantages in situations of increasing complexity
(Koedinger et al., 2008), and so students’ reliance on that strategy may be sensible and adaptive.
Nevertheless, in this context a mechanistic approach seemed to be more productive.
Despite the difficulty in moving out of a calculational orientation, the students who
participated in the Mechanistic group did to some extent take on a mechanistic orientation in the
RSD unit as evidenced by their higher mechanistic scores on their posters. They used more
explanations and situational pictures on their posters, used more intermediate values with clear
references in the situation, and used more physical features of the robot as the basis for their
strategies. All of these aspects suggest that it is possible to get students to take on this
orientation, even if it was only for a short time in this setting. In addition, however, the
Mechanistic group also was more likely to extend their experiences from the RSD unit to the
competition task. All four Mechanistic teams did this even though the task was setup to make the
correspondence between the RSD tasks and the competition seem distant. The Calculational
group teams did not extend their experiences in the same way.
In addition to providing instructional opportunities for students to connect math to their
robot activity, alternative ways to setup the activities influence how students approach the task
and can be consequential for learning. As other researchers have argued (Greeno, 2009) and
investigated empirically (Elby, 2001; Hutchison & Hammer, 2009; May & Etkina, 2002; Redish
& Hammer, 2009), epistemological framing is an important factor. The studies reported in this
second part add to that research base and provide evidence that even when students are able to
make connections between mathematics and robotics, the particular math-to-robots approach that
students take may lead to different impacts on learning both quantitatively and qualitatively.

156
4.0 GENERAL DISCUSSION AND CONCLUSIONS
4.1 SUMMARY OF RESULTS
I am now in a position to update the figure from the end of Part 1 (Figure 19) by adding in the
Calculational and Mechanistic groups from the model-eliciting environment in Study 6
(Figure 25). With this figure as a guide, it is now possible to consider the findings of this
dissertation project as a whole. Although in many cases the low number of students within each
learning environment made it difficult to reliably assess the impact of participation, when the
quantitative results are combined with qualitative results of students’ work and their reflections,
then it is possible to draw conclusions. One notable result is that there is a wide range of
possibilities for approaching introductory robotics, from the formal classroom unit (Study 1) to
the informal competition settings (Study 3). The versions of the RSD unit (Study 2, Study 4, and
Study 6) attempted to bridge between these extremes. Further, within each of these possibilities
for instructional design of the learning environment, there were further possibilities for different
approaches by the students within them in how they used math as a tool for problem solving.

157
Figure 25. Effects of the environments and framings on learning and engagement
In the Scripted Inquiry environment (Study 1) the students did mathematics in very
explicit ways, but the connections to using the math to understand and program robot movements
were mostly implicit. As a result, the improvement of students in problem solving was mostly
limited to math outside of the robot context, their interest in math decreased, and their sense of
what math is useful for was narrow and limited to its use as a calculational tool. In the
Competition environment (Study 3), each team approached solving the challenge in very
different ways, with only a quarter of the teams choosing to use math in their solutions.

158
Interestingly, the teams that used math either did so extremely effectively in the competition or
very poorly, suggesting that using math is a risky strategy, but can have real benefits if done
well. It was also the case that both Focus Teams that chose to use math (Team E2 and Team M2)
were on the positive side of the disciplinary learning scale in Figure 25, but the Focus Team that
didn’t use math (Team M1) was on the negative side. Another notable finding is that even
though the Competition environment is generally considered a fun activity, none of the Focus
Teams, with the possible exception of the elementary school team (Team E2), had increases in
engagement. This surprising finding suggests that the relationship between the nature of the
robot learning environment and its effect on interest in robots, on interest in math, and on views
about their connections is not straightforward.
Turning to the designed learning environments, it proved to be a challenge to design a
structured set of activities that focused students’ attention effectively on the connections between
math and robots in an engaging way. Although the Design Based environment (Study 2)
demonstrated a promising approach for getting students to begin to make those connections to
math in ways that were useful within the robot context, further support and focus was required to
help students make more substantive progress. The revision of the Design Based environment as
a Model Eliciting environment (Study 4) served to help students more immediately focus on
connecting to math within the robot dancing activity from the beginning of the unit activities.
Students were engaged by the challenge of the synchronization problem itself, not just
programming robots to dance, and developed sophisticated math ideas that took advantage of
proportional reasoning as a tool for solving that synchronization problem. Although this did lead
to improvements in problem solving and in ratings about the value of math in robotics, it also
had the less desirable effect of decreasing students’ interest in robotics. As expected given that

159
they were the same unit, in Figure 25 the Calculational group from Study 6 is clustered right
next to the Model Eliciting group from Study 4, providing further support for the claim that the
model-eliciting environment improves students ability to connect math in robotics while
maintaining overall levels of disciplinary engagement. Again, however, the pattern in both
instances within the disciplinary engagement subscales is that students increase in their sense of
the value of math for doing robotics, suggesting that they have come to appreciate the math as a
tool in this situation. But the pattern is also that that desirable positive effect on valuing math in
robotics occurs concurrently with a less desirable decrease in interest in robotics. Although this
decrease in robotics interest is concerning, it is worth noting that in both cases students overall
robotics interest was still positive even at post. I will consider possible explanations for this
decrease in robotics interest further in the following section.
Continuing to build on the learning environment design, the Mechanistic group from
Study 6 represents another revision of the RSD unit that seemed to help students make even
deeper connections to math in their robot activities. By focusing on using math not only as a
calculational tool for manipulating numbers and finding answers, but also as a representational
tool for connecting to intuitions about how the structures of the robot function and behave in the
situation, students were able to improve even more on their problem solving. In addition to their
significant gains in learning on the pre-post problem solving assessment, this improvement in
problem solving was also evident in how the nature of their solutions to the RSD problem relied
on more physical mechanisms and images of those mechanisms, in how the substance of their
RSD solutions didn’t use guessing and were often generalized to other robots, and in their ability
to connect their RSD solutions to a competition task. Also notable in the Mechanistic group was
that there was not the same decrease in robotics interest that was observed in the other Model

160
Eliciting groups (the Model Eliciting group from Study 4 and the Calculational group from
Study 6). That the Mechanistic group maintained their interest in robotics may mean that
approaching the rigorous task of connecting math to robotics mechanistically may not only be
better for learning, but also for engagement as well.
4.2 MODELING AND MECHANISTIC THINKING
4.2.1 Empowering beginning roboticists as systematic designers
The research presented in this dissertation project provides support to the idea that math can
provide an organization to the complexity of situations, which may in turn lead to better
understanding and problem solving. Utilizing quantitative representations of qualitative features
of situations (Thompson, 1994) enables more precise observations and systematic manipulation
of those features. In the case of robots, the motor rotations used to program the robot to move are
already in a quantitative form in the programming environment, which means that students may
already be encouraged by the situation to use math. And yet, in the Competition environment
from Study 3, most teams don’t use math. Only students that take the additional step of
quantifying the distance the robot moves are able to more systematically approach that problem
and develop solutions that work efficiently and accurately across different moves. Similarly, the
students in the Scripted Inquiry environment from Study 1 are very attuned to the use of math as
an efficient way to get the answers when working with the robots and as an alternative to
guessing.

161
In addition to efficiency, however, math has the additional advantage of providing an
organization for students to more effectively incorporate more than one feature of the system into
their thinking and designing at the same time. Schwartz et al. (2005) explain that this advantage
of using math may be the result of converting different perceptual qualities of the system into the
same ontology—number—such that now those features can be compared and related. The
students in the Model Eliciting environments were able to use math in this way to invent
solutions that related multiple aspects of the system in predicting and controlling the robots’
movements. Integrating multiple aspects of the system together such that they are considered
simultaneously is considered to be very sophisticated understanding in the balance scale tasks as
used in Schwartz et al. (2005), but the integration of multiple features is also key in other tasks
and contexts (Siegler & Chen, 2008). Further, understanding the causal effect of individual
variables may be necessary but not sufficient for performing well at multivariable prediction
tasks that require coordinating between the variables (Kuhn, 2007). Although providing practice
with additive and interactive effects of variables in a system along with explicit instruction about
the logic of models for analyzing multiple variable systems may be beneficial (Kuhn, Pease, &
Wirkala, 2009), it may be that students’ difficulties are also the result of not having effective
tools for managing the cognitive load required to think about those variables simultaneously.
Mathematics may provide one option for making such complex thinking more tractable as
abstract representations do provide advantages over concrete representations when the
complexity of the problem situation increases (Koedinger et al., 2008). Although the students in
the studies reported here may not have reached the level of math use as a tool for thinking about
inaccessible phenomena as do professional engineers (Gainsburg, 2006), their use of math did go
beyond a mere computational tool for making the solution of simple, straightforward problems

162
more efficient. The students in the Model Eliciting groups also utilized math as a thinking tool
for helping them to understand and model the complex relations and behaviors within the
situation. This use of math helped them to invent sophisticated strategies for controlling the
movements of their robots that were useful and efficient for coordinating multiple aspects of the
situation in solving their immediate problems, but their solutions were also general and adaptable
to different movements and robots.
4.2.2 Concreteness versus abstractness in math-to-robot connections
Given that the students in the Model Eliciting groups did reach a more sophisticated
understanding of the connections between math and robots in this context, there are questions
about the extent to which their understanding was dependent upon knowledge of robots, of
wheels and rotations, and of the particular movement mechanisms involved in this situation. That
the students in the Mechanistic group from Study 6 were more likely to transfer their strategies to
the competition task than the students in the Calculational group suggests that the students in the
Mechanistic group developed strategies with a broader set of conditions of applicability. But
there is not evidence to suggest the students in the Mechanistic group developed strategies or
understandings that would generalize to even broader contexts involving other non-robot
proportional situations.
The local conceptual development (Lesh & Harel, 2003) in which the Model Eliciting
students engaged—wherein they essentially invented their own contextually-embedded versions
of the generally applicable math concept of proportions—would very possibly not transfer
spontaneously to non-robot contexts. This seems reasonable given that there was little explicit

163
instruction or opportunity to develop strategies and make connections outside of the robot
context (Norton, 2006). However, one possible result was that the Mechanistic group developed
understandings that would have greater potential to transfer outside of the robot context as a
result of subsequent learning experiences than would students in the other learning
environments. In other words, it may be that the Mechanistic groups were better prepared for
future learning (Bransford & Schwartz, 1999) as a result of developing deeper understandings
within this initial robot movement context. Research on concreteness versus abstractness
suggests that progressive idealization or “concreteness fading” has the greatest transferability,
compared to abstract to concrete sequences and abstract or concrete experiences alone
(Goldstone & Son, 2005). The originally grounded and well-understood ideas can over time
become less tied to their specific contexts, but still serve as a rich source of conceptual and
strategic knowledge from which to build more abstract and generalizable knowledge. Certainly
there is value in optimizing the initial contextualized learning experience—such that the concrete
ideas that students learn in that situation are indeed well understood and locally adaptable—prior
to or in conjunction with optimizing the features of the learning environment that are intended to
promote transfer outside of that context, even though both the initial context and the transfer
context may be ultimately important.
4.2.3 Epistemological frames for connecting math to robots
In addition to transfer of the particular concepts and strategies used in the robot context to other
robot and non-robot contexts, another form of transfer may be possible. Students in the Model
Eliciting units may have learned epistemological notions about what sorts of resources are best

164
drawn on in higher quality technological problem solving. The most relevant result supporting
the claim that students’ epistemological framing of robot tasks did change was the consistent
increases in students’ sense of the value of math for robotics from pre to post across the RSD
implementations. The one exception to that was in the Mechanistic group in Study 6, wherein a
significant change in the value of math for robotics was not detected. However, even in this
group there was a positive trend from pre to post, their post ratings were still very positive in an
absolute sense, and they all transferred the math strategies they created in the RSD unit to the
final competition task. Taken together, this evidence suggest that the Mechanistic group—in
addition to the other RSD groups—saw the math as a useful resource for solving robot problems.
However, that evidence is not directly relevant to the question of whether these students would
be likely to transfer their revised math-to-robot epistemological frames to non-robot contexts.
Similar to proportionality as a general mathematical principle, a likely scenario is that the
students wouldn’t necessarily transfer a mechanistic epistemological frame spontaneously, but
would be better prepared to do so if provided with more explicit support in a new context. More
specifically, providing students with explicit support for reflection on how it was useful to
connect their intuitions about mechanisms with mathematical representations might have made it
possible that students would approach a new problem in a similar manner. One approach to
facilitating epistemological development is to have students engage in introductory activities in
content-light contexts that make the “rules” and criteria of scientific epistemologies salient prior
to engaging in more content-rich inquiries (Cartier, Passmore, Stewart, & Willauer, 2005). Prior
to doing a unit about modeling celestial motion, to make explicit what is meant by scientific
explanations, Cartier et al. (2005) had students participate in a black box activity in which
students poured water in the top of a black box, observed patterns of water that came out the

165
bottom, and created and justified models about mechanisms within the box that might account
for the pattern. Although successful in that case, it may be that it is neither necessary nor optimal
to have students participate in extra activities to setup the target activities if the epistemological
supports can be built directly into the target activities themselves.
An alternative approach might be to modify the tasks within the core context such that
the epistemological aspects are not simply a prescribed way of doing things, but rather prove to
be a more useful approach within the context that students and the class value directly. For
example, in a semester-long undergraduate introductory physics course for biology majors,
Redish and Hammer (2009) designed the course to explicitly encourage students to develop
productive epistemologies about physics as a refinement of everyday thinking. They used
vocabulary that made different epistemological frames for their class discussions explicit, such
as “shopping for ideas” and “playing the implications game.” Redish and Hammer also modified
both peer instruction and interactive lecture demonstrations with the goal that students would not
just focus on the answer and set aside their intuitions, but would instead recognize the productive
aspects of their intuitions and how those intuitions relate to the canonical answers. In this
example, the epistemological frames were developed over the course of an entire semester, and
so it may be that meaningful, transferable changes in the epistemologies that students choose to
draw from can only be achieved over time and after explicit support for using those alternative,
more productive epistemologies in multiple instances. However, adding explicit vocabulary and
revising the RSD activities to directly facilitate epistemological change with a focus on
mechanistic approaches would likely increase the chance that the students would transfer their
approach to non-robot contexts outside of the RSD unit.

166
4.3 DESIGNING LEARNING ENVIRONMENTS
4.3.1 Targeting the connections between math and robots
A major issue analyzed for each of the learning environments studied in this dissertation was the
extent to which the environment facilitated students in using math as a tool for understanding
and problem solving with the robots. What was clear from the analyses was that there were many
different ways to introduce students to robotics, ranging from the highly structured Scripted
Inquiry unit to the open-ended Competition. Each of these learning environments makes the
connections between robots and math more or less salient in the activity that students do and in
the work that they produce. Although perhaps not surprising, one result is that when left mostly
unstructured, students are likely to invent problem solutions that don’t include math, as is the
case for most teams observed in the Competition. Thus, even if there is the potential to
mathematize a situation, students may not see the value in doing so and may find creative ways
to approach the problem without math. Conversely, the observations of the Scripted Inquiry
environment suggested that overly structuring the activity such that the math is essentially all
that students do even though their activity takes place in the context of robots leads to learning
mathematics disconnected from actual problem solving with robots. As a result, aligning
mathematics and robotics in a learning environment is not simply about putting students in a
situation where the math is remotely possible or strictly necessary. Rather, aligning math in robot
activities is complex. It requires subtle shifts in how problems are introduced and supported such
that the math is motivated as a tool for understanding and problem solving and students attend to
the connections between robots and math rather than either alone.

167
In their learning-goals-driven design model for developing project-based curricula,
Krajcik, McNeill, and Reiser (2008) articulate how the process of aligning instructional tasks to
learning goals is necessarily iterative and must take place at a fine-grained level in order to move
beyond superficial, topic-level connections. Krajcik et al. describe how their instructional
designs are revised by taking into account feedback from external reviewers and observations of
their tasks enacted in classrooms, since theoretical designs are often enacted in ways unintended
or unanticipated by the instructional designers. Furthermore, Krajcik et al. view alignment not as
a binary criterion, but instead recognize degrees of alignment and work toward obtaining the
“sufficient alignment” needed such that the knowledge they are targeting is both necessary and
sufficient for their desired student learning performances. The idea of alignment helps focus the
data collected and analysis undertaken so that the revisions to the instructional designs are
targeted and more likely to ultimately be effective. In the case of the RSD unit, the revisions of
the unit activities over the course of the studies helped the unit as a whole to more directly target
the connections between math and robots with the mathematics serving as a tool for
understanding and problem solving in the robot context.
In elaborating the principles for the design of model eliciting activities, Lesh et al. (Lesh
et al., 2000) have also recognized the complexity and subtlety of setting up situations such that
the mathematics is strongly motivated as a useful tool. In their case, they document how teachers
modified the setup of a model eliciting activity in small but significant ways over three iterations
so that students increasingly thought that the problem to be solved was less about making a one-
time solution and more about inventing a general tool for thinking about the situation. In the
RSD unit a similar set of revisions were made so that almost immediately after being introduced
to the problem students attended not just to making robots dance or to making a single

168
synchronized dance, but rather to inventing a tool for thinking about synchronizing the
movements of different robots. A useful design criterion that emerged through reflections on the
RSD unit revisions was that the more immediately students encoded the problem as being about
math-to-robot connections the better. The time students spent working on designing their own
dance routines in the Design Based version of the RSD unit didn’t align strongly with making
math-to-robot connections. In addition, that part of the unit likely influenced students’ framing of
the second part on synchronization, even though the second part was better aligned with math-to-
robot connections. The initial activities in the first part encouraged students to think of the
overall goal of the unit as being to design a single, working synchronized dance rather than to
design a general and adaptable toolkit for making synchronized movements. Overall, the analysis
of the design of the RSD unit provides further support to the usefulness of alignment as a
concept to help focus design iterations and to the importance of analyzing enactments of the
design. The goal of the revisions is to ensure that what students attend to in the unit aligns
strongly and immediately with the target ideas at a fine-grained level.
4.3.2 Targeting engagement and learning
A second major issue analyzed for each of the learning environments studied in this dissertation
was the extent to which the outcomes observed with students consisted of positive changes on
measures both of learning and of engagement. In some cases, as in the Scripted Inquiry
environment in Study 1, some learning did occur, but at the expense of students’ interest in
mathematics and overall engagement. Such negative experiences are likely to discourage
students to pursue further study in robotics or other STEM-related fields. In the Competition

169
cases, few changes in engagement were observed, which may be the result of those select
participants already having high levels of engagement that are for most part maintained or of the
low levels of participating students in each case, which made a change difficult to reliably detect.
A more puzzling finding was the Model Eliciting case, in which students’ did improve in their
problem solving and increased their sense of the value of math for robotics, but decreased their
interest in robotics (even though their absolute levels were still positive). Although it is not clear
whether outcomes like this would in fact discourage students to pursue further study in robotics
or other STEM-related fields, it is worth trying to better understand what about the design of the
Model Eliciting environments may have contributed to this result.
One possibility was the extent to which the learning environment design provided a
personally interesting context for the robot problems. Observations within the Design Based
environments suggested that indeed having students create their own dance routines was
engaging for students. However, the issue with that design approach arose when the students
transitioned to synchronizing their routines across different robots. The personalization aspect
was no longer central and so relative to the first part of the unit the tasks became less engaging.
In addition, because each team had created such different dance routines it was difficult to
compare between them when they presented their synchronization ideas to the rest of the teams
using data from their individual routines. Thus, the personalization may have had some initial
engagement benefits, but on balance may have limited learning and engagement in the
synchronization activities. Son and Goldstone (2009) have demonstrated how personally-relevant
framings of tasks can encourage students to take on goals that are specific to an individual’s
point of view and so may limit students’ attention to the underlying general structure common
across instances and contexts. In that sense, there may be negative consequences to learning that

170
result from personalizing the context. The Model Eliciting versions of the RSD unit in both
Study 4 and Study 6 did not have the students make their own dance routines and obtained better
learning results as a consequence. And yet, personalization may have some benefits if that initial
engagement were somehow better focused on the problem that aligned with the learning goals.
Further exploration of the influence of personalization suggests that from a cognitive
perspective personalization may not be beneficial overall, but may have certain limited benefits
that are worth teasing apart. Walkington and Maull (2011) provide data that suggest that
personalization can assist students in problem solving by making them more efficient at easier
parts of the problem such as reading and understanding the problem and identifying the givens
and unknowns. This allows students to focus more of their cognitive resources on the difficult
parts of the problem, and in doing so they are likely to be more successful overall. The RSD unit
attempted to include personalization in the learning environment design more in this way, by
setting up the problem in a way that students would have an implicit grasp of the issues almost
immediately. By framing the problem about dancing out of sync with perceptually salient
differences between the robots’ movements, students were able to attend more specifically to the
synchronization problem while also activating their own cognitive resources of mechanisms and
of mathematics to solve the problem. Observations of the students being introduced to the Model
Eliciting version of the problem when first seeing the robots dancing out of sync with each other
suggested that that problem itself was engaging to students and they felt motivated to solve it.
The observed engagement in the revised RSD task suggests that personalization may have an
important role in the design of learning environments, but that instructional designers should be
aware of how that personalization assists rather than hinders students in attending to the
underlying general structure of the problem.

171
4.4 CONCLUSION
Although each revision of the RSD unit has come closer, the ideal of identifying the features of
learning environments that reach the level of “hard fun” has not yet been realized as a result of
this dissertation project. Learning environment designs that align immediately and strongly to the
connections between robots and math and that use personalization to assist students in attending
to the cognitively challenging aspects of the problem are useful starting points. But more
research is needed to optimize the learning environment designs such that students’ productively
explore the ideas at deeper levels, are increasingly motivated and interested in doing so, and
sustain that productive disciplinary engagement over longer periods of time.

172
APPENDIX A
ATTITUDES SURVEY ITEMS
Item Text
Robotics Interest
RI2 I enjoy working on robotics problems
RI2 I would even give up some of my spare time to learn new topics in robotics
RI3 While working on a robotics problem, it sometimes happens that I don't notice time passing
RI4 Robotics is dull and boring (reverse coded)
Math Interest
MI1 I enjoy working on mathematical problems
MI2 I would even give up some of my spare time to learn new topics in mathematics
MI3 While working on a mathematical problem, it sometimes happens that I don't notice time passing
MI4 Mathematics is dull and boring (reverse coded)

173
Item Text
Math Value for Robotics
MVR1 I can think of many ways to use math in robotics
MVR2 Mathematics helps teach a person to think about robotics
MVR3 I believe studying math helps me with problem solving in robotics
MVR4 Mathematics is sometimes useful but not that important in robotics (reverse coded)

174
APPENDIX B
PROBLEM SOLVING ASSESSMENT ITEMS
B.1 STUDY 1 – SCRIPTED INQUIRY ASSESSMENT ITEMS
B.1.1 Form A
1A-1. How many miles will she run?
Debbie runs 0.6 of a mile every day. How many miles will Debbie run in 45 days?
1A-2. What is the radius of the wheel?
If the diameter of a robot’s wheel is 30 centimeters, what is the radius of the wheel?
a. 180 cm b. 90 cm c. 60 cm d. 15 cm e. 10 cm

175
1A-3. How far forward did the robot travel?
In the figure above, the robot started with its front at the 0 mark. How far forward has the robot traveled?
a. 50 centimeters b. 40 centimeters c. 25 centimeters d. 15 centimeters e. 10 centimeters
1A-4. What is the estimated distance along her path?
Carol wanted to estimate the distance from A to D along the path shown on the map above. She correctly rounded each of the given distances to the nearest mile and then added them. Which of the following sums could be hers?
a. 4 + 6 + 5 = 15 b. 5 + 6 + 5 = 16 c. 5 + 6 + 6 = 17 d. 5 + 7 + 6 = 18

176
1A-5. How many degrees did the robot turn?
In the figure above, a robot started out facing point A and then made a point turn so that it now faces point C (as shown). How many degrees did the robot turn?
a. 135° b. 125° c. 65° d. 60° e. 55°
1A-6. What is n?
If
225
=n
500, then
n =
a. 10 b. 20 c. 30 d. 40 e. 50

177
1A-7. Where is the distance on the line?
Kayla marked out the distances on a table to see how far her robot would travel forward when it started at 0. Her marks looked like the figure below. On the figure below, place a dot at the point that could represent a distance traveled of 1.75.
1A-8. What is the result when you divide?
Divide:
1A-9. How many broken robots expected?
From a collection of 500 robots, a sample of 25 was selected at random and tested. If 2 robots in the sample were found to have broken sensors, how many robots with broken sensors would be expected in the entire collection?
a. 50 b. 40 c. 30 d. 20 e. 10

178
1A-10. How long will it take the machine?
A certain machine produces 300 nails per minute. At this rate, how long will it take the machine to produce enough nails to fill 5 boxes of nails if each box will contain 250 nails?
a. 4 min b. 4 min 6 sec c. 4 min 10 sec d. 4 min 50 sec e. 5 min
Questions 11-13 refer to the following diagram. The diagram is part of a scale drawing of a robot maze.
1A-11. What is the length of the side of the maze?
What is the length, in feet, of the segment in the maze whose dimension is not given in the diagram?
a. 40 b. 36 c. 30 d. 24 e. 12

179
1A-12. What is the scale of the diagram of the maze?
Use the ruler provided to find, in terms of inches and feet, what scale has been used to construct the diagram.
1A-13. What would be the new length of the side of the maze?
If you were to redraw the diagram using a scale of 3/4 inch = 10 feet, what would be the length of the side that is 48 feet?
a. 12.0 in b. 7.5 in c. 5.6 in d. 3.6 in e. 3.0 in
1A-14. What is the ratio of eaters?
In a group of 1,200 adults, there are 300 vegetarians. What is the ratio of nonvegetarians to vegetarians in the group?
a. 1 to 3 b. 1 to 4 c. 3 to 1 d. 4 to 1 e. 4 to 3

180
1A-15. What’s the circumference of the wheel?
Using the centimeter ruler provided, find the circumference of the robot wheel above. (Use π = 3.14.)
____________________ centimeters
1A-16. Where is the arc?
On the circle with center C shown below, use the protractor to locate and label a point B that creates an arc AB with measure 235°. Darken this arc.

181
B.1.2 Form B
1B-1. How many centimeters did her robot move?
Jennifer’s robot moves forward 0.6 centimeters every complete rotation of its wheels. How many centimeters will Jennifer’s robot move forward in 45 complete wheel rotations?
1B-2. What is the radius of the circle?
If the diameter of a circle is 30 centimeters, what is the radius of the circle?
a. 10 cm b. 15 cm c. 60 cm d. 90 cm e. 180 cm

182
1B-3. How much liquid has been let out?
In the figure above, the tube was filled to the 0 mark at the start. How much liquid has been let out?
a. 10 milliliters b. 15 milliliters c. 25 milliliters d. 40 milliliters e. 50 milliliters
1B-4. What is the estimated distance the robot would travel on the path?
Marcus built a robot to do an obstacle course in his classroom. His robot is going to travel from A to D along the path shown on the map above. He wanted to estimate the distance that his robot would travel. Marcus correctly rounded each of the given distances to the nearest meter and then added them. Which of the following sums could be his?
a. 5 + 7 + 6 = 18 b. 5 + 6 + 6 = 17 c. 5 + 6 + 5 = 16 d. 4 + 6 + 5 = 15

183
1B-5. How many degrees is the angle?
In the figure above, the measure of angle ABC is
a. 55° b. 60° c. 65° d. 125° e. 135°
1B-6. What is the number of rotations?
If for every 2 complete rotations of the robot’s wheels the robot moves forward 25 centimeters, how many rotations are needed to get the robot to move forward 500 centimeters?
a. 50 b. 40 c. 30 d. 20 e. 10

184
1B-7. Where is the point on the line?
On the number line below, place a dot at the point that could represent 1.75.
1B-8. How many meters for each rotation?
Greg programmed his robot to move forward 15 complete wheel rotations. His robot traveled forward a total of 30.45 meters. How many meters did Greg’s robot move forward for each complete wheel rotation?
1B-9. How many dead batteries expected?
From a shipment of 500 batteries, a sample of 25 was selected at random and tested. If 2 batteries in the sample were found to be dead, how many dead batteries would be expected in the entire shipment?
a. 10 b. 20 c. 30 d. 40 e. 50
1B-10. How long will it take the robot?
A vacuum-cleaning robot is cleaning the wood floor of a person’s home at 300 square centimeters per minute. At this rate, how long will it take the vacuum-cleaning robot to clean enough of the floor to complete 5 rooms if each room has 250 square centimeters of floor?
a. 5 min b. 4 min 50 sec c. 4 min 10 sec d. 4 min 6 sec e. 4 min

185
Questions 11-13 refer to the following diagram. The diagram is part of a scale drawing of a house.
1B-11. What is the length of the side of the house?
What is the length, in feet, of the side whose dimension is not given in the diagram?
a. 12 b. 24 c. 30 d. 36 e. 40
1B-12. What is the scale of the diagram of the house?
Use the ruler provided to find, in terms of inches and feet, what scale has been used to construct the diagram.

186
1B-13. What would be the new length of the side of the house?
If you were to redraw the diagram using a scale of 3/4 inch = 10 feet, what would be the length of the side that is 48 feet?
a. 3.0 in b. 3.6 in c. 5.6 in d. 7.5 in e. 12.0 in
1B-14. What is the ratio of sensors?
In a group of 1,200 student-built robots, there are 300 that use the touch sensor and the rest use the ultrasonic sensors. What is the ratio of robots that use the ultrasonic sensor to robots that use the touch sensor in the group?
a. 4 to 3 b. 4 to 1 c. 3 to 1 d. 1 to 4 e. 1 to 3
1B-15. What’s the circumference of the circle?
Using the centimeter ruler provided, find the circumference of the circle with center C above. (Use π = 3.14.)
____________________ centimeters

187
1B-16. Where did the robot turn?
The robot is placed in the center of the circle shown, with the center of the circle at point C and the robot facing point A. Use the protractor to locate and label a point B that would illustrate the robot making a 235° point turn. Darken the outline of the circle where the robot would make its turn.
B.2 STUDY 2 – DESIGN BASED UNIT ASSESSMENT ITEMS
2-1. What is n?
If
225
=n
500, then
n =
a. 10 b. 20 c. 30 d. 40 e. 50

188
2-2. Which enlargement?
Roxanne plans to enlarge her photograph, which is 4 inches by 6 inches. Which of the following enlargements maintains the same proportions as the original photograph? Justify your answer.
5 inches by 7 inches 5 inches by 7½ inches
2-3. How tall is Mr. Tall in paper clips?
You can see the height of Mr. Short measured with paper clips. Mr. Short has a friend Mr. Tall. When we measure their heights with matchsticks:
Mr. Short’s height is four matchsticks. Mr. Tall’s height is six matchsticks.
How many paper clips are needed for Mr. Tall’s height?
2-4. How far away is the destination?
Car A and Car B are leaving the same place and going to the same destination. If it takes Car A 6 hours to get to the destination driving 25 miles per hour, and Car B 3 hours to get to the destination driving 50 miles per hour, how far away is the destination?
2-5. How many rulers?
Rulers cost $0.85 for two, including tax. How many rulers can Tom buy if he has $7.00?

189
2-6. Which car will arrive first?
Victor’s van travels at a rate of 8 miles every 10 minutes. Sharon’s sedan travels at a rate of 20 miles every 25 minutes.
If both cars start at the same time, will Sharon’s sedan reach point A, 8 miles away, before, at the same time, or after Victor’s van? Explain your reasoning.
2-7. How many minutes?
A really fast runner runs for 40 minutes at 12 miles per hour. How many minutes would a much slower runner need to run in order to go the same distance if the slower runner keeps a pace of 8 miles per hour?
2-8. How many steps?
A giraffe moves forward 10 meters every step that she takes. A lion moves forward only 2 meters every step that she takes. If the giraffe takes 80 steps, how many steps must the lion take to cover the same distance as the giraffe?

190
2-9. What is the relationship of cards sold to profit?
Angela makes and sells special-occasion greeting cards. The table below shows the relationship between the number of cards sold and her profit. Based on the data in the table, which of the following equations shows how the number of cards sold and profit (in dollars) are related?
Mon. Tues. Wed. Thurs. Fri. Sat.
Number Sold, n 4 0 5 2 3 6
Profit, p $2.00 $0.00 $2.50 $1.00 $1.50 $3.00
a.
p = 2n b.
p = 0.5n c.
p = n − 2 d.
p = 6 − n e.
p = n +1
2-10. What is the relationship of painters to time?
Justin runs a painting company. The table below shows the relationship between the number of painters he gets to work on a job and the number of days it takes to complete that job. Based on the data in the table, which of the following equations shows how the number of painters and the time to finish the job (in days) is related?
Number of Painters Working
P
Time to Complete the Job T (days)
5 2
1 10
4 2.5
2 5
a.
T =10 × P b.
T = 7 − P c.
T = 2.5 × P d.
T =10 /P e.
T = 3 + P

191
B.3 STUDIES 3-6 – COMPETITION AND MODEL ELICITING ACTIVITY
ASSESSMENT ITEMS
3-1. How many motor rotations has Alexa’s robot done?
Alexa downloaded the same program to two identical robots. First, she starts one robot. A few moments later she starts the second robot. By the time the first robot had done 7 motor rotations, the second robot had done 3 motor rotations. How many total motor rotations will the first robot have completed by the time the second robot has completed 12 motor rotations?
3-2. If you change the motor rotations, how far forward now?
A robot completes a move with 12 motor rotations and moves forward 14 centimeters. You modify the program to be 30 motor rotations. How far will it move forward now?
3-3. How many for movement B?
Three different movements are programmed into a robot.
A: Move 15 cm straight forward B: Move 10 cm straight forward C: Move 5 cm straight forward
If it takes 2 motor rotations to do movement C, how many motor rotations are needed for movement B?
3-4. How many rotations are needed?
A robot moved forward 6 centimeters when it was programmed to do 4 motor rotations. The programmer needed to make her robot move forward 24 centimeters. How many motor rotations does she need to enter in her program to do her move correctly?
3-5. If you change the wheels, how far forward now?
A robot has a wheel circumference of 3 centimeters. The programmer successfully gets the robot to move forward 90 centimeters. The programmer then puts on new wheels with a wheel circumference of 7 centimeters and runs the same program. How far will the robot move forward now?

192
3-6. Which robot moves further?
Robot A has wheels with a circumference of 3 centimeters and is programmed to do 3 motor rotations. Robot B has wheels with a circumference of 4 centimeters and is programmed to do 2 motor rotations. Which robot moves further?
a. Robot A moves further. b. Robot B moves further. c. They move the same distance.
3-7. Which robot needs more motor rotations?
Robot A moves forward 10 centimeters in 4 motor rotations. Robot B moves forward 15 centimeters in 6 motor rotations. Which robot will need more motor rotations to move forward a distance of 40 centimeters?
a. Robot A will need more motor rotations. b. Robot B will need more motor rotations. c. They will both need the same number of motor rotations.
3-8. Does Ed’s rule work?
Ed got his robot working for one movement through trial-and-error. He got it to move straight forward 4 centimeters by programming it to do 10 motor rotations. Instead of doing trial-and-error again, he wanted to predict how many motor rotations he would need to put in his program to get his robot to go 6 centimeters. He said:
I know that when I want my robot to go further I need to add more motor rotations. Since 10 motor rotations gets me 4 centimeters, and 6 is two more than 4, I need to add two to the motor rotations also. 10 plus 2 is 12. That is why I think 12 motor rotations will work.
Do you think Ed’s idea works? If you do think his idea works, then explain why it makes sense. If you don’t think his idea works, then explain why not and what he should do to fix his idea.
a. Yes, I do think Ed’s idea works. b. No, I don’t think Ed’s idea works.

193
3-9. Will one of Michelle’s robots ever be twice as far as the other?
Michelle has two robots that she sets up side-by-side at the start line. She programmed them to move at the same motor speed straight forward and to keep moving until she pressed the stop button. One robot has a 3-centimeter wheel circumference and the other has a 5-centimeter wheel circumference. Will one robot ever be twice as far as the other robot from the start line? If so, which robot and when? If not, explain why not?
a. Yes, one robot will eventually be twice as far as the other robot. b. No, one robot will never be twice as far as the other robot.
3-10. How tall is Mr. Tall in paper clips?
You can see the height of Mr. Short measured with paper clips. Mr. Short has a friend Mr. Tall. When we measure their heights with matchsticks:
Mr. Short’s height is four matchsticks. Mr. Tall’s height is six matchsticks.
How many paper clips are needed for Mr. Tall’s height?
3-11. How many dictionaries can it print? [Study 6 Only]
A printing press takes exactly 12 min to print 14 dictionaries. How many dictionaries can it print in 30 min?

194
APPENDIX C
INTERVIEW QUESTIONS
C.1 STUDY 1 – SCRIPTED INQUIRY REFLECTION INTERVIEW QUESTIONS
Introduction
I’d like to ask you a few questions so that I can understand your interests in robotics and mathematics and what makes you be motivated to try hard at something. Ultimately, we hope to better design classroom experiences, like this robotics unit, to take advantage of your interests and the things that motivate you, so the more honest you are the more we will be able to improve. None of your answer will affect your grade in the class.
Questions
1. Tell me about what you thought of this course. Can you tell me about one time in this course when…
a. … you really tried (didn’t try) hard? Why did you try hard? b. … you were really (un)interested? What about that time was
(un)interesting? c. … you felt really frustrated (supported)? What about that time made
you feel frustrated (supported)? d. Would you say that most of the time you were interested or
uninterested? e. Would you say that most of the time you were felt frustrated or
supported? f. What might motivate you to try harder more often in this course?

195
2. Tell me about your thoughts on the relationship between math and robotics.
a. Is math helpful for doing robotics? Or is it really just unnecessary? b. Does math motivate you to try harder or less hard in robotics? c. Does robotics make it harder or easier to understand math?
3. Tell me about what you see yourself doing after high school.
a. What made you choose the robotics/tech magnet at [school name]? b. Will you go to college? If so, what will you study? c. What kind of job do you plan on having? d. Will you be doing anything that uses mathematics and/or robotics?
4. Tell me about one thing outside of class/school that you really care about and work hard in.
a. What is it that you like about it? b. What is it that motivates you to work hard at it? c. How is that different than the things you do in school? d. Are there things that you are motivated to work hard at even though
you aren’t interested in them?
General Follow-up Prompts
Please tell me more about that… Is what you meant…? Is that true in general for you…?
C.2 STUDY 3 – COMPETITION DESIGN STRATEGY INTERVIEW QUESTIONS
Introduction
I’d like to ask you a few questions so that we can better understand what sort of teams are at this competition and the types of approaches that they took to solving the challenge. Ultimately, we hope to find out what are some of the things that makes a team successful. None of your answers will affect your performance in the competition. I’d like to start with a mentor (you) to ask about who your team is, and then I’d like to talk with a student to ask about your team’s solution.

196
Questions (to Mentors)
1. Number of Students (put a count next to each one)
a. # of 8th graders? b. # of 7th graders? c. # of 6th graders? d. # of 5th graders? e. # of 4th graders? f. # of 3rd graders? g. # of 2nd graders? h. Other? (describe)
2. Competition Experience of Students (put a count next to each one)
a. # of Rookies? b. # w/ 1 Prior Competition? c. # w/ 2+ Prior Competitions?
3. Number of Mentors/Coaches (put a count next to each one)
a. # of Professionals w/ robotics-related background? b. # of Teachers w/ robotics-related background? c. # of Professionals w/o robotics-related background? d. # of Teachers w/o robotics-related background? e. Other? (describe)
4. Competition Experience of Mentors/Coaches (put a count next to each one)
a. # of Rookies? b. # w/ 1 Prior Competition? c. # w/ 2+ Prior Competitions?
5. Hours Team has Met in Preparation (put a count next to each one)
a. # Prior to Last 2 Weeks? b. # in Last 2 Weeks? c. # in Total?

197
Questions (to Students)
6. Programming Platform (choose all that apply)
a. NXT-G? b. ROBOTC? c. LabVIEW? d. easyC?
7. Robot Platform (choose all that apply)
a. LEGO RCX? b. LEGO NXT?
8. Robot Base Design (choose one)
a. Tankbot (RCX)? b. Robotics Educator (NXT)? c. Taskbot (NXT)? d. Domabot (NXT)? e. Completely original design? f. Other? (describe) g. Did you adapt it? (yes or no) h. If you did adapt it, how? (describe)
9. Solution Strategy Straight – At any point in your solution, does your robot have to straight a specific distance? (yes or no)
a. What is the game context? (describe) b. Did you measure how far it has to go? (yes or no)
i. If you did measure it, how far? c. What sensor did you use for that movement? (choose one)
i. Touch? ii. Rotation?
iii. Timer? iv. Sound? v. Light?
vi. Ultrasonic? d. How did you determine the value for the sensor?
i. N/A? ii. Unsystematic guess & test?
iii. Systematic guess & test? iv. Proportion calculation?

198
v. Overshoot? vi. Other? (describe)
10. Solution Strategy Turns – At any point in your solution, does your robot have to turn a specific amount? (yes or no)
a. What is the game context? (describe) b. Did you measure how much it has to turn? (yes or no)
i. If you did measure it, how much? c. What sensor did you use for that movement? (choose one)
i. Touch? ii. Rotation?
iii. Timer? iv. Sound? v. Light?
vi. Ultrasonic? d. How did you determine the value for the sensor?
i. N/A? ii. Unsystematic guess & test?
iii. Systematic guess & test? iv. Proportion calculation? v. Overshoot?
vi. Other? (describe)
11. Solution Strategy Manipulators – At any point in your solution, do the manipulators on your robot have to move a specific amount? (yes or no)
a. What is the game context? (describe) b. Did you measure how much it they have to move? (yes or no)
i. If you did measure it, how much? c. What sensor did you use for that movement? (choose one)
i. Touch? ii. Rotation?
iii. Timer? iv. Sound? v. Light?
vi. Ultrasonic? d. How did you determine the value for the sensor?
i. N/A? ii. Unsystematic guess & test?
iii. Systematic guess & test? iv. Proportion calculation? v. Overshoot?
vi. Other? (describe)

199
12. Other Strategies
a. Thinking of the behaviors above, did you try a different way to determine the value for the sensor that didn’t work? (yes or no)
i. Yes? (describe) b. Did you ever try to use math for determining the value for the sensor?
(yes or no) i. Yes? (describe)
c. Did you ever use math in any other aspect of your work preparing for the competition? (yes or no)
i. Yes? (describe)
C.3 STUDY 6 – MODEL ELICITING REFLECTION INTERVIEW QUESTIONS
Introduction
I’d like to ask you a few questions so we can better understand what you did this week and how the experience may have impacted your thinking about robots.
Questions
1. How did you approach the problem of this game?
a. Did you use any strategies that we talked about this week? b. If so, where/when? c. If not, why not? d. Did you use any math at all? e. If so, where/when? f. If not, why not? g. If you had more time, how would you have approached it differently?
2. How has this week influenced your thinking about robots?
a. How they work? b. How you understand them? c. How much you are interested in them?

200
3. How has this week influenced your thinking about math?
a. How you understand it? b. How useful it is? c. How much you are interested in it?

201
APPENDIX D
DESIGN BASED ENVIRONMENT ACTIVITY MATERIALS
Wksht 1 – The Design Task Wksht 2 – Alternative Ideas Wksht 3 – Dance Programming Wksht 4 – Design Specification Wksht 5 – Measurements Example Wksht 6 – Measurements Instructions Wksht 7 – First Synchronization Attempt Wksht 8 – Evaluating the First Synchronization Attempt Wksht 9 – Creating a Method to Synchronize the Robots Wksht 10 – Data Table for Adjusting Straight Distances Wksht 11 – Adjusting Straight Distances – Summary Table Wksht 12 – Adjusting Straight Distances – Testing Your Strategy Wksht 13 – Adjusting Straight Distances – Extending Your Wksht 14 – Adjusting Straight Distances – Finalizing Wksht 15 – Adjusting Straight Speed– Summary Table Wksht 16 – Synchronizing Straight Moves – Distance and Speed Wksht 17 – Adjusting Straight Speed – Finalizing

202
WKSHT 1 – THE DESIGN TASK (PAGE 1 OF 5)

203
WKSHT 1 – THE DESIGN TASK (PAGE 2 OF 5)

204
WKSHT 1 – THE DESIGN TASK (PAGE 3 OF 5)

205
WKSHT 1 – THE DESIGN TASK (PAGE 4 OF 5)
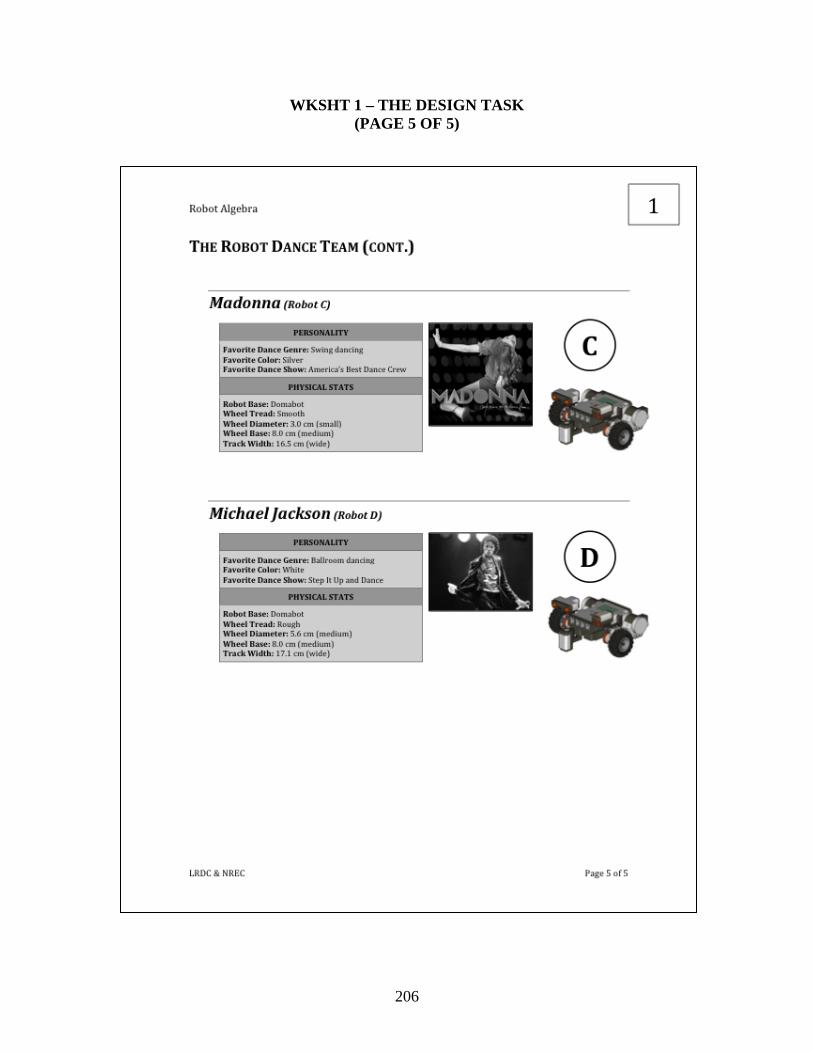
206
WKSHT 1 – THE DESIGN TASK (PAGE 5 OF 5)

207
WKSHT 2 – ALTERNATIVE IDEAS (PAGE 1 OF 1)
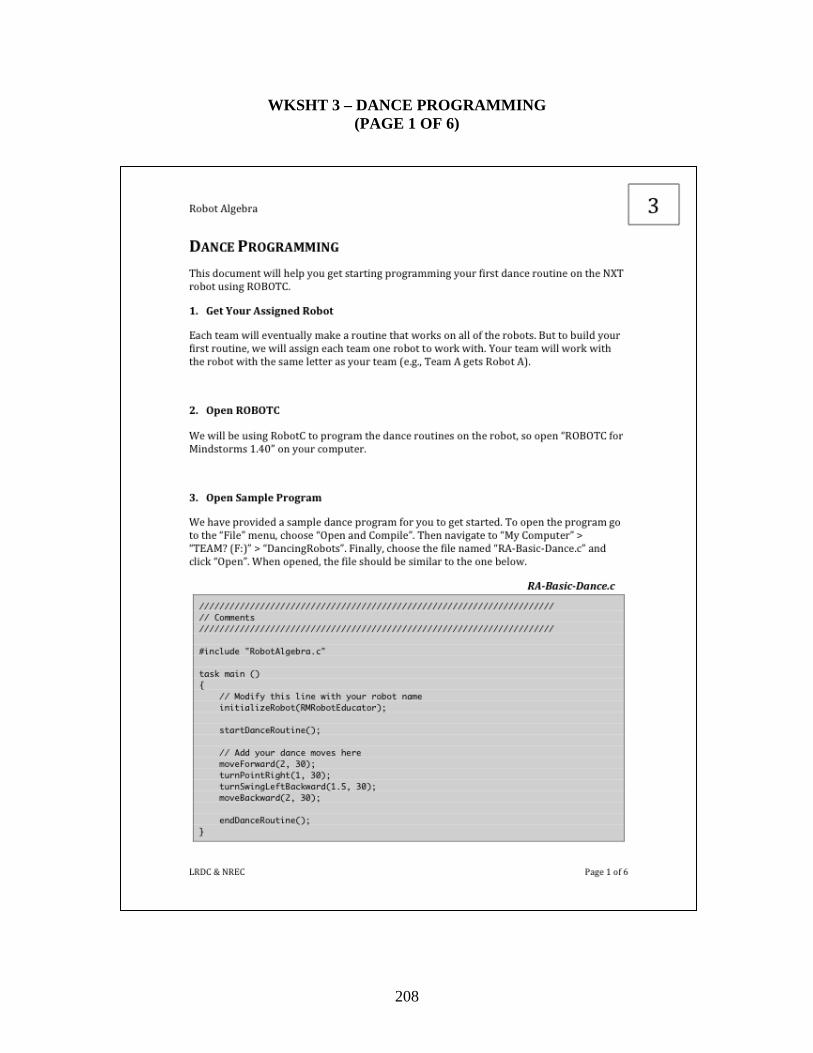
208
WKSHT 3 – DANCE PROGRAMMING (PAGE 1 OF 6)

209
WKSHT 3 – DANCE PROGRAMMING (PAGE 2 OF 6)

210
WKSHT 3 – DANCE PROGRAMMING (PAGE 3 OF 6)

211
WKSHT 3 – DANCE PROGRAMMING (PAGE 4 OF 6)

212
WKSHT 3 – DANCE PROGRAMMING (PAGE 5 OF 6)
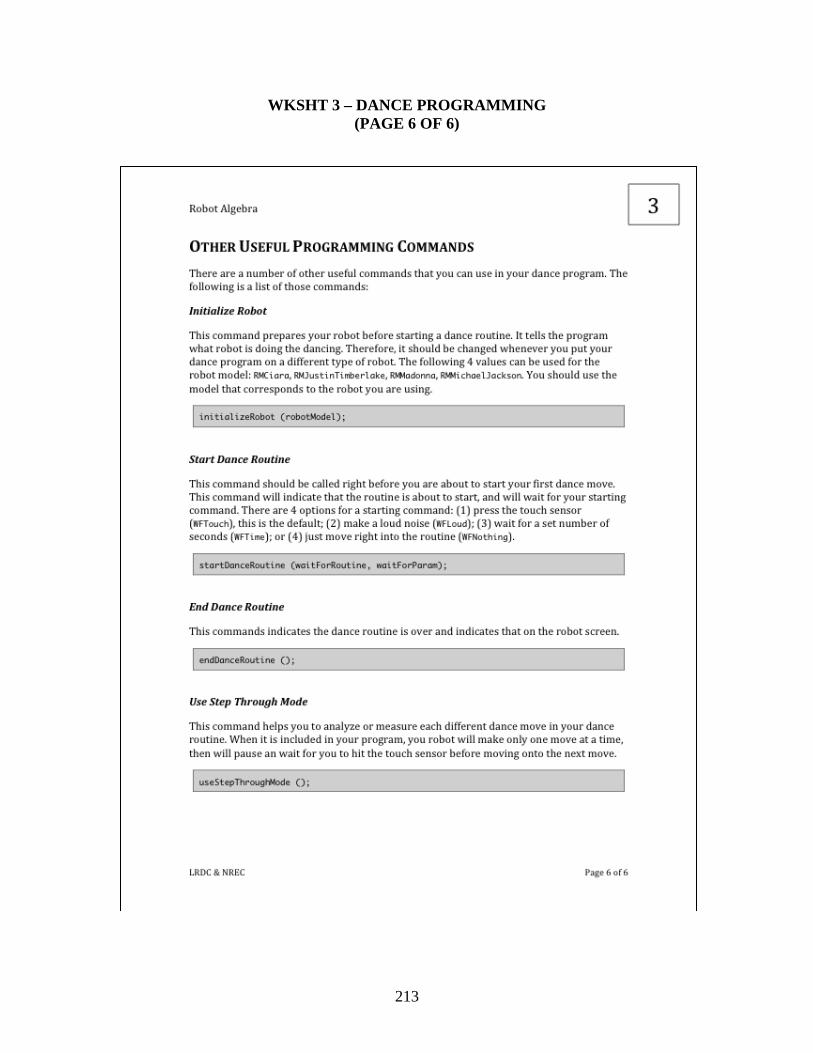
213
WKSHT 3 – DANCE PROGRAMMING (PAGE 6 OF 6)

214
WKSHT 4 – DESIGN SPECIFICATION (PAGE 1 OF 4)

215
WKSHT 4 – DESIGN SPECIFICATION (PAGE 2 OF 4)

216
WKSHT 4 – DESIGN SPECIFICATION (PAGE 3 OF 4)

217
WKSHT 4 – DESIGN SPECIFICATION (PAGE 4 OF 4)

218
WKSHT 5 – MEASUREMENTS EXAMPLE (PAGE 1 OF 2)

219
WKSHT 5 – MEASUREMENTS EXAMPLE (PAGE 2 OF 2)

220
WKSHT 6 – MEASUREMENTS INSTRUCTIONS (PAGE 1 OF 2)

221
WKSHT 6 – MEASUREMENTS INSTRUCTIONS (PAGE 2 OF 2)

222
WKSHT 7 – FIRST SYNCHRONIZATION ATTEMPT (PAGE 1 OF 2)

223
WKSHT 7 – FIRST SYNCHRONIZATION ATTEMPT (PAGE 2 OF 2)

224
WKSHT 8 – EVALUATING THE FIRST SYNCHRONIZATION ATTEMPT (PAGE 1 OF 2)

225
WKSHT 8 – EVALUATING THE FIRST SYNCHRONIZATION ATTEMPT (PAGE 2 OF 2)

226
WKSHT 9 – CREATING A METHOD TO SYNCHRONIZE THE ROBOTS (PAGE 1 OF 2)

227
WKSHT 9 – CREATING A METHOD TO SYNCHRONIZE THE ROBOTS (PAGE 2 OF 2)

228
WKSHT 10 – DATA TABLE FOR ADJUSTING STRAIGHT DISTANCES (PAGE 1 OF 2)

229
WKSHT 10 – DATA TABLE FOR ADJUSTING STRAIGHT DISTANCES (PAGE 2 OF 2)

230
WKSHT 11 – ADJUSTING STRAIGHT DISTANCES – SUMMARY TABLE (PAGE 1 OF 2)

231
WKSHT 11 – ADJUSTING STRAIGHT DISTANCES – SUMMARY TABLE (PAGE 2 OF 2)

232
WKSHT 12 – ADJUSTING STRAIGHT DISTANCES – TESTING YOUR STRATEGY (PAGE 1 OF 1)

233
WKSHT 13 – ADJUSTING STRAIGHT DISTANCES – EXTENDING YOUR STRATEGY (PAGE 1 OF 2)

234
WKSHT 13 – ADJUSTING STRAIGHT DISTANCES – EXTENDING YOUR STRATEGY (PAGE 2 OF 2)

235
WKSHT 14 – ADJUSTING STRAIGHT DISTANCES – FINALIZING (PAGE 1 OF 1)

236
WKSHT 15 – ADJUSTING STRAIGHT SPEED– SUMMARY TABLE (PAGE 1 OF 2)

237
WKSHT 15 – ADJUSTING STRAIGHT SPEED – SUMMARY TABLE (PAGE 2 OF 2)

238
WKSHT 15 – DATA TABLE FOR ADJUSTING STRAIGHT SPEED (PAGE 1 OF 2)

239
WKSHT 15 – DATA TABLE FOR ADJUSTING STRAIGHT SPEED (PAGE 2 OF 2)

240
WKSHT 16 – SYNCHRONIZING STRAIGHT MOVES – DISTANCE AND SPEED RECAP (PAGE 1 OF 2)

241
WKSHT 16 – SYNCHRONIZING STRAIGHT MOVES – DISTANCE AND SPEED RECAP (PAGE 2 OF 2)

242
WKSHT 17 – ADJUSTING STRAIGHT SPEED – FINALIZING (PAGE 1 OF 1)

243
APPENDIX E
MODEL ELICITING ENVIRONMENT ACTIVITY MATERIALS
Wksht 1 – Problem Introduction Wksht 2 – Quality Assurance Guide Wksht 3 – Programming Reference Wksht 4 – Keeping Track Wksht 5 – Team Ideas – Your First Ideas Wksht 6 – Team Ideas – Synchronizing Straight Distance Wksht 7 – Synchronizing Distance – Example Strategy 1 Wksht 8 – Synchronizing Distance – Example Strategy 1 Wksht 9 – Synchronizing Distance – Choosing the Best Strategy Wksht 10 – Extension Problem Wksht 11 – Team Ideas – Synchronizing Straight Timing Wksht 12 – Synchronizing Timing – Example Strategies Wksht 13 – Synchronizing Timing – Choosing the Best Strategy Wksht 14 – Team Ideas – Synchronizing Turns Wksht 15 – Synchronizing Turns – Example Strategy

244
WKSHT 1 – PROBLEM INTRODUCTION (PAGE 1 OF 2)

245
WKSHT 1 – PROBLEM INTRODUCTION (PAGE 2 OF 2)

246
WKSHT 2 – QUALITY ASSURANCE GUIDE (PAGE 1 OF 2)

247
WKSHT 2 – QUALITY ASSURANCE GUIDE (PAGE 2 OF 2)

248
WKSHT 3 – PROGRAMMING REFERENCE (PAGE 1 OF 2)
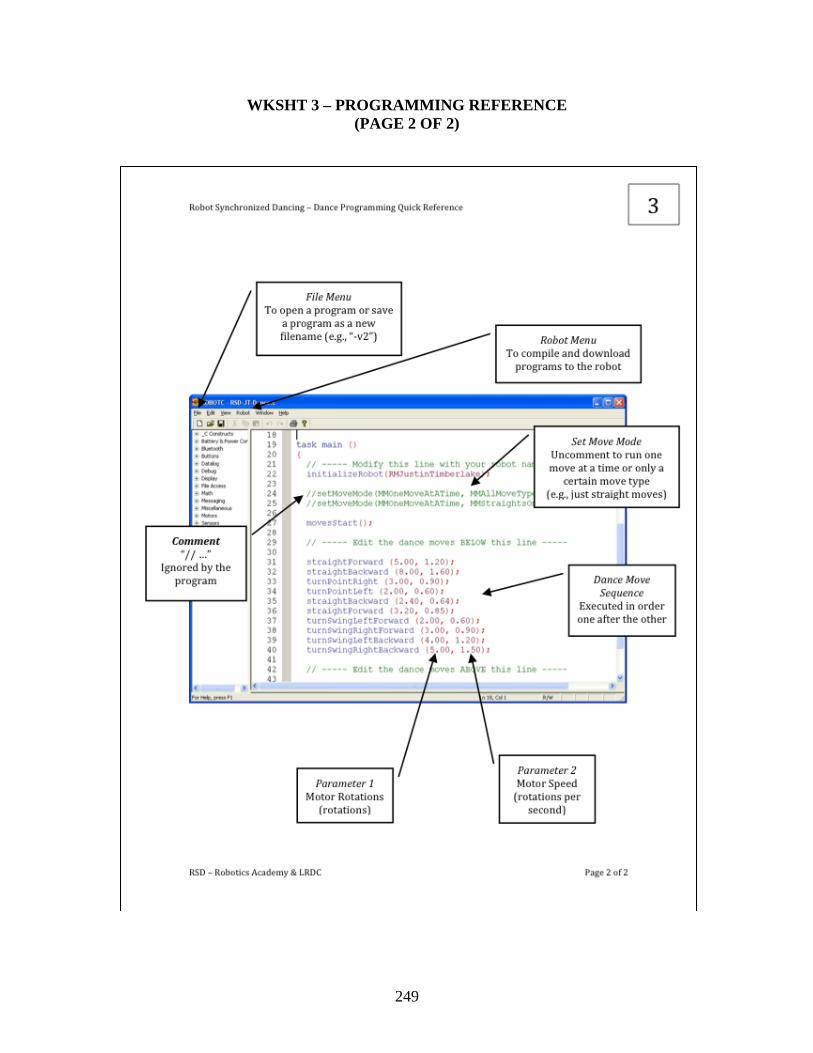
249
WKSHT 3 – PROGRAMMING REFERENCE (PAGE 2 OF 2)

250
WKSHT 4 – KEEPING TRACK (PAGE 1 OF 1)
251
WKSHT 5 – TEAM IDEAS – YOUR FIRST IDEAS (PAGE 1 OF 1)

252
WKSHT 6 – TEAM IDEAS – SYNCHRONIZING STRAIGHT DISTANCE (PAGE 1 OF 2)

253
WKSHT 6 – TEAM IDEAS – SYNCHRONIZING STRAIGHT DISTANCE (PAGE 2 OF 2)

254
WKSHT 7 – SYNCHRONIZING DISTANCE – EXAMPLE STRATEGY 1 (PAGE 1 OF 1)

255
WKSHT 8 – SYNCHRONIZING DISTANCE – EXAMPLE STRATEGY 1 (PAGE 1 OF 2)

256
WKSHT 8 – SYNCHRONIZING DISTANCE – EXAMPLE STRATEGY 1 (PAGE 2 OF 2)

257
WKSHT 9 – SYNCHRONIZING DISTANCE – CHOOSING THE BEST STRATEGY (PAGE 1 OF 2)

258
WKSHT 9 – SYNCHRONIZING DISTANCE – CHOOSING THE BEST STRATEGY (PAGE 2 OF 2)

259
WKSHT 10 – EXTENSION PROBLEM (PAGE 1 OF 1)

260
WKSHT 11 – TEAM IDEAS – SYNCHRONIZING STRAIGHT TIMING (PAGE 1 OF 2)
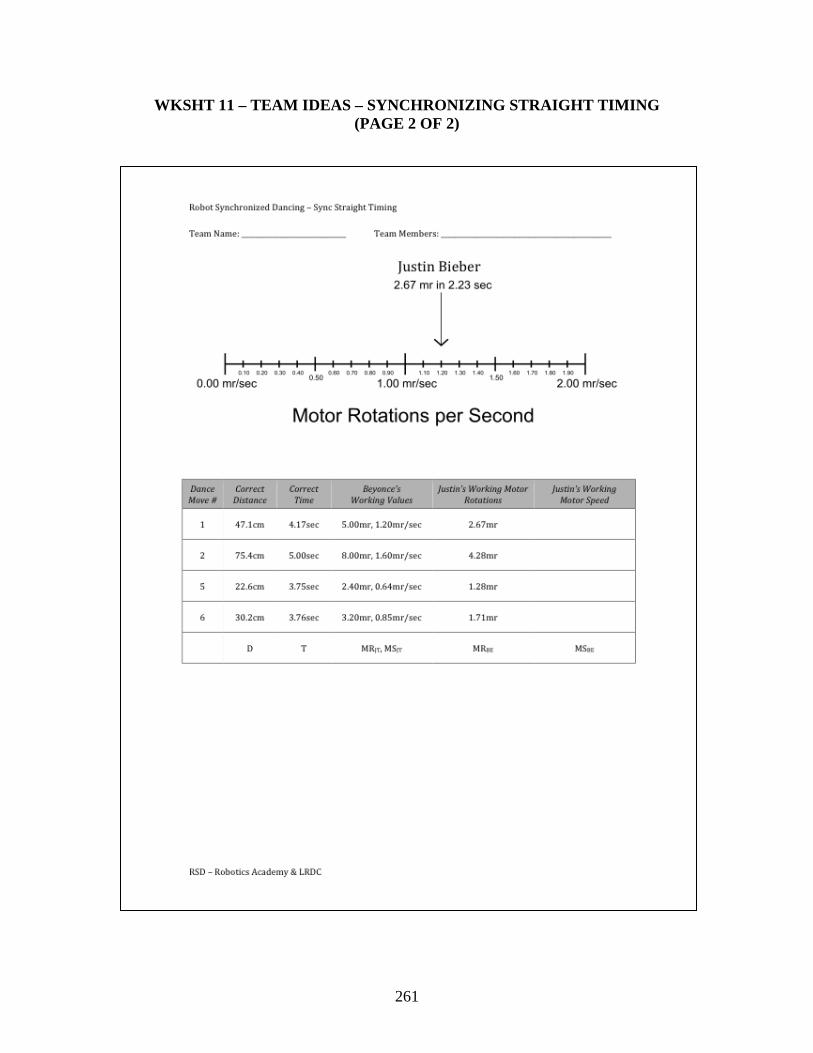
261
WKSHT 11 – TEAM IDEAS – SYNCHRONIZING STRAIGHT TIMING (PAGE 2 OF 2)

262
WKSHT 12 – SYNCHRONIZING TIMING – EXAMPLE STRATEGIES (PAGE 1 OF 2)

263
WKSHT 12 – SYNCHRONIZING TIMING – EXAMPLE STRATEGIES (PAGE 2 OF 2)

264
WKSHT 13 – SYNCHRONIZING TIMING – CHOOSING THE BEST STRATEGY (PAGE 1 OF 2)

265
WKSHT 13 – SYNCHRONIZING TIMING – CHOOSING THE BEST STRATEGY (PAGE 2 OF 2)

266
WKSHT 14 – TEAM IDEAS – SYNCHRONIZING TURNS (PAGE 1 OF 2)

267
WKSHT 14 – TEAM IDEAS – SYNCHRONIZING TURNS (PAGE 2 OF 2)

268
WKSHT 15 – SYNCHRONIZING TURNS – EXAMPLE STRATEGY (PAGE 1 OF 1)

269
APPENDIX F
MECHANISTIC ENVIRONMENT ACTIVITY MATERIALS
Wksht 7 – Synchronizing Distance – Example Strategy 1 Wksht 8 – Synchronizing Distance – Example Strategy 1 Wksht 12 – Synchronizing Timing – Example Strategies Wksht 15 – Synchronizing Turns – Example Strategy Wksht 16 – Madness Competition

270
WKSHT 7 – SYNCHRONIZING DISTANCE – EXAMPLE STRATEGY 1 (PAGE 1 OF 1)

271
WKSHT 8 – SYNCHRONIZING DISTANCE – EXAMPLE STRATEGY 1 (PAGE 1 OF 2)

272
WKSHT 8 – SYNCHRONIZING DISTANCE – EXAMPLE STRATEGY 1 (PAGE 2 OF 2)

273
WKSHT 12 – SYNCHRONIZING TIMING – EXAMPLE STRATEGIES (PAGE 1 OF 2)

274
WKSHT 12 – SYNCHRONIZING TIMING – EXAMPLE STRATEGIES (PAGE 2 OF 2)

275
WKSHT 15 – SYNCHRONIZING TURNS – EXAMPLE STRATEGY (PAGE 1 OF 1)

276
WKSHT 16 – MADNESS COMPETITION (PAGE 1 OF 2)

277
WKSHT 16 – MADNESS COMPETITION (PAGE 2 OF 2)

278
BIBLIOGRAPHY
Apedoe, X. S., Reynolds, B., Ellefson, M. R., & Schunn, C. D. (2008). Bringing engineering design into high school science classrooms: The heating/cooling unit. Journal of Science Education and Technology, 17(5), 454-465. doi: 10.1007/s10956-008-9114-6
Bascomb, N. (2011). The New Cool: A Visionary Teacher, His FIRST Robotics Team, and the Ultimate Battle of Smarts. New York: Crown Publishers.
Ben-Chaim, D., Fey, J. T., Fitzgerald, W. M., Benedetto, C., & Miller, J. (1998). Proportional reasoning among 7th grade students with different curricular experiences. Educational Studies in Mathematics, 36(3), 247-273. doi: 10.1023/A:1003235712092
Bransford, J. D., & Schwartz, D. L. (1999). Rethinking transfer: A simple proposal with multiple implications. Review of Research in Education, 24, 61-100. doi: 10.2307/1167267
Cartier, J. L., Passmore, C. M., Stewart, J., & Willauer, J. P. (2005). Involving students in realistic scientific practice: Strategies for laying epistemological groundwork. In R. Nemirovsky, A. S. Roseberry, J. Soloman & B. Warren (Eds.), Everyday Matters in Science and Mathematics (pp. 267-298). Mahwah, NJ: Lawrence Erlbaum Associates.
diSessa, A. A. (1985). Learning about knowing. New Directions for Child and Adolescent Development, 1985(28), 97-124. doi: 10.1002/cd.23219852808
diSessa, A. A., & Cobb, P. (2004). Ontological innovation and the role of theory in design experiments. Journal of the Learning Sciences, 13(1), 77-103. doi: 10.1207/s15327809jls1301_4
Elby, A. (2001). Helping physics students learn how to learn. American Journal of Physics, 69(7), S54-S64. doi: 10.1119/1.1377283
Engle, R. A., & Conant, F. R. (2002). Guiding principles for fostering productive disciplinary engagement: Explaining an emergent argument in a community of learners classroom. Cognition and Instruction, 20(4), 399-483. doi: 10.1207/S1532690XCI2004_1
FIRST. (2010). Engineering young futures: 2010 annual report. Retrieved from http://www.usfirst.org/aboutus/content.aspx?id=78

279
Gainsburg, J. (2006). The mathematical modeling of structural engineers. Mathematical Thinking and Learning, 8(1), 3-36. doi: 10.1207/s15327833mtl0801_2
Goldstone, R. L., & Son, J. Y. (2005). The transfer of scientific principles using concrete and idealized simulations. Journal of the Learning Sciences, 14(1), 69-110. doi: 10.1207/s15327809jls1401_4
Greeno, J. G. (2009). A theory bite on contextualizing, framing, and positioning: A companion to Son and Goldstone. Cognition and Instruction, 27(3), 269-275. doi: 10.1080/07370000903014386
Hamilton, E., Lesh, R., Lester, F., & Brilleslyper, M. (2008). Model-eliciting activities (MEAs) as a bridge between engineering education research and mathematics education research. Advances in Engineering Education, 1(2).
Hammer, D., Elby, A., Scherr, R. E., & Redish, E. F. (2005). Resources, framing, and transfer. In J. P. Mestre (Ed.), Transfer of Learning from a Modern Multidisciplinary Perspective (pp. 89-119). Greenwich, CT: Information Age Publishing.
Hoyles, C., Noss, R., & Pozzi, S. (2001). Proportional reasoning in nursing practice. Journal for Research in Mathematics Education, 32(1), 4-27. doi: 10.2307/749619
Hutchison, P., & Hammer, D. (2009). Attending to student epistemological framing in a science classroom. Science Education, 94(3), 506-524. doi: 10.1002/sce.20373
Izsak, A. (2004). Students' coordination of knowledge when learning to model physical situations. Cognition and Instruction, 22(1), 81-128. doi: 10.1207/s1532690Xci2201_4
Jansen, B. R. J., & van der Maas, H. L. J. (2002). The development of children’s rule use on the balance scale task. Journal of Experimental Child Psychology, 81(4), 383-416. doi: 10.1006/jecp.2002.2664
Kaplan, D. E., & Black, J. B. (2003). Mental models and computer-based scientific inquiry learning: Effects of mechanistic cues on adolescent representation and reasoning about causal systems. Journal of Science Education and Technology, 12(4), 483-493. doi: 10.1023/B:JOST.0000006308.01183.85
Koedinger, K. R., Alibali, M. W., & Nathan, M. J. (2008). Trade-offs between grounded and abstract representations: Evidence From algebra problem solving. Cognitive Science, 32(2), 366-397. doi: 10.1080/03640210701863933
Köller, O., Baumert, J., & Schnabel, K. (2001). Does interest matter? The relationship between academic interest and achievement in mathematics. Journal for Research in Mathematics Education, 32(5), 448-470. doi: 10.2307/749801
Kolodner, J. L., Camp, P. J., Crismond, D., Fasse, B., Gray, J., Holbrook, J., Puntambekar, S., & Ryan, M. (2003). Problem-based learning meets case-based reasoning in the middle-

280
school science classroom: Putting Learning by Design™ into practice. Journal of the Learning Sciences, 12(4), 495-547. doi: 10.1207/S15327809JLS1204_2
Krajcik, J., McNeill, K. L., & Reiser, B. J. (2008). Learning-goals-driven design model: Developing curriculum materials that align with national standards and incorporate project-based pedagogy. Science Education, 92(1), 1-32. doi: 10.1002/sce.20240
Kuhn, D. (2007). Reasoning about multiple variables: Control of variables is not the only challenge. Science Education, 91(5), 710-726. doi: 10.1002/sce.20214
Kuhn, D., Pease, M., & Wirkala, C. (2009). Coordinating the effects of multiple variables: A skill fundamental to scientific thinking. Journal of Experimental Child Psychology, 103(3), 268-284. doi: 10.1016/j.jecp.2009.01.009
Lamon, S. J. (1993). Ratio and proportion: Connecting content and children's thinking. Journal for Research in Mathematics Education, 24(1), 41-61. doi: 10.2307/749385
Lamon, S. J. (1995). Ratio and proportion: Elementary didactical phenomenology. In J. T. Sowder & B. P. Schappelle (Eds.), Providing a Foundation for Teaching Mathematics in the Middle Grades (pp. 167-198). Albany, NY: SUNY Press.
Lamon, S. J. (2007). Rational numbers and proportional reasoning. In F. K. Lester, Jr. (Ed.), Second Handbook of Research on Mathematics Teaching and Learning (Vol. 1, pp. 629-667). Charlotte, NC: National Council of Teachers of Mathematics.
Langrall, C. W., & Swafford, J. (2000). Three balloons for two dollars: Developing proportional reasoning. Mathematics Teaching in the Middle School, 6(4), 254-261.
Lesh, R., & Harel, G. (2003). Problem solving, modeling, and local conceptual development. Mathematical Thinking and Learning, 5(2&3), 157-189. doi: 10.1080/10986065.2003.9679998
Lesh, R., Hoover, M., Hole, B., Kelly, A., & Post, T. (2000). Principles for developing thought-revealing activities for students and teachers. In A. E. Kelly & R. A. Lesh (Eds.), Handbook of Research Design in Mathematics and Science Education (pp. 591-646). Mahwah, NJ: Lawrence Erlbaum Associates.
Lesh, R., Post, T., & Behr, M. (1988). Proportional reasoning. In J. Hiebert & M. Behr (Eds.), Number Concepts and Operations in the Middle Grades (Vol. 2, pp. 93-118). Reston, VA: National Council of Teachers of Mathematics.
Levin, M. (2009). A conceptual change lens on the emergence of a novel strategy during mathematical problem solving. In S. L. Swars, D. W. Stinson & S. Lemons-Smith (Eds.), Proceedings of the 31st annual meeting of the North American Chapter of the International Group for the Psychology of Mathematics Education (pp. 193-200). Atlanta, GA: Georgia State University.

281
Lobato, J., & Siebert, D. (2002). Quantitative reasoning in a reconceived view of transfer. Journal of Mathematical Behavior, 21, 87-116. doi: 10.1016/S0732-3123(02)00105-0
Lobato, J., & Thanheiser, E. (2002). Developing understanding of ratio-as-measure as a foundation for slope. In B. Litwiller & G. Bright (Eds.), Making Sense of Fractions, Ratios, and Proportions [2002 Yearbook] (pp. 162-175). Reston, VA: National Council of Teachers of Mathematics.
Louca, L., Elby, A., Hammer, D., & Kagey, T. (2004). Epistemological resources: Applying a new epistemological framework to science instruction. Educational Psychologist, 39(1), 57-68. doi: 10.1207/s15326985ep3901_6
Marsh, H. W., Trautwein, U., Ludtke, O., Köller, O., & Baumert, J. (2005). Academic self-concept, interest, grades, and standardized test scores: Reciprocal effects models of causal ordering. Child Development, 76(2), 397-416. doi: 10.1111/j.1467-8624.2005.00853.x
May, D. B., & Etkina, E. (2002). College physics students' epistemological self-reflection and its relationship to conceptual learning. American Journal of Physics, 70(12), 1249-1258. doi: 10.1119/1.1503377
Mehalik, M. M., Doppelt, Y., & Schunn, C. D. (2008). Middle-school science through design-based learning versus scripted inquiry: Better overall science concept learning and equity gap reduction. Journal of Engineering Education, 97(1), 71-85.
Melchior, A., Cohen, F., Cutter, T., & Leavitt, T. (2005). More than robots: Evaluation of the FIRST Robotics Competition participant and institutional impacts, Waltham, MA: Center for Youth and Communities, Brandeis University.
Melchior, A., Cutter, T., & Deshpande, A. (2009). Evaluation of the FIRST LEGO® League “Climate Connections” season (2008-09), Waltham, MA: Center for Youth and Communities, Brandeis University.
Misailidou, C., & Williams, J. (2003). Diagnostic assessment of children’s proportional reasoning. Journal of Mathematical Behavior, 22(3), 335-368. doi: 10.1016/S0732-3123(03)00025-7
National Assessment of Educational Progress. (2008). NAEP Questions Tool v3.0. NAEP Released Items. Retrieved August 27, 2008, from http://nces.ed.gov/nationsreportcard/itmrls/
Nhouyvanisvong, A. (1999). Enhancing mathematical competence and understanding: Using open-ended problems and informal strategies. Ph.D. Doctoral Dissertation, Carnegie Mellon University, Pittsburgh, PA.

282
Norton, S. J. (2006). Pedagogies for the engagement of girls in the learning of proportional reasoning through technology practice. Mathematics Education Research Journal, 18(3), 69-99.
Petre, M., & Price, B. (2004). Using robotics to motivate ‘back door’ learning. Education and Information Technologies, 9(2), 147-158. doi: 10.1023/B:EAIT.0000027927.78380.60
Redish, E. F., & Hammer, D. (2009). Reinventing college physics for biologists: Explicating an epistemological curriculum. American Journal of Physics, 77(7), 629-642. doi: 10.1119/1.3119150
Russ, R. S., Coffey, J. E., Hammer, D., & Hutchison, P. (2008). Making classroom assessment more accountable to scientific reasoning: A case for attending to mechanistic thinking. Science Studies and Science Education, 93(5), 875-891. doi: 10.1002/sce.20320
Sadler, P. M., Coyle, H. P., & Schwartz, M. (2000). Engineering competitions in the middle school classroom: Key Elements in developing effective design challenges. Journal of the Learning Sciences, 9(3), 299-327. doi: 10.1207/S15327809JLS0903_3
Schauble, L. (1996). The development of scientific reasoning in knowledge-rich contexts. Developmental Psychology, 32(1), 102-119. doi: 10.1037/0012-1649.32.1.102
Schliemann, A. D., & Carraher, D. W. (1992). Proportional reasoning in and out of school. In P. Light & G. Butterworth (Eds.), Context and Cognition: Ways of Learning and Knowing (pp. 47-73). Hillsdale, NJ: Lawrence Erlbaum Associates.
Schwartz, D. L., & Bransford, J. D. (1998). A time for telling. Cognition and Instruction, 16(4), 475-522. doi: 10.1207/s1532690xci1604_4
Schwartz, D. L., & Martin, T. (2004). Inventing to prepare for future learning: The hidden efficiency of encouraging original student production in statistics instruction. Cognition and Instruction, 22(2), 129-184. doi: 10.1207/s1532690xci2202_1
Schwartz, D. L., Martin, T., & Pfaffman, J. (2005). How mathematics propels the development of physical knowledge. Journal of Cognition and Development, 6(1), 65-88. doi: 10.1207/s15327647jcd0601_5
Schwartz, D. L., & Moore, J. L. (1998). On the role of mathematics in explaining the material world: Mental models for proportional reasoning. Cognitive Science, 22(4), 471-516. doi: 10.1016/S0364-0213(99)80047-0
Siegler, R. S., & Chen, Z. (2008). Differentiation and integration: Guiding principles for analyzing cognitive change. Developmental Science, 11(4), 433-453. doi: 10.1111/j.1467-7687.2008.00689.x
Silk, E. M., Higashi, R., Shoop, R., & Schunn, C. D. (2010). Designing technology activities that teach mathematics. The Technology Teacher, 69(4), 21-27.

283
Simon, M. A., & Blume, G. W. (1994). Mathematical modeling as a component of understanding ratio-as-measure: A study of prospective elementary teachers. Journal of Mathematical Behavior, 13(2), 183-197. doi: 10.1016/0732-3123(94)90022-1
Son, J. Y., & Goldstone, R. L. (2009). Contextualization in perspective. Cognition and Instruction, 27(1), 51-89. doi: 10.1080/07370000802584539
Sowder, J., Armstrong, B., Lamon, S., Simon, M., Sowder, L., & Thompson, A. (1998). Educating teachers to teach multiplicative structures in the middle grades. Journal of Mathematics Teacher Education, 1(2), 127-155. doi: 10.1023/A:1009980419975
Steffe, L. P., & Thompson, P. W. (2000). Teaching experiment methodology: Underlying principles and essential elements. In A. E. Kelly & R. A. Lesh (Eds.), Handbook of Research Design in Mathematics and Science Education (pp. 267-306). Mahwah, NJ: Lawrence Erlbaum Associates.
Tapia, M., & Marsh, G. E. (2004). An instrument to measure mathematics attitudes. Academic Exchange Quarterly, 8(2), 16-21.
Thompson, A. G., Philipp, R. A., Thompson, P. W., & Boyd, B. A. (1994). Calculational and conceptual orientations in teaching mathematics. In D. B. Aichele & A. F. Coxford (Eds.), Professional Development for Teachers of Mathematics: 1994 Yearbook (pp. 79-92). Reston, VA: National Council of Teachers of Mathematics.
Thompson, P. W. (1994). The development of the concept of speed and its relationship to concepts of rate. In G. Harel & J. Confrey (Eds.), The Development of Multiplicative Reasoning in the Learning of Mathematics (pp. 181-234). Albany, NY: State University of New York Press.
Tourniaire, F., & Pulos, S. (1985). Proportional reasoning: A review of the literature. Educational Studies in Mathematics, 16(2), 181-204. doi: 10.1007/BF02400937
Walkington, C. A., & Maull, K. (2011). Exploring the assistance dilemma: The case of context personalization. In L. Carlson, C. Hoelscher & T. F. Shipley (Eds.), Proceedings of the 33rd Annual Conference of the Cognitive Science Society (pp. 90-95). Austin, TX: Cognitive Science Society.
Wigfield, A., & Eccles, J. S. (2000). Expectancy-value theory of achievement motivation. Contemporary Educational Psychology, 25(1), 68-81. doi: 10.1006/ceps.1999.1015