Embed Size (px)
Citation preview
1
Resourcing Green Technologies through
Smart Mineral Enterprise Development:
A Case Analysis of Cobalt
Contributing authors: Saleem H. Ali, Perrine Toledano, Nicolas Maennling, Nathaniel Hoffman and Lola Aganga
February 2018
1
Executive Summary1
Much has been written in recent years about the urgency to develop new technologies that meet
ambitious targets for more efficient energy infrastructure with reduced reliance on fossil fuels.
There has also been growing recognition that mineral scarcity can hamper the speed of key
technologies being developed. The dominance of China as a global supplier of many technology
minerals and the Chinese government’s ability to constrain supply has led to a focus on the
international trade dimensions of the challenge. The United States, Japan, the European Union
and South Korea have all been keenly focused on securing mineral supply for their domestic
industries through a range of initiatives. These efforts have included the World Trade
Organization dispute resolution mechanism; research investment in alternative and more widely
available materials where possible; and considering strategic stockpiles of minerals from internal
sources that harken back to Cold War era strategies for material security.
In this report, we argue that a neglected area in addressing the mineral scarcity challenge is the
private sector’s current trajectory for geological mineral exploration of key minerals and
innovative initiatives on material efficiency and recycling where possible. We term this approach
Smart Mineral Enterprise Development (SMED) which entails a partnership between public and
private entities to consider pathways whereby public sector data sharing on geology can be
coupled with research innovations in the private sector both upstream and downstream of
mineral supply. Just as smart energy grids harness efficiencies in electricity supply and demand
through a dynamic process of communication, SMED processes can do the same for key
technological bottlenecks in mineral supply. We focus on cobalt to highlight the bottlenecks;
identify alternative supply sources based on current exploration and recycling technologies;
propose ways in which the international legal framework could be adapted to promote
investments in critical minerals; and consider ways by which the public sector can assist the
private sector in developing a SMED process that would bring forth more efficient and effective
entrepreneurial activity to meet our green technology needs.
Suggested Citation: Saleem H. Ali, Perrine Toledano, Nicolas Maennling, Nathaniel Hoffman,
Lola Aganga, "Resourcing Green Technologies through Smart Mineral Enterprise Development:
A Case Analysis of Cobalt," Columbia Center on Sustainable Investment at Columbia
University, February 2018
1 The authors are very grateful for Jiten Vyakarnam and Garret Markley’s research assistance and to Jack Lifton and John Steen
for their peer reviews of the manuscript.
2
Table of Contents 1. Introduction ................................................................................................................................. 3
2. Technology Minerals and Criticality for Green Technology ...................................................... 5
3. Cobalt as a Case Example of Enterprise Deficit ......................................................................... 7
4. Investment Solutions Moving Forward .................................................................................... 18
6. Conclusion and further research ............................................................................................... 27
Appendix A: Survey Methodology ............................................................................................... 29
Appendix C: Lithium survey results ............................................................................................. 33
Appendix D: Summary Table of Potential Future Battery Technologies ..................................... 35
Tables, Figures and Boxes Table 1: Key Technology Minerals with Current and Future Supply Prospects and Uses............. 6
Figure 1: Global Cobalt Production ................................................................................................ 8
Figure 2 (left): The Wheel of Metal Companionability; ................................................................. 9
Figure 3 (right): Companionability dynamics of cobalt (dark blue is cobalt, blue is nickel and
green is copper) ....................................................................................................................... 9
Figure 4 (left): Prices of Copper, Nickel and Cobalt .................................................................... 10
Figure 5 (right): Total revenue of a hypothetical copper and nickel mine that produces one pound
of cobalt for every ten pounds of primary metal................................................................... 10
Figure 6: Predictions in future cobalt supply, demand and deficit. .............................................. 12
Figure 7: Distribution stage of cobalt exploration projects; ......................................................... 13
Figure 8: Development stage of cobalt exploration projects ........................................................ 13
Figure 9: Map of Global Cobalt Exploration Projects Worldwide ............................................... 14
Table 2: Cobalt/Zinc Comparison Table....................................................................................... 17
Figure 10: Forecast of EV battery waste in China ........................................................................ 18
Figure 11: The Smart Mineral Enterprise Development Framework (SMED) ............................ 21
Box 2: Responsible Cobalt Initiative for DRC ............................................................................ 22
Box 3: Global Battery Alliance Initiative: An Example of a Public-Private Enterprise Effort; and
The Cobalt Institute: An Example Of Coordination Mechanism Across The Cobalt Value
Chain ..................................................................................................................................... 23
Box 4: Mineral Investment Process ............................................................................................. 31
Figure 12 (left): Distribution stage of lithium exploration projects;............................................. 33
Figure 13 (right): Development stage of lithium exploration projects ......................................... 33
3
1. Introduction
On December 20, 2017, the United States Geological Survey published its first critical minerals
assessment since 1973. The findings were stark and sobering to those concerned about American
dependence on foreign-sourced commodities. The report noted that out of the 23 key minerals on
which the American economy is most dependent 21 have more than 50% of their demand met
from imports2. Beryllium and titanium were the notable exceptions. The report raised enough
alarm bells that President Trump issued an executive order the very next day to expand critical
minerals production by "increasing activity at all levels of the supply chain, including
exploration, mining, concentration, separation, alloying, recycling and reprocessing critical
minerals.”3 Yet, the mechanisms by which this production could best be facilitated have eluded
much discussion.
A lot of these critical minerals highlighted in the survey are needed for the development of
renewable energies. Harnessing the supply at the global level is necessary to achieve the Paris
Climate Agreement. The Agreement, signed in December 2015, is a landmark global treaty
committing all participant countries to reducing carbon emissions and limiting global
temperature rise to below two degrees Celsius above pre-industrial levels. This historic
agreement cemented the world’s commitment to combating climate change and set the stage for
exponential growth in the demand for renewable-energy and energy-efficient technologies. To
achieve the ambitious goals of the Paris Agreement, worldwide production of sustainable
technologies must increase drastically, far beyond current levels. Article 10 of the Agreement
highlights the importance of green technology for achieving global climate goals, calling for
green tech growth, innovation, enhancement, and transfer:
“1. Parties share a long-term vision on the importance of fully realizing technology
development and transfer in order to improve resilience to climate change and to reduce
greenhouse gas emissions.
2. Parties, noting the importance of technology for the implementation of mitigation and
adaptation actions under this Agreement and recognizing existing technology deployment
and dissemination efforts, shall strengthen cooperative action on technology development
and transfer.”4
And while the Paris agreement recognizes green technology as an essential element in achieving
climate goals, research performed on the feasibility of actually developing, building, and
2 Klaus J. Schulz, John H. DeYoung, Jr., Dwight C. Bradley, and Robert R. Seal II, U.S. Geological Survey, Critical Mineral
Resources of the United States—An Introduction. Available at: https://pubs.usgs.gov/pp/1802/a/pp1802a.pdf. (Accessed 23 Jan.
2018). 3 Presidential Executive Order on a Federal Strategy to Ensure Secure and Reliable Supplies of Critical Minerals. December 20,
2017. Available at: https://www.whitehouse.gov/presidential-actions/presidential-executive-order-federal-strategy-ensure-secure-
reliable-supplies-critical-minerals/. (Accessed 23 Jan. 2018). 4 Paris Agreement, Article 10, entered into force November 4, 2016, United Nations Framework Convention on Climate Change
(UNFCCC)
4
deploying green technology at this scale has been insufficient. In reality, these sustainable
technologies are highly material-intensive and will require the mining and refining of a wide
range and vast quantities of “technology minerals” from which to produce the technology metals,
alloys, and chemical compounds required. This supply does not yet exist, raising serious
concerns about where, and how the world will procure enough supply to meet growing demand.
If the goals of the Paris Agreement are to be met, the supply of technology minerals must
increase drastically.
Technology minerals—defined as the geological sources for the metals, alloys, and chemical
compounds used in the production of modern technology—are critical in the production of
nearly all green technologies. Technology minerals are used to increase efficiency, decrease
weight, prolong battery life, and a myriad of other essential functions. Although often used in
trace amounts and abundant in the Earth’s crust, depending on access to these critical materials
can be extremely risky due to the paucity of their availability to mining in accessible deposits,
and awareness of their importance is largely unknown outside of the mining and tech industries.
Thus, this paper distinguishes between physical supply (i.e. what exists on earth in a geological
sense) and practical supply (i.e. what is available globally, with consideration for technical,
political, and economic influences and consequences). Vast amounts of technology minerals
exist in the Earth’s crust in varying concentrations, meaning there is no theoretical risk of
physical supply shortage. However, financial, geopolitical, and technical issues render the
practical supply of them at risk of shortage. As such, producing and securing a reliable global
supply of technology minerals is paramount and the practical scarcity of supply of most of the
technology minerals represents a significant obstacle to the future of renewable- and energy-
efficient technologies, and their continuous supply is already in jeopardy.
This paper will discuss ways of addressing the tenuous global supply—as an overlooked yet
fundamental element to achieving the goals of the Paris Agreement and the future of the green
economy. The paper first defines “criticality”, a term used to determine which minerals are most
important to the advancement of green technology. Then, based on this determination, we focus
on cobalt as a case study of a mineral that is likely to be essential for green technologies and
where a supply shortage appears unavoidable. In its central piece, the paper covers various
investment solutions to address the supply shortage but in particular hones in on a mechanism
that the authors coined as the “Smart Mineral Enterprise Development (SMED)” which entails a
partnership between public and private entities whereby public sector data sharing on geology
can be coupled with research innovations in the private sector both upstream and downstream of
mineral supply.
5
2. Technology Minerals and Criticality for Green Technology
In 2010, the United States Department of Energy (DOE) commissioned the Critical Materials
Strategy to determine “the extent to which widespread deployment of [renewable energy]
technologies may increase worldwide demand for rare earth elements and certain other
materials.”5 Separately, the European Union (EU) created its own criticality report in 2010
(updated in 2014), evaluating 54 raw materials to discern their criticality to the EU economy.6
Other nations, trade and industry associations, and scientific organizations have created similar
measurement tools to evaluate the criticality of raw materials based on economic importance and
identified supply risk factors. The goal of these criticality assessments has been to determine
which materials are essential to the economic well-being of each nation (or bloc in the case of
the EU), and to raise awareness and/or influence legislation that will further secure the national
supply of these critical materials.
The Columbia Center on Sustainable Investment (CCSI) has undertaken the following
assessment report with a different, two-pronged goal in mind. First, it provides an overview of
which minerals should be considered critical in the next decade, and why. Fundamental
innovations in renewable energy and sustainability technology, and the raw materials used to
produce them, have caused increased supply and demand for certain materials and decreased
supply and demand for others. Many technology minerals deemed critical just three years ago are
now considered either secure or no longer important, while others considered non-critical in
2014 are now essential to the future of green technology. This report reflects the current state of
criticality among the technology minerals.
Second, CCSI performed this research by focusing specifically on the global markets for
technology minerals rather than analyzing the industry from a national or regional supply
security perspective. The economic well-being of specific countries is not considered. This paper
does not make suggestions on how countries can create self-reliance; rather it seeks to raise
awareness across the public and private sectors of the criticality of key technology minerals in
the green technology industry, put forth an analysis of the major players in the production of
these minerals, and present recommendations for the future technology mineral marketplace as
green technology continues to expand.
To structure this research, CCSI developed a criticality assessment focused specifically on
technology minerals used in the production of solar energy, wind energy, electric vehicles (EVs),
storage batteries, fuel cells, and carbon capture and sequestration. It is based on the economic
importance of the technology minerals to the production of green technology, and the supply risk
associated with procuring the necessary quantity of mineral to meet demand. Furthermore, it
incorporates the ability for the mineral to be substituted for another material in an end product.
The less feasible this substitution is, the higher criticality the technological mineral was
considered to be. This assessment is informed by primary interviews with industry experts,
5 U.S. Department of Energy, 2010 Critical Materials Summary Strategy, 2010. Available at:
https://energy.gov/sites/prod/files/edg/news/documents/Critical_Materials_Summary.pdf (Accessed 31 Feb. 2017). 6 “Report on Critical Raw Materials for the EU – Report of the Ad hoc Working Group on defining critical raw materials”. May
2014.
6
market analyses and projections of green technologies, and published reports that have sought to
measure the relative importance of key raw materials.
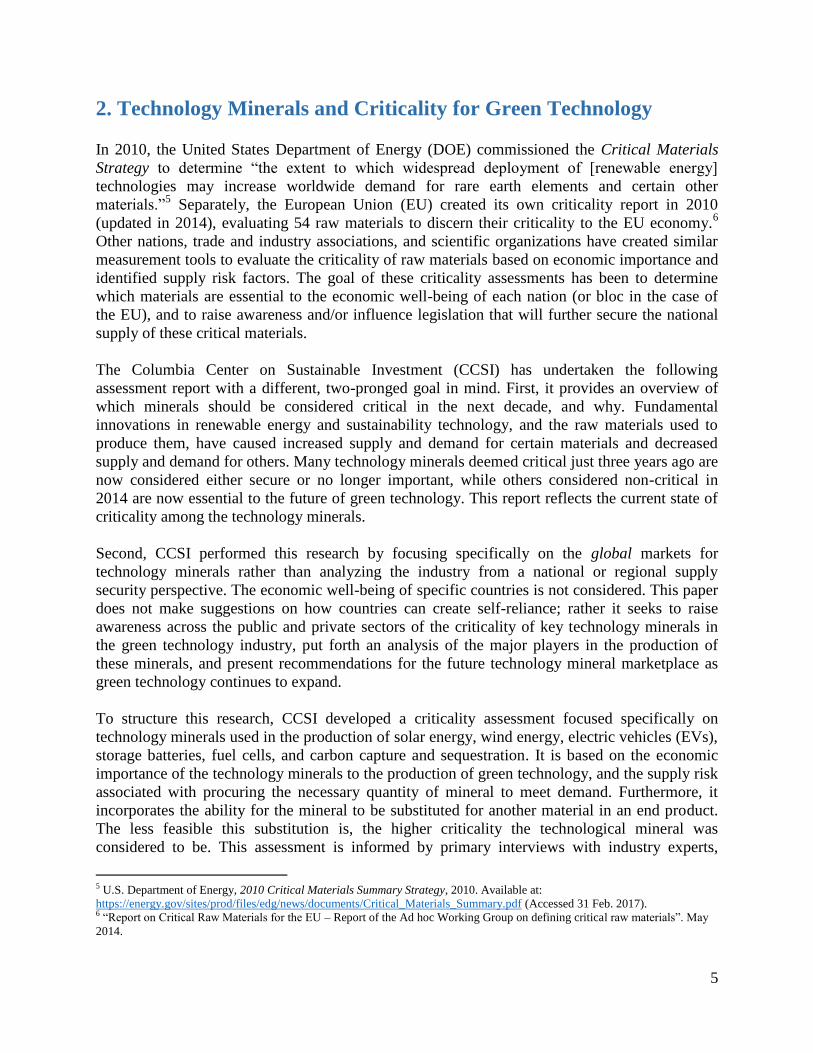
Based on our defined methodology for criticality, we have identified Lithium and Cobalt as
having the highest criticality and significance for the future of global green technology. We also
identified two rare earth elements, Neodymium and Dysprosium; the very rare chalcogenide,
Tellurium; and the rare member of the aluminum family, Indium. As essential elements of
renewable technologies, these technology minerals are fundamental to the economic growth and
stability of all nations, and to the success of the Paris Agreement. Securing consistent, reliable,
and sustainable global access to these materials is of increasing concern and importance. Table 1
provides a summary of key characteristics of these minerals.
Table 1: Key Technology Minerals with Current and Future Supply Prospects and Uses
Technology
Mineral
Current Supply
countries
New supply
prospects
Key uses in green-
tech
Lithium Chile, Argentina,
Australia, China
Bolivia, Canada Battery storage devices
for smart grids
Cobalt D.R. Congo, Canada,
Philippines, Indonesia,
Russia
Australia
Battery storage in EVs
Neodymium China, Australia Greenland, USA,
Brazil, Russia
Magnets in wind power
turbines
Dysprosium China, Australia Alaska, USA,
Greenland,
Commonwealth
Independent States
(CIS) countries
including Russia.
Magnets in EVs and
wind turbines
Tellurium Japan, Russia, Sweden,
USA
Greenland, CIS
countries including
Russia.
Solar panels
Indium China, Republic of
Korea, USA, Australia
Greenland, CIS
Countries including
Russia
Photovoltaic
semiconductor and
solar panels
Out of these critical metals identified, we will consider cobalt as a focused case study in this
report, owing to the most serious set of challenges around its supply, the lack of potential
alternatives in the short-term for its usage in battery technologies associated with
environmentally conscious power systems. These characteristics of cobalt are explained below.
7
3. Cobalt as a Case Example of Enterprise Deficit
Cobalt background and uses: Cobalt is a silver brittle metal that has a high melting point and is
of great value due to its adding high wear resistance and strength at high temperatures in its
alloys. It is one of three naturally occurring magnetic metals (along with iron and nickel). In
addition, it retains its magnetic properties at higher temperatures than any other metal: this
makes cobalt the metal with the highest curie point, the point at which a metal loses its
permanent magnetic properties. Cobalt was thrust into significance in industry with the creation
of aluminum-nickel-cobalt (or AlNiCo) magnets in the 1940s, which were used to replace
electromagnets. In the 1970s, samarium-cobalt magnets were designed, which had magnetic
energy density values that were previously unachievable.7 In fact, samarium-cobalt magnets
were the first rare earth permanent magnets used by the original equipment manufacturer (OEM)
automotive industry; they were superseded by neodymium iron boron magnets in the early 1980s
due to the sudden increase then in the price of cobalt.
Cobalt has been used as a “technology enabling” element in alloys and compounds and is used in
a wide range of technologies—from energy storage systems and catalytic processes to enabling
greater efficiencies in the operation of gas turbines and chemical processes. It has become an
integral component to powering electric vehicles, finds its uses in wind and wave generators, and
is a catalyst used for the “splitting” of water in solar energy technologies.8
In recent years, cobalt demand has been rising due to its usage in rechargeable batteries. In
nickel-cadmium (Ni-Cd) batteries, cobalt makes up about 1-5% of the battery by weight. Cobalt
usage is about 15% by weight in nickel-metal hybrid batteries, and lithium-ion batteries contain
up to 50% cobalt by weight. The use of cobalt in rechargeable batteries has grown by about 13%
annually over the last ten years whereas its uses for metallurgical applications has only grown by
about 3.4%. Therefore, it is safe to assume that rechargeable batteries will be the main driver for
cobalt demand in the future.9
Cobalt supply and demand: In 2016, cobalt consumption worldwide was estimated to be around
93,950 tonnes. 10
The forecast of demand growth varies from outlet to outlet but all are bullish.
By some estimates, cobalt demand is estimated to increase by approximately 30% by 2020,
reaching 120,000 tonnes per year. 11
Other estimates provide that by the year 2025, the cobalt
consumption will reach about 200,000 tonnes, which is a 90% increase from current levels.12
Around 17 kilograms of cobalt is needed per battery. Estimations show that half a million units
of the Tesla Model 3 would require around 7,800 tons of new cobalt or roughly 6% of the current
7 Terrence Bell, “Cobalt Metal: Properties, Production, and Applications,” The Balance. August 19, 2017,
https://www.thebalance.com/metal-profile-cobalt-2340131 (accessed April 31, 2017). 8 “Why Cobalt?,” Cobalt Power Group. 2016, http://www.cobaltpowergroup.com/why-cobalt/ (accessed April 31, 2017). 9 “A Brief Cobalt Primer,” Palisade Research. 2016, http://palisade-research.com/wp-content/uploads/2016/10/2016.10.26-
Palisade-Research-Cobalt-Final.pdf (accessed April 8, 2017). 10 “Cobalt Demand,” Global Energy Metals Corp., https://www.globalenergymetals.com/cobalt/cobalt-demand/ (accessed
November 2017) 11 Global Energy Metals Corp., Cobalt Demand 12 “Specialty Minerals and Metals,” Canaccord Genuity, Global Equity Research, 25 May 2017
8
world’s annual cobalt production.13
Japan and South Korea are leaders in battery and cathode
technology development and host the headquarters of many electronic giants and their
manufacturing units.14
Asia accounted for about 70.2% of the world’s cobalt consumption in
2015, with China alone using 38.5% for its EV production industry.15
By 2020, numbers are
projected to change only slightly, with Asia forecasted to consume 71.1%, and China’s demand
falling slightly to 38%. As mentioned above, the demand for EVs and growth in battery
technology have currently made cobalt the most critical material for storing batteries, EVs and
mobile phones.16
The supply of cobalt is characterized by a few distinct aspects that contribute to its potential
future shortage. For one, the Democratic Republic of Congo, which produces around 60% of the
world’s supply of cobalt is mired in political strife, conflict, and corruption. The bulk of the
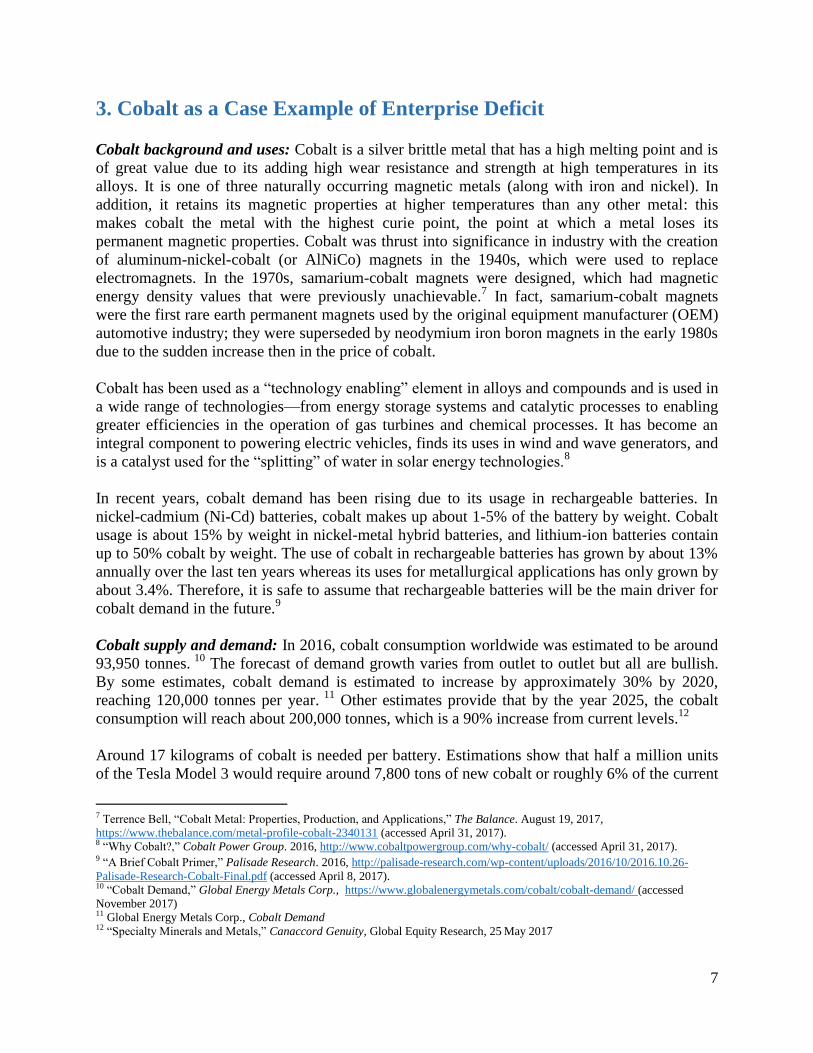
remaining cobalt is produced in places such as Russia, China and Canada (see Figure 1).
Figure 1: Global Cobalt Production
Source: LiCo Energy Metals, Inc.
17
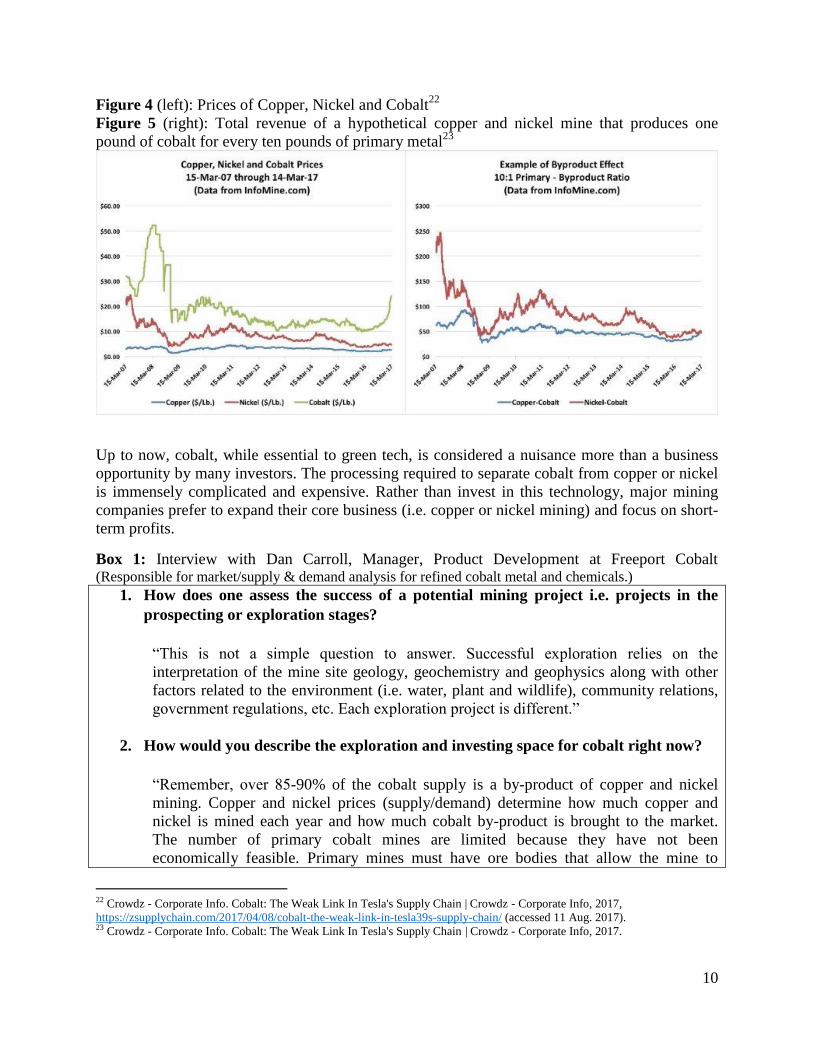
Second, cobalt, like many critical minerals, is almost entirely (90%) produced as a byproduct of
other ore mining operations, and therefore fails to drive investment on its own financial merits.
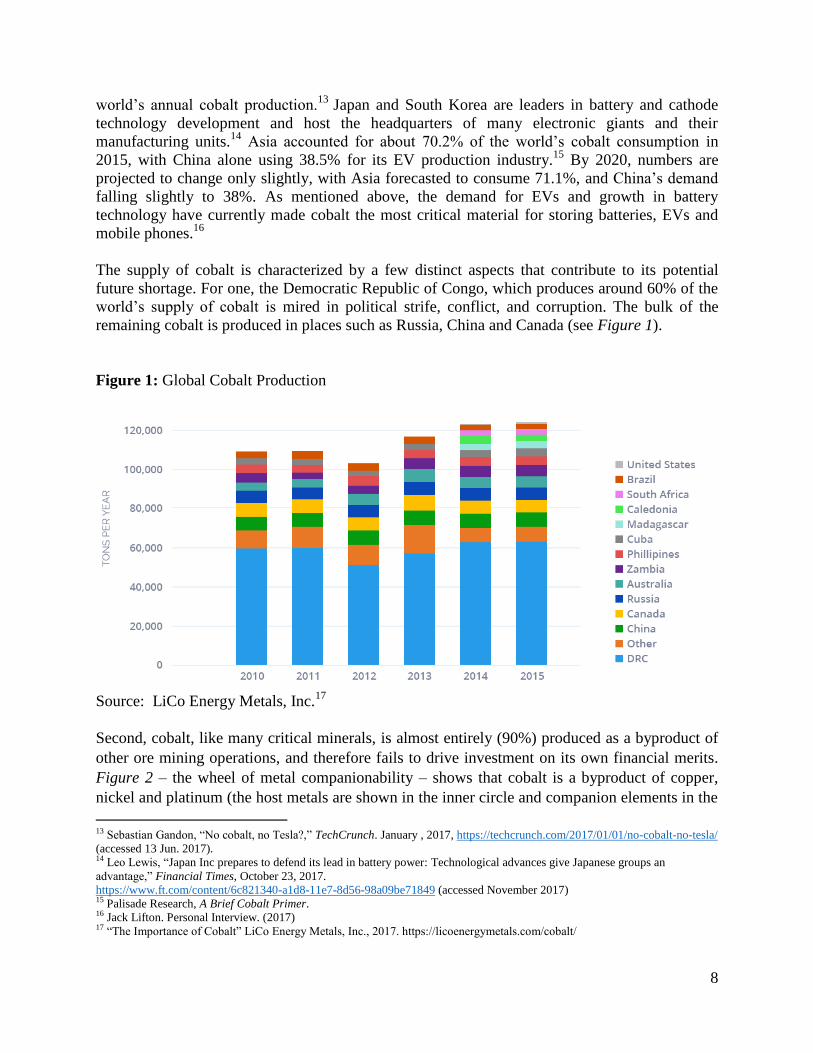
Figure 2 – the wheel of metal companionability – shows that cobalt is a byproduct of copper,
nickel and platinum (the host metals are shown in the inner circle and companion elements in the
13 Sebastian Gandon, “No cobalt, no Tesla?,” TechCrunch. January , 2017, https://techcrunch.com/2017/01/01/no-cobalt-no-tesla/
(accessed 13 Jun. 2017). 14 Leo Lewis, “Japan Inc prepares to defend its lead in battery power: Technological advances give Japanese groups an
advantage,” Financial Times, October 23, 2017.
https://www.ft.com/content/6c821340-a1d8-11e7-8d56-98a09be71849 (accessed November 2017) 15 Palisade Research, A Brief Cobalt Primer. 16 Jack Lifton. Personal Interview. (2017) 17 “The Importance of Cobalt” LiCo Energy Metals, Inc., 2017. https://licoenergymetals.com/cobalt/
9
outer circle, with the distance representing proportionality). Figure 3 shows that the cobalt
proportion between 2006 and 2012 in host copper and nickel deposits has fallen. The survival of
a cobalt project therefore largely depends on nickel and copper prices. If the prices of these two
metals are unfavorable, then it is highly unlikely that a mining project will undergo development,
regardless of how high cobalt prices are. Some experts believe that cobalt prices would need to
increase by at least a factor of 20 relative to the prices of nickel and copper before a cobalt
extraction project can be considered financially viable.18
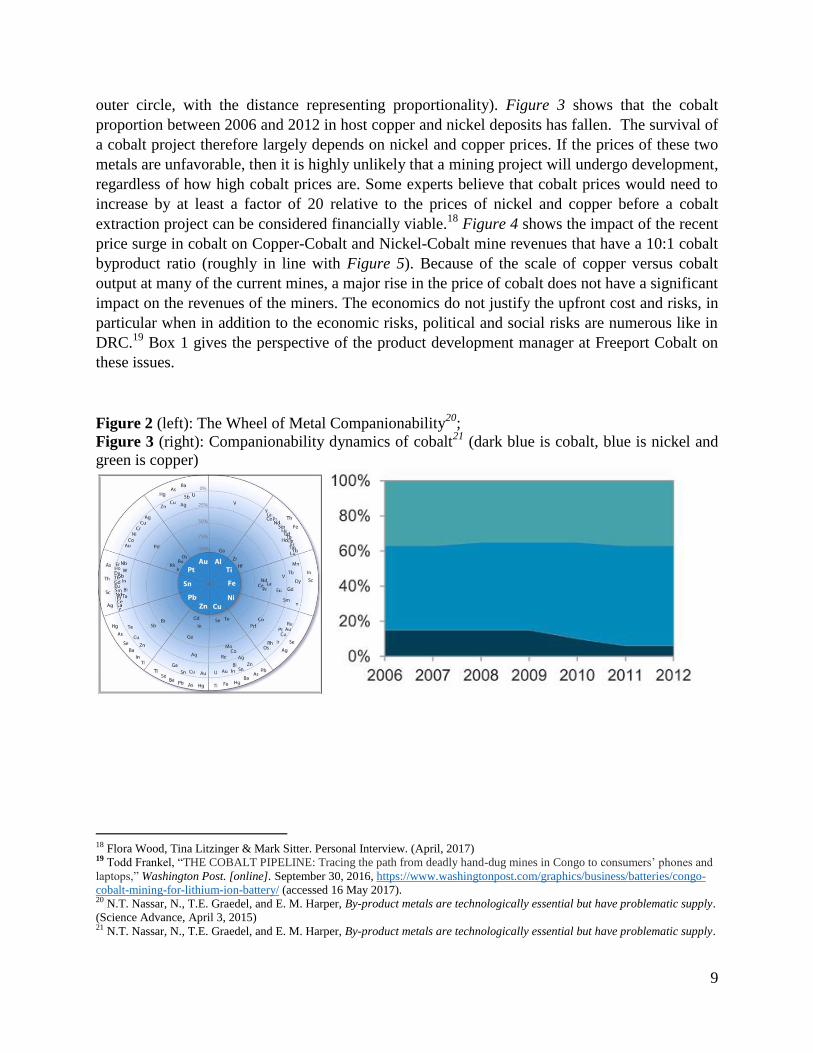
Figure 4 shows the impact of the recent
price surge in cobalt on Copper-Cobalt and Nickel-Cobalt mine revenues that have a 10:1 cobalt
byproduct ratio (roughly in line with Figure 5). Because of the scale of copper versus cobalt
output at many of the current mines, a major rise in the price of cobalt does not have a significant
impact on the revenues of the miners. The economics do not justify the upfront cost and risks, in
particular when in addition to the economic risks, political and social risks are numerous like in
DRC.19
Box 1 gives the perspective of the product development manager at Freeport Cobalt on
these issues.
Figure 2 (left): The Wheel of Metal Companionability20
;
Figure 3 (right): Companionability dynamics of cobalt21
(dark blue is cobalt, blue is nickel and
green is copper)
18 Flora Wood, Tina Litzinger & Mark Sitter. Personal Interview. (April, 2017) 19 Todd Frankel, “THE COBALT PIPELINE: Tracing the path from deadly hand-dug mines in Congo to consumers’ phones and
laptops,” Washington Post. [online]. September 30, 2016, https://www.washingtonpost.com/graphics/business/batteries/congo-
cobalt-mining-for-lithium-ion-battery/ (accessed 16 May 2017). 20 N.T. Nassar, N., T.E. Graedel, and E. M. Harper, By-product metals are technologically essential but have problematic supply.
(Science Advance, April 3, 2015) 21 N.T. Nassar, N., T.E. Graedel, and E. M. Harper, By-product metals are technologically essential but have problematic supply.
10
Figure 4 (left): Prices of Copper, Nickel and Cobalt22
Figure 5 (right): Total revenue of a hypothetical copper and nickel mine that produces one
pound of cobalt for every ten pounds of primary metal23
Up to now, cobalt, while essential to green tech, is considered a nuisance more than a business
opportunity by many investors. The processing required to separate cobalt from copper or nickel
is immensely complicated and expensive. Rather than invest in this technology, major mining
companies prefer to expand their core business (i.e. copper or nickel mining) and focus on short-
term profits.
Box 1: Interview with Dan Carroll, Manager, Product Development at Freeport Cobalt (Responsible for market/supply & demand analysis for refined cobalt metal and chemicals.)
1. How does one assess the success of a potential mining project i.e. projects in the
prospecting or exploration stages?
“This is not a simple question to answer. Successful exploration relies on the
interpretation of the mine site geology, geochemistry and geophysics along with other
factors related to the environment (i.e. water, plant and wildlife), community relations,
government regulations, etc. Each exploration project is different.”
2. How would you describe the exploration and investing space for cobalt right now?
“Remember, over 85-90% of the cobalt supply is a by-product of copper and nickel
mining. Copper and nickel prices (supply/demand) determine how much copper and
nickel is mined each year and how much cobalt by-product is brought to the market.
The number of primary cobalt mines are limited because they have not been
economically feasible. Primary mines must have ore bodies that allow the mine to
22 Crowdz - Corporate Info. Cobalt: The Weak Link In Tesla's Supply Chain | Crowdz - Corporate Info, 2017,
https://zsupplychain.com/2017/04/08/cobalt-the-weak-link-in-tesla39s-supply-chain/ (accessed 11 Aug. 2017). 23 Crowdz - Corporate Info. Cobalt: The Weak Link In Tesla's Supply Chain | Crowdz - Corporate Info, 2017.
11
survive operationally when cobalt prices are low. Today, the cobalt prices are high and
there is a big risk for those who invest in new (potential) primary cobalt mine sites,
especially when you consider it takes 3-4 years to bring the mine to operation. Most of
these exploration projects assume the price of cobalt will remain at today’s levels or
higher than the historical average. This may be a questionable assumption.”
3. How do you think this space will change in the near future?
“Mining is mining. You only initiate a mining project if it is economically feasible and
there is enough long term demand for the metal.”
4. Are there regions you consider riskier when exploring and developing a cobalt
resource? If so, what regions are they and why? If not, why?
“Again, cobalt supply is mainly a by-product of copper and nickel mining. Mine sites are
located in areas where environmental factors, community relations, government
regulations, politics, infrastructure, logistics, manpower, available energy, etc. come into
play in determining the risk of a new mine site. In 2016, approximately 55% of the mined
cobalt came from copper mines in the DRC. These risk factors above come into play in
the DRC. Even with these risk factors, copper mining and the supply of cobalt by-product
from the DRC has been successful for stakeholders for several years.”
Rio Tinto, one of the largest global mining groups with operations in 35 countries across the
world, exemplifies the conundrum of cobalt production. Rio Tinto mines several minerals
including aluminum, copper and iron ore. For Rio Tinto, the current market for cobalt is too
small, with worldwide production around 100,000 metric tons, to sink heavy investment into
processing and production. In contrast, worldwide copper production in 2016 was around 19.4
million metric tons24
. And even though cobalt demand is expected to grow in the future, the
company would rather reinvest profits in its core business—copper—and continue to churn out
profits for investors.
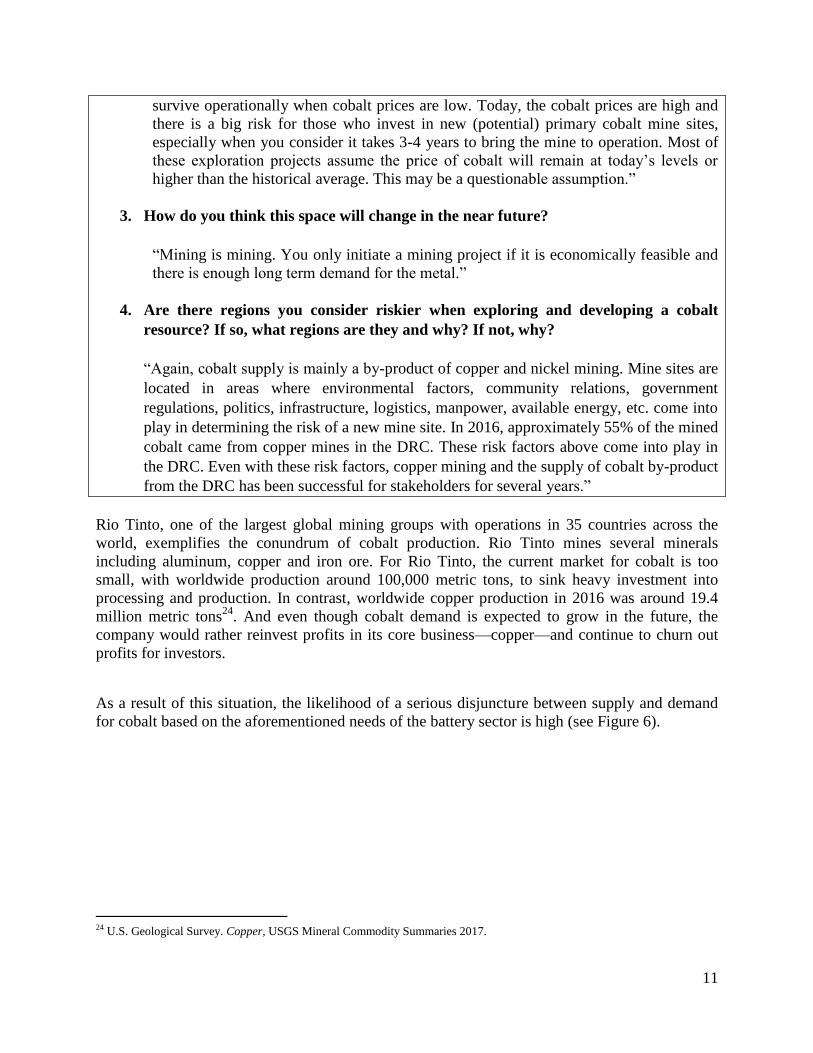
As a result of this situation, the likelihood of a serious disjuncture between supply and demand
for cobalt based on the aforementioned needs of the battery sector is high (see Figure 6).
24 U.S. Geological Survey. Copper, USGS Mineral Commodity Summaries 2017.
12
Figure 6: Predictions in future cobalt supply, demand and deficit.25
Only recently, driven by the increase in price, has there been an increased push for cobalt
exploration. This exploration is carried out by “junior companies” (i.e. small companies
specializing in exploration and developing a mining operation). These companies often find a
mineral deposit, and then work as fundraisers trying to rope financiers into investing in the
development of a mining facility to reach production. Junior companies often survive through
cash injections and salesmanship, but rarely become producers. In the survey below, we give a
comprehensive overview of current private investment in cobalt mining.
Cobalt Supply Prospects To assess prospects of future supply, we have used a survey to determine the current global
distribution of cobalt exploration projects, noting their stage of exploration. To this end, we
compiled a database of projects from which a distribution map and a selection of noteworthy
projects were produced. The technology minerals sector is highly clandestine and much of the
information on supply and demand is not publicly available or is incomplete. Thus to supplement
the material that was available online we conducted interviews and a survey of key experts and
25 “Specialty Minerals and Metals,” Canaccord Genuity, Global Equity Research, 25 May 2017
13
corporate interests to ensure we had the most current material for this report. Details on the
methodology used for this survey can be found in Appendix A. The list of the cobalt companies
reviewed in the survey can be accessed via an accompanying excel file to this document.
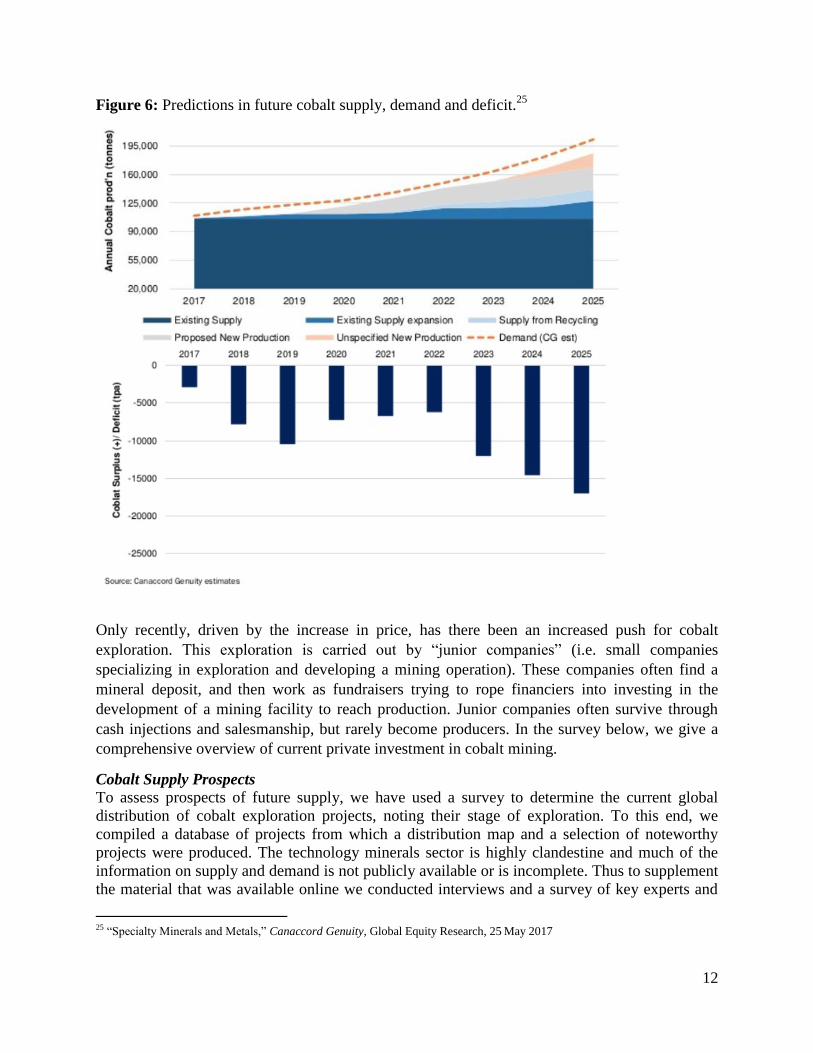
Cobalt exploration and potentially commercially viable projects are concentrated in the
Democratic Republic of Congo (DRC), Canada, and Australia. Of the 67 projects surveyed,
about 25% are in advanced exploration or development stages. Figure 7 and Figure 8 give an
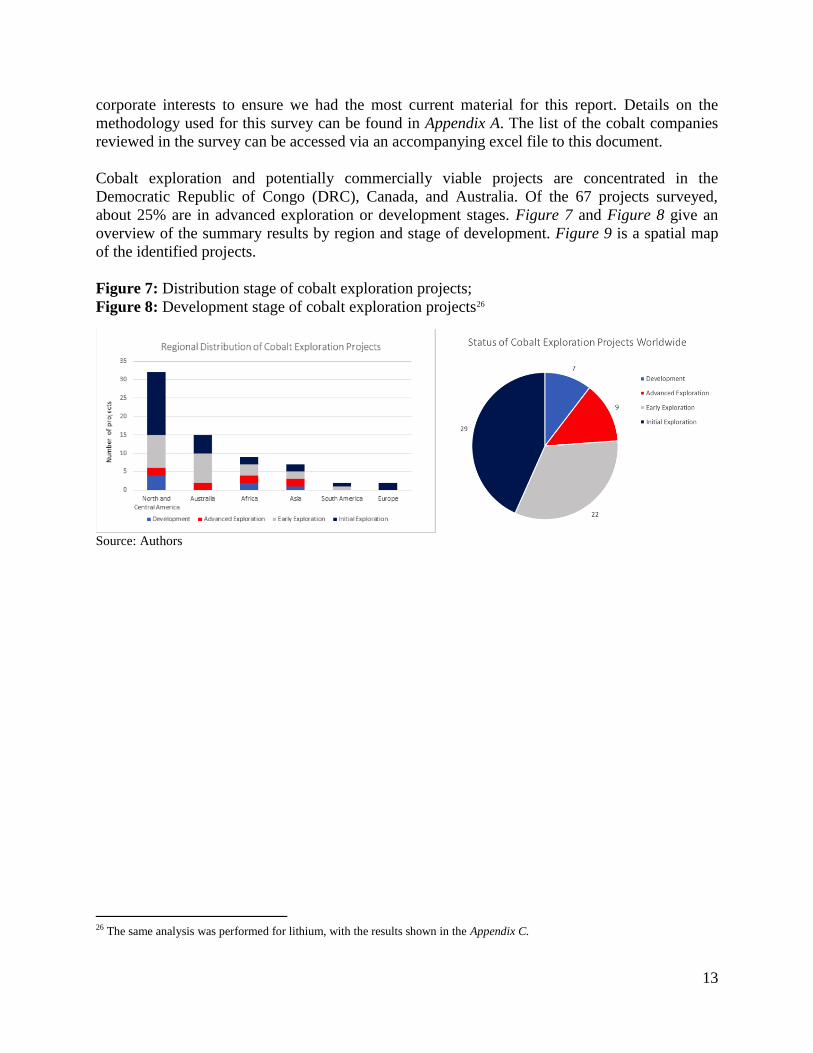
overview of the summary results by region and stage of development. Figure 9 is a spatial map
of the identified projects.
Figure 7: Distribution stage of cobalt exploration projects;
Figure 8: Development stage of cobalt exploration projects26
Source: Authors
26 The same analysis was performed for lithium, with the results shown in the Appendix C.
14
Figure 9: Map of Global Cobalt Exploration Projects Worldwide
Source: Authors
Following data compilation, analysis, and reconciliation, five projects were determined to be
noteworthy. This selection of projects was based on the stage of exploration, media support for
project development, corroborated statements on funding for project development in news
reports, analyst reports, or company presentations.
Noteworthy cobalt exploration projects include:
1. Idaho Cobalt: Wholly owned by eCobalt, this development-stage project was initially
planned to come online in 2013, but activities were put on hold due to depressed prices.
Given the more favorable price outlook in 2016, the company re-started exploration
activities at the site and as of September 2017, the project is fully permitted with an
updated feasibility report published on SEDAR on November 10, 2017. Following
project development in 2018, the company expects to reach full production in the third
quarter of 2018. The project is in Idaho, USA with a projected weighted annual cobalt
production of approximately 1,000 tonnes.
2. KCC Material Assets: This development-stage project in the Democratic Republic of
Congo (DRC) is jointly owned by Katanga Mining Ltd. (KML) (75%), La Generale des
Carrieres et des Mines (GCM) and La Societe Immobiliere du Congo (SIMCO) (25%)
via Kamoto Copper Company (KCC). Glencore has an 86.33% stake in the project. The
project has been plagued by operational, legal, and financial hiccups over the last two
years, but it remains one of the world’s largest with defined reserves of about 90.9
15
million tonnes with average cobalt and copper grades27
of 0.45% and 4.14%
respectively.28
The company published a feasibility report in March 2017 and hopes to
reach full capacity early 2018.
3. Clean TeQ Sunrise: This is a development-stage Scandium-Cobalt project in New South
Wales, Australia. The project is wholly owned by Clean TeQ Holdings through which
China’s Pengxin International Mining holds a 16.5% stake. As of April 2017, the pilot
plant has processed about 20 tonnes of ore, and in August 2017 the company announced
an offtake agreement with Beijing Easpring for 20% of cobalt production with the option
to convert to life-of-mine supply. The state-owned Beijing Institute of Mining and
Metallurgy is a major stakeholder (27%) in Beijing Easpring. Clean TeQ Holdings aims
to publish a bankable feasibility study in Q1 of 2018 and commence development
activities on site.29
4. NICO: This is a development-stage project in Canada’s Northwest Territories 100%
owned by Fortune Minerals Corp. The project is planned to be a vertically integrated
primary cobalt mine, with a refinery near Saskatoon, Canada, to refine concentrate to
battery-grade. In August 2017, the company announced an update to its 2014 feasibility
report, which is currently being done by Hatch Ltd. and Micon International Ltd. and
should be published in 2018. The company is currently pursuing offtake agreements and
financing opportunities to develop the project.30
5. Northmet: This is an advanced exploration project in Minnesota, USA wholly owned by
Polymet Mining Corp. The company is currently securing permits and financing for
project development. While the company is in a relatively weak financial position, the
company claims to be taking steps to strengthen its position. Northmet has a fairly sizable
reserve base of 249 million tonnes with an average cobalt grade of 0.01%.
Other notable cobalt exploration projects set to come online in the next two years are: Weda Bay
in Indonesia jointly owned by Eramet and Tsingshan group; Niwest in Australia owned by GME
Resources; Cobre Panama in Panama owned by First Quantum Minerals; Kalgoorlie Nickel in
Australia owned by Ardea Resources; Ban Phuc Extension in Vietnam 90% owned by Asian
Mineral Resources; and Kipoi Central in the DRC 60% owned by Tiger Resources.
Given that mineral reserves data is constantly changing as new deposits are developed and/or
economic conditions become more or less favorable, it is difficult to determine how many
mineral reserves remain unexploited. There is also great potential to tap high concentration
cobalt reserves once seabed mining becomes economically viable and socially more acceptable.31
However, the US Geological Survey (USGS) provides an industry-respected baseline estimate
from which we can infer results. According the USGS cobalt mineral survey (2017), world total
27 A mineral grade is the concentration or percentage of target mineral in the ore. It is a helpful feature to evaluate the overall
quality of a deposit. 28 Katanga Mining Ltd. NI 43-101 Report, March, 2017: http://www.katangamining.com/~/media/Files/K/Katanga-mining-
v2/operations/reportsoperational/technical-report-march-2017.pdf 29 Clean TeQ Holdings July 2017 Investor Presentation: http://www.cleanteq.com/wp-content/uploads/2017/07/Investor-
Presentation-July-2017-Final.pdf 30 Fortune Minerals Press Release, August 8, 2017: http://www.fortuneminerals.com/news/press-releases/press-release-
details/2017/Fortune-Minerals-Provides-NICO-Project-Update/default.aspx 31 International Seabed Authority, “Cobalt Rich Crusts”, March 2008:
https://www.isa.org.jm/sites/default/files/files/documents/eng9.pdf
16
mine production and reserves of cobalt in 2016 were approximately 123,000 and 7,000,000
tonnes respectively. Based on projected production rates of the advanced exploration projects
surveyed by CCSI, an estimated amount of 10,000 – 12,000 tonnes of cobalt will be coming
online in the next five years.
As discussed above, several experts forecast a strong long-term battery demand growth.
Assuming cobalt production from existing mines remains constant and the addition cobalt from
advanced stage projects by 2020 occurs as projected, there is going to be a significant market
deficit. Figure 6 shows that this deficit persists even when taking into account increasing output
from existing projects and recycling.
Foreseeable Technological Breakthroughs that May Disrupt Cobalt Dependency
In this context, the most important question is whether there are any replacement technologies
that may disrupt cobalt demand. Alternative materials used to replace critical materials must be
process-compatible with the materials they replace, meaning they should enable the technology
to complete the same task using the same process rather than forcing the technology to be
redesigned to fit the new material. As discussed above, currently, cobalt is essential to modern
nickel-cadmium, nickel-metal hydride, and lithium-ion batteries used in EVs. Lithium cobalt
cathodes have the highest storage capacity efficiency32
and use significant amounts of cobalt.
Other lithium-ion batteries that use less (or zero) cobalt face a number of challenges to industry
adoption, including technical feasibility, material scarcity, separation processing capability, and
replicability of the unique properties of cobalt (i.e. conductivity and heat strength).3334
In
Volkswagen’s recent tender, for example, there is a presumption that cobalt usage per unit
battery may decrease over time within an initial usage ratio of nickel:cobalt:manganese at 6:2:2
which could change to 8:1:1 noting the relative scarcity of cobalt and manganese as compared to
nickel. However, EV car-makers have explained that this ratio minimizing cobalt will decrease
the battery lifespans.35
Moreover, nickel reserves themselves are also few and far between, being
historically dominated by Russia, Canada, Indonesia, the Philippines, and New Caledonia.
Zinc-based batteries represent one of the strongest prospects being explored as a realistic
alternative to cobalt-reliant options (illustrated in the table below). Nickel-zinc battery
technology has existed since the early 1900s, but is currently being developed for use in EVs by
a California-based company EnZinc. EnZinc’s battery is expected to be market-ready by 2019.36
Other companies are pursuing zinc-air battery technology, which oxidizes zinc with oxygen from
the air to create low cost, high energy density batteries. Zinc-air batteries have existed for many
years, but a recent breakthrough by the University of Sydney and University of Singapore
enhancing the ability of zinc-air batteries to recharge effectively has made this battery potentially
viable for EVs and other purposes. And because zinc is much more plentiful than cobalt,
32 Jack Lifton. Personal Interview. (2017) 33 AMO Critical Materials Planning Workshop. U.S. Department of Energy. April 18 - 19, 2017. 34 See Appendix D for an overview of the various battery technologies. 35 Deign, “The Truth About the Cobalt Crisis: It's Not a Crisis, Yet”, October 18, 2017 36 Carl West, “Carmakers electric dreams depend on supplies of rare minerals”, The Guardian. July 29, 2017.
https://www.theguardian.com/environment/2017/jul/29/electric-cars-battery-manufacturing-cobalt-mining (accessed October 17,
2017).
17
cheaper, and available in large quantities in many countries throughout the world, zinc-based
battery technology is a highly attractive alternative to cobalt-reliant batteries.37
This technology
is however not in use currently and remains unproven. See Table 2 for a comparison of cobalt-
based batteries as compared to zinc-based batteries.
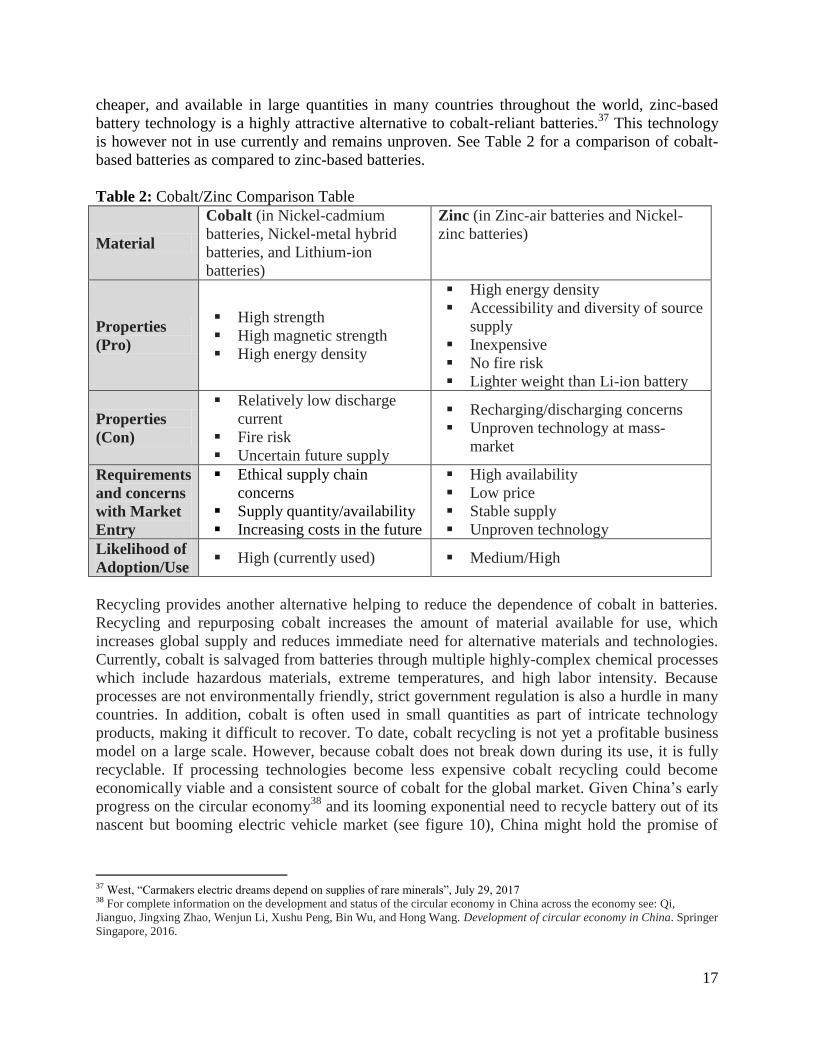
Table 2: Cobalt/Zinc Comparison Table
Material
Cobalt (in Nickel-cadmium
batteries, Nickel-metal hybrid
batteries, and Lithium-ion
batteries)
Zinc (in Zinc-air batteries and Nickel-
zinc batteries)
Properties
(Pro)
High strength
High magnetic strength
High energy density
High energy density
Accessibility and diversity of source
supply
Inexpensive
No fire risk
Lighter weight than Li-ion battery
Properties
(Con)
Relatively low discharge
current
Fire risk
Uncertain future supply
Recharging/discharging concerns
Unproven technology at mass-
market
Requirements
and concerns
with Market
Entry
Ethical supply chain
concerns
Supply quantity/availability
Increasing costs in the future
High availability
Low price
Stable supply
Unproven technology
Likelihood of
Adoption/Use High (currently used) Medium/High
Recycling provides another alternative helping to reduce the dependence of cobalt in batteries.
Recycling and repurposing cobalt increases the amount of material available for use, which
increases global supply and reduces immediate need for alternative materials and technologies.
Currently, cobalt is salvaged from batteries through multiple highly-complex chemical processes
which include hazardous materials, extreme temperatures, and high labor intensity. Because
processes are not environmentally friendly, strict government regulation is also a hurdle in many
countries. In addition, cobalt is often used in small quantities as part of intricate technology
products, making it difficult to recover. To date, cobalt recycling is not yet a profitable business
model on a large scale. However, because cobalt does not break down during its use, it is fully
recyclable. If processing technologies become less expensive cobalt recycling could become
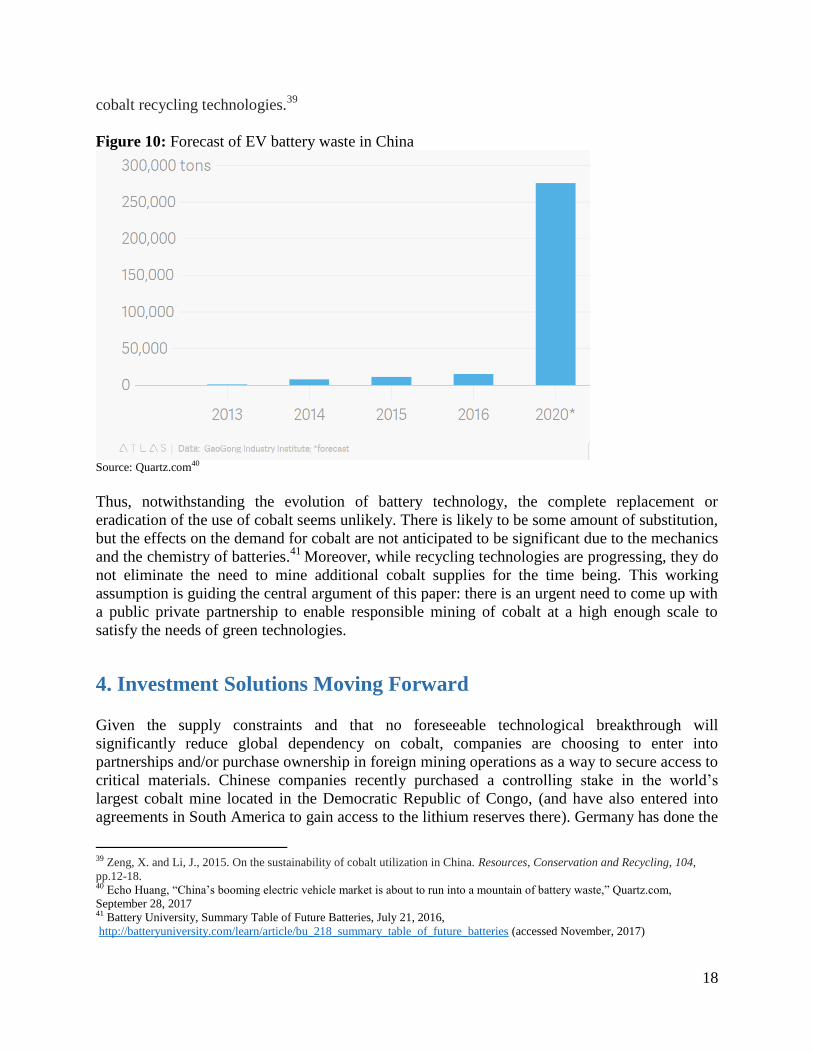
economically viable and a consistent source of cobalt for the global market. Given China’s early
progress on the circular economy38
and its looming exponential need to recycle battery out of its
nascent but booming electric vehicle market (see figure 10), China might hold the promise of
37 West, “Carmakers electric dreams depend on supplies of rare minerals”, July 29, 2017 38 For complete information on the development and status of the circular economy in China across the economy see: Qi,
Jianguo, Jingxing Zhao, Wenjun Li, Xushu Peng, Bin Wu, and Hong Wang. Development of circular economy in China. Springer
Singapore, 2016.
18
cobalt recycling technologies.39
Figure 10: Forecast of EV battery waste in China
Source: Quartz.com40
Thus, notwithstanding the evolution of battery technology, the complete replacement or
eradication of the use of cobalt seems unlikely. There is likely to be some amount of substitution,
but the effects on the demand for cobalt are not anticipated to be significant due to the mechanics
and the chemistry of batteries.41
Moreover, while recycling technologies are progressing, they do
not eliminate the need to mine additional cobalt supplies for the time being. This working
assumption is guiding the central argument of this paper: there is an urgent need to come up with
a public private partnership to enable responsible mining of cobalt at a high enough scale to
satisfy the needs of green technologies.
4. Investment Solutions Moving Forward
Given the supply constraints and that no foreseeable technological breakthrough will
significantly reduce global dependency on cobalt, companies are choosing to enter into
partnerships and/or purchase ownership in foreign mining operations as a way to secure access to
critical materials. Chinese companies recently purchased a controlling stake in the world’s
largest cobalt mine located in the Democratic Republic of Congo, (and have also entered into
agreements in South America to gain access to the lithium reserves there). Germany has done the
39 Zeng, X. and Li, J., 2015. On the sustainability of cobalt utilization in China. Resources, Conservation and Recycling, 104,
pp.12-18. 40 Echo Huang, “China’s booming electric vehicle market is about to run into a mountain of battery waste,” Quartz.com,
September 28, 2017 41 Battery University, Summary Table of Future Batteries, July 21, 2016,
http://batteryuniversity.com/learn/article/bu_218_summary_table_of_future_batteries (accessed November, 2017)
19
same in Bolivia, using foreign direct investment as a tool to secure its supply of critical materials
needed for its green technology growth.42
As discussed above, American EV company Tesla has
claimed it will source 100% of its cobalt from North America, but skeptics suggest that existing
cobalt production from this region of the world will not be enough to supply Tesla’s ambitious
rollout of 500,000 EVs annually by 2018.43
The company may soon be forced to renege on this
promise and partner with other cobalt miners, or find other ways to obtain cobalt. In September
2017, Volkswagen announced a tendering process for a $59 billion contract to secure enough
cobalt supplies to meet the demand of 150 gigawatt-hours of lithium-ion battery storage by 2025.
In October 2017, the firm announced a failure to find a supplier that would guarantee more than
four years of cobalt at a fixed price.44
These examples highlight the need for a more systematic
approach to address cobalt supply going forward.
Smart Mineral Enterprise Development for Green Technologies
As this report has shown, there is a need for a more efficient mechanism for linking triggers of
mineral demand with sources of supply. Given the structural constraints in the mining industry
and the delays from mine discovery to market delivery of products, a smarter system of mineral
enterprise development is needed. We use the word “smart” analogously to how it is used in the
context of smart electricity grids which are dynamic systems allowing for rapid feedback loops
between demand centers to a devolved set of supply sources. Such a system is geared towards
greater resilience and minimal wastage. For smart electricity grids, computer algorithms and
digital interfaces can control the flow of information to maximize efficiency. For a smart mineral
enterprise development system, there is need for an organizational structure to manage this flow
of information.
Without such a “smart” approach, there is major risk associated with the possibility that one
country can flood the market and drop prices of critical minerals, running new and junior
companies out of business. For example, Chinese industry is organizing its supply chains in a
way to ensure that it does not face a shortage of the supply of raw materials. Since China is a
centrally planned economy, its strength lies in its government's push for investments in mining
both domestically and overseas. China has identified a few critical raw materials to focus on, and
uses a hybrid financing-and-government framework to ensure their ample supply. It also has a
range of corporate investment vehicles which include buying minority and majority stakes in
foreign mining companies from state owned enterprises. All these approaches are ultimately
geared towards assuring more direct and efficient connectivity between supply and demand
centers.45
Resource poor, but high income manufacturing countries that have invested strategically through
42 Alex Emery, “Germany's K-Utec signs Bolivian lithium plant contract”, BNAmericas, August 18, 2015,
https://www.bnamericas.com/en/news/mining/germanys-k-utec-signs-bolivian-lithium-plant-contract1/ (accessed March 15,
2017). 43 Gandon, “No cobalt, no Tesla?” January 2017 44 Jason Deign, “The Truth About the Cobalt Crisis: It's Not a Crisis, Yet”, Green Tech Media, October 18, 2017,
https://www.greentechmedia.com/amp/article/the-truth-about-the-cobalt-crisis. (accessed October 25, 2017) 45 Jill Shankelman. Chinese Oil and Mining Companies and the Governance of Resource Wealth. Washington DC: Woodrow
Wilson Center, 2009.
20
a public-private partnership model in mineral supply chains most notably are Japan and Republic
of Korea. Both these countries have engaged public sector entities that assist with mineral supply
assurance. In Japan there are two organizations which work closely to ensure mineral supply -
one from the geological and scientific side (the Japanese Oil, Gas and Metals National
Corporation or JOGMEC) and the other on the finance side (The Japanese Bank for International
Cooperation). In the Korean case, there is a state-owned exploration and development company
called Korea Resources Corporation (KORES) which has in its stated mission the support of the
country's industrial consortia or "chaebols."46
In the aforementioned Asian countries, the government works with the financial sector (or in the
case of China, controls and dictates actions of the financial sector) to facilitate and ensure capital
investment to the technology metals industry.47
This, in turn, enables increased production by the
industry to achieve adequate supply of these critical materials. As a result of these PPPs, the
majority of the world’s technology metals and materials are produced by entities owned or
operated for the benefit of these Asian countries.
Meanwhile, the United States, Canadian, and EU governments do not directly invest in mining or
have public-private partnership frameworks in place for such investment. Instead, they rely
largely on the private sector to invest unilaterally, based on the belief that the power of the free
market will balance the supply and demand needs of their industry. However, the dependence of
modern economic systems on critical metals requires us to consider a hybrid approach which
combines the innovative impulse of private enterprise with the strategic long-term view that
public sector institutions can provide. While the United States has several National Labs and has
also supported organizations such as the Critical Materials Institute (CMI) through university and
private sector partnerships, the mandate of such efforts is largely limited to research rather than
project development.
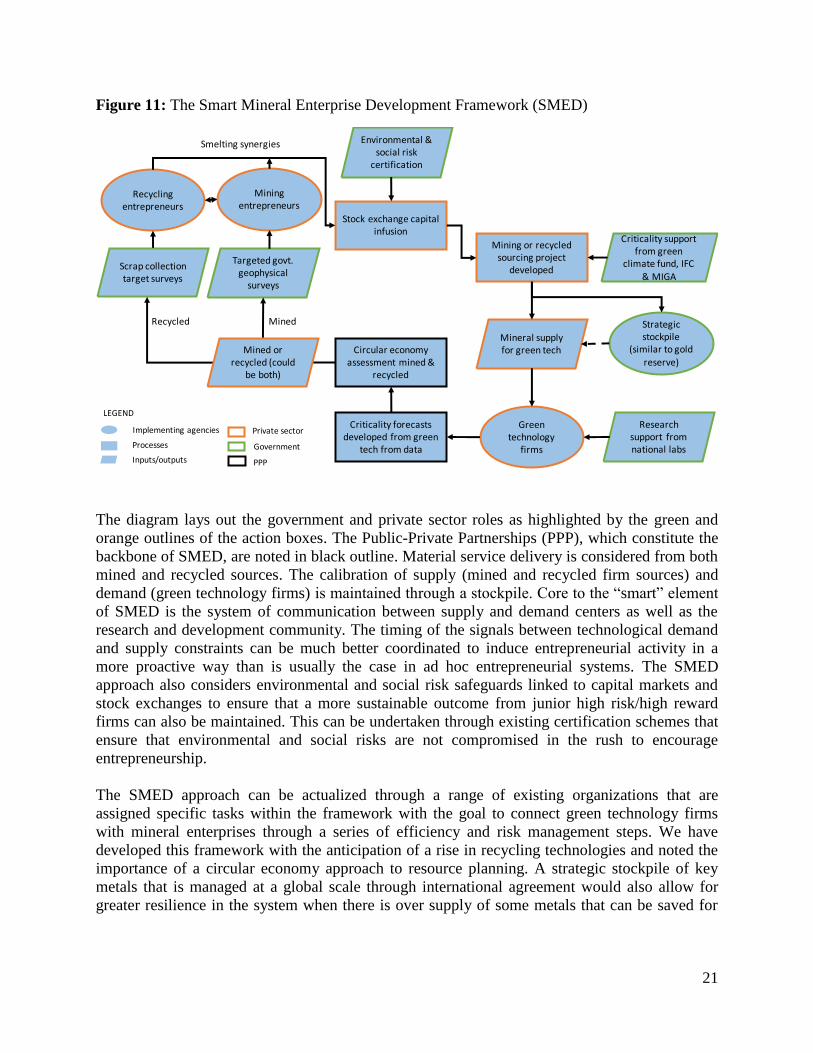
Figure 11 shows our suggested hybrid or “Smart Mineral Enterprise Development” approach,
which can be applied to critical metals planning. The diagram uses flowchart nomenclature with
inputs, outputs, decision and process nodes.
46 Margaret Armstrong, M., D’Arrigo Rafael, Petter Carlos, and Galli Alain 2016. “How Resource-Poor Countries in Asia Are
Securing Stable Long-Term Reserves: Comparing Japan’s and South Korea’s Approaches.” Resources Policy 47: 51–
60. https://doi.org/10.1016/j.resourpol.2015.12.001. 47 Shenzhen Jihnhang Deep Sea Minerals Technology Development Co., Ltd. Company Profile. 2017
21
Figure 11: The Smart Mineral Enterprise Development Framework (SMED)
The diagram lays out the government and private sector roles as highlighted by the green and
orange outlines of the action boxes. The Public-Private Partnerships (PPP), which constitute the
backbone of SMED, are noted in black outline. Material service delivery is considered from both
mined and recycled sources. The calibration of supply (mined and recycled firm sources) and
demand (green technology firms) is maintained through a stockpile. Core to the “smart” element
of SMED is the system of communication between supply and demand centers as well as the
research and development community. The timing of the signals between technological demand
and supply constraints can be much better coordinated to induce entrepreneurial activity in a
more proactive way than is usually the case in ad hoc entrepreneurial systems. The SMED
approach also considers environmental and social risk safeguards linked to capital markets and
stock exchanges to ensure that a more sustainable outcome from junior high risk/high reward
firms can also be maintained. This can be undertaken through existing certification schemes that
ensure that environmental and social risks are not compromised in the rush to encourage
entrepreneurship.
The SMED approach can be actualized through a range of existing organizations that are
assigned specific tasks within the framework with the goal to connect green technology firms
with mineral enterprises through a series of efficiency and risk management steps. We have
developed this framework with the anticipation of a rise in recycling technologies and noted the
importance of a circular economy approach to resource planning. A strategic stockpile of key
metals that is managed at a global scale through international agreement would also allow for
greater resilience in the system when there is over supply of some metals that can be saved for
Strategicstockpile
(similartogoldreserve)
Recyclingentrepreneurs
Miningentrepreneurs
Greentechnology
firms
Criticalitysupportfromgreen
climatefund,IFC
&MIGA
Mineralsupplyforgreentech
Environmental&socialriskcertification
Scrapcollectiontargetsurveys
Targetedgovt.geophysicalsurveys
Researchsupportfromnationallabs
Miningorrecycledsourcingproject
developed
Stockexchangecapitalinfusion
Circulareconomyassessmentmined&
recycled
Criticalityforecastsdevelopedfromgreen
techfromdata
MinedRecycled
Smeltingsynergies
Implementingagencies
Processes
Inputs/outputs
LEGEND
Minedorrecycled(could
beboth)
Government
Privatesector
PPP
22
future shortages. During the Cold War, countries regularly kept metal stockpiles. This has been
studied and investigated by the U.S. National Academy of Sciences.48
The Intergovernmental Forum on Mining Metals and Sustainable Development (IGF) could
potentially be a coordinating body for this effort. This forum, which was originally motivated by
the Canadian government to improve governance of mining countries in order to minimize risk
for Canadian miners, now has a membership of over 60 mining countries. It could be further
empowered through an international protocol which allows for the sharing of valuable geological
and scrap availability data. Existing certification systems such as those developed by the OECD
could be harnessed for the environmental and social risk certification component of the
framework (see Box 2).
Box 2: Responsible Cobalt Initiative for DRC
The Chinese Chamber of Commerce for Metals, Minerals & Chemicals Importers & Exporters
(CCCMC) in partnership and cooperation with the Organization for Economic Cooperation and
Development (OECD) Due Diligence Guidance, launched the Responsible Cobalt Initiative
(RCI) that provides member companies with steps to take to identify and address potential
adverse impacts associated with their activities or relationships. RCI was launched in response to
human rights abuses and egregious health and safety conditions in some artisanal cobalt mines in
the Democratic Republic of the Congo. As a priority, the RCI intends to tackle issues of the
worst forms of child labor.
Launched in November 2016, the RCI strives to bring about a collective response to social and
environmental risks in the cobalt supply chain. The initiative promotes the responsible sourcing
and use of cobalt in all forms and aims to improve the lives of children and adults who mine
cobalt in the Democratic Republic of the Congo.
Members of the initiative pledge to follow OECD Due Diligence Guidance on Responsible
Supply Chains of Minerals from Conflict-Affected and High-Risk Areas, which calls for
companies to trace how cobalt is being extracted, transported, manufactured and sold. The
OECD provides clear, practical guidance for companies to ensure they do not contribute to
conflict or human rights abuses through their mining activities through a five-step risk-based due
diligence process. This applies to all companies in the mineral supply chain that could potentially
use minerals from conflict affected or high-risk areas, including pre-production exploration
activities. Its members currently include Apple Inc., Beijing Easpring Material Technology
Co.,Ltd., HP Inc., Huawei Device Co.,Ltd., L&F, Samsung SDI, Sony Corporation, Tianjin
B&M Science and Technology Joint-Stock Co., Ltd., Zhejiang Huayou Cobalt Co., Ltd., and
First Cobalt Corp. Companies will work together, in coordination with the Government of the
Democratic Republic of the Congo, to develop and begin implementation of an action plan
during the next 12 months.49
48 Refer to National Research Council, Managing Materials for a Twenty First Century Military. Washington DC; National
Academies Press (2008). Chapter available online: https://www.nap.edu/read/12028/chapter/10 49 Chinese Chamber of Commerce for Metals, Minerals & Chemicals (CCCMC) Importers & Exporters (2017). Facing
challenges, sharing responsibility, joining hands and achieving win-win. http://www.cccmc.org.cn/docs/2016-
11/20161121141502674021.pdf (accessed 2 Jun. 2017); Anon, (2017). https://www.juniorminingnetwork.com/junior-miner-
23
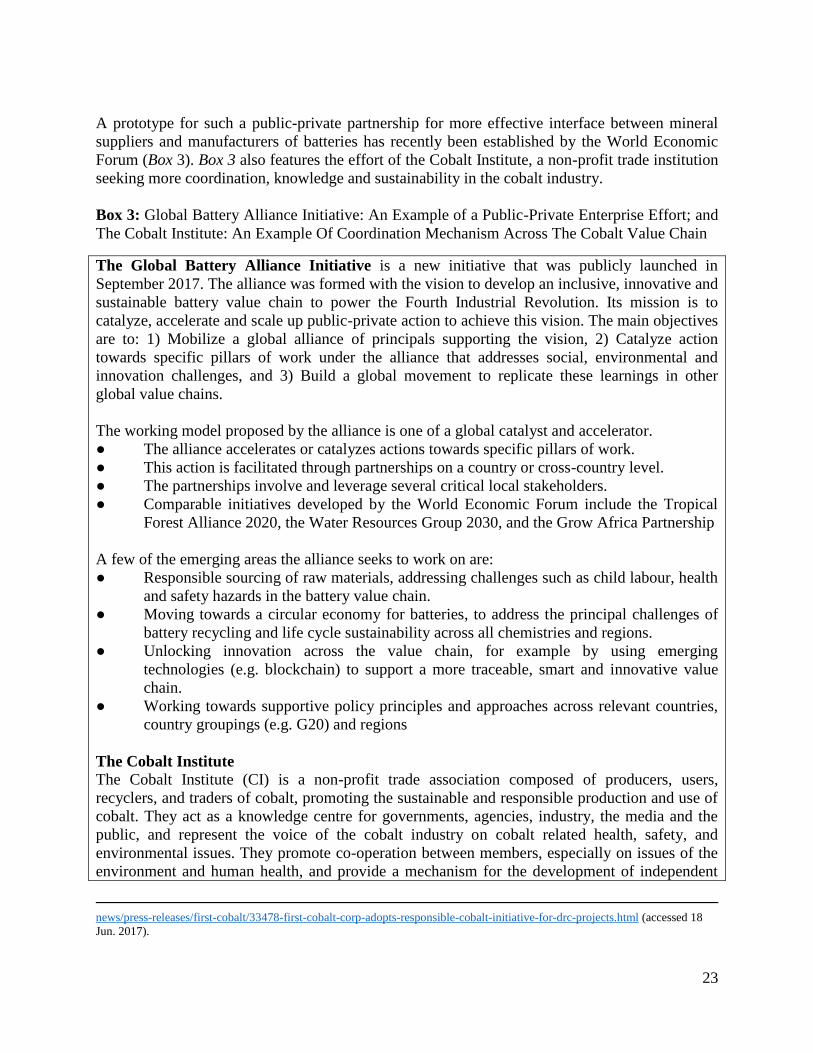
A prototype for such a public-private partnership for more effective interface between mineral
suppliers and manufacturers of batteries has recently been established by the World Economic
Forum (Box 3). Box 3 also features the effort of the Cobalt Institute, a non-profit trade institution
seeking more coordination, knowledge and sustainability in the cobalt industry.
Box 3: Global Battery Alliance Initiative: An Example of a Public-Private Enterprise Effort; and
The Cobalt Institute: An Example Of Coordination Mechanism Across The Cobalt Value Chain
The Global Battery Alliance Initiative is a new initiative that was publicly launched in
September 2017. The alliance was formed with the vision to develop an inclusive, innovative and
sustainable battery value chain to power the Fourth Industrial Revolution. Its mission is to
catalyze, accelerate and scale up public-private action to achieve this vision. The main objectives
are to: 1) Mobilize a global alliance of principals supporting the vision, 2) Catalyze action
towards specific pillars of work under the alliance that addresses social, environmental and
innovation challenges, and 3) Build a global movement to replicate these learnings in other
global value chains.
The working model proposed by the alliance is one of a global catalyst and accelerator.
● The alliance accelerates or catalyzes actions towards specific pillars of work.
● This action is facilitated through partnerships on a country or cross-country level.
● The partnerships involve and leverage several critical local stakeholders.
● Comparable initiatives developed by the World Economic Forum include the Tropical
Forest Alliance 2020, the Water Resources Group 2030, and the Grow Africa Partnership
A few of the emerging areas the alliance seeks to work on are:
● Responsible sourcing of raw materials, addressing challenges such as child labour, health
and safety hazards in the battery value chain.
● Moving towards a circular economy for batteries, to address the principal challenges of
battery recycling and life cycle sustainability across all chemistries and regions.
● Unlocking innovation across the value chain, for example by using emerging
technologies (e.g. blockchain) to support a more traceable, smart and innovative value
chain.
● Working towards supportive policy principles and approaches across relevant countries,
country groupings (e.g. G20) and regions
The Cobalt Institute
The Cobalt Institute (CI) is a non-profit trade association composed of producers, users,
recyclers, and traders of cobalt, promoting the sustainable and responsible production and use of
cobalt. They act as a knowledge centre for governments, agencies, industry, the media and the
public, and represent the voice of the cobalt industry on cobalt related health, safety, and
environmental issues. They promote co-operation between members, especially on issues of the
environment and human health, and provide a mechanism for the development of independent
news/press-releases/first-cobalt/33478-first-cobalt-corp-adopts-responsible-cobalt-initiative-for-drc-projects.html (accessed 18
Jun. 2017).
24
information concerning the resources, production and safe use of cobalt.50
The International Legal Framework and SMED
The international legal framework could also support the implementation of SMED in different
ways. International trade and investments are governed by the World Trade Organization
(WTO), Free Trade Agreements (FTAs), and Bilateral and Multilateral Investment Treaties
(BITs). This framework supersedes the domestic legal frameworks. Following intense treaty-
signing activity during the 1990s, the number of investment treaties and agreements jumped from
under 400 in 1990 to over 3,300 in 2015.51
There are several ways in which the framework
could be adapted to support the implementation of SMED.
Trade:
There is an ongoing negotiation at the WTO to eliminate tariffs for “environmental goods.” In
January 2016, the Asia-Pacific Economic Cooperation (APEC) promoting free trade in Asia-
Pacific took the lead and signed such an agreement that includes a list of 54 goods linked to
renewable energies and energy efficiencies.52
If critical minerals qualify as environmental goods,
WTO and related free trade agreements would ensure that trade barriers do not stand as an
obstacle to the implementation of SMED. Moreover, WTO has been criticized for banning green
subsidies as it does for any specific subsidy.53
There are suggestions that these subsidies should
be “non- actionable” (not subject to countervailing measures) given their potential to contribute
to the improvement of public welfare.54
In case the WTO reinstates green subsidies as being non-
actionable, these should encompass those involved in the implementation of SMED.
Another recent development that could encompass green technology mineral promotion and
information exchange among trading partners to support SMED is Europe’s chapter on Trade
and Sustainable Development (TSD) that the EU intends to include in its FTAs. A recent FTA
signed with Singapore includes the following relevant articles:
50 Adapted from the Cobalt Institute website: https://www.cobaltinstitute.org/ 51 Jesse Coleman and Lise Johnson, “International Investment Law and the Extractive Industries Sector,” Columbia Center on
Sustainable Investment. January 12, 2016. http://ccsi.columbia.edu/files/2016/01/2016-01-12_Investment-Law-and-
Extractives_Briefing-Note_1.pdf. (accessed November 5, 2017) 52 Asia Pacific Economic Cooperation website, APEC Cuts Environmental Goods Tariffs – Singapore, 28 January 2016,
available at: https://www.apec.org/Press/News-Releases/2016/0128_EG (accessed November 5, 2017) 53 According to the WTO a subsidy is every government intervention that grants benefits to specific recipients rather than the
public at Large. Subsidies are either prohibited (export and local content subsidies), or ‘actionable’. A third category that
included environmental subsidies was classified as ‘non-actionable’ over a five-year period up to 1 January 2000 (Art. 31 of the
Agreement on Subsidies and Countervailing Measures (SCM). Actionable subsidies are ‘countervailable’, either through
unilateral or through multilateral action (dispute before a Panel). The agreement on non-actionable subsidies was not renewed
post 2000. (Source: Mavroidis, Petros C., and De Melo, Jaime, “Climate Change Policies and the WTO: Greening the GATT
Revisited”, pp. 225-238 in Scott Barrett, Carlo Carraro, and Jaime de Melo (eds.), Towards a Workable and Effective Climate
Regime, CEPR and FERDI: London, UK. 2015) 54 Petros C. Mavroidis and Jaime De Melo, “Climate Change Policies and the WTO: Greening the GATT Revisited”, pp. 225-238
in Scott Barrett, Carlo Carraro, and Jaime de Melo (eds.), Towards a Workable and Effective Climate Regime, CEPR and FERDI:
London, UK. 2015
25
Article 13.1: …“The Parties recognise that economic development, social development
and environmental protection are interdependent and mutually reinforcing components
of sustainable development. They underline the benefit of cooperation on trade-related
social and environmental issues as part of a global approach to trade and sustainable
development.”55…,
and
Article 13.10: “Cooperation on Environmental Aspects in the Context of Trade and
Sustainable Development:
The Parties recognise the importance of working together on trade-related aspects of
environmental policies in order to achieve the objectives of this Agreement. The Parties
may initiate cooperative activities of mutual benefit in areas including but not limited to:
(a) exchange of views on the positive and negative impacts of this Agreement on
environmental aspects of sustainable development and ways to enhance, prevent or
mitigate them, taking into account sustainability impact assessments carried out by either
or both Parties;
(b) cooperation in international fora addressing environmental aspects of trade and
sustainable development, including in particular at the WTO, under the United Nations
Environment Programme and under multilateral environmental agreements;
(c) cooperation with a view to promoting the ratification and effective implementation of
multilateral environmental agreements with relevance to trade;
(d) information exchange and cooperation on private and public certification and
labelling schemes including eco-labelling, and green public procurement;
(e) exchange of views on the trade impact of environmental regulations, norms and
standards;
(f) cooperation on trade-related aspects of the current and future international climate
change regime, including ways to address adverse effects of trade on climate, as well as
means to promote low-carbon technologies and energy efficiency;
(g) cooperation on trade related aspects of multilateral environmental agreements,
including customs cooperation;
(h) sustainable forest management to encourage effective measures for certification of
sustainably produced timber;
(i) exchange of views on the relationship between multilateral environmental agreements
and international trade rules;
(j) exchange of views on the liberalisation of environmental goods and services; and
(k) exchange of views regarding conservation and management of the living marine
55 Singapore- Europe free trade agreement, chapter thirteen trade and sustainable development.
http://trade.ec.europa.eu/doclib/docs/2013/september/tradoc_151766.pdf. (accessed November 5 2017).
26
resources.” 56
Existing TSD chapters in EU trade agreements include a comprehensive set of binding
provisions, rooted in multilateral standards, notably the International Labour Organisation (ILO)
conventions and Multilateral Environmental Agreements (MEAs). The institutional structure
operationalizing EU TSD chapters grants civil society a key advisory role. Civil society groups
participate in the monitoring of the FTA implementation through platforms on the side of each
FTA partner and through Joint Platforms bringing together civil society organisations from both
FTA partners. TSD provisions are binding and subject to a different dispute settlement
mechanism, as it grants an explicit role to civil society and international organizations. This
mechanism does not include sanctions and enforcement has been limited, which is an area that is
currently being reviewed. 57
Such mechanism could provide a useful framework for countries to
cooperate in order to promote the implementation of SMED at the international level.
Investment:
BITs could also be adapted to support the implementation of SMED. BITs are signed between
states and impose obligations and restrictions on countries regarding their treatment of foreign
investors. BITs protect investors from government action that would harm the right and interests
of foreign investors that seek to invest or who have invested in a host country. When a state signs
a treaty, “a state’s ability to adopt, revise, repeal, and enforce laws and policies that affect
foreign investors or investments is made subject to the state’s obligations under that treaty.”58
A
breach of these obligations due to the promulgation of a law that would negatively affect an
investment can trigger an arbitration procedure whereby a foreign investor covered by the BIT
takes the state to arbitration in an international tribunal. A BIT supporting critical mineral
development could include a chapter focused on critical minerals that makes the investment
conditional on the implementation of a specified SMED process that allocates the
implementation responsibility to the state. Furthermore, the chapter could include protections for
the investor such as uncompensated nationalization, denial of justice and export restrictions. This
would be particularly relevant to the implementation of SMED at the global level since export
restrictions could disrupt the supply of critical minerals.
It should be noted BITs have often been used abusively by foreign investors that have been
taking governments to court for imposing environmental and social protection mechanisms.
Many of these investor-state disputes are related to extractive industry investments (E.g.59
56 Singapore- Europe Free Trade Agreement, Chapter Thirteen Trade and Sustainable Development (Article 13.10) 57 Non-paper of the Commission services. Trade and Sustainable Development (TSD) chapters in EU Free Trade Agreements
(FTAs). http://trade.ec.europa.eu/doclib/docs/2017/july/tradoc_155686.pdf. (accessed November 5 2017). 58 Coleman and Johnson, “International Investment Law and the Extractive Industries Sector”. Columbia Center on Sustainable
Investment. January 12, 2016. 59Among the other cases concerning investments in the extractive industries sector, the following types of government actions
have been challenged by investors: – Termination of contracts with investors (e.g. Occidental Petroleum Corporation and
Occidental Exploration and Production Company v. Ecuador 2012); – Revocation/ termination of permits authorizing investors’
operations (e.g. The Renco Group, Inc. v. Peru; Gold Reserve Inc. v. Venezuela); – Decisions not to grant permits (e.g. Pac Rim
Cayman LLC v. El Salvador; Clayton and Bilcon of Delaware Inc. v. Canada); – Changes to fiscal regimes (including changes in
interpretations of and enforcement strategies for existing laws and regulations) (e.g. Occidental Exploration and Production
Company v. Ecuador 2004; Perenco Ecuador Limited v. Ecuador); – Requirements to purchase local goods and services/invest in
27
Glamis Gold, Ltd. vs United States and Lone Pine Resources Inc. vs Canada for more stringent
environmental regulations”) 60
.
As such, much care should be taken to draft SMED related investor protection clauses and
governments should “carefully define the scope and content of these agreements in order to
protect their ability to regulate in the public interest.”61
Thus suggesting how BITs could be used
in favor of SMED is a delicate exercise. If investments in critical minerals ought to be protected
by BITs in particular, the state’s right to legislate to limit the social and environmental harm of
an investment in critical minerals should be equally protected. The right to arbitration should not
be granted if a foreign investor is in breach of the IFC performance standards for instance. To
further limit the potential for abuse of BITs by investors, it is recommended that the dispute
settlement can only be triggered by a state complaint, as is currently the case under the WTO and
trade chapters of the FTAs.
Beyond the existing legal framework governing investment and trade, a recent development in
the field of international environmental governance could be used for implementing the SMED
approach: in June 2017 world leaders agreed to collaborate on putting forth a Global Pact for the
Environment. The proposal foresees a universal, international umbrella binding document
synthesizing and harmonizing the principles outlined in the Rio Declaration, the Earth Charter,
the World Charter for Nature, and other instruments shaping environmental governance.62
This
Global Pact for the Environment could promote the principles of SMED while ensuring that any
critical mineral exploitation would comply with the international environmental and social
standards.
6. Conclusion and Further Research
While there has been increasing focus on critical materials for green technologies, the
relationship between public and private sectors to spur appropriate investments to meet the
lurking supply crunch has thus far been neglected. Using the example of cobalt, which is a key
input to a variety of green technology products with limited substitutability, we show that the
private sector, mainly composed of mining entrepreneurs, is currently not investing sufficiently
in exploration and development to bring enough projects on stream to satisfy the demand
necessary for the energy transition. This is because the incentive mechanisms are not supporting
timely private sector investments in that space. Given the public good nature of green
technologies, there is a strong case for government intervention to support the transition. While
in many countries policies are in place to support and subsidize the roll-out of renewable
research and development (e.g., Mobil Investments Canada, Inc. v. Canada)”, etc. (source: Coleman and Johnson, “International
Investment Law and the Extractive Industries Sector”. Columbia Center on Sustainable Investment. January 12, 2016) 60 Coleman and Johnson, “International Investment Law and the Extractive Industries Sector”. Columbia Center on Sustainable
Investment. January 12, 2016. 61 Coleman and Johnson, “International Investment Law and the Extractive Industries Sector”. Columbia Center on Sustainable
Investment. January 12, 2016. 62 “French initiative to create global environment pact deserves support, says Secretary-General”. UN News Centre. 17,
September, 2017, Available at http://www.un.org/sustainabledevelopment/blog/2017/09/french-initiative-to-create-global-
environment-pact-deserves-support-says-secretary-general/. (accessed November 2017)
28
energies and green transport solutions, these interventions will fall short if not paired with
policies that help guarantee the supply of key inputs, such as cobalt. Several Asian countries are
utilizing PPP frameworks in critical materials mining with great success, but no such system
exists in the US, within the EU, or at an international level. We therefore propose a framework
which enables the public sector and research community to play an essential role in facilitating
an efficient and “smart” system for managing enterprise development, which mimics the
efficiency of an eponymous “Smart Grid” system for energy. Stock exchanges, which host small
mining and recycling companies, must also be more actively engaged in this process to monitor
any environmental and social risks of listed companies.
Forecasts of supply and demand are highly malleable and more refined models are needed to link
technological developments, geological discoveries and consumer choice. This should be an area
of further research governments should be more involved in primary data recording and
acquisition. So far the criticality of minerals is being highlighted at national or regional levels,
similar to the latest list of critical metals published by the U.S. Geological Survey on February
16, 2018.63
While such lists are useful, there is a need for a more global approach to this
phenomenon to address global environmental concerns such as climate change. The international
governance system could help with the promotion of investments in critical minerals. While we
are conscious of continuous alternative material research in all criticality cases, our broader goal
is the development of a system that supports any new material needs of ever-changing
technologies that supports the energy transition. Ultimately, international treaties such as the
Paris Agreement, which set targets for particular environmental goals, will need to pay more
attention to material needs and mechanisms for ensuring any embedded targets can be met.
63 Draft List of Critical Minerals – Federal Register, February 16, 2018:
https://www.federalregister.gov/documents/2018/02/16/2018-03219/draft-list-of-critical-minerals
29
Appendix A: Survey Methodology
Data compilation We drew up a list of publicly-traded mining and exploration companies on stock exchanges in
Canada, Australia, USA, Europe, Tokyo, and Hong Kong. These exchanges were selected for the
similarity in their listing rules to allow for greater uniformity in the sort of company data
collected. Also, given the deposit types of naturally occurring cobalt compounds, the selection
was constrained to companies with some combination of nickel, copper, and occasionally gold as
the primary mineral, with secondary targets for cobalt.
Next, we collected technical data on cobalt projects. This data comprised of: the size and
location of the mineral resource and reserve; the grade or concentration of the target mineral; and
the status of exploration at the project site. The sources for this data include NI 43-101 technical
reports, announcements on the Australian Stock Exchange (ASX), news and media reports, and
descriptions on company websites. The survey required technical data that is compliant with
JORC 2012 and NI 43-101 standards as a minimum (see box 4 for more information on the
mineral investment process). It was important that all the information collected on the companies
and projects are publicly available to allow for easier verification and data reconciliation. In
total, 67 projects were surveyed. The database structure used for the survey was:
1. Exchange (name of stock exchange on which the company is listed)
2. Company (name of company)
3. HQ Location
4. HQ Region
5. Project (name of project)
6. Ownership (% ownership of project for company listed)
7. Country
8. State
9. Latitudinal and longitudinal data (for mapping purposes)
10. Status (stage of project exploration)
11. Deposit or Exploration type
12. Grade (in %) and tonnage (in million or thousand M.tonnes) for Proven & Probable
Reserves (P&P)
13. Grade (in %) and tonnage (in million or thousand M.tonnes)for Indicated & Measured
Resources (I & M)
14. Grade (in %) and tonnage (in million or thousand M.tonnes) for Inferred Resources
15. NI 43-101 report (yes/no)
16. Notes relevant to project or company
17. Additional financial information
A column on exploration type was included to note which projects were brownfield or greenfield
exploration for further analysis.
Data Analysis and Reconciliation To begin the spatial distribution analysis, location data for each project was collected and
plotted. Oftentimes, this data was given as longitudinal and latitudinal data included in project
30
descriptions on company websites, presentations, or in technical reports. Where longitudinal and
latitudinal data was not provided, as in initial or early exploration projects where no technical
reports had been prepared, a central location point was inferred from project descriptions. As an
example, a project described as 100 km southwest (SW) of a town or city was estimated to be at
any point 100 km SW of said city, and within 50km radius of said point. This was done so as to
allow projects in initial and early exploration stages to be plotted regardless of exactness of the
locational data.
In determining a project’s stage of exploration, the following key was developed with guidance
from the Generalized Model of Resource Development (see Appendix B):
Initial Exploration: At most, land staked and property claims filed, reconnaissance and
data compilation underway.
Early Exploration: At least inferred resources have been defined. Anomaly surveys
underway. Might include a scoping report, pre-feasibility report, or preliminary economic
assessment.
Advanced Exploration: At most, proven and probable reserves have been defined.
Might include a scoping, pre-feasibility, or feasibility report.
Development: At least proven and probable reserves have been defined. Company
announcements and news reports of permitting, construction, offtake agreements, and
other development activities at project site.
It was important that information reported on company websites were consistent with company
announcements on security or stock exchanges, report publications in security exchange
databases such as SEDAR, and news in the media.
Limitations of survey
Three factors constrain the survey of projects:
1. Time limitations: Project or company announcements that have not been updated after
three fiscal quarters (nine months) are excluded in the final ranking of companies. This is
to ensure public information on the projects are current. As an example, Metorex, a
company traded on the Hong Kong stock exchange, claims their Musonoi project in the
DRC is in the advanced exploration stage with a relatively sizable resource base.
However, the company’s latest publicly available annual report is from 2010 and the last
project update on their website is from 2014. As a result, the project was not included in
final rankings for advanced cobalt projects.
2. Company type: Only publicly-traded companies were surveyed due to greater
transparency and availability of information on these companies. Security and stock
exchanges mandate companies adhere to certain rules. As a result, private companies
with lithium and cobalt exploration projects were excluded. We also only included
companies traded on exchanges in the United States, Canada, Australia, and Europe in
the final analysis due to greater uniformity in listing rules on their respective exchanges.
3. Regional project density: The survey required a minimum of two exploration projects in a
geographic region to be noted as significant. As an example, Birimian Limited’s
Goulmina project in Mali was not charted as it is the only lithium exploration project in
the MENA and African regions with JORC-compliant resources.
31
Box 4: Mineral Investment Process
Investing in a mining project involves analyzing a unique mix of geological, technical,
economic, social, and environmental risks at nearly every stage of the project. As with any other
investment, it is important investors do their due diligence when deciding on a project. The
process for assessing the potential success of a mining project rests primarily on three factors:
the technical components of the project, the knowledge and expertise of the project directors, and
the region in which the project is located64
. These three factors are known colloquially in the
mining industry as the three Ps – project, people, and place – and they factor in many of the risks
associated with developing a mining deposit.
A robust mineral deposit is the foundation on which a good project is built, and the defining
metrics of a mineral deposit are its grade, tonnage, and metallurgy. The grade of a deposit is the
percentage or concentration of valuable mineral in the ore, while tonnage refers to the volumetric
size of the deposit. A deposit with above average grade and tonnage has a higher chance of
making it to production, all things being equal. In addition to the tonnage and grade, the
technical viability of the metallurgical methods proposed should also be assessed, as incorrect
metallurgical analyses can lead to cost overruns and can betray a lack of specialized knowledge
in the team.
This geological and technical information is typically sourced from technical reports or official
resource estimates, which are published by companies at certain project milestones. When
assessing a project, it is important that the exploration results and mineral estimates published by
the company are compliant with standardized mineral reporting rules and guidelines such as the
JORC Code (2012), NI 43-101, and SAMREC. Resource estimates not compliant with reporting
standards are not reliable and will incur more risk for the investor if used as the basis for
analyses.
Finally, one should assess the category of the mineral deposit. As discussed above, project risk
varies with the resource classification and stage of development. A mineral deposit is classified
as a resource when primarily geological risks have been considered, and as a reserve when
economic risks (factoring in legal, political, social and environmental circumstances) have been
considered in addition. The geological risk associated with the project reduces with more tests
and delineation, while economic risk reduces with studies analyzing the effects that commodity
price, costs, and other economic parameters have on the viability of developing the project.
64 David Talbot: Interview (April, 2017)

32
Appendix B: Cobalt Companies Examined For Analysis
Access excel file online for this information.
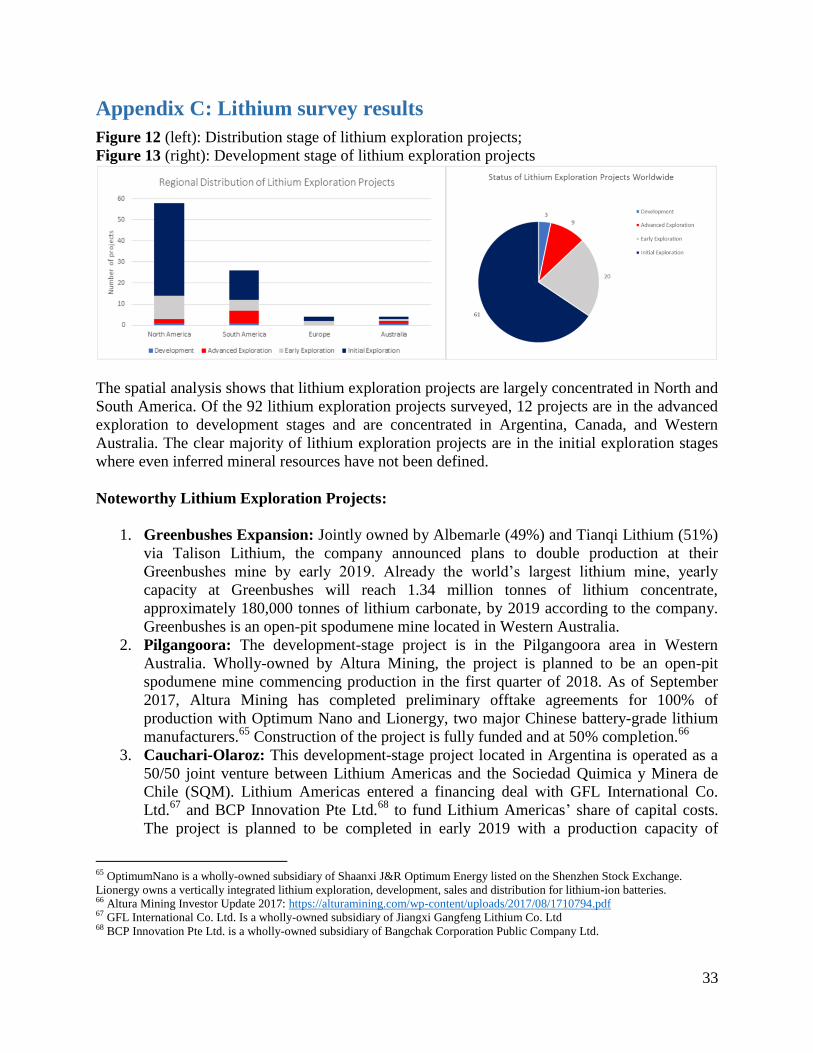
33
Appendix C: Lithium survey results
Figure 12 (left): Distribution stage of lithium exploration projects;
Figure 13 (right): Development stage of lithium exploration projects
The spatial analysis shows that lithium exploration projects are largely concentrated in North and
South America. Of the 92 lithium exploration projects surveyed, 12 projects are in the advanced
exploration to development stages and are concentrated in Argentina, Canada, and Western
Australia. The clear majority of lithium exploration projects are in the initial exploration stages
where even inferred mineral resources have not been defined.
Noteworthy Lithium Exploration Projects:
1. Greenbushes Expansion: Jointly owned by Albemarle (49%) and Tianqi Lithium (51%)
via Talison Lithium, the company announced plans to double production at their
Greenbushes mine by early 2019. Already the world’s largest lithium mine, yearly
capacity at Greenbushes will reach 1.34 million tonnes of lithium concentrate,
approximately 180,000 tonnes of lithium carbonate, by 2019 according to the company.
Greenbushes is an open-pit spodumene mine located in Western Australia.
2. Pilgangoora: The development-stage project is in the Pilgangoora area in Western
Australia. Wholly-owned by Altura Mining, the project is planned to be an open-pit
spodumene mine commencing production in the first quarter of 2018. As of September
2017, Altura Mining has completed preliminary offtake agreements for 100% of
production with Optimum Nano and Lionergy, two major Chinese battery-grade lithium
manufacturers.65
Construction of the project is fully funded and at 50% completion.66
3. Cauchari-Olaroz: This development-stage project located in Argentina is operated as a
50/50 joint venture between Lithium Americas and the Sociedad Quimica y Minera de
Chile (SQM). Lithium Americas entered a financing deal with GFL International Co.
Ltd.67
and BCP Innovation Pte Ltd.68
to fund Lithium Americas’ share of capital costs.
The project is planned to be completed in early 2019 with a production capacity of
65 OptimumNano is a wholly-owned subsidiary of Shaanxi J&R Optimum Energy listed on the Shenzhen Stock Exchange.
Lionergy owns a vertically integrated lithium exploration, development, sales and distribution for lithium-ion batteries. 66 Altura Mining Investor Update 2017: https://alturamining.com/wp-content/uploads/2017/08/1710794.pdf 67 GFL International Co. Ltd. Is a wholly-owned subsidiary of Jiangxi Gangfeng Lithium Co. Ltd 68 BCP Innovation Pte Ltd. is a wholly-owned subsidiary of Bangchak Corporation Public Company Ltd.
34
25,000 tonnes of lithium carbonate annually.
4. Whabouchi: Whabouchi Lithium is a development-stage hard rock project located in
Quebec, Canada. As of September 2017, the company has met feed production targets for
the Phase 1 Plant in Shawinigan, Quebec. The company aims to be a fully integrated
lithium producer processing lithium concentrate into battery-grade lithium compounds at
their Shawinigan plant through a patented process. The project has an open-pit mineral
profile of 20 million tonnes of proven and probable reserves at an average grade of 1.53%
and is projected to expand to an underground mine. Commercial production is expected
by early to mid 2018.
5. Sonora Lithium: Jointly owned by Bacanora Minerals (70%) and Cadence Minerals
(30%), the lithium-clay project is located about 190km north of Hermosillo, Mexico and
is in the advanced exploration stage. In June 2017 the company entered an offtake
contract with Hanwa Co. Ltd.69
for 70% to 100% of planned production in Phase 1,
conditional on an initial 10% equity interest in Bacanora.
Other advanced projects expected to come online in the next two years are: Jadar in Serbia by
Rio Tinto; Planta Salar in Chile owned by Rockwood Lithium; Salar de Centenario in Argentina
owned by Eramet; Sal de Vida in Argentina owned by Galaxy Resources Ltd.; Sal de Los
Angeles in Argentina owned by Lithium X Energy Corp.; Tres Quebradas in Argentina owned
by Neo Lithium Corp.; Authier in Canada owned by Sayona Mining, and further expansion at
Albemarle’s Silver Peak mine in the USA.
69 Hanwa Co. Ltd. is a major Japanese battery chemical trading company. Project source: Corporate Presentation June 2017
http://www.bacanoraminerals.com/cms/wp-content/uploads/2017/06/Corporate-Presentation-June-2017-08.06.17.pdf
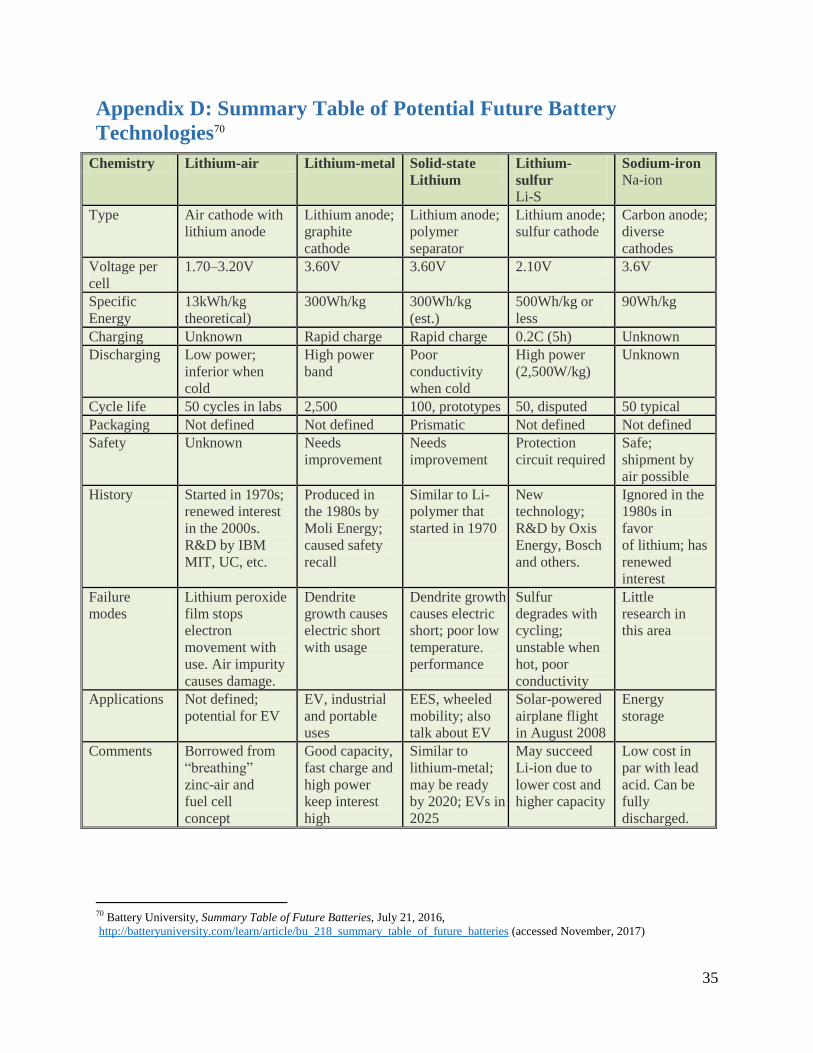
35
Appendix D: Summary Table of Potential Future Battery
Technologies70 Chemistry Lithium-air Lithium-metal Solid-state
Lithium
Lithium-
sulfur
Li-S
Sodium-iron
Na-ion
Type Air cathode with
lithium anode
Lithium anode;
graphite
cathode
Lithium anode;
polymer
separator
Lithium anode;
sulfur cathode
Carbon anode;
diverse
cathodes
Voltage per
cell
1.70–3.20V 3.60V 3.60V 2.10V 3.6V
Specific
Energy
13kWh/kg
theoretical)
300Wh/kg 300Wh/kg
(est.)
500Wh/kg or
less
90Wh/kg
Charging Unknown Rapid charge Rapid charge 0.2C (5h) Unknown
Discharging Low power;
inferior when
cold
High power
band
Poor
conductivity
when cold
High power
(2,500W/kg)
Unknown
Cycle life 50 cycles in labs 2,500 100, prototypes 50, disputed 50 typical
Packaging Not defined Not defined Prismatic Not defined Not defined
Safety Unknown Needs
improvement
Needs
improvement
Protection
circuit required
Safe;
shipment by
air possible
History Started in 1970s;
renewed interest
in the 2000s.
R&D by IBM
MIT, UC, etc.
Produced in
the 1980s by
Moli Energy;
caused safety
recall
Similar to Li-
polymer that
started in 1970
New
technology;
R&D by Oxis
Energy, Bosch
and others.
Ignored in the
1980s in
favor
of lithium; has
renewed
interest
Failure
modes
Lithium peroxide
film stops
electron
movement with
use. Air impurity
causes damage.
Dendrite
growth causes
electric short
with usage
Dendrite growth
causes electric
short; poor low
temperature.
performance
Sulfur
degrades with
cycling;
unstable when
hot, poor
conductivity
Little
research in
this area
Applications Not defined;
potential for EV
EV, industrial
and portable
uses
EES, wheeled
mobility; also
talk about EV
Solar-powered
airplane flight
in August 2008
Energy
storage
Comments Borrowed from
“breathing”
zinc-air and
fuel cell
concept
Good capacity,
fast charge and
high power
keep interest
high
Similar to
lithium-metal;
may be ready
by 2020; EVs in
2025
May succeed
Li-ion due to
lower cost and
higher capacity
Low cost in
par with lead
acid. Can be
fully
discharged.
70 Battery University, Summary Table of Future Batteries, July 21, 2016,
http://batteryuniversity.com/learn/article/bu_218_summary_table_of_future_batteries (accessed November, 2017)
1
The Columbia Center on Sustainable Investment (CCSI), a joint center of Columbia Law
School and the Earth Institute, Columbia University, is the only university-based applied
research center and forum dedicated to the study, practice and discussion of sustainable
international investment. Our mission is to develop practical approaches for governments,
investors, communities, and other stakeholders to maximize the benefits of international
investment for sustainable development, by integrating legal, economic, and policy
expertise. We approach sustainable investment holistically, bridging investment law, natural
resource management, human rights, economics, political economy, and environmental
management. We conduct rigorous research, provide policy analysis and advisory services,
offer educational programs, develop tools and resources, and foster multi-stakeholder
dialogue and knowledge sharing among policymakers, development advocates, scholars,
business leaders, and community stakeholders. We work to strengthen the sustainable
development potential of international investment, and to ensure that international
investment is mutually beneficial for investors and the citizens of the recipient countries.
http://ccsi.columbia.edu