Embed Size (px)
Citation preview
1
RESOURCING THE AICHI BIODIVERSITY
TARGETS: A FIRST ASSESSMENT OF THE RESOURCES
REQUIRED FOR IMPLEMENTING THE STRATEGIC PLAN FOR BIODIVERSITY 2011-2020
REPORT OF THE HIGH-LEVEL PANEL ON GLOBAL ASSESSMENT OF RESOURCES FOR IMPLEMENTING THE
STRATEGIC PLAN FOR BIODIVERSITY 2011-2020
2
TABLE OF CONTENTS
PANEL MEMBERS AND OBSERVERS ........................................................................................... 3
KEY MESSAGES ................................................................................................................................. 5
EXECUTIVE SUMMARY .................................................................................................................. 6
I. INTRODUCTION ................................................................................................................... 17
1.1 Context – the Strategic Plan for Biodiversity 2011-2020 and the Aichi Biodiversity Targets 17
1.2 The mandate of the High-Level Panel .................................................................................. 18
1.3 The GEF 6 funding needs assessment ................................................................................... 19
1.4 The CBD resource mobilisation strategy .............................................................................. 20
1.5 Relationship to other processes ............................................................................................. 20
II. ORGANISATION OF WORK .............................................................................................. 22
2.1 Working arrangements of the High-Level Panel .................................................................. 22
2.2 Underpinning research .......................................................................................................... 22
2.3 Gaps ...................................................................................................................................... 23
III. ESSENTIAL CONTEXT ....................................................................................................... 24
3.1 The enabling framework ....................................................................................................... 24
3.2 Interactions and overlaps ...................................................................................................... 24
3.3 Assessment of baseline ......................................................................................................... 25
3.4 Interpreting cost assessments ................................................................................................ 26
IV. METHODOLOGY ................................................................................................................. 27
4.1 General approach .................................................................................................................. 27
4.2 Methodological Issues........................................................................................................... 28
4.3 Top-down vs bottom-up assessments ................................................................................... 28
V. GLOBAL ASSESSMENT OF INVESTMENT AND ONGOING EXPENDITURE NEEDS OF ACHIEVING THE AICHI BIODIVERSITY TARGETS ......................................... 31
5.1 Synthesis of the resource needs assessment .......................................................................... 31
5.2 Variations in the resource needs assessments ....................................................................... 36
5.3 Potential Sources of Finance ................................................................................................. 37
5.4 Benefits of meeting the Aichi Biodiversity Targets .............................................................. 44
VI. CONCLUSIONS AND NEXT STEPS .................................................................................. 50
VII. TARGET SUMMARIES ........................................................................................................ 52
VIII. REFERENCES ........................................................................................................................ 83
3
PANEL MEMBERS AND OBSERVERS
MEMBERS OF THE HIGH-LEVEL PANEL ON GLOBAL ASSESSMENT OF RESOURCES FOR IMPLEMENTING THE STRATEGIC PLAN FOR BIODIVERSITY 2011-2020
Mr Pavan Sukhdev (Chair) Chief Executive Officer, GIST Advisory and UNEP Goodwill
Ambassador Professor Georgina Mace Professor, Conservation Science, Imperial College London, United
Kingdom Sr Carlos Manuel Rodriguez Vice President, Center for Conservation and Governments,
Conservation International, Costa Rica Dr Ussif Rashid Sumaila Director and Professor, Fisheries Centre, Fisheries Economic Research
Unit (FERU), University of British Columbia, Canada Dr Kevin Urama Executive Director, African Technology Policy Studies Network, Kenya
Professor Sir Robert Watson Strategic Director of the Tyndall Centre, University of East Anglia and former Chief Scientific Adviser, Department for Environment, Food and Rural Affairs (Defra), United Kingdom
Dr Abdul Hamid Zakri Science Adviser to the Prime Minister, Malaysia
Professor Liucai Zhu Foreign Economic Co-operation Office, Ministry of Environmental Protection, China
OBSERVERS OF THE HIGH-LEVEL PANEL ON GLOBAL ASSESSMENT OF
RESOURCES FOR IMPLEMENTING THE STRATEGIC PLAN FOR BIODIVERSITY 2011-2020
Dr Gustavo A. B. da Fonseca Head of Natural Resources, Secretariat of the Global Environment Facility (GEF)
Dr Valerie Hickey Environment Department, World Bank
Dr Gilles Kleitz Project Manager Biodiversity - Natural Resources, Agence Française de Développement, France
Mr Günter Mitlacher Director, International Biodiversity Policy, WWF Germany and Regional Focal Point of GEF NGO Network
Ms Maria Schultz Director, Resilience and Development Programme, Stockholm Resilience Center, Sweden
Mr Nik Sekhran Head/ Principal Technical Adviser - Ecosystems and Biodiversity, United Nations Development Programme (UNDP)
Mr Mark Zimsky Senior Biodiversity Specialist, Secretariat of the Global Environment Facility (GEF)
GOVERNMENT OF THE UNITED KINGDOM (UK) AND THE GOVERNMENT OF INDIA United Kingdom
Mr Jeremy Eppel, Mr James Vause and Ms Sarah Nelson (Department for Environment, Food and Rural Affairs [Defra])
India Mr M.F. Farooqui (Ministry of Environment and Forests)
4
REPORT CONTRIBUTORS
The development of this report has been supported by a synthesis team comprising Sarah Smith, Melissa Jaques and Jerry Harrison (UNEP World Conservation Monitoring Centre) and Matt Rayment and Mavourneen Conway (ICF GHK), with Ravi Sharma, David Cooper, Markus Lehman and Kieran Noonan-Mooney (Secretariat of the Convention on Biological Diversity) to assist the work of the High-Level Panel.
It brings together the findings of studies examining the resources required to deliver different clusters of Aichi Biodiversity Targets. The cluster leads and contributors are as follows:
Cluster Lead/Contributor
Awareness Raising (Target 1) Mavourneen Conway (ICF GHK)
Macroeconomics (Targets 2,3,4) Matt Rayment (ICF GHK)
Forestry (Targets 5,7,11,15) Patrick Hardcastle (Forestry Development Specialist) and Niklas Hagelberg (United Nations Environment Programme)
Water, pollution and ecosystem services (Targets 5,8,14)
John Talberth and Erin Gray (Centre for Sustainable Economy)
Marine (Targets 6,7,10 and 11) Simon Harding (Independent Consultant; Marine Cluster Lead and Target 10 – Coral Reefs), Marjo Vierros (United Nations University; Target 7 – Aquaculture), William Cheung (University of British Columbia; Target 6 – Fisheries) and Ian Craigie (James Cook University; Target 11 – MPAs) and Pippa Gravestock (Independent Consultant; Target 11 – MPAs)
Agriculture (Target 7) Dominic Moran, Charlotte Leggett and Salman Hussain (Scottish Agricultural College)
Invasive Alien Species (Target 9)
Jane Turpie and Clova Jurk (Anchor Environmental Consultants), Brad Keitt and Nick Holmes (Island Conservation)
Protected Areas (Target 11) Jamison Ervin (United Nations Development Programme) and Sarat Gidda (CBD Secretariat)
Protected Areas and Species (Targets 11,12)
Donal McCarthy (BirdLife International & RSPB); Stuart Butchart, Andy Symes, Leon Bennun; Lincoln Fishpool (BirdLife International); Graeme Buchanan, Paul Donald, Paul Morling (RSPB); Andrew Balmford, Jonathan Green (University of Cambridge); Neil Burgess (University of Cambridge/University of Copenhagen/WWF); Martin Schaefer (University of Freiburg, Germany); Jörn Scharlemann (UNEP-World Conservation Monitoring Centre); Stephen Garnett (Charles Darwin University, Australia); David Wiedenfeld; Richard Maloney (Department of Conservation, New Zealand); David Leonard (US Fish and Wildlife Service)
Genetic Diversity (Target 13) Elta Smith (ICF GHK)
Enabling Actions (Targets 16-20)
Ravi Sharma, Markus Lehmann, Valerie Normand, John Scott, David Duthie, Edjigayehu Seyoum-Edjigu, Beatriz Gomez and David Cooper (CBD Secretariat)
5
KEY MESSAGES
x Implementation and delivery of the Aichi Biodiversity Targets requires the development of an appropriate and coherent political and institutional framework, and strong political will, particularly at national and regional levels.
x Investment in ‘natural capital’ will deliver significant co-benefits for sustainable development. Expenditure to meet the Aichi Biodiversity Targets should be recognised as part of wider investment needs for promoting sustainable development.
x Existing evidence suggests that benefits are likely to significantly outweigh costs. Without immediate action, the social and economic costs of biodiversity loss and the loss of ecosystem services will be felt at an accelerating rate in the future and will limit growth and stability. Investments made now will reduce resource requirements in the future.
x There are clear differences in the relative scale of investment required to deliver the various Targets. In addition, the investment needed to deliver a Target is not necessarily correlated to its importance. Some Targets which require relatively little investment are actually crucial in helping to deliver other Targets. Some may seem less resource-intensive, but could be more difficult to achieve, particularly if they require changes in institutions, policies, priorities, attitudes and behaviour. The scales of investment can be broadly summarised as:
o Significant investment required: For those Targets specifically aimed at addressing the drivers of biodiversity loss and ecosystem restoration, the required total global investment over the period 2013 to 2020 is in the order of several hundreds of billions of (US) dollars. Targets in this group fall under Strategic Goals B and D (excluding Target 16).
o Moderate investment required: Targets associated with required conservation work will require total global investment over the period 2013 to 2020 in the order of hundreds of billions of (US) dollars for Target 11 (i.e. establishing and maintaining protected areas) and in the order of tens of billions of (US) dollars for the other Targets of Strategic Goal C.
o Low investment required: Targets related to improving and creating necessary enabling conditions are likely to be much less resource-intensive. For these Targets, the total global investment needs over the period 2013 to 2020 will more likely be in the order of billions of (US) dollars. These Targets mostly relate to Strategic Goals A and E, as well as Target 16.
x Many factors affect the magnitude of the estimates of the total investment and ongoing expenditure needed to achieve each of the Targets. These include the scope of the actions and activities identified for each Target and the potential synergies among Targets as well as uncertainties arising from limitations in data and methodologies.
x There are many inter-linkages and co-dependencies to consider, both between the Targets themselves, and between the Targets and other national policy goals. The investment needs of one Target will often be influenced by the approach, resourcing and effectiveness of the delivery of others. Understanding these inter-linkages and co-dependencies across Targets and between Targets and policy goals for poverty alleviation, human health, agriculture, freshwater, desertification, fisheries, etc, is important in order to prioritise action and should be considered a crucial area for further work.
x Funding from a diverse range of international and national sources, and across different policy areas, is required to secure the full range of economic and social benefits to be gained from meeting the Aichi Biodiversity Targets. Sources of financing will include a wide range of public funding and development of innovative measures and conservation incentives such as payments for ecosystem services (PES), conservation agreements, water fees, forest carbon offsets, and green fiscal policies, as well as private sector investment.
x Further research and analysis is vital to help further develop and refine these estimates.
6
EXECUTIVE SUMMARY Introduction to the High-Level Panel and the resource assessment 1. The report has been prepared by the High-Level Panel on Global Assessment of Resources for implementing the Strategic Plan for Biodiversity 2011-2020 in order to inform discussions at the eleventh Conference of the Parties (COP 11) to the Convention on Biological Diversity (CBD) on resources required to achieve the Strategic Plan for Biodiversity 2011-2020 and to achieve the Aichi Biodiversity Targets. The Executive Summary of this report is provided as an addendum to document UNEP/CBD/COP/11/14. The full report of the Panel is available as information document UNEP/CBD/COP/11/INF/20. 2. The High-Level Panel, co-sponsored by the governments of the United Kingdom (UK) and India, was established to contribute to the understanding of the global resources required for the Strategic Plan for Biodiversity 2011-2020 and to achieve the Aichi Biodiversity Targets. The establishment of the Panel was welcomed by the fourth meeting of the Ad Hoc Open-Ended Working Group on Review and Implementation of the Convention (WGRI 4) under recommendation 4/2; at this meeting the Panel was invited to report to COP 11 on its findings. 3. The report by the Panel provides a first assessment of the costs of meeting the Aichi Biodiversity Targets by 2020, drawn from underpinning research conducted by experts working on specific Targets or thematic ‘cluster’ groups of Targets. The assessment is a presentation of the range of actions and activities that would make a significant difference in the delivery of the Aichi Biodiversity Targets, and the range of estimates for their associated resource needs. The variety of actions and activities chosen for the assessment of resource needs required vary significantly across each Target or cluster of Targets, and this variance is thus reflected in the estimates. 4. To some extent the report also identifies and explores possible sources of financing, such as fiscal policy instruments, mainstreaming of biodiversity, reform of perverse subsidies, positive incentives, role of the private sector, and so forth. It aims to build on and complement other work to study the potential costs of achieving the various Targets, including the assessment on the funding needs for the sixth replenishment of the Global Environment Facility (GEF). 5. The work of the Panel is designed to contribute to the ongoing discussions on biodiversity financing that have been a focus for the CBD for some time, particularly since the adoption of the strategy for resource mobilisation in support of the achievement of the Convention’s objectives at the ninth Conference of the Parties (COP 9) to the CBD in 2008 (decision IX/11). The strategy set in train further discussions for the development of targets and indicators for resource mobilisation as well as other requirements for activities and initiatives to implement the strategy. As such, COP 11 is expected to adopt, inter alia, targets to mobilize financial resources from all known sources within the ambit of biodiversity financing, as well as resolve to identify sources allocated to adjacent policy areas such as freshwater management, combating desertification, improving agricultural resilience, etc which, although not their primary goal, will help achieve the Aichi Biodiversity Targets and support implementation of the Strategic Plan for Biodiversity 2011-2020. 6. Despite the range of work available on the current level of finance available for biodiversity conservation and on the costs of overall loss of biodiversity and ecosystem services, there have not been detailed estimates and assessments prepared in recent years on the global costs of, and resources required for, biodiversity conservation and sustainable use, and the fair and equitable sharing of benefits arising from the use of genetic resources. While it is well understood that mobilisation of resources (financial, human, institutional and technical) will be required to successfully reach the Targets, to date the amount of resources required to achieve the Targets, in terms of financial needs and transformational efforts, has been unknown. Against this background, the Panel’s work is intended to provide a first assessment that could help inform discussions at COP 11 on resource requirements to meet the Aichi Biodiversity Targets.
7
7. The objective of the Panel was therefore: i) at the global level, to provide as robust an assessment as possible of the resources
needed to achieve the twenty Aichi Biodiversity Targets recognizing that a comprehensive assessment may not be possible in the timeframe prior to COP 11, but a credible assessment of current knowledge would still be valuable;
ii) to present the cost estimates derived in the context of knowledge about the benefits of biodiversity and current funding streams to help frame and stimulate discussion around meeting these resource needs; and
iii) to provide suggestions for future work which would help Parties better understand how they can finance the Strategic Plan for Biodiversity 2011-2020.
8. In developing this independent report, the Panel met formally in person on one occasion and by teleconference on five occasions. In addition, Panel members were engaged on an ongoing basis in discussions with teams conducting the underpinning research. The report draws significantly on the underpinning research and estimated costs provided by independent experts in their reports on each Target or clusters of Targets. 9. It is recognised that activities currently underway or that will be undertaken in the future in pursuit of the Targets will differ by country depending on their national priorities and circumstances, as will the costs of these activities. As far as possible, the assessment sought to understand differences in the types of activities and levels of resource needs in different parts of the world; however, because the approach for most Targets has been relatively broad rather than highly detailed, some caution is needed in interpreting the results. There are gaps and limitations in the data, understanding and methodologies underpinning this assessment and thus it should not be taken as a precise and comprehensive assessment. The assessment was also conducted within a limited timeframe and with limited resources available. 10. It will be helpful in future to compare and contrast these global estimates with country-by-country analyses (“bottom-up approach”) such as those proposed by the United Nations Development Programme (UNDP) and the CBD Secretariat. For this report however, assessing the resources required to meet the Targets in all countries using such a detailed bottom-up approach was impractical given the time and resources available. Relationship to existing work - particularly GEF 6 needs assessment 11. The work of the Panel has aimed to reflect on and take into account existing processes and assessments that are underway or have taken place, such as the recent assessment of the amount of funds needed to support the implementation of commitments under the CBD for the sixth replenishment period of the Global Environment Facility (GEF 6) which was called for under decision X/26 at the tenth meeting of the Conference of the Parties (COP 10) to the CBD in 2010. 12. The estimates of funding needs prior to taking into account GEF’s incremental reasoning and any co-financing in the GEF 6 assessment are less than those proposed by the High-Level Panel for a number of reasons. Firstly, the GEF 6 needs assessment was carried out to identify funding necessary and available for the implementation of the Convention over a four year period (July 2014 to June 2018), whereas the Panel report covers the period 2013 to 2020. Secondly, the GEF needs assessment figures focus on the estimated funding needs in 155 GEF-eligible countries only (developing countries), whereas the report of the High-Level Panel estimates resource needs for both developed and developing countries. Thirdly, the GEF needs assessment covers only activities which would be eligible for GEF funding whereas the work of the Panel has not restricted the types of activities used in the assessment. The GEF 6 needs assessment is therefore not a full global assessment, hence the magnitude of the figures presented in the GEF 6 needs assessment are lower than what has been presented by the Panel. Due to their differences in purpose, the two assessments have been undertaken using some differences in assumptions, methodologies and approaches. However the starting point of estimating costs for activities to implement the Aichi Biodiversity Targets is similar.
8
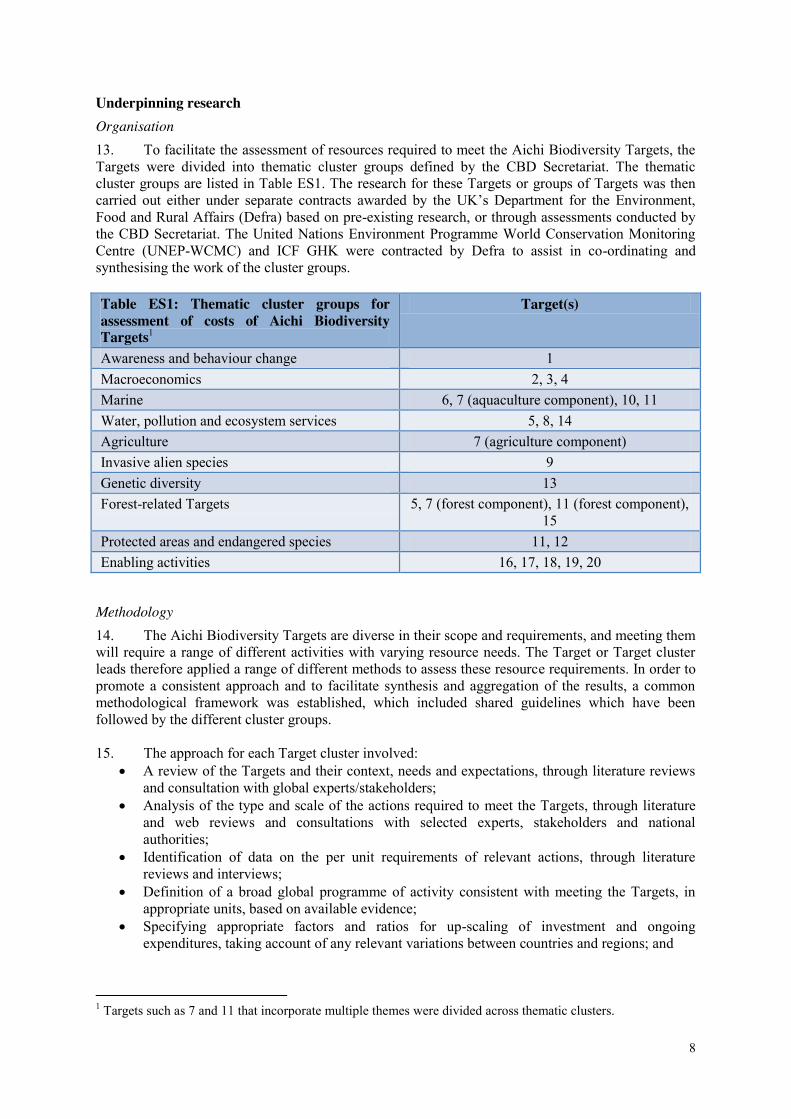
Underpinning research Organisation 13. To facilitate the assessment of resources required to meet the Aichi Biodiversity Targets, the Targets were divided into thematic cluster groups defined by the CBD Secretariat. The thematic cluster groups are listed in Table ES1. The research for these Targets or groups of Targets was then carried out either under separate contracts awarded by the UK’s Department for the Environment, Food and Rural Affairs (Defra) based on pre-existing research, or through assessments conducted by the CBD Secretariat. The United Nations Environment Programme World Conservation Monitoring Centre (UNEP-WCMC) and ICF GHK were contracted by Defra to assist in co-ordinating and synthesising the work of the cluster groups. Table ES1: Thematic cluster groups for assessment of costs of Aichi Biodiversity Targets1
Target(s)
Awareness and behaviour change 1 Macroeconomics 2, 3, 4 Marine 6, 7 (aquaculture component), 10, 11 Water, pollution and ecosystem services 5, 8, 14 Agriculture 7 (agriculture component) Invasive alien species 9 Genetic diversity 13 Forest-related Targets 5, 7 (forest component), 11 (forest component),
15 Protected areas and endangered species 11, 12 Enabling activities 16, 17, 18, 19, 20
Methodology 14. The Aichi Biodiversity Targets are diverse in their scope and requirements, and meeting them will require a range of different activities with varying resource needs. The Target or Target cluster leads therefore applied a range of different methods to assess these resource requirements. In order to promote a consistent approach and to facilitate synthesis and aggregation of the results, a common methodological framework was established, which included shared guidelines which have been followed by the different cluster groups.
15. The approach for each Target cluster involved:
x A review of the Targets and their context, needs and expectations, through literature reviews and consultation with global experts/stakeholders;
x Analysis of the type and scale of the actions required to meet the Targets, through literature and web reviews and consultations with selected experts, stakeholders and national authorities;
x Identification of data on the per unit requirements of relevant actions, through literature reviews and interviews;
x Definition of a broad global programme of activity consistent with meeting the Targets, in appropriate units, based on available evidence;
x Specifying appropriate factors and ratios for up-scaling of investment and ongoing expenditures, taking account of any relevant variations between countries and regions; and
1 Targets such as 7 and 11 that incorporate multiple themes were divided across thematic clusters.
9
x Assessment of the investment and ongoing expenditure required to meet the Targets, specifying two scenarios (with lower and higher resource requirements), assessing resource savings and additional requirements as far as possible, and distinguishing between one-off investments and recurrent expenditures.
16. While clusters used a common methodological framework, the variety of actions and activities chosen for the assessment of resources required to meet each Target vary significantly. For some Targets (e.g. the “macroeconomic” Targets 2-4) common actions that could be undertaken by all countries were identified and the average resource requirements for each country were estimated to reach the final figures. The analysis for other Targets was based on alternative means of assessment and aggregation. For example, the approach to Target 12 (threatened species) involved detailed assessment of the resources required to conserve a substantial sample of bird species, then using data on the relationship between costs for birds and those for other taxa, the costs were extrapolated to cover all known threatened species. Table ES3 presents an overview of actions and activities included in the assessments.
17. Section VII of this report provides a summary of the approach taken for each of the Targets.
Variations in the resource needs assessments 18. The figures represent preliminary estimates and need to be interpreted with some caution. As far as possible, the assessments were conducted using a common approach, based on the standard methodological framework outlined above. However, there are inevitable variations between the assessments, as different Targets require different approaches. These include differences in analytical approaches; types of activities; units of assessment; and definitions of scenarios. Strengths and limitations/weaknesses 19. The time and resources available for the assessment, as well as gaps in available data, presented significant challenges. It was recognised at the outset that the assessment was unlikely to provide a comprehensive or precise assessment of the investment and ongoing expenditure required to meet the Targets. Instead, a pragmatic approach was adopted, in order to provide a plausible first assessment of the likely magnitude involved, which will provide a basis for discussion and can be refined through later analysis. The estimates should be regarded only as a first order assessment of the possible resource requirements in meeting the Aichi Biodiversity Targets. While every effort has been made to develop and apply a credible and consistent analytical approach given the time and resources available for the assessment, the robustness of the resource estimates is influenced by a range of factors. These are examined further in key message 5 and include:
x The interpretation of the Targets and the assumed level of ambition in the actions identified to meet them;
x The inclusion and treatment of actions that go beyond core biodiversity conservation activities and deliver wider benefits;
x The static and segmented nature of the analysis – which has attempted to estimate the resources required for each Target separately, and has not been able to take full account of interdependencies and sequencing of delivery;
x Limitations in the available data and methodologies - especially given the limited time and resources available for the assessment.
20. For these reasons the figures should be regarded as a broad approximation of the resources required, rather than precise estimates, but should nevertheless present a basis for progressing discussion on resource mobilisation.
10
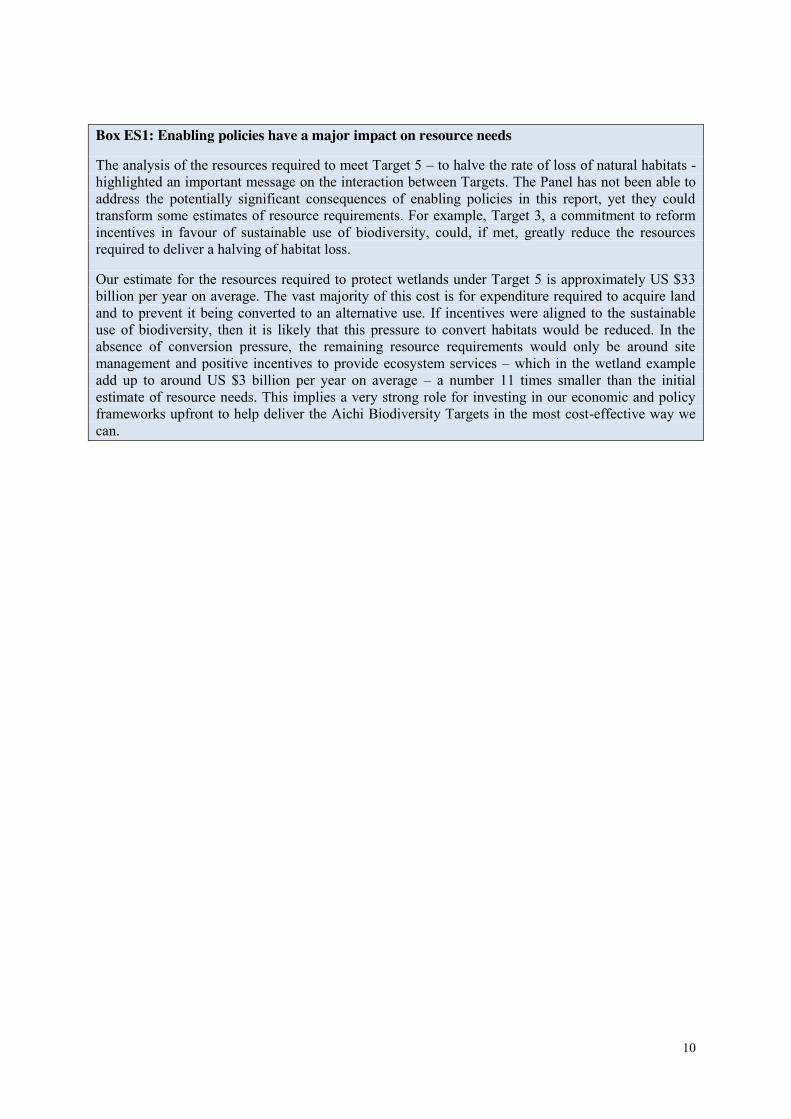
Box ES1: Enabling policies have a major impact on resource needs
The analysis of the resources required to meet Target 5 – to halve the rate of loss of natural habitats - highlighted an important message on the interaction between Targets. The Panel has not been able to address the potentially significant consequences of enabling policies in this report, yet they could transform some estimates of resource requirements. For example, Target 3, a commitment to reform incentives in favour of sustainable use of biodiversity, could, if met, greatly reduce the resources required to deliver a halving of habitat loss.
Our estimate for the resources required to protect wetlands under Target 5 is approximately US $33 billion per year on average. The vast majority of this cost is for expenditure required to acquire land and to prevent it being converted to an alternative use. If incentives were aligned to the sustainable use of biodiversity, then it is likely that this pressure to convert habitats would be reduced. In the absence of conversion pressure, the remaining resource requirements would only be around site management and positive incentives to provide ecosystem services – which in the wetland example add up to around US $3 billion per year on average – a number 11 times smaller than the initial estimate of resource needs. This implies a very strong role for investing in our economic and policy frameworks upfront to help deliver the Aichi Biodiversity Targets in the most cost-effective way we can.

11
KEY FINDINGS
The work of the Panel resulted in the following key messages and findings.
Enabling framework Key Message 1: Implementation and delivery of the Targets requires the development of an appropriate and coherent political and institutional framework and strong political will, particularly at the national and regional level. 21. Careful planning and an enabling framework are prerequisites for effective and successful action as well as for securing the resources required to meet the Aichi Biodiversity Targets. Most of the Targets cannot be delivered instantaneously but will require a continuous and coherent process in which early and well planned commitments will reduce overall costs and difficulties. Many of the Aichi Biodiversity Targets cannot be met without the right institutional structures, capacity and governance in place - irrespective of the availability of resources. Therefore, in assessing resource needs it must be stressed that resource mobilisation should be accompanied by the development of appropriate capacity (including institutional and infrastructural arrangements) supported by political coherence across governments and national institutions.
Benefits of investment Key Message 2: Investment in natural capital will deliver significant co-benefits for sustainable development. 22. For example, restoration of ecosystems such as mangroves, wetlands and reefs can deliver significant livelihood benefits to local communities and improve resilience and adaptation to climate change. At a global scale, reforestation and restoration are a cost-effective form of climate change mitigation and adaptation. Restored forest ecosystems will add to the productivity of sustainable agriculture and improve supplies of freshwater by facilitating nutrient and freshwater cycling and by preventing soil erosion. Sustainability of ocean fisheries will be enhanced by increases in Marine Protected Areas. It is thus important that Aichi Biodiversity Target expenditures are recognised as part of such wider investment needs for promoting sustainable development.
23. Part of the underlying rationale for the Strategic Plan for Biodiversity and the Aichi Biodiversity Targets is that “Biological diversity underpins ecosystem functioning and the provision of ecosystem services essential for human well-being. It provides for food security, human health, the provision of clean air and water; it contributes to local livelihoods, and economic development, and is essential for the achievement of the Millennium Development Goals, including poverty reduction.”
24. While focusing on the resources required to meet the Aichi Biodiversity Targets, the individual cluster assessments highlight the significant range of benefits to people and the economy that will be delivered by achieving the Targets.
Key Message 3: Existing evidence suggests that benefits are likely to significantly outweigh costs. 25. Although it is clear that significant national and international investments will be required to meet the Targets, evidence from other studies indicates that the scale of the benefits that would be provided to the economy and society at local, regional and national levels are likely to be significantly greater, and should outweigh these resource requirements. Furthermore, without immediate action, the social and economic costs of biodiversity loss and the loss of ecosystem services will be felt at an accelerating rate in the future and will limit growth and stability. Investments made now will reduce resource requirements in the future.

12
Estimated resources required to meet the Aichi Biodiversity Targets 26. Table ES2 presents first estimates of the financial resources required to deliver the Aichi Biodiversity Targets. These figures provide a first assessment of the total resources required to deliver each of the Targets. They are inclusive of current levels of resources being allocated to the relevant activities. For most of the Targets, it was not possible to estimate current (baseline) levels of investment or annual expenditures on the relevant actions. Therefore, additional resource requirements are not known in most cases. However, the evidence for most Targets suggests that that there is a substantial gap between the resources required and those currently being allocated. Understanding additional resource needs is an area that requires further research and analysis.
Key Message 4: There are clear differences in the relative scale of investment required to deliver the various Targets. In addition, the investment needed to deliver a Target is not necessarily correlated to its importance. 27. Some Targets which require relatively little investment are actually crucial in helping to deliver other Targets. Some may seem less resource-intensive, but could be more difficult to achieve, particularly if they require changes in institutions, policies, priorities, attitudes and behaviour. The scales of investment can be broadly summarised as:
x Significant investment required: For those Targets specifically aimed at addressing the drivers of biodiversity loss and ecosystem restoration, the required total global investment over the period 2013 to 2020 is in the order of several hundreds of billions of (US) dollars. Targets in this group fall under Strategic Goals B and D (excluding Target 16).
x Moderate investment required: Targets associated with required conservation work will require total global investment over the period 2013 to 2020 in the order of hundreds of billions of (US) dollars for Target 11 (i.e. establishing and maintaining protected areas) and in the order of tens of billions of (US) dollars, for the other Targets under Strategic Goal C.
x Low investment required: Targets related to improving and creating necessary enabling conditions are likely to be much less resource-intensive. For these Targets, the total global investment needs over the period 2013 to 2020 will more likely be in the order of billions of (US) dollars. These Targets mostly relate to Strategic Goals A and E, as well as Target 16.
28. The results suggest that upfront investment needs tend to be greater than the resources required to fund ongoing activities. It is estimated that one-off investments account for between 60% and 70% of the overall global resource needs for delivering the Targets over the 2013 to 2020 period. 29. Through simple addition of the resource requirements identified for each Target, the costs for implementing the twenty Aichi Biodiversity Targets are estimated at between US$ 150 billion and US$ 440 billion per year. However, these figures need to be treated with caution especially as the Panel is very clear that these resource requirements neither should nor could be met by biodiversity finance alone. Additionally, as discussed under key message 6 below, there is potential for considerable synergies among the Targets. Thus, it is expected that co-ordinated action could substantially reduce the total estimate. 30. Some Targets require relatively little investment but are actually crucial in helping to deliver other (often more expensive) Targets, especially where they aim to create the right enabling conditions. However, while these Targets tend to be less resource-intensive, they are usually difficult to achieve as they often require changes in institutions, policies, priorities, attitudes and behaviour. Examples of key Targets which play a key enabling and facilitating role, but themselves require relatively few resources, include Targets 1 (awareness raising), Targets 2-4 relating to macroeconomic conditions, and Targets 16-20 relating to enabling actions.
13
Key Message 5: Many factors affect the magnitude of the estimates of the investments needed to achieve each of the Targets. These include the scope of the activities to be costed and associated investment opportunities and the potential synergies among Targets as well as uncertainties arising from limitations in data and methodologies. 31. While every effort has been made to develop and apply a credible and consistent analytical approach given the time and resources available for the assessment, the robustness of the resource estimates is influenced by a range of factors, which include:
x The interpretation of the Targets and the assumed level of ambition in the actions identified to meet them. It has been necessary to interpret the Targets by specifying measurable activities that could be implemented to meet them. Only a few Targets are expressed in clearly quantifiable terms, thus there is a need to infer the level of ambition. Moreover, given that the Targets provide a flexible framework that is to be applied nationally, various levels of ambition would be consistent with each Target. The resources required are sensitive to the type and scale of defined activities.
x The inclusion of actions that go beyond core biodiversity conservation activities and deliver wider benefits. Some of the Targets require substantial changes in practice that are essential for biodiversity conservation but deliver much wider benefits to society as a whole (e.g. sustainable agriculture, fisheries and pollution control). The resources required are large and the way they are accounted for greatly affects the estimates produced.
x The static nature of the analysis. The assessment has attempted to estimate the resources required for each Target separately, while having regard for the potential synergies and overlaps between Targets and seeking to avoid double counting. In practice, the actions taken in pursuit of some Targets will influence the type, extent and cost of action required for others, as will the timing and sequencing of these different actions.
x Constraints resulting from limitations in the available data and methodologies. Limited time and resources were available for the assessment.
32. Because of these factors, a range of valid and credible estimates could be derived for each Target. This variation results from the broad scope of some of the Targets and debate about the type and scale of actions required. Through further work to “unpack” this variation in a systematic way across the Targets, sets of estimates for each Target could be derived. This would allow some of the variation to be explained, reducing the residual error and allowing more robust comparisons among the Targets. 33. Additional uncertainties arise from gaps in data and scientific understanding, wide ranges of unit costs, and difficulties in accounting for differences in costs between different regions and situations. Thus there is a variable amount of uncertainty attached to each one. 34. One of the factors that have a large bearing on the estimates is the treatment of opportunity costs. For example, for Targets that involve land-use change (e.g. 5 and 11) there will be costs related to the foregone benefits of alternative land-use, and for Targets that require substitution of production technologies (e.g. 7 and 8), there will be costs related to the incremental costs of technologies. The size of these opportunity costs and/or whether they are born by the public or private actors will depend on the planning and legislative framework in the place and the extent that relevant laws are enforced in practice.
Interlinkages between Targets and integration into policy goals Key Message 6: There are many inter-linkages and co-dependencies to consider both between the Targets themselves, and between the Targets and other national policy goals 35. The Targets are inter-related and interdependent, such that the investment needs of one will often be influenced by the approach, resourcing and effectiveness of the delivery of others. For
14
instance, ensuring the effective delivery of those Targets which help to establish the necessary frameworks and conditions (e.g. Targets under Strategic Goals A and E) should reduce the investment needed to deliver other Targets. Understanding these inter-linkages and co-dependencies is therefore important in order to prioritise action and should be considered a crucial area for further work. Other policy areas, extending well beyond biodiversity conservation will also be impacted by the delivery of the Aichi Biodiversity Targets. For example, national farming and fisheries policies have very important overlaps with the Aichi Biodiversity Targets focusing on sustainable agriculture and fisheries. Recognising synergies and overlaps across such important national policy objectives can significantly add to the overall availability of financing, and improve budgetary efficiencies and environmental governance.
36. The different Targets vary in the extent to which they focus on biodiversity and the degree to which they meet wider policy objectives. Some Targets – such as those relating to sustainable agriculture, fisheries and pollution control – require relatively high levels of resources but contribute to much wider policy objectives (economic, social and environmental). Often the Targets with a greater focus on biodiversity objectives have lower resource requirements. There are clear implications for the funding of the investments and ongoing expenditures required, since those Targets which help to deliver against multiple objectives will benefit from a wider range of funding opportunities. 37. There are some clear examples where Targets overlap and where particular actions will help to deliver more than one Target. For example, sustainable management of agricultural nutrients is a key action required to deliver both Targets 7 (sustainable agriculture) and 8 (pollution control). In compiling the estimates of resource needs we have sought to identify these overlaps and to avoid double counting as far as possible. However, there are some examples of areas of overlap that cannot be easily accounted for. For example, Protected Areas (Target 11) will play an important role in reducing rates of habitat loss (Target 5) as well as in contributing to ecosystem restoration (Targets 14 – 15), and there will be some degree of overlap between the estimated costs of achieving these Targets.
Potential funding sources Key Message 7: Funding from a diverse range of international and national sources, and across different policy areas is required to secure the full range of economic and social benefits to be gained from meeting the Aichi Targets 38. As policy areas impacted by the delivery of Aichi Biodiversity Targets extend well beyond biodiversity conservation, when enumerating funding sources, budgets and provisions beyond just conservation budgets must also be considered. For example, financing for climate change mitigation and adaptation policies, and allocations to halt the ingress of desertification are closely linked to the objectives of the forest-related Aichi Biodiversity Targets. Furthermore, sources of financing will include a wide range of public funding (core national biodiversity funding sources, financing from different parts of government and its agencies, as well as international flows of Official Development Assistance and multilateral funding) and development of innovative measures and conservation incentives such as payments for ecosystem services (PES), conservation agreements, water fees, forest carbon offsets, and green fiscal policies, as well as private- and third-sector investment. This will also require engagement with a wide range of government and non-governmental stakeholders. The private sector has a key role to play in providing resources and reducing the costs of protecting biodiversity through more informed decision-making that mainstreams sustainable management of biodiversity and ecosystems in their actions. This will in turn deliver benefits for business by securing their social licence to operate, and more importantly, securing sustainable supply chains.
15
Further research – improving the evidence base
Key Message 8: Further research is vital to help further develop and refine these estimates. 39. The estimates of resource requirements made by the High-Level Panel are preliminary and are presented with caveats. For example, it has only been possible to conduct a ‘static assessment’ of resource needs across Targets. Although overlaps have been considered as far as possible to avoid double counting, the relationships between Targets have not been explored. In addition, the work of the Panel has not included a quantitative assessment of benefits. Further research and analysis will be needed to help further develop and refine these estimates. 40. Over the coming years, further assessments of resources required to meet the Aichi Biodiversity Targets would be useful as part of an ongoing process to improve data availability and comparability of actions and activities undertaken and those required in the future to meet the Targets. Such assessments could also be useful tools to track and monitor progress in achieving the goals of the Strategic Plan for Biodiversity 2011-2020. 41. There are a number of ways further research could be undertaken to strengthen the data and estimated resource requirements for achieving the Aichi Biodiversity Targets. 42. Firstly, further research could be undertaken to further develop and refine the current estimates to:
x Address gaps in coverage of the Target clusters that were established for the underpinning research for this assessment.
x Address gaps in information and data highlighted by Target-by-Target assessments and by the aggregated assessment.
43. Secondly, given the limited time and resources available for this study, future areas of work that build on this assessment could include:
x A comprehensive global assessment involving wider stakeholder consultation and input, including information on
o baselines (i.e. current levels of expenditure on the Aichi Biodiversity Targets in order to accurately gauge what is ‘additional’ expenditure);
o prioritisation of Targets rather than a static assessment (i.e. dynamic assessment); o comprehensive analysis of the benefits of meeting the Aichi Biodiversity Targets; o potential sources of additional finance - including through other policy areas; o Country-by-country analyses (“bottom-up approach”) such as those proposed by the
United Nations Development Programme (UNDP) and the CBD Secretariat on resources required to achieve the Targets.
x An assessment of actions and costs necessary to establish the right policy framework and transformational actions required at the national and regional levels, such as:
o policy development; o environmental governance; o institutional and national planning reforms to achieve conservation and biodiversity
goals and targets; o opportunities for mainstreaming biodiversity.
x Further exploration to understand inter-linkages and co-dependencies across Targets and between Targets and policy goals for poverty alleviation, human health, agriculture, freshwater, desertification, fisheries, etc, to prioritise action.
x Support at the national level to: o identify the need for further investment and progress on country level financial needs
assessments; o support revision of National Biodiversity Strategies and Action Plans; o identify opportunities to direct resources and further support.

16
44. The Panel also recognises that a key underlying driver to biodiversity loss is climate change. While this has not been referred to specifically in this assessment, further research could be useful into the extent to which actions to support the achievement of the Aichi Biodiversity Targets can be integrated into large scale programmes and activities underway to mitigate and adapt to the effects of climate change.
17
I. INTRODUCTION
1.1 Context – the Strategic Plan for Biodiversity 2011-2020 and the Aichi Biodiversity Targets
45. The tenth meeting of the Conference of the Parties (COP 10) to the Convention on Biological Diversity (CBD) in 2010 adopted the Strategic Plan for Biodiversity 2011-2020 and the Aichi Biodiversity Targets (decision X/2). The mission of the Strategic Plan is to “take effective and urgent action to halt the loss of biodiversity in order to ensure that by 2020 ecosystems are resilient and continue to provide essential services, thereby securing the planet’s variety of life, and contributing to human well-being, and poverty eradication”. The Plan contains the Aichi Biodiversity Targets, which are twenty headline targets for 2015 or 2020 guided by five strategic goals. The Targets reflect a strong political commitment and provide an incentive for global action as well as a flexible framework to be implemented at the national and regional levels according to national circumstances and priorities. 46. For some Parties, a number of the Targets or thresholds may have already been reached, or may not be relevant due to their national circumstances. Most Parties, however, will need to set and implement corresponding targets at the national and/or regional level. Mobilisation of resources (financial, human, institutional and technical) will be required to enable Parties to successfully reach the Targets. However, the amount of resources required to achieve the Targets, in terms of financial needs and transformational efforts, is currently unknown. 47. Discussions on biodiversity financing have been ongoing in the CBD context for some time. Articles 20 and 21 of the Convention require action on financial resourcing for implementation of the Convention and associated financial mechanisms for delivery of biodiversity finance. To implement Articles 20 and 21, the Conference of the Parties adopted a strategy for resource mobilisation in support of the achievement of the Convention’s objectives at the ninth Conference of the Parties (COP 9) to the CBD in 2008 (decision IX/11). The strategy set in train further discussions on the development of targets and indicators for resource mobilisation as well as other requirements for activities and initiatives to implement the strategy. 48. As such, COP 10 decided to adopt targets for resource mobilisation at the eleventh meeting of the Conference of the Parties (COP 11) based on an assessment (decision X/3) and to conduct a specific assessment on the funding needs for the sixth replenishment of the Global Environment Facility (GEF) (decision X/26). COP 11 is therefore expected to adopt, inter alia, targets to mobilize financial resources from all sources for effectively implementing the Strategic Plan for Biodiversity 2011-2020 and to achieve the Aichi Biodiversity Targets. 49. The work of the High-Level Panel on Global Assessment of Resources for implementing the Strategic Plan for Biodiversity 2011-2020, co-sponsored by the governments of the United Kingdom (UK) and India is intended to support discussions on resource mobilisation and innovative financing in the lead up to and at COP 11. This report aims to contribute to the understanding of the global resources required for the Strategic Plan on Biodiversity 2011-2020 and to achieve the Aichi Biodiversity Targets. It identifies and explores possible actions and their costs as well as possible sources of financing, such as fiscal policy instruments, mainstreaming of biodiversity, reform of perverse subsidies, positive incentives, role of the private sector, and so forth. 50. The need for this work arises from the fact that while there is a range of work available on the current level of finance available for biodiversity conservation and on the costs of overall loss of biodiversity and ecosystem services, there have been few detailed assessments prepared in recent years on the global costs of, and resources required for, biodiversity conservation and sustainable use and the fair and equitable sharing of benefits arising from the use of genetic resources. The assessment takes into account other work to study the potential costs of achieving the various Targets, including the assessment on the funding needs for the sixth replenishment of the GEF (GEF 6) which is also underway following a decision at COP 10 (decision X/26). 51. To support the work of the Panel, the Government of the UK commissioned a project to provide an overall assessment of the investment needs and ongoing resource requirements of meeting the Targets. This
18
work was contracted to United Nations Environment Programme World Conservation Monitoring Centre (UNEP-WCMC) and ICF GHK. In order to assess the resource needs, the Targets were grouped by the CBD Secretariat into ‘clusters’. The underpinning research and assessment of the costs for each Target or clusters of Targets has been undertaken by experts from a range of organisations, with support from the CBD Secretariat, the Government of the UK, UNEP-WCMC and ICF GHK. 52. This report is an independent report from the High-Level Panel, drawing on the underpinning research and estimated resource requirements provided by experts in their reports on each Target or clusters of Targets. The assessment presented is not an ‘invoice’, but a presentation of the range of actions and activities that would make a significant difference in the delivery of the Aichi Biodiversity Targets, and their associated resource needs. The variety of actions and activities chosen for the assessment of resources required to meet each Target vary significantly. For some Targets (e.g. the “macroeconomic” Targets 2-4) common actions that could be undertaken by all countries were identified and the average resource requirements for each country were estimated to reach the final figures. The analysis for other Targets was based on alternative means of assessment and aggregation. For example, the approach to Target 12 (threatened species) involved detailed assessment of the resources required to conserve a substantial sample of bird species, then using data on the relationship between costs for birds and those for other taxa, the costs were extrapolated to cover all known threatened species. 53. It is recognised that activities currently underway or that will be undertaken in the future in pursuit of the Targets will differ by country depending on their national priorities and circumstances, as will the costs of these activities. As far as possible, the assessment sought to understand differences in the types of activities and levels of resource needs in different parts of the world. Because the approach for most Targets has been relatively broad rather than highly detailed, some caution is needed in interpreting the results. There are gaps and limitations in the data, understanding and methodologies underpinning this assessment and thus it should not be taken as a precise and comprehensive assessment. The assessment was also conducted within a limited timeframe and with limited resources available. This is discussed in more detail in the Methodology (Section IV) and the presentation of results (Section V). One page summaries of the analyses for the different Targets and the approaches they used to estimate the costs are given in Section VII. 54. It will be helpful in future to compare and contrast these global estimates with country-by-country analyses (“bottom-up approach”) such as those proposed by the United Nations Development Programme (UNDP) and the CBD Secretariat. For this report however, assessing the resources required to meet the Targets in all countries using such a detailed bottom-up approach was impractical given the time and resources available. Suggestions for further research are made in Section VI of this paper. 1.2 The mandate of the High-Level Panel
55. The establishment of the High-Level Panel on Global Assessment of Resources for Implementing the Strategic Plan for Biodiversity 2011-2020, co-sponsored by the Governments of India and the UK, was welcomed by the fourth meeting of the Ad Hoc Open-Ended Working Group on Review and Implementation of the Convention (WGRI 4) (WGRI recommendation 4/2); the meeting invited the Panel to report to COP 11 in October 2012 in Hyderabad, India. 56. The Panel is chaired by Mr. Pavan Sukhdev, following his work as Study Leader on The Economics of Ecosystems and Biodiversity (TEEB) and comprises experts with a range of scientific, technical and socio-economic expertise from various regions. The main objectives of the High-Level Panel are: i) at the global level, to provide as robust an assessment as possible of the resources needed to achieve
the twenty Aichi Biodiversity Targets in the timeframe up to COP 11 recognizing that a comprehensive assessment may not be possible, but a credible assessment of current knowledge will be valuable;
ii) to present the cost estimates derived in the context of knowledge about the benefits of biodiversity and current funding streams to help frame and stimulate discussion around meeting these resource needs; and
19
iii) to provide recommendations on future work which would help Parties better understand how they can finance the implementation of the Strategic Plan for Biodiversity 2011-2020.
1.3 The GEF 6 funding needs assessment
57. COP 10 in 2010, through decision X/26, adopted the mandate and terms of reference for a full assessment of the amount of funds required to support the implementation of commitments under the CBD for the sixth replenishment period of the Global Environment Facility (GEF 6). The preliminary report of the assessment of funding needs for GEF 6 was considered at the WGRI 4. WGRI 4 requested the expert group to further develop the report for COP 11, taking into account views of Parties, observers and organizations and the work conducted by the High-Level Panel on Global Assessment of Resources. 58. The assessment of the Expert Team estimates that, over the sixth replenishment period of the GEF total investments of between approximately US$ 74 billion and US$ 191 billion would be required to contribute to achieving the Aichi Biodiversity Targets. These amounts are developed prior to taking into account GEF’s incremental reasoning and any co-financing. These estimates are less than those proposed by the High-Level Panel for a number of reasons, largely because they focus on the estimated funding needs in GEF-eligible countries only and cover only those activities which would be eligible for GEF funding. These estimates cover only a four year period from 2014 to 2018, and absorptive capacity of GEF-eligible countries was considered when proposing three levels of ambition for funding. 59. In presenting this global assessment of the resources needed to achieve the Aichi Biodiversity Targets, the High-Level Panel has aimed to make it as coherent as possible with the GEF 6 funding needs assessment, however there are some clear differences between the two assessments in terms of their purposes and resource needs presented: i) The GEF 6 funding needs assessment is based on the needs of implementation in 155 GEF-eligible
countries, thus it is not a full global assessment; the High-Level Panel assessment covers all countries, even those that are not Party to the CBD;
ii) The GEF 6 funding needs assessment selects only activities of strategic importance from the entire possible set of activities derived from COP and GEF guidance, and does not necessarily propose that GEF contributes to all activities required for all Targets;
iii) The GEF 6 funding needs assessment is limited to the period 2014-2018, a strategically important period for achieving the Strategic Plan for Biodiversity 2011-2020 and the Aichi Biodiversity Targets, but does not cover the entire remaining 2013-2020 period of the Strategic Plan, whereas the report of the High-Level Panel does;
iv) The GEF funding needs assessment examined the readiness and absorptive capacity of eligible countries to implement the selected activities, whereas the report of the High Level Panel does not.
v) The GEF funding needs assessment only assesses costs of biodiversity action, the funding required to undertake the selected activities in the GEF 6 period. These include the expenditure inter alia on labour, materials, equipment and energy used in delivering biodiversity conservation activities. The High-Level Panel assessment also includes administrative and transaction costs, and opportunity costs where these give rise to a requirement for resources; and
vi) The basic provisions of the GEF instrument describe the GEF as a financial mechanism for the CBD, with regards to the biodiversity focal area, for the “purpose of providing new additional grant and concessional funding to meet the agreed incremental costs of measures to achieve agreed global environmental benefits in biological diversity”. As such, the entire focus of the GEF 6 needs assessment is distinct from the purpose of the High-Level Panel assessment. However the starting point of estimating costs for activities to implement the Aichi Biodiversity Targets is similar.
60. Where these differences between the two assessments justify differences in the assumptions, methodologies and approaches used and in the estimates of resource needs themselves, this has been clearly explained in the reports for the different Target clusters.
20
1.4 The CBD resource mobilisation strategy
61. The Strategy for Resource Mobilisation, adopted at COP 9, provides a framework to assist Parties in establishing national targets, goals and action for enhancing international financial flows and domestic funding for biological diversity (decision IX/11) in the context of national planning and local sustainable development policies. It is designed to mobilize adequate and predictable financial resources to support the achievement of the Convention’s three objectives. It recognises that funding for biodiversity has been insufficient to address the rate of biodiversity loss and that the lack of sufficient financial resources (at international, national or local level) continues to be one of the main obstacles to achieving the Convention’s objectives. In order to achieve the overarching goal of the Strategic Plan for Biodiversity 2011-2020 to halt the loss of biodiversity by 2020 and to meet the Aichi Biodiversity Targets, it was agreed that a significant increase in resources (financial, institutional, human and technical) will be required and that these resources will need to be mobilised from a variety of sources, including existing as well as new and innovative sources. There is therefore a need to understand the required level of investment and ongoing costs to implement and meet the Aichi Biodiversity Targets to feed into the ongoing work to implement the Strategy for Resource Mobilisation. 62. In 2010 at COP 10, Parties reiterated their support for implementation of the Strategy for Resource Mobilisation and reflected the need for mobilisation of resources under Target 20 of the Aichi Biodiversity Targets (decision X/2, annex). At this time, Parties also adopted indicators for monitoring the implementation of the Strategy for Resource Mobilisation and decided to adopt further targets for resource mobilisation aligned with these indicators at COP 11 in 2012 (decision X/3, paragraph 8). 1.5 Relationship to other processes
63. In addition to the GEF 6 needs assessment, there are a range of other processes that are relevant to the assessment of resource requirements for meeting the Aichi Biodiversity Targets. The High-Level Panel, and its underpinning research projects, has sought to engage with these and to draw on relevant approaches and information from them as far as possible. 1.5.1 CBD-related meetings on biodiversity and finance
64. Articles 20 and 21 of the Convention contain provisions on financial resources for biodiversity and mechanisms for their delivery. In order to support implementation of Articles 20 and 21 and the achievement of the Convention’s objectives more broadly, the eighth Conference of the Parties (COP 8) to the CBD in 2006 decided to undertake an in-depth review of the availability of financial resources, including through the financial mechanism and develop a draft strategy for resource mobilisation in support of the achievement of the objectives of the Convention for its ninth meeting (decision VIII/13). 65. A number of informal consultations were held on the development of the draft strategy for resource mobilisation over 2007-2008. CBD COP 9 then adopted the Strategy for Resource Mobilisation in 2008 (decision IX/11). It decided that the implementation of this strategy would be reviewed at subsequent meetings of the Conference of the Parties. 66. Decision IX/11 also invited Parties to come forward with new and innovative financing mechanisms in support of the Strategy for Resource Mobilisation. In accordance with this decision, the Secretariat organized an International Workshop on Innovative Financial Mechanisms in 2010 in collaboration with TEEB Secretariat. The workshop explored opportunities for bringing new and innovative thinking on biodiversity finance into the CBD process, assessed the status of knowledge and related use concerning innovative financial mechanisms, and developed policy options concerning innovative financial mechanisms. 67. COP 10 in 2010 reviewed implementation of the Strategy for Resource Mobilisation and requested the Executive Secretary to organize regional and sub-regional workshops to assist with the development of county-specific resource-mobilisation strategies (decision X/3). A number of regional and sub-regional workshops were held in accordance with this decision which aimed to develop effective regional action plans
21
for implementing the Strategy for Resource Mobilisation and identify innovative financial mechanisms to support implementation of the Strategic Plan for Biodiversity 2011-2020 and the Aichi Biodiversity Targets. 68. A number of meetings have taken place in 2012. A global dialogue seminar on scaling up finance for biodiversity, co-hosted by the Governments of Ecuador, Sweden, Norway and India together with Japan as the President of COP 10, was held from 6 to 9 March 2012 in Quito, Ecuador. The purpose of this meeting was to explore and contribute to understanding and seek to clarify areas of convergence and divergence regarding ways to scale up the mobilisation of financial resources to support the achievement of the Aichi Biodiversity Targets. 69. On 12 May 2012, a workshop on finance mechanisms for biodiversity was held in Montreal, Canada to foster an informal dialogue on key opportunities and challenges associated with finance mechanisms and to examine the technical and analytical issues related to their effective design and implementation. The purpose of the workshop was to support ongoing discussions under the CBD, build on the outcomes from the meeting in Quito on scaling up finance for biodiversity and to support related discussions in WGRI 4. 70. Recently, on 17-18 September 2012, an Informal Dialogue on the CBD Strategy for Resource Mobilisation was held in Geneva, Switzerland. The dialogue did not draft any recommendations nor did it engage in negotiation on targets but sought to enhance understanding among participants on the various issues related to the strategy for resource mobilisation with a view to facilitate further discussions at COP 11. The dialogue included presentations from the Panel on the findings of the Global Assessment of Resources for Implementing the Strategic Plan for Biodiversity 2011-2020, and on the GEF 6 needs assessment. A chairman’s summary of the meeting will be provided to COP 11. 1.5.2 Other ongoing assessments
71. Other ongoing assessments (though not an exhaustive list) are summarised below: 72. Conservation International - Guidance for estimating cost of achieving the Aichi Biodiversity Targets - Conservation International has developed a methodology to assist countries with the process of identifying their funding needs, by providing step-by-step guidance for estimating the costs of implementing the Aichi Biodiversity Targets at a national scale, and at different levels of detail depending on time and resources available. This will be piloted in a number of countries. The Draft Guidance for Estimating Cost of Achieving the Convention on Biological Diversity Targets for 2020 (Aichi Biodiversity Targets) will be made available on Conservation Internationals’ website. 73. UNDP-EC project on biodiversity finance - UNDP will launch a project with European Commission funding to develop new methodologies for country-based, bottom up approaches to: 1) advance biodiversity mainstreaming 2) determine finance flows and needs (looking also at use efficiency/effectiveness, role of policy environment, finance gap analyses etc. and 3) identify appropriate financing mechanisms to fill the funding gap. The methodologies will be piloted in 8 countries using synergistic opportunities through the support provided by UNDP and UNEP to governments in the development of next generation NBSAPs. 74. IUCN-biodiversity finance flows - The International Union for the Conservation of Nature (IUCN) has conducted a Swiss-funded project looking at biodiversity finance flows. The report is currently under review by the Swiss government and will be circulated shortly. 75. The Nature Conservancy (TNC) - regional needs assessment - TNC is a partner with UNDP on the regional needs assessment study on sustainable finance for the Latin American Region (LAR) and the Caribbean. Though TNC’s work on the Global Challenges (e.g. Micronesia Challenge, Coral Triangle, Caribbean Challenge), they have also complied financial needs assessment for the objectives of these Challenges, mainly focusing on Protected Areas (but also new elements around Target 11).
22
II. ORGANISATION OF WORK
2.1 Working arrangements of the High-Level Panel
76. The High-Level Panel is co-sponsored by the governments of the UK and India. Representatives from both governments, along with the CBD Secretariat, have thus been closely engaged in facilitating the work of the Panel. 77. The High-Level Panel met on 3rd August, 2012, hosted by UNEP-WCMC. In addition to this physical meeting, the Panel met by teleconference on 15th August 2012, 23rd August 2012, 7th September 2012, 14th September 2012 and 25th September 2012 and engaged on an ongoing basis in discussions with teams conducting the underpinning research. 78. Prior to its first meeting, the Panel had a one day open consultation on 2nd August 2012. This was attended by observers from the GEF; the GEF 6 needs assessment team; UNDP, UNEP and the World Bank; and was webcast to Parties and other stakeholders. Parties were invited to send comments by e-mail during and after the consultation meeting. In the interests of openness and transparency, documents from Panel meetings and documents related to the underpinning research were made available on the CBD website for information and comment. 2.2 Underpinning research
79. UNEP-WCMC and ICF GHK were contracted by the UK’s Department for the Environment, Food and Rural Affairs (Defra) to work with the High-Level Panel to provide an overall assessment of the investment and ongoing expenditures needed to meet the Aichi Biodiversity Targets and broadly, to deliver:
x A common framework, methodology and approach for an integrated assessment; x Analysis of the type and scale of actions necessary for achieving each Target; and x An initial synthesis and overall assessment of resource requirements, and proposals for next steps.
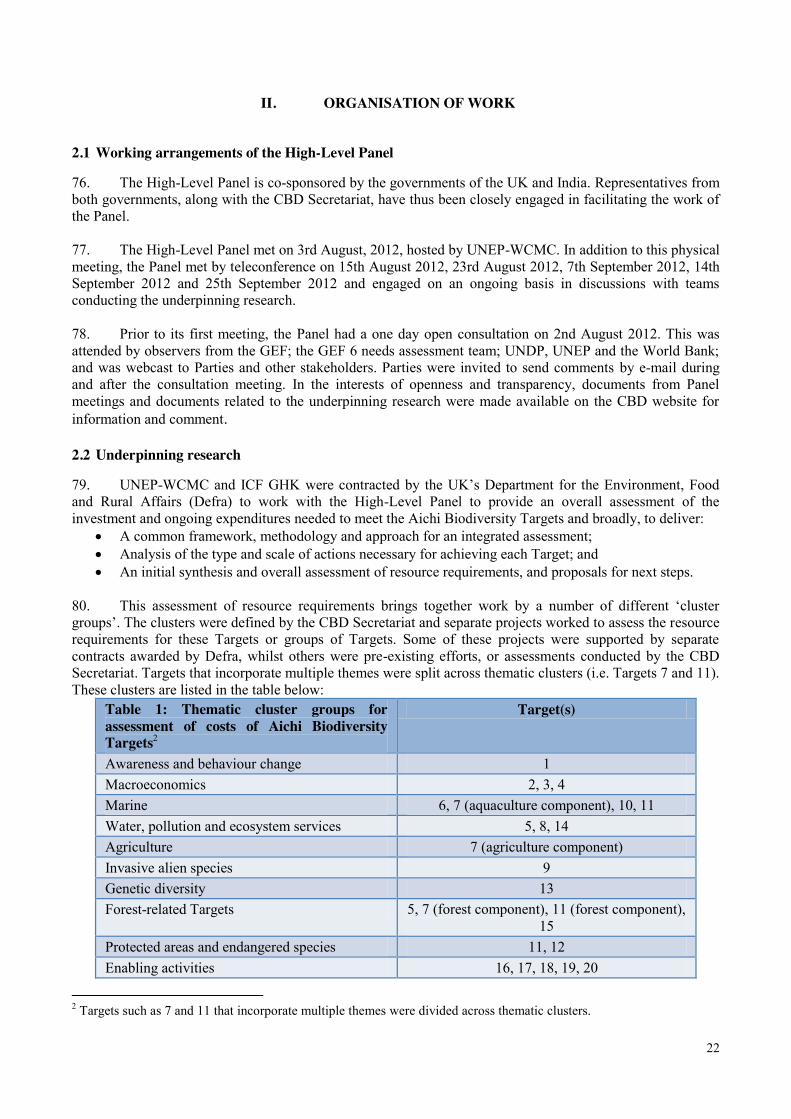
80. This assessment of resource requirements brings together work by a number of different ‘cluster groups’. The clusters were defined by the CBD Secretariat and separate projects worked to assess the resource requirements for these Targets or groups of Targets. Some of these projects were supported by separate contracts awarded by Defra, whilst others were pre-existing efforts, or assessments conducted by the CBD Secretariat. Targets that incorporate multiple themes were split across thematic clusters (i.e. Targets 7 and 11). These clusters are listed in the table below:
Table 1: Thematic cluster groups for assessment of costs of Aichi Biodiversity Targets2
Target(s)
Awareness and behaviour change 1 Macroeconomics 2, 3, 4 Marine 6, 7 (aquaculture component), 10, 11 Water, pollution and ecosystem services 5, 8, 14 Agriculture 7 (agriculture component) Invasive alien species 9 Genetic diversity 13 Forest-related Targets 5, 7 (forest component), 11 (forest component),
15 Protected areas and endangered species 11, 12 Enabling activities 16, 17, 18, 19, 20
2 Targets such as 7 and 11 that incorporate multiple themes were divided across thematic clusters.
23
2.3 Gaps
81. The different cluster groups together covered all of the twenty Aichi Biodiversity Targets and have collectively provided a reasonably complete assessment of the resources required to meet them. However, there are certain gaps in their coverage, which means that the assessment presented in this report is not necessarily fully comprehensive. Notable gaps are as follows:
x Target 5 relates to reducing the rate of loss of all natural habitats, whereas the analysis by the cluster groups covers only forests and wetlands;
x Work on Target 12 focused on the conservation of threatened bird species, and made only a rough assessment of the costs for other taxa by extrapolating the results for birds;
x Target 14 relates to the restoration of all ecosystems, whereas the assessment has focused on wetlands, forests and coral reefs.
82. More information on the methodologies for this research is provided in Section IV. Results are presented and discussed in sections V and VI.
24
III. ESSENTIAL CONTEXT
3.1 The enabling framework
83. Implementation and delivery of the Aichi Biodiversity Targets requires the development of an appropriate and coherent political and institutional framework, and strong political will, particularly at national and regional levels. Careful planning and an enabling framework are prerequisites for effective and successful action to meet the Aichi Biodiversity Targets, as well as for securing the resources required. Most of the Targets cannot be delivered instantaneously but will require a continuous and coherent process in which early and well planned commitments will reduce overall costs and difficulties. Many of the Aichi Biodiversity Targets cannot be met without the right institutional structures, capacity and governance in place - irrespective of the availability of resources. Therefore, in assessing resource needs it must be stressed that resource mobilisation should be accompanied by the development of appropriate capacity (including institutional and infrastructural arrangements) supported by political coherence across governments and national institutions. For a resource assessment to be meaningful and transformational there is a need to assume that the latter are being addressed and (given that this requirement will also have costs) they are built into the assessment as far as possible. 3.2 Interactions and overlaps
3.2.1 Policy overlaps
84. Delivery of the Aichi Biodiversity Targets will result in a range of benefits – for example sustainable agriculture and fisheries, freshwater, pollution prevention and ecosystem restoration will deliver multiple benefits for society and the economy including for human health, development and poverty alleviation, and mitigation and adaptation to climate change. Thus they reach far beyond the biodiversity sphere into other policy and decision-making areas. Similarly, resources required are not relevant just to biodiversity budgets alone, but also to a broad spectrum of policies areas and institutions. 3.2.2 Overlaps and interactions between the Targets
85. Some of the Targets are inter-related and will benefit from joint programmes of activity that contribute to more than one Target. Thus delivering some Targets will influence the resources required to deliver others and (though delivering Targets by 2020 requires simultaneous action across the Targets) sequencing delivery can be expected to enhance cost effectiveness. For example, reforming or removing negative incentives and developing positive incentives (Target 3) will play an important role in delivering other Targets such as reducing rates of habitat loss and achieving sustainable land management (Targets 5 and 7). 86. Though this is a ‘static assessment’ of resource needs across Targets (and thus it does not integrate the dynamic relationships between Targets), it has attempted to recognise overlaps between Targets and to avoid double counting. Where there were overlaps between different Target clusters, the synthesis team provided guidance to clusters about these and how they should be addressed. The importance of dialogue between cluster leads was emphasised, to ensure consistent and non-overlapping approaches. By taking an approach of defining the programmes of action assumed to contribute to the delivery of the Targets, and by comparing these across clusters it was hoped that it would be possible to avoid double counting and ensure a consistent approach across Targets. Examples of overlaps and inter-relationships include:
x Targets 1-4 and 16-20 relate to awareness raising, macroeconomic changes and enabling activities that will help to contribute to most of the other Targets;
x There are links between Target 7 – sustainable agriculture, Target 8 – pollution and Target 10 – coral reefs. For example, achieving sustainable agriculture will help to avoid water pollution and will benefit a range of habitats including coral reefs – the need to avoid double counting of the resource requirements of these Targets is therefore important;
25
x Target 11 – protected areas - links with and will help to deliver a variety of other Targets (e.g. Target 5 – habitat loss, Target 6 – fisheries, Target 10 – coral reefs, Target 12 – threatened species, Target 15 – ecosystem restoration); and
x Target 12 – threatened species also links with several other Targets (e.g. Target 5 – habitat loss, Target 9 – invasive alien species, Target 10 – coral reefs; Target 11 – protected areas; Target 13 – genetic diversity).
87. While many of the Targets have synergies and overlaps, there are some clear examples where certain activities will contribute directly to the delivery of more than one Target. For example, action to achieve sustainable agriculture under Target 7 will help to reduce water pollution and therefore to meet Target 8. While the cluster groups have been encouraged to work together to avoid overlaps in their analyses, there are some examples such as this where the work of different cluster groups has costed similar activities. For example, analyses by the “wetlands” cluster (covering Targets 5,8 and 14) have included costs of avoiding agricultural nutrient pollution (overlapping with Target 7), and, in examining the resources required for restoration (Target 14) have also included analyses for other habitats such as forests and coral reefs (both covered by other cluster groups). This report attempts to highlight areas of overlap where they occur, and to include relevant estimates only once in the overall synthesis, to avoid double counting. 88. A further consideration is that there may be trade-offs between some of the Targets. For example, achieving sustainable agriculture may have initially negative effects on yields, suggesting a need to increase the farmed area and potentially conflicting with other Targets that seek to protect or increase the area of other habitats. It is important to be aware of these potential trade-offs. As far as possible, the Targets and actions required to meet them have been defined to be consistent with other Targets – for example “sustainable agriculture” is defined to require sustainable intensification, in order to meet food security needs and to minimise impacts on other habitats. In practice, the extent of potential trade-offs between the Targets and the question of whether they are mutually compatible given the significant pressures affecting land-use globally would benefit from further analysis (e.g. through integrated assessments of land-use) that go beyond the assessment of resource requirements presented in this analysis. 3.3 Assessment of baseline
89. A comprehensive assessment of resource requirements for achieving the Strategic Plan for Biodiversity 2011-2020 and Aichi Biodiversity Targets would require assessment of:
a) The total levels of investment or ongoing expenditures required to meet the Targets; and b) The additional levels of investment or ongoing expenditures required to meet the Targets,
compared to current (baseline) levels.
90. Given the wide range of different actors and stakeholders involved at international, national and sub-national level, a detailed analysis of current levels of expenditure and hence a detailed assessment of additional requirements has not been possible for most Targets. For this report it has proved more feasible in most cases to examine the overall resource requirements of the specific actions needed to meet the Targets. 91. The proportion of identified resource requirements that are additional to current allocations varies by Target, depending on the nature of the Target and the types of action required to meet it. For some Targets (e.g. Target 11 - protected areas), substantial levels of resources are already allocated to the identified activities, though further increases are required. In these cases existing expenditures (e.g. on protected area management) may represent a significant proportion of the estimates. Other Targets (e.g. Target 5 – reduction in rates of habitat loss) are defined in such a way as to require actions that are largely additional to current efforts, so that a large proportion of the identified resource needs is additional to current expenditures.

26
3.4 Interpreting cost assessments
92. Though the primary mandate of the High-Level Panel and its underpinning research is the global assessment of financial resources needed to achieve the Aichi Biodiversity Targets, it is clear that cost estimates should be presented and considered in light of the substantial local, regional and global benefits – including benefits both to society and the economy, that would be provided from the Targets being met. In addition, whilst estimated costs may appear high, these should be considered in relation to a wide consideration of the means that these might be met, including through innovative financing mechanisms and financing synergies. These issues are discussed in more detail throughout this report and addressed in particular in Section V.
27
IV. METHODOLOGY
4.1 General approach
93. The Aichi Biodiversity Targets are diverse in their scope and requirements, and meeting them will require strong political coherence and a range of different actions and activities with varying resource needs. The cluster leads have therefore applied a range of different methods to assess these resources requirements per Target. In order to promote a consistent approach and to facilitate synthesis and aggregation of the results, a common methodological framework was established, that included shared guidelines which have been followed by the different cluster groups. 94. A global assessment of the investment and ongoing expenditure required to meet the Aichi Biodiversity Targets is a challenging undertaking, for a number of reasons:
x The Targets themselves are not specified in a form that facilitates such analysis – they are bold and ambitious, but many are broad in scope which creates challenges for costing;
x We can expect variations in approaches to meeting the Targets in different countries and regions, which present challenges for assessing resource needs;
x There are gaps in data and evidence both on the requirements of the Targets and the resources needed for the activities required;
x Limited time and resources were available for the assessment, which took place between June and August 2012; and
x Evidence of the cost of policy development and transformation actions is undeveloped in terms of reliable data and information.
95. Because of these different factors, it was recognised at the outset that the assessment was unlikely to provide a comprehensive or fully robust assessment of the investment and ongoing expenditure required to meet the Targets. Instead, a pragmatic approach was adopted, in order to provide a plausible first assessment of the likely magnitude involved, which will provide a basis for discussion and can be refined through later analysis and as more data and information becomes available. 96. The project could not prejudge how countries will aim to meet the Aichi Biodiversity Targets, and therefore it was not possible or appropriate to specify a detailed global operational plan for meeting them. Instead, the cluster groups sought to define plausible scenarios consistent with Target implementation, in consultation with experts, which provide a broad indication of the scale of activity required globally while recognising the varying needs and cost structures of different countries. Given the uncertainties and information and resource constraints, the aim was to define a credible and transparent approach, recognising the uncertainties involved, to allow ranges of resource requirements to be estimated and present them for discussion and refinement over time. 97. The approach for each Target cluster involved:
x A review of the Targets and their context, needs and expectations, through literature review and consultation with global experts/stakeholders;
x Analysis of the type and scale of the actions required to meet the Targets, through a literature and web review and consultations with selected experts, stakeholders and national authorities;
x Identification of data on the per unit requirements of relevant actions, through literature review and interviews;
x Definition of a broad global programme of activity consistent with meeting the Targets, in appropriate units, based on available evidence;
x Specifying appropriate factors and ratios for up-scaling of investment and ongoing expenditures, taking account of any relevant variations between countries and regions (e.g. according to economic and environmental factors and needs); and
x Assessment of the investment and ongoing expenditure required to meet the Targets, specifying ranges where necessary, assessing resource savings and additional requirements as far as possible, and distinguishing between one-off investments and recurrent expenditures.
28
98. Given the uncertainties involved, the analysis has sought to define clearly the assumptions and methods employed and data gaps encountered, identifying where the estimates could be refined with further evidence and analysis. 4.2 Methodological Issues
99. The methodological framework identified a series of key methodological issues and proposed a common approach to each of them. These issues are summarised below. 4.3 Top-down vs bottom-up assessments
100. The resources required to meet the Targets could potentially be assessed on a country-by-country basis (“bottom-up approach”) or by assessing the costs of global programmes of activity (“top-down approach”). The Targets are to be implemented through National Biodiversity Strategies and Action Plans (NBSAPs), potentially involving diverse approaches and activities. However, assessing the resources required to meet the Targets in all countries using such a detailed bottom-up approach was impractical given the time and resources available. The analysis therefore defined a series of generalised scenarios for global assessment, broadly defining a programme of activities at global level that could deliver the Targets. For some Targets (e.g. the “macroeconomic” Targets 2-4) this involved identifying common actions that could be undertaken by all countries and estimating the average resource requirements for each country; analysis for some other Targets was based on alternative means of assessment and aggregation – for example the approach to Target 12 (endangered species) involved detailed assessment of the resources required to conserve a substantial sample of bird species. 101. It is recognised that the activities actually undertaken in pursuit of the Targets are likely to differ by country, as are the costs of these activities. As far as possible, the assessment sought to understand differences in the types of activities and levels of costs in different parts of the world. Because the approach for most Targets has been relatively broad rather than highly detailed, some caution is needed in interpreting the results. It will be helpful in future to compare and contrast these global estimates with country-by-country analyses such as those proposed by UNDP and the CBD Secretariat. 4.3.1 Types of Resource Needs
102. Whether reported as investments or ongoing expenditure, the economic costs of meeting the Targets include:
x Costs of biodiversity action – the resources required to undertake the activities required to meet the Targets. These include the expenditure on labour, materials, equipment and energy used in delivering biodiversity conservation activities.
x Administrative and transaction costs – the resource required to manage and support programmes of biodiversity action. These may fall on both the public and private sectors – e.g. costs incurred by the authorities in administering incentives to farmers and those incurred by farmers in entering schemes and complying with their administrative requirements.
x Opportunity costs – the opportunities or revenues foregone as a result of actions to conserve biodiversity. These may include, for example, reductions in crop yields through sustainable agriculture, foregone timber revenues through forest protection, or foregone development opportunities from formation of protected areas.
103. Comprehensive assessments of economic costs should take account of all of these elements. In practice, however, the full opportunity costs of biodiversity action are often difficult to assess. As this assessment focuses on the resources required to meet the Targets, it has included opportunity costs only to the extent that they are reflected in actual expenditures and resource needs. This will be the case where compensation is paid for income foregone for actions to conserve biodiversity, for example through incentive payments for sustainable agriculture, land purchases or management agreements for the creation of protected areas, or compensation payments for foregone fishing rights. There may be other examples where biodiversity
29
conservation actions may give rise to opportunity costs where there is no financial expenditure or resource requirement – for example where protected areas limit local development activity without the payment of compensation to landowners. In these cases opportunity costs have been identified and examined qualitatively as far as possible in the analyses of the different cluster groups. 104. The assessment has attempted to analyse all of the resources required, including investments and expenditures by a range of public sector and private sector actors, while seeking to avoid double counting (e.g. where private sector actions are funded through grants and incentives). 4.3.2 Unit level of assessment
105. The investment and expenditure requirements have been estimated by selecting appropriate units and identifying appropriate unit level data for up-scaling to global level. Because the Targets vary widely in the types of actions they involve, a variety of different units have been be used, such as the resource requirements per country, per hectare, per project or per species. 4.3.3 Differences in analytical approach
106. The analyses have employed a variety of analytical approaches, which include: x Specification of appropriate programmes of activity through expert/ stakeholder judgement – for
many of the Targets (e.g. T1, T2, T3, T4, T11, T12, T13, T16-20) the cluster leads have sought to identify – through consultation with experts and stakeholders - an appropriate programme of activities that is consistent with Target delivery, and assess the resources required to deliver the required actions;
x Modelling of required actions – for Targets 6 (fisheries) and 11 (marine protected areas), existing models have been applied to analyse the costs of action;
x Extrapolation from existing expenditures – Target 6 (fisheries) has estimated the costs of fisheries management by extrapolating from current expenditures, assuming that a 10%, 25% or 50% increase in management expenditures is needed;
x Literature review – some estimates (e.g. for Targets 11 – protected areas; 5, 8, 14 freshwater habitats and pollution; 9 - invasive alien species) are based primarily (or in some cases, partly) on the application of existing estimates of unit costs made by previous studies, combining these with estimates of the extent of conservation activity required;
x Regional analysis – for Target 7 (sustainable agriculture), per hectare cost data were collated for different regions and combined with data on agricultural areas in each region to provide an overall cost assessment.
4.3.4 Profile of investments and ongoing expenditures
107. Meeting the Targets involves a combination of one off investments and ongoing annual expenditures. The analysis has made a clear distinction between these two types of categories of resource requirement, as well as combining them to estimate the total and annual resources required over the eight year period between 2013 and 2020. 4.3.5 Gross and net resource requirements – revenues and cost savings
108. As far as possible, the assessment has sought to assess the net level of resources required for biodiversity actions, taking account of any changes in revenues, as well as any potential cost savings alongside the analysis of investment and expenditure requirements. In most cases any changes in revenues or cost savings are not explicitly identified but are built into the unit cost. 4.3.6 Adjustment
109. Unit levels of financial resource requirements to carry out biodiversity actions may vary between different countries for various reasons, such as differences in incomes and wage rates or variations in crop
30
yields. These variations have been examined on a case by case basis, and where necessary unit resource requirements have been adjusted to take account of variations between countries. 4.3.7 Currency
110. All investment and expenditure needs are expressed in US$ at 2012 prices. 4.3.8 Ranges and scenarios
111. In most cases there is more than one possible approach to meeting the Target, and consequently there are different ranges of resource requirements. Therefore two different scenarios – one involving lower levels of activity and resources and another with a higher level of activity and resources – have been defined in most cases. In some cases three scenarios were defined in the cluster analyses, and for these the estimates for the low and high resource scenarios are included in the synthesis presented in this report (i.e. leaving aside the “medium” resource scenario). 4.3.9 Benefits and funding opportunities
112. The focus of the work of the cluster groups was on the resources required to meet the Aichi Biodiversity Targets. A detailed assessment of the benefits or funding opportunities was beyond the scope of the work. However, in presenting estimates of resource needs, it is important to recognise that meeting the Targets will deliver substantial benefits to society and the economy, and to give consideration to the potential sources of funding. In presenting their assessments, each of the cluster groups was therefore asked to provide a brief review of available evidence of the benefits of meeting each Target and the potential sources of funding, illustrating this with examples as far as possible. These reviews are summarised in the sections on funding and benefits in Section V of this paper. 4.3.10 Data sources and coherence with other assessments
113. The assessments have drawn on a wide range of different data sources, many of which are specific to individual Target clusters. There are also some common sources which have informed the work of all of the clusters, such as guidance provided by the CBD Secretariat on the interpretation of each Target. 114. A key source is also the GEF 6 needs assessment, which presents an analysis of the requirements of each Target to inform the funding needs for the sixth replenishment of the GEF (see Section 1.3). That assessment does not provide a full analysis of the resources required to meet the Targets, since the GEF is only able to fund certain types of activities and is restricted to the 155 GEF-eligible countries. However, because of the importance of GEF as a source of funding for meeting the Aichi Biodiversity Targets, this assessment aimed to achieve consistency with the GEF 6 needs assessment as far as possible. Therefore the cluster leads worked closely with those involved in the GEF 6 needs assessment to share information and develop common approaches as far as possible, and the analysis for each Target was adapted to achieve coherence with the GEF 6 needs assessment where appropriate.
31
V. GLOBAL ASSESSMENT OF INVESTMENT AND ONGOING EXPENDITURE NEEDS OF ACHIEVING THE AICHI BIODIVERSITY TARGETS
5.1 Synthesis of the resource needs assessment
115. A complete summary of the estimated resource needs for delivering the individual Aichi Targets is given in Table 5.1. A summary of the method and results for each Target is presented in Chapter VII. 116. The figures provide a first assessment of the total resources required to deliver the Targets. They are inclusive of current levels of resources being allocated to the relevant activities. For most of the Targets, it was not possible to estimate current (baseline) levels of investment or annual expenditures on the relevant actions. Therefore, the extent of additional resource requirements is not known in most cases. However, the evidence for most Targets is that there is a substantial gap between the resources required and those currently being allocated. Understanding additional resource needs is an area that requires further research and analysis. 117. These results indicate there are clear differences in the relative scale of resources required to deliver the various Targets. The findings indicate that the Targets (and the five associated Strategic Goals) can be classified into three groups according to their global investment needs in the period to 2020: i. Significant investment required: For those Targets specifically aimed at addressing the drivers of
biodiversity loss, the required total global investment over the period 2013 to 2020 is likely to be in the order of several thousands of billions of (US) dollars. However, addressing these Targets will not only deliver against biodiversity objectives but can have major positive impacts on other key policy goals. For instance, reducing atmospheric and water pollution is a major investment area, but is also driven by human health and development objectives. Such shared resource needs should be considered in the context of the full range of policy benefits they deliver. Targets in this group fall under Strategic Goals B and D (excluding Target 16).
ii. Moderate investment required: Targets associated with required conservation work will require total global investment over the period 2013 to 2020 in the order of hundreds of billions of (US) dollars for Target 11 (i.e. establishing and maintaining protected areas) and in the order of tens of billions of (US) dollars for the other Targets of Strategic Goal C.
iii. Low investment required: Targets related to improving and creating necessary enabling conditions are likely to be much less resource-intensive. For these Targets, the total global investment needs over the period 2013 to 2020 will more likely be in the order of billions of (US) dollars. These Targets mostly relate to Strategic Goals A and E, as well as Target 16.
118. The results suggest that upfront investment needs tend to be greater than the resources required to fund ongoing activities. It is estimated that one-off investments account for between 60% and 70% of the overall global resource needs for delivering the Targets over the 2013 to 2020 period. 119. Through simple addition of the resource requirements identified for each Target, the costs for implementing the twenty Aichi Biodiversity Targets are estimated at between US$ 150 billion and US$ 440 billion per year. However, these figures need to be treated with caution especially as the Panel is very clear that it is expected that these resource requirements neither should nor could be met by biodiversity finance alone. Additionally, there is potential for considerable synergies among the Targets. Thus, it is expected that coordinated action could substantially reduce the total estimate. 120. The investment needed to deliver a Target is not necessarily correlated to the Target’s importance. Some Targets require relatively little investment but are actually crucial in helping to deliver other (often more expensive) Targets, especially where they aim to create the right enabling conditions. However, while these Targets tend to be less resource-intensive, they are usually difficult to achieve as they often require changes in institutions, policies, priorities, attitudes and behaviour. Examples of key Targets which play a key enabling and facilitating role, but themselves require relatively few resources, include Targets 1 (awareness raising), Targets 2-4 relating to macroeconomic conditions, and Targets 16-20 relating to enabling actions.
32
121. The figures represent preliminary estimates and need to be interpreted with some caution. As far as possible, the assessments were conducted using a common approach, based on a standard methodological framework. However, there are inevitable variations between the assessments, as different Targets require different approaches. These include differences in analytical approach between the Target clusters, types of activity considered, units of assessment used and definition of scenarios. 122. There are many inter-linkages and co-dependencies to consider both between the Targets themselves, and between the Targets and other national policy goals. The Targets are inter-related and interdependent, such that the investment needs of one will often be influenced by the approach, resourcing and effectiveness of the delivery of others. For instance, ensuring the effective delivery of those Targets which help to establish the necessary frameworks and conditions (e.g. Targets under Strategic Goals A and E) should reduce the investment needed to deliver other Targets. Understanding these inter-linkages and co-dependencies is therefore important in order to prioritise action and should be considered a crucial area for further work. Other policy areas, extending well beyond biodiversity conservation will also be impacted by the delivery of the Aichi Biodiversity Targets. For example, national farming and fisheries policies have very important overlaps with the Aichi Biodiversity Targets focusing on sustainable agriculture and fisheries. Recognising synergies and overlaps across such important national policy objectives can significantly add to the overall availability of financing, and improve budgetary efficiencies and environmental governance.
123. The different Targets vary in the extent to which they focus on biodiversity and the degree to which they meet wider policy objectives. Some Targets – such as those relating to sustainable agriculture, fisheries and pollution control – require relatively high levels of resources but contribute to much wider policy objectives (economic, social and environmental). Often the Targets with a greater focus on biodiversity objectives have lower resource requirements. There are clear implications for the funding of the investments and ongoing expenditures required, since those Targets which help to deliver against multiple objectives will benefit from a wider range of funding opportunities. 124. There are some clear examples where Targets overlap and where particular actions will help to deliver more than one Target. For example, sustainable management of agricultural nutrients is a key action required to deliver both Targets 7 (sustainable agriculture) and 8 (pollution control). In compiling the estimates of resource needs we have sought to identify these overlaps and to avoid double counting as far as possible. However, there are some examples of areas of overlap that cannot be easily accounted for. For example, Protected Areas (Target 11) will play an important role in reducing rates of habitat loss (Target 5) as well as in contributing to ecosystem restoration (Targets 14 – 15), and there will be some degree of overlap between the estimated costs of achieving these Targets.
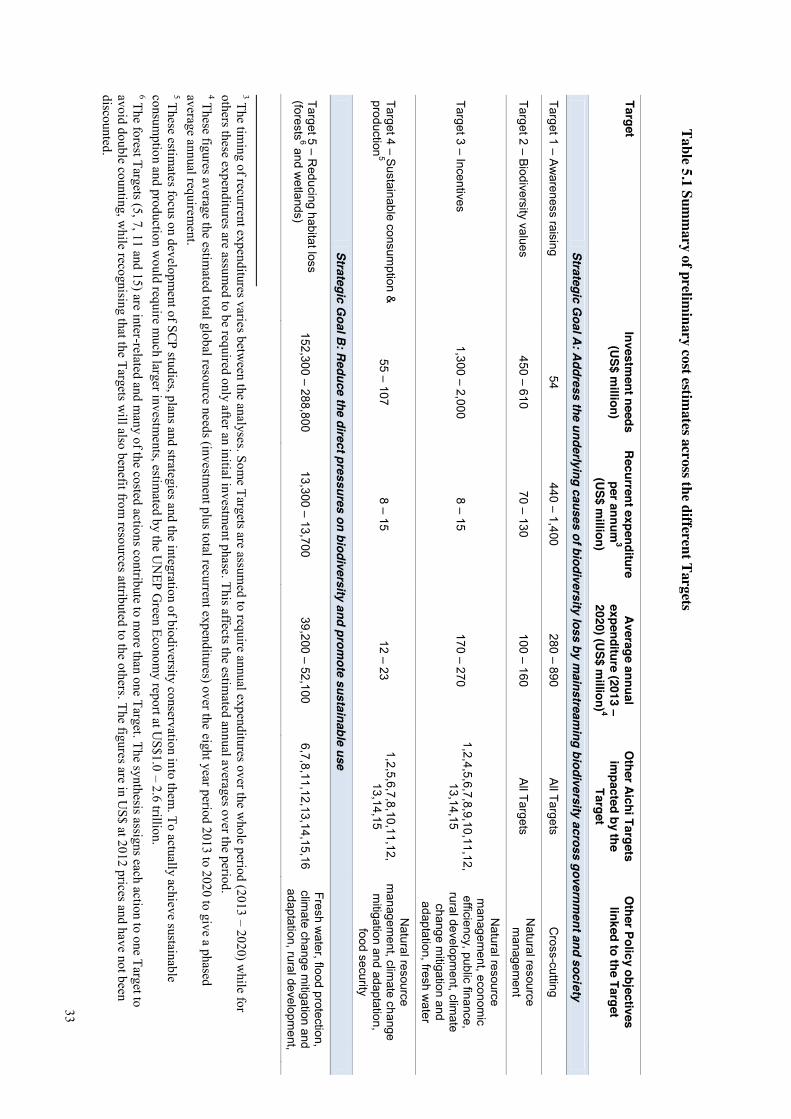
33
Table 5.1 Summ
ary of preliminary cost estim
ates across the different Targets Target
Investment needs
(US$ m
illion) R
ecurrent expenditure per annum
3 (U
S$ million)
Average annual
expenditure (2013 – 2020) (U
S$ million) 4
Other Aichi Targets im
pacted by the Target
Other Policy objectives linked to the Target
Strategic G
oal A: A
ddress the underlying causes of biodiversity loss by mainstream
ing biodiversity across government and society
Target 1 – Aw
areness raising 54
440 – 1,400 280 – 890
All Targets
Cross-cutting
Target 2 – Biodiversity values 450 – 610
70 – 130 100 – 160
All Targets
Natural resource m
anagement
Target 3 – Incentives 1,300 – 2,000
8 – 15 170 – 270
1,2,4,5,6,7,8,9,10,11,12, 13,14,15
Natural resource
managem
ent, economic
efficiency, public finance, rural developm
ent, climate
change mitigation and
adaptation, fresh water
Target 4 – Sustainable consumption &
production
5 55 – 107
8 – 15 12 – 23
1,2,5,6,7,8,10,11,12, 13,14,15
Natural resource
managem
ent, climate change
mitigation and adaptation,
food security
Strategic G
oal B: R
educe the direct pressures on biodiversity and promote sustainable use
Target 5 – Reducing habitat loss
(forests6 and w
etlands) 152,300 – 288,800
13,300 – 13,700 39,200 – 52,100
6,7,8,11,12,13,14,15,16 Fresh w
ater, flood protection, clim
ate change mitigation and
adaptation, rural development,
3 The tim
ing of recurrent expenditures varies between the analyses. Som
e Targets are assumed to require annual expenditures over the w
hole period (2013 – 2020) while for
others these expenditures are assumed to be required only after an initial investm
ent phase. This affects the estimated annual averages over the period.
4 These figures average the estimated total global resource needs (investm
ent plus total recurrent expenditures) over the eight year period 2013 to 2020 to give a phased average annual requirem
ent. 5 These estim
ates focus on development of SC
P studies, plans and strategies and the integration of biodiversity conservation into them. To actually achieve sustainable
consumption and production w
ould require much larger investm
ents, estimated by the U
NEP G
reen Economy report at U
S$1.0 – 2.6 trillion. 6 The forest Targets (5, 7, 11 and 15) are inter-related and m
any of the costed actions contribute to more than one Target. The synthesis assigns each action to one Target to
avoid double counting, while recognising that the Targets w
ill also benefit from resources attributed to the others. The figures are in U
S$ at 2012 prices and have not been discounted.
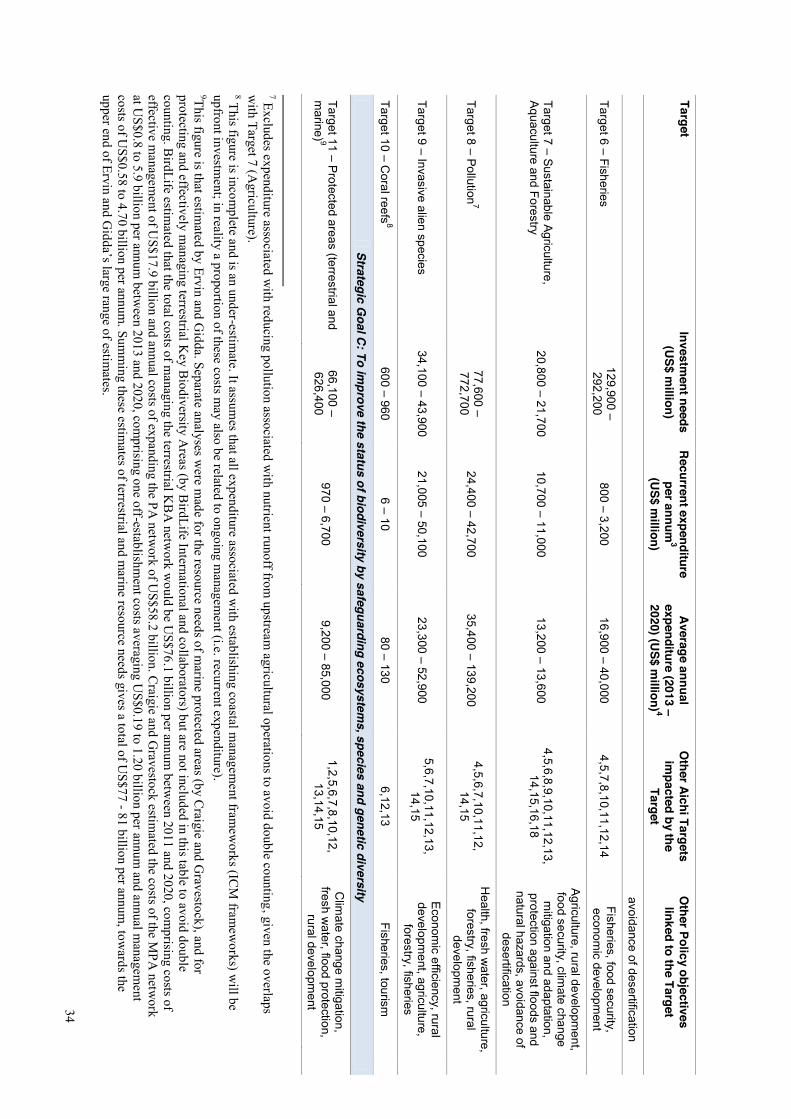
34 Target
Investment needs
(US$ m
illion) R
ecurrent expenditure per annum
3 (U
S$ million)
Average annual
expenditure (2013 – 2020) (U
S$ million) 4
Other Aichi Targets im
pacted by the Target
Other Policy objectives linked to the Target
avoidance of desertification
Target 6 – Fisheries 129,900 – 292,200
800 – 3,200 16,900 – 40,000
4,5,7,8,10,11,12,14 Fisheries, food security, econom
ic development
Target 7 – Sustainable Agriculture, A
quaculture and Forestry 20,800 – 21,700
10,700 – 11,000 13,200 – 13,600
4,5,6,8,9,10,11,12,13, 14,15,16,18
Agriculture, rural developm
ent, food security, clim
ate change m
itigation and adaptation, protection against floods and natural hazards, avoidance of
desertification
Target 8 – Pollution7
77,600 – 772,700
24,400 – 42,700 35,400 – 139,200
4,5,6,7,10,11,12, 14,15
Health, fresh w
ater, agriculture, forestry, fisheries, rural
development
Target 9 – Invasive alien species 34,100 – 43,900
21,005 – 50,100 23,300 – 52,900
5,6,7,10,11,12,13, 14,15
Econom
ic efficiency, rural developm
ent, agriculture, forestry, fisheries
Target 10 – Coral reefs
8 600 – 960
6 – 10 80 – 130
6,12,13 Fisheries, tourism
Strategic G
oal C: To im
prove the status of biodiversity by safeguarding ecosystems, species and genetic diversity
Target 11 – Protected areas (terrestrial and
marine) 9
66,100 – 626,400
970 – 6,700 9,200 – 85,000
1,2,5,6,7,8,10,12, 13,14,15
Clim
ate change mitigation,
fresh water, flood protection,
rural development
7 Excludes expenditure associated w
ith reducing pollution associated with nutrient runoff from
upstream agricultural operations to avoid double counting, given the overlaps
with Target 7 (A
griculture). 8 This figure is incom
plete and is an under-estimate. It assum
es that all expenditure associated with establishing coastal m
anagement fram
eworks (IC
M fram
eworks) w
ill be upfront investm
ent; in reality a proportion of these costs may also be related to ongoing m
anagement (i.e. recurrent expenditure).
9This figure is that estimated by Ervin and G
idda. Separate analyses were m
ade for the resource needs of marine protected areas (by C
raigie and Gravestock), and for
protecting and effectively managing terrestrial K
ey Biodiversity A
reas (by BirdLife International and collaborators) but are not included in this table to avoid double
counting. BirdLife estim
ated that the total costs of managing the terrestrial K
BA
network w
ould be US$76.1 billion per annum
between 2011 and 2020, com
prising costs of effective m
anagement of U
S$17.9 billion and annual costs of expanding the PA netw
ork of US$58.2 billion. C
raigie and Gravestock estim
ated the costs of the MPA
network
at US$0.8 to 5.9 billion per annum
between 2013 and 2020, com
prising one off-establishment costs averaging U
S$0.19 to 1.20 billion per annum and annual m
anagement
costs of US$0.58 to 4.70 billion per annum
. Summ
ing these estimates of terrestrial and m
arine resource needs gives a total of US$77 - 81 billion per annum
, towards the
upper end of Ervin and Gidda’s large range of estim
ates.
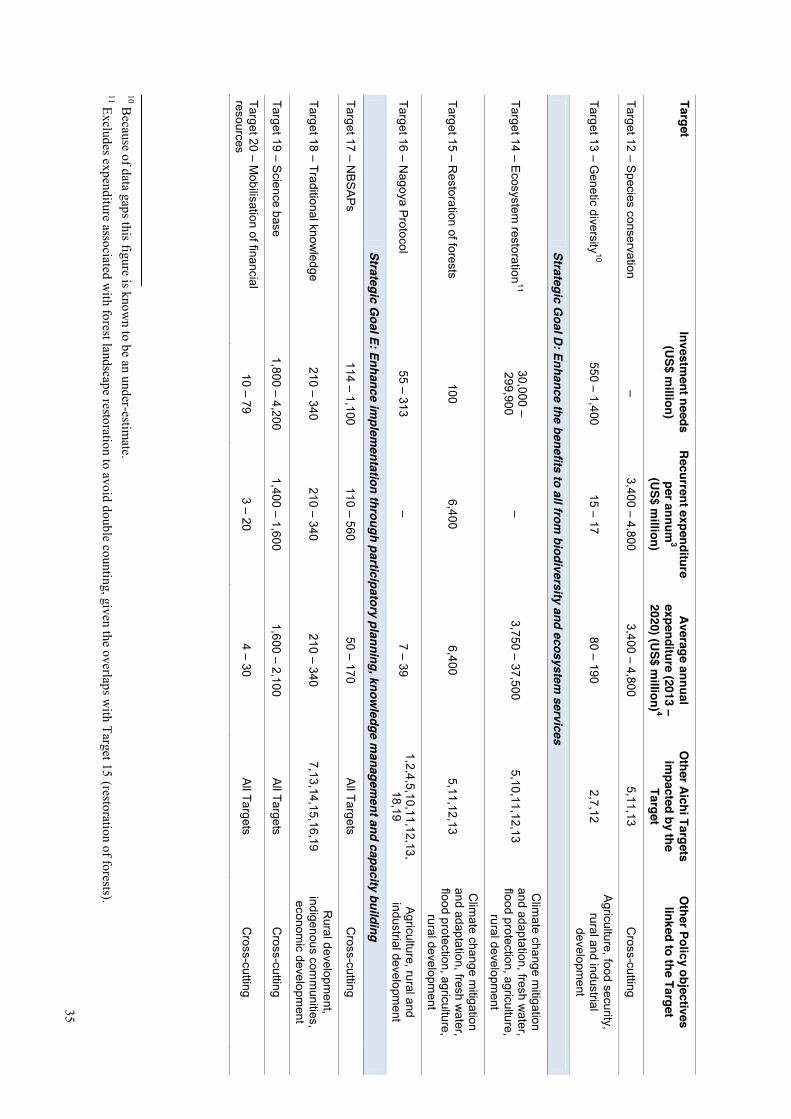
35 Target
Investment needs
(US$ m
illion) R
ecurrent expenditure per annum
3 (U
S$ million)
Average annual
expenditure (2013 – 2020) (U
S$ million) 4
Other Aichi Targets im
pacted by the Target
Other Policy objectives linked to the Target
Target 12 – Species conservation
– 3,400 – 4,800
3,400 – 4,800 5,11,13
Cross-cutting
Target 13 – Genetic diversity
10 550 – 1,400
15 – 17 80 – 190
2,7,12 A
griculture, food security, rural and industrial
development
Strategic G
oal D: Enhance the benefits to all from
biodiversity and ecosystem services
Target 14 – Ecosystem
restoration11
30,000 – 299,900
– 3,750 – 37,500
5,10,11,12,13
Clim
ate change mitigation
and adaptation, fresh water,
flood protection, agriculture, rural developm
ent
Target 15 – Restoration of forests
100 6,400
6,400 5,11,12,13
Clim
ate change mitigation
and adaptation, fresh water,
flood protection, agriculture, rural developm
ent
Target 16 – Nagoya P
rotocol 55 – 313
– 7 – 39
1,2,4,5,10,11,12,13, 18,19
Agriculture, rural and
industrial development
Strategic G
oal E: Enhance implem
entation through participatory planning, knowledge m
anagement and capacity building
Target 17 – NB
SAP
s 114 – 1,100
110 – 560 50 – 170
All Targets
Cross-cutting
Target 18 – Traditional knowledge
210 – 340 210 – 340
210 – 340 7,13,14,15,16,19
Rural developm
ent, indigenous com
munities,
economic developm
ent
Target 19 – Science base
1,800 – 4,200 1,400 – 1,600
1,600 – 2,100 A
ll Targets C
ross-cutting
Target 20 – Mobilisation of financial
resources 10 – 79
3 – 20 4 – 30
All Targets
Cross-cutting
10 B
ecause of data gaps this figure is known to be an under-estim
ate. 11 Excludes expenditure associated w
ith forest landscape restoration to avoid double counting, given the overlaps with Target 15 (restoration of forests).
36
5.2 Variations in the resource needs assessments
125. As far as possible, the assessments were conducted using a common approach, based on a standard methodological framework, as outlined in Chapter IV. However, there are inevitable variations between the assessments, as different Targets require a different approach. These include differences in:
x Analytical approach – some of the cluster studies applied existing models (e.g. Target 6 - fisheries), others have transferred existing cost estimates (e.g. Targets 5, 8 and 14 for fresh water), while some involved consultation with stakeholders and obtained estimates from current initiatives (e.g. Target 1 – awareness raising and 2-4 – macroeconomics);
x Types of activity – the assessments identified a wide range of different types of activity which varied widely by Target. In some cases, different cluster groups working on different components of the same Target assessed very different activities. For example, for Target 5 (reducing the rate of habitat loss) the analysis for wetlands focused to a large extent on conservation banking and acquisition programmes, while for forests the actions considered included biodiversity inventories, monitoring systems, training and education of professional officers, law enforcement and creation of enabling conditions through financial incentives.
x Units of assessment – some studies estimated costs on a per country basis (e.g. Targets 1-4), while others applied per hectare costs (e.g. Target 5 – wetlands and Target 7 – agriculture). The analysis for Target 8 focused on units of pollution reduction, while for fisheries the analysis was based on numbers of vessels decommissioned and percentage increases in fisheries management expenditures;
x Definition of scenarios – while each assessment defined lower and higher ambition scenarios, different variables were used to define these (e.g. number of countries in which action takes place, scale of activity undertaken in each country, level of reduction of global habitat loss).
126. The estimates should be regarded only as a first order assessment of the possible resource requirements in meeting the Aichi Biodiversity Targets. While every effort has been made to develop and apply a credible and consistent analytical approach given the time and resources available for the assessment, the robustness of the resource estimates is influenced by a range of factors, which include:
x The interpretation of the Targets and the assumed level of ambition in the actions identified to meet them. It has been necessary to interpret the Targets by specifying measurable activities that could be implemented to meet them. Only a few Targets are expressed in clearly quantifiable terms, thus there is a need to infer the level of ambition. Moreover, given that the Targets provide a flexible framework that is to be applied nationally, various levels of ambition would be consistent with each Target. The resources required are sensitive to the type and scale of defined activities.
x The inclusion of actions that go beyond core biodiversity conservation activities and deliver wider benefits. Some of the Targets require substantial changes in practice that are essential for biodiversity conservation but deliver much wider benefits to society as a whole (e.g. sustainable agriculture, fisheries and pollution control). The resources required are large and the way they are accounted for greatly affects the estimates produced.
x The static nature of the analysis. The assessment has attempted to estimate the resources required for each Target separately, while having regard for the potential synergies and overlaps between Targets and seeking to avoid double counting. In practice, the actions taken in pursuit of some Targets will influence the type, extent and cost of action required for others, as will the timing and sequencing of these different actions.
x Constraints resulting from limitations in the available data and methodologies. Limited time and resources were available for the assessment.
127. Because of these factors, none of the estimates can be regarded as fully certain or precise – there is a degree of uncertainty attached to each one. The variations in the level of uncertainty and knowledge gaps associated with the different estimates is summarised in Figure 5.1. In general, the
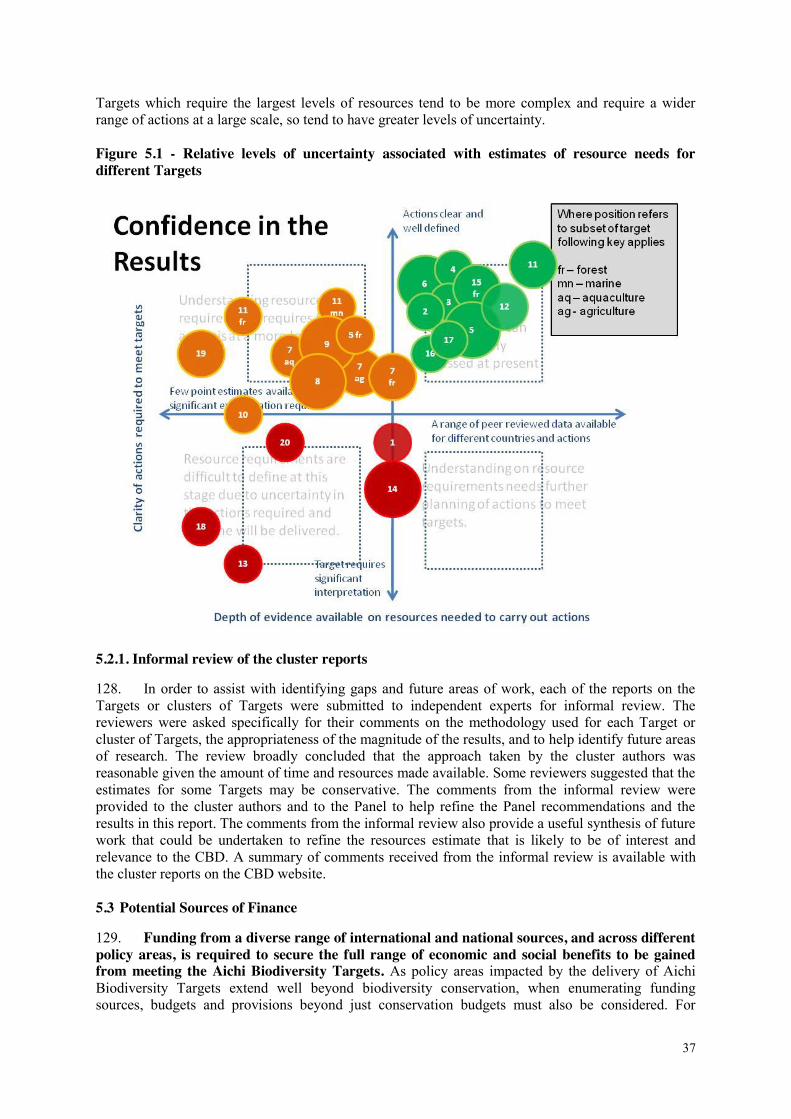
37
Targets which require the largest levels of resources tend to be more complex and require a wider range of actions at a large scale, so tend to have greater levels of uncertainty. Figure 5.1 - Relative levels of uncertainty associated with estimates of resource needs for different Targets
5.2.1. Informal review of the cluster reports
128. In order to assist with identifying gaps and future areas of work, each of the reports on the Targets or clusters of Targets were submitted to independent experts for informal review. The reviewers were asked specifically for their comments on the methodology used for each Target or cluster of Targets, the appropriateness of the magnitude of the results, and to help identify future areas of research. The review broadly concluded that the approach taken by the cluster authors was reasonable given the amount of time and resources made available. Some reviewers suggested that the estimates for some Targets may be conservative. The comments from the informal review were provided to the cluster authors and to the Panel to help refine the Panel recommendations and the results in this report. The comments from the informal review also provide a useful synthesis of future work that could be undertaken to refine the resources estimate that is likely to be of interest and relevance to the CBD. A summary of comments received from the informal review is available with the cluster reports on the CBD website. 5.3 Potential Sources of Finance
129. Funding from a diverse range of international and national sources, and across different policy areas, is required to secure the full range of economic and social benefits to be gained from meeting the Aichi Biodiversity Targets. As policy areas impacted by the delivery of Aichi Biodiversity Targets extend well beyond biodiversity conservation, when enumerating funding sources, budgets and provisions beyond just conservation budgets must also be considered. For
38
example, financing for climate change mitigation and adaptation policies, and allocations to halt the ingress of desertification are closely linked to the objectives of the forest-related Aichi Biodiversity Targets. Furthermore, sources of financing will include a wide range of public funding (core national biodiversity funding sources, financing from different parts of government and its agencies, as well as international flows of official development assistance (ODA) and multilateral funding) and development of innovative measures and conservation incentives such as payments for ecosystem services (PES), conservation agreements, water fees, forest carbon offsets, and green fiscal policies, as well as private- and third-sector investment. This will also require engagement with a wide range of government and non-governmental stakeholders. The private sector has a key role to play in providing resources and reducing the costs of protecting biodiversity through more informed decision-making that mainstreams sustainable management of biodiversity and ecosystems in their actions. This will in turn deliver benefits for business by securing their social licence to operate, and more importantly, securing sustainable supply chains. 130. For some Targets with a specific focus on biodiversity conservation, many of the required resources will need to be provided through core biodiversity budgets (particularly, for example, investments required for protecting species or managing protected areas) or the development of national conservation incentives such as PES, conservation agreements, water fees, forest carbon offsets, and green fiscal policies. However, many of the Targets will deliver a wide range of benefits, for example by furthering development opportunities or enhancing the productive potential of agriculture or fisheries, and this opens up opportunities for funding from different parts of government and from international agencies. Other actions provide opportunities for business – for example in helping to achieve sustainable production or consumption or developing payments for ecosystem services – thereby opening opportunities for private sector finance. Indeed, some of the Targets (e.g. Target 6 – sustainable fisheries; Target 7 – sustainable agriculture and aquaculture; Target 8 – pollution control), while playing an important role in halting biodiversity loss, have a much broader focus than biodiversity alone and the scale of investment required reflects this. The financial resources required will therefore need to be provided from a range of sources and cannot be met from biodiversity budgets alone. 131. Discussions on potential sources of finance have been ongoing under the CBD for a number of years. At COP 8 in 2006, Parties requested the Executive Secretary explore all options for resource mobilisation including innovative financial mechanisms (decision VIII/13 paragraph 4). COP 8 also invited Parties to explore options for innovative international finance mechanisms to support the programme of work on protected areas (decision VIII/24, paragraph 18 f). Within the Strategy for Resource Mobilisation which was agreed at COP 9 in 2008 (decision IX/11), a range of existing sources of financing have been listed under Goal 3, which seeks to “Strengthen existing financial institutions and, promote replication and scaling-up of successful financial mechanisms and instruments”. The following sources are prioritised under this goal: co-financing; official development assistance; public-sector investments; private-sector investments; voluntary contributions; domestic environmental funds; debt relief and conversion initiatives, including debt-for-nature swaps. 132. The need for identification of new areas of finance is also captured in the Strategy for Resource Mobilisation under Goal 4, which seeks to “Explore new and innovative financial mechanisms at all levels with a view to increasing funding to support the three objectives of the Convention”. This goal sets out six areas of financial innovations: schemes for payment for ecosystem services; biodiversity offset mechanisms; environmental fiscal reforms including innovative taxation models and fiscal incentives; markets for green products, business-biodiversity partnerships and new forms of charity; development of new and innovative sources of international development finance; and funding mechanisms for climate change. 133. Further to these outcomes, decision X/3 from COP 10 invited Parties to submit information on innovative financial mechanisms that have potential to generate new and additional financial resources as well as possible problems that could undermine achievement of the Convention’s three objectives. The Secretariat called for this information through Notification 2011-069 ‘Submission of

39
information concerning innovative financial mechanisms, pursuant to decision X/3, A, paragraph 8(c)’ in 2011 and has subsequently compiled a ‘Collection of Submissions on Innovative Financial Mechanisms’.
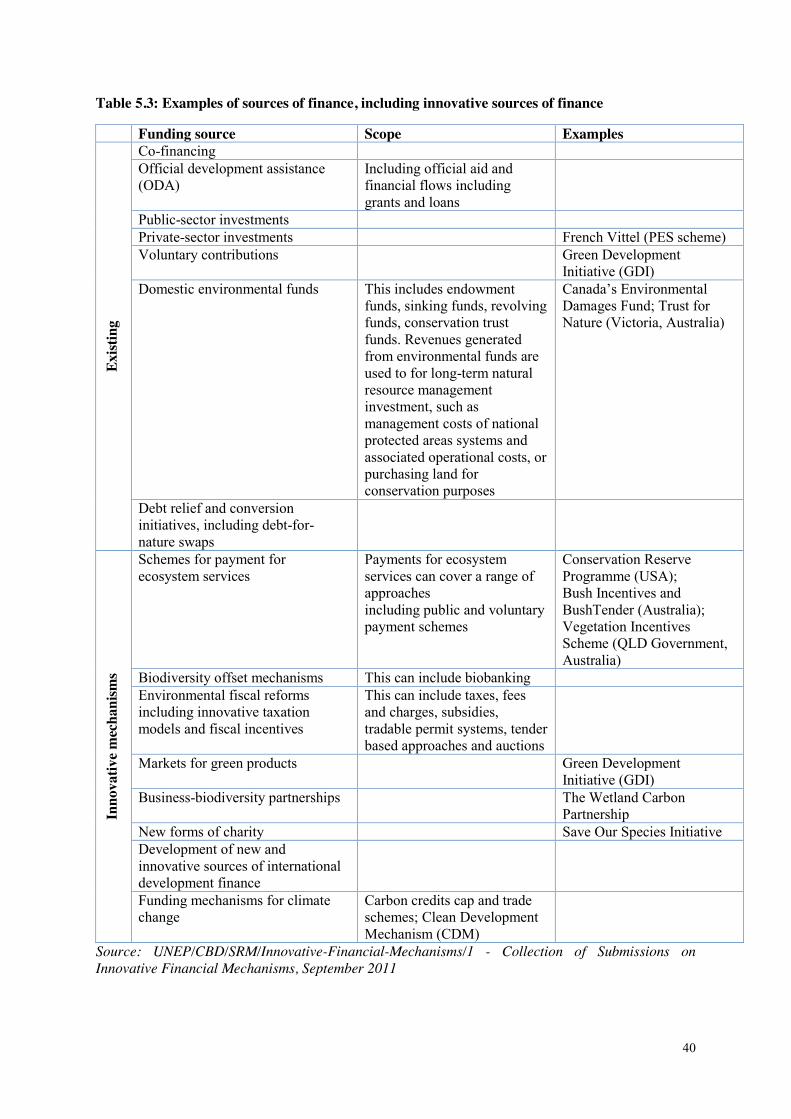
40
Table 5.3: Examples of sources of finance, including innovative sources of finance
Funding source Scope Examples Ex
istin
g
Co-financing Official development assistance (ODA)
Including official aid and financial flows including grants and loans
Public-sector investments Private-sector investments French Vittel (PES scheme) Voluntary contributions Green Development
Initiative (GDI) Domestic environmental funds
This includes endowment funds, sinking funds, revolving funds, conservation trust funds. Revenues generated from environmental funds are used to for long-term natural resource management investment, such as management costs of national protected areas systems and associated operational costs, or purchasing land for conservation purposes
Canada’s Environmental Damages Fund; Trust for Nature (Victoria, Australia)
Debt relief and conversion initiatives, including debt-for-nature swaps
Inno
vativ
e mec
hani
sms
Schemes for payment for ecosystem services
Payments for ecosystem services can cover a range of approaches including public and voluntary payment schemes
Conservation Reserve Programme (USA); Bush Incentives and BushTender (Australia); Vegetation Incentives Scheme (QLD Government, Australia)
Biodiversity offset mechanisms This can include biobanking Environmental fiscal reforms including innovative taxation models and fiscal incentives
This can include taxes, fees and charges, subsidies, tradable permit systems, tender based approaches and auctions
Markets for green products Green Development Initiative (GDI)
Business-biodiversity partnerships The Wetland Carbon Partnership
New forms of charity Save Our Species Initiative Development of new and innovative sources of international development finance
Funding mechanisms for climate change
Carbon credits cap and trade schemes; Clean Development Mechanism (CDM)
Source: UNEP/CBD/SRM/Innovative-Financial-Mechanisms/1 - Collection of Submissions on Innovative Financial Mechanisms, September 2011
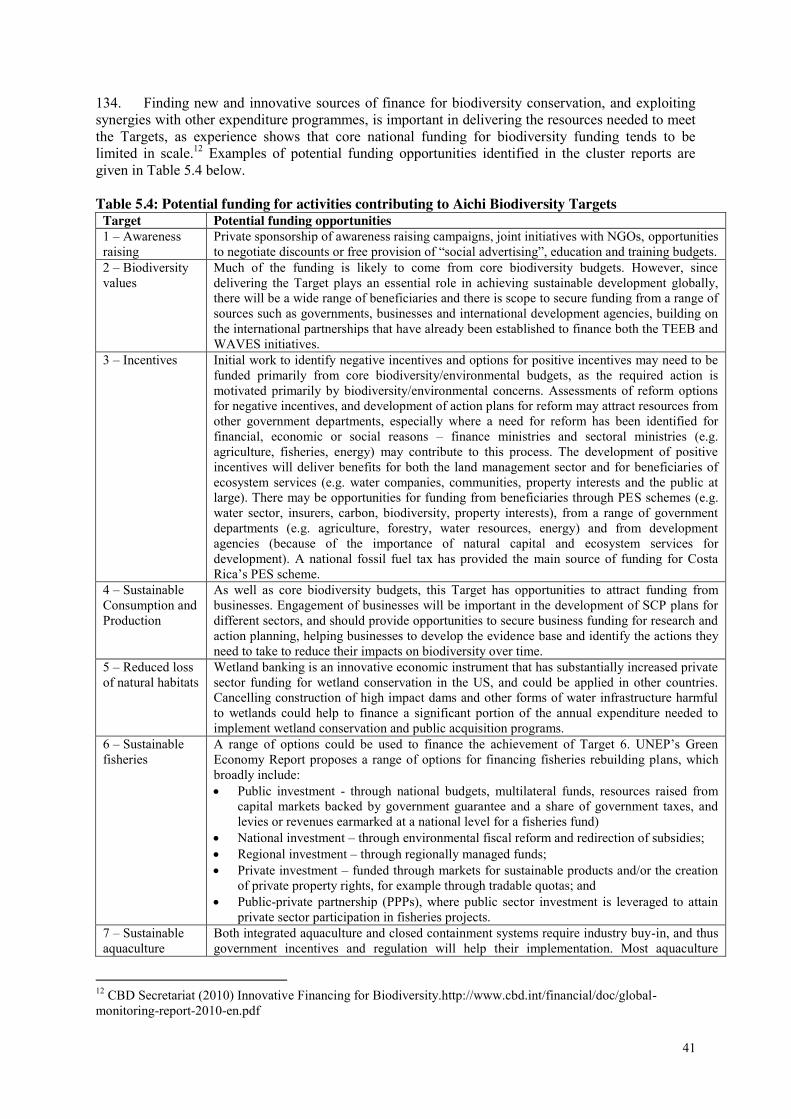
41
134. Finding new and innovative sources of finance for biodiversity conservation, and exploiting synergies with other expenditure programmes, is important in delivering the resources needed to meet the Targets, as experience shows that core national funding for biodiversity funding tends to be limited in scale.12 Examples of potential funding opportunities identified in the cluster reports are given in Table 5.4 below. Table 5.4: Potential funding for activities contributing to Aichi Biodiversity Targets
Target Potential funding opportunities 1 – Awareness raising
Private sponsorship of awareness raising campaigns, joint initiatives with NGOs, opportunities to negotiate discounts or free provision of “social advertising”, education and training budgets.
2 – Biodiversity values
Much of the funding is likely to come from core biodiversity budgets. However, since delivering the Target plays an essential role in achieving sustainable development globally, there will be a wide range of beneficiaries and there is scope to secure funding from a range of sources such as governments, businesses and international development agencies, building on the international partnerships that have already been established to finance both the TEEB and WAVES initiatives.
3 – Incentives Initial work to identify negative incentives and options for positive incentives may need to be funded primarily from core biodiversity/environmental budgets, as the required action is motivated primarily by biodiversity/environmental concerns. Assessments of reform options for negative incentives, and development of action plans for reform may attract resources from other government departments, especially where a need for reform has been identified for financial, economic or social reasons – finance ministries and sectoral ministries (e.g. agriculture, fisheries, energy) may contribute to this process. The development of positive incentives will deliver benefits for both the land management sector and for beneficiaries of ecosystem services (e.g. water companies, communities, property interests and the public at large). There may be opportunities for funding from beneficiaries through PES schemes (e.g. water sector, insurers, carbon, biodiversity, property interests), from a range of government departments (e.g. agriculture, forestry, water resources, energy) and from development agencies (because of the importance of natural capital and ecosystem services for development). A national fossil fuel tax has provided the main source of funding for Costa Rica’s PES scheme.
4 – Sustainable Consumption and Production
As well as core biodiversity budgets, this Target has opportunities to attract funding from businesses. Engagement of businesses will be important in the development of SCP plans for different sectors, and should provide opportunities to secure business funding for research and action planning, helping businesses to develop the evidence base and identify the actions they need to take to reduce their impacts on biodiversity over time.
5 – Reduced loss of natural habitats
Wetland banking is an innovative economic instrument that has substantially increased private sector funding for wetland conservation in the US, and could be applied in other countries. Cancelling construction of high impact dams and other forms of water infrastructure harmful to wetlands could help to finance a significant portion of the annual expenditure needed to implement wetland conservation and public acquisition programs.
6 – Sustainable fisheries
A range of options could be used to finance the achievement of Target 6. UNEP’s Green Economy Report proposes a range of options for financing fisheries rebuilding plans, which broadly include: x Public investment - through national budgets, multilateral funds, resources raised from
capital markets backed by government guarantee and a share of government taxes, and levies or revenues earmarked at a national level for a fisheries fund)
x National investment – through environmental fiscal reform and redirection of subsidies; x Regional investment – through regionally managed funds; x Private investment – funded through markets for sustainable products and/or the creation
of private property rights, for example through tradable quotas; and x Public-private partnership (PPPs), where public sector investment is leveraged to attain
private sector participation in fisheries projects. 7 – Sustainable aquaculture
Both integrated aquaculture and closed containment systems require industry buy-in, and thus government incentives and regulation will help their implementation. Most aquaculture
12 CBD Secretariat (2010) Innovative Financing for Biodiversity.http://www.cbd.int/financial/doc/global-monitoring-report-2010-en.pdf
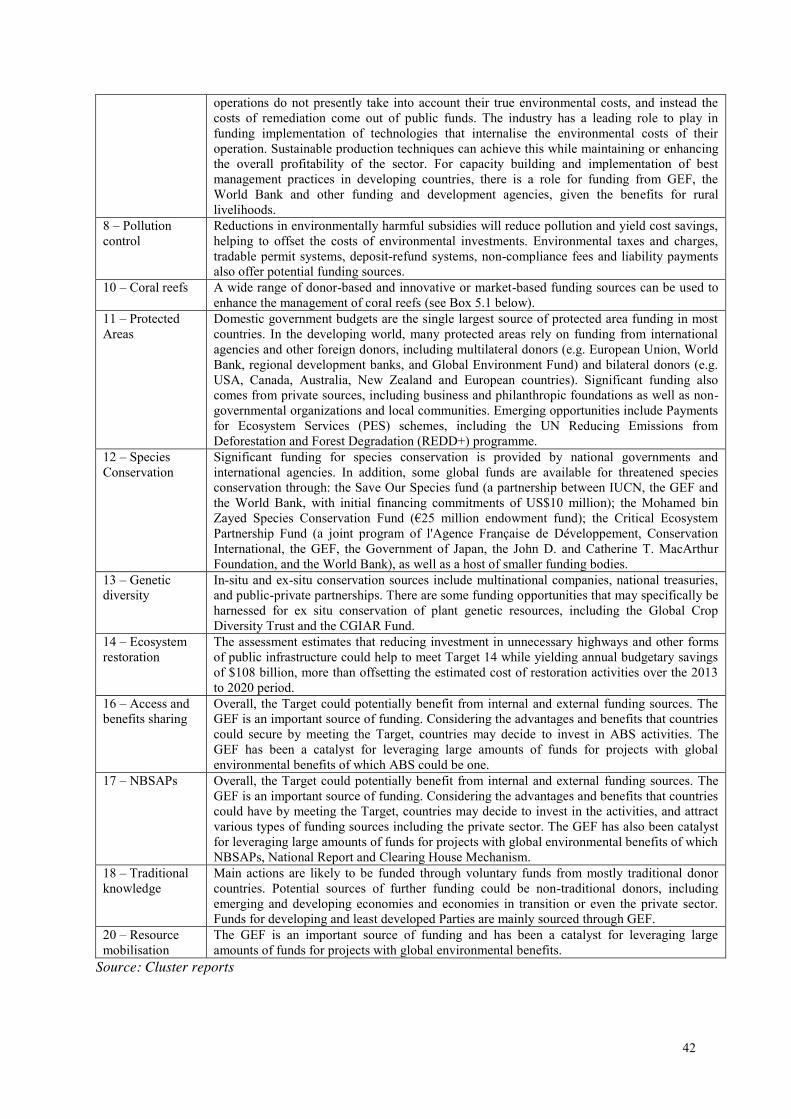
42
operations do not presently take into account their true environmental costs, and instead the costs of remediation come out of public funds. The industry has a leading role to play in funding implementation of technologies that internalise the environmental costs of their operation. Sustainable production techniques can achieve this while maintaining or enhancing the overall profitability of the sector. For capacity building and implementation of best management practices in developing countries, there is a role for funding from GEF, the World Bank and other funding and development agencies, given the benefits for rural livelihoods.
8 – Pollution control
Reductions in environmentally harmful subsidies will reduce pollution and yield cost savings, helping to offset the costs of environmental investments. Environmental taxes and charges, tradable permit systems, deposit-refund systems, non-compliance fees and liability payments also offer potential funding sources.
10 – Coral reefs A wide range of donor-based and innovative or market-based funding sources can be used to enhance the management of coral reefs (see Box 5.1 below).
11 – Protected Areas
Domestic government budgets are the single largest source of protected area funding in most countries. In the developing world, many protected areas rely on funding from international agencies and other foreign donors, including multilateral donors (e.g. European Union, World Bank, regional development banks, and Global Environment Fund) and bilateral donors (e.g. USA, Canada, Australia, New Zealand and European countries). Significant funding also comes from private sources, including business and philanthropic foundations as well as non-governmental organizations and local communities. Emerging opportunities include Payments for Ecosystem Services (PES) schemes, including the UN Reducing Emissions from Deforestation and Forest Degradation (REDD+) programme.
12 – Species Conservation
Significant funding for species conservation is provided by national governments and international agencies. In addition, some global funds are available for threatened species conservation through: the Save Our Species fund (a partnership between IUCN, the GEF and the World Bank, with initial financing commitments of US$10 million); the Mohamed bin Zayed Species Conservation Fund (€25 million endowment fund); the Critical Ecosystem Partnership Fund (a joint program of l'Agence Française de Développement, Conservation International, the GEF, the Government of Japan, the John D. and Catherine T. MacArthur Foundation, and the World Bank), as well as a host of smaller funding bodies.
13 – Genetic diversity
In-situ and ex-situ conservation sources include multinational companies, national treasuries, and public-private partnerships. There are some funding opportunities that may specifically be harnessed for ex situ conservation of plant genetic resources, including the Global Crop Diversity Trust and the CGIAR Fund.
14 – Ecosystem restoration
The assessment estimates that reducing investment in unnecessary highways and other forms of public infrastructure could help to meet Target 14 while yielding annual budgetary savings of $108 billion, more than offsetting the estimated cost of restoration activities over the 2013 to 2020 period.
16 – Access and benefits sharing
Overall, the Target could potentially benefit from internal and external funding sources. The GEF is an important source of funding. Considering the advantages and benefits that countries could secure by meeting the Target, countries may decide to invest in ABS activities. The GEF has been a catalyst for leveraging large amounts of funds for projects with global environmental benefits of which ABS could be one.
17 – NBSAPs Overall, the Target could potentially benefit from internal and external funding sources. The GEF is an important source of funding. Considering the advantages and benefits that countries could have by meeting the Target, countries may decide to invest in the activities, and attract various types of funding sources including the private sector. The GEF has also been catalyst for leveraging large amounts of funds for projects with global environmental benefits of which NBSAPs, National Report and Clearing House Mechanism.
18 – Traditional knowledge
Main actions are likely to be funded through voluntary funds from mostly traditional donor countries. Potential sources of further funding could be non-traditional donors, including emerging and developing economies and economies in transition or even the private sector. Funds for developing and least developed Parties are mainly sourced through GEF.
20 – Resource mobilisation
The GEF is an important source of funding and has been a catalyst for leveraging large amounts of funds for projects with global environmental benefits.
Source: Cluster reports
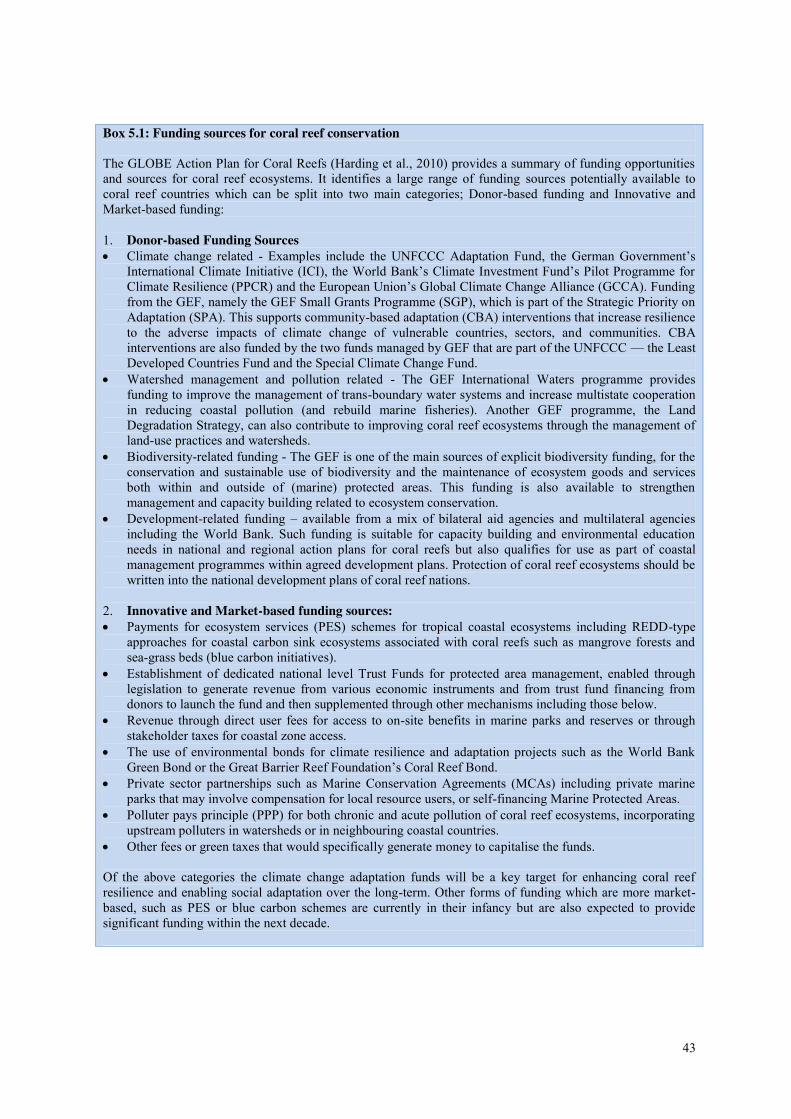
43
Box 5.1: Funding sources for coral reef conservation The GLOBE Action Plan for Coral Reefs (Harding et al., 2010) provides a summary of funding opportunities and sources for coral reef ecosystems. It identifies a large range of funding sources potentially available to coral reef countries which can be split into two main categories; Donor-based funding and Innovative and Market-based funding: 1. Donor-based Funding Sources x Climate change related - Examples include the UNFCCC Adaptation Fund, the German Government’s
International Climate Initiative (ICI), the World Bank’s Climate Investment Fund’s Pilot Programme for Climate Resilience (PPCR) and the European Union’s Global Climate Change Alliance (GCCA). Funding from the GEF, namely the GEF Small Grants Programme (SGP), which is part of the Strategic Priority on Adaptation (SPA). This supports community-based adaptation (CBA) interventions that increase resilience to the adverse impacts of climate change of vulnerable countries, sectors, and communities. CBA interventions are also funded by the two funds managed by GEF that are part of the UNFCCC — the Least Developed Countries Fund and the Special Climate Change Fund.
x Watershed management and pollution related - The GEF International Waters programme provides funding to improve the management of trans-boundary water systems and increase multistate cooperation in reducing coastal pollution (and rebuild marine fisheries). Another GEF programme, the Land Degradation Strategy, can also contribute to improving coral reef ecosystems through the management of land-use practices and watersheds.
x Biodiversity-related funding - The GEF is one of the main sources of explicit biodiversity funding, for the conservation and sustainable use of biodiversity and the maintenance of ecosystem goods and services both within and outside of (marine) protected areas. This funding is also available to strengthen management and capacity building related to ecosystem conservation.
x Development-related funding – available from a mix of bilateral aid agencies and multilateral agencies including the World Bank. Such funding is suitable for capacity building and environmental education needs in national and regional action plans for coral reefs but also qualifies for use as part of coastal management programmes within agreed development plans. Protection of coral reef ecosystems should be written into the national development plans of coral reef nations.
2. Innovative and Market-based funding sources: x Payments for ecosystem services (PES) schemes for tropical coastal ecosystems including REDD-type
approaches for coastal carbon sink ecosystems associated with coral reefs such as mangrove forests and sea-grass beds (blue carbon initiatives).
x Establishment of dedicated national level Trust Funds for protected area management, enabled through legislation to generate revenue from various economic instruments and from trust fund financing from donors to launch the fund and then supplemented through other mechanisms including those below.
x Revenue through direct user fees for access to on-site benefits in marine parks and reserves or through stakeholder taxes for coastal zone access.
x The use of environmental bonds for climate resilience and adaptation projects such as the World Bank Green Bond or the Great Barrier Reef Foundation’s Coral Reef Bond.
x Private sector partnerships such as Marine Conservation Agreements (MCAs) including private marine parks that may involve compensation for local resource users, or self-financing Marine Protected Areas.
x Polluter pays principle (PPP) for both chronic and acute pollution of coral reef ecosystems, incorporating upstream polluters in watersheds or in neighbouring coastal countries.
x Other fees or green taxes that would specifically generate money to capitalise the funds. Of the above categories the climate change adaptation funds will be a key target for enhancing coral reef resilience and enabling social adaptation over the long-term. Other forms of funding which are more market-based, such as PES or blue carbon schemes are currently in their infancy but are also expected to provide significant funding within the next decade.
44
135. As well as core biodiversity budgets, potential sources of finance include: x Other government budgets – e.g. for agriculture, fisheries, water resources, infrastructure (e.g.
flood and coastal defences); x Subsidy reforms – e.g. redirecting agriculture and fisheries subsidies to natural resource
management; x International development finance; x Governments in other countries; x Debt relief; x NGOs and civil society organisations; x Businesses; x Consumers/ product markets – e.g. through charges and product certification schemes; x PES schemes; x Taxes, charges and fiscal reforms; and x Funding mechanisms for climate change.
5.4 Benefits of meeting the Aichi Biodiversity Targets
136. The assessment has examined the resources required to deliver the Aichi Biodiversity Targets. The analyses demonstrate that halting biodiversity loss requires a substantial increase in the resources devoted to conservation activities, both to fund investments that will deliver long-term benefits for biodiversity and to finance recurrent expenditures to maintain natural capital and to prevent further losses. 137. It is clear that investment in ‘natural capital’ will deliver significant co-benefits for sustainable development. For example, restoration of ecosystems such as mangroves, wetlands and reefs can deliver significant livelihood benefits to local communities and improve resilience and adaptation to climate change. At a global scale, reforestation and restoration are a cost-effective form of climate change mitigation and adaptation. Restored forest ecosystems will add to the productivity of sustainable agriculture as well as to improve upstream supplies of freshwater by facilitating nutrient and freshwater cycling and by preventing soil erosion. Sustainability of ocean fisheries will be enhanced by increases in Marine Protected Areas. It is thus important that Aichi Biodiversity Target expenditures are recognised as part of such wider investment needs for promoting sustainable development. 138. Part of the underlying rationale for the Strategic Plan for Biodiversity and the Aichi Biodiversity Targets is that “Biological diversity underpins ecosystem functioning and the provision of ecosystem services essential for human well-being. It provides for food security, human health, the provision of clean air and water; it contributes to local livelihoods, and economic development, and is essential for the achievement of the Millennium Development Goals, including poverty reduction.”
139. While focusing on the resources required to meet the Aichi Biodiversity Targets, the individual cluster assessments highlight the significant range of benefits to people and the economy that will be delivered by achieving the Targets. 140. Mobilising the resources required to meet the Targets will be necessary in securing the many benefits that biodiversity provides. While this assessment has focused on the resources required to meet the Targets, rather than the benefits of action, presentation and discussion of estimated needs for investment and ongoing expenditures should not lose sight of the benefits that mobilising the required resources will deliver. 141. Global estimates have provoked much debate, but nevertheless emphasize the immense value that biodiversity and ecosystems provide to human well-being. For example, Balmford et al (2002)
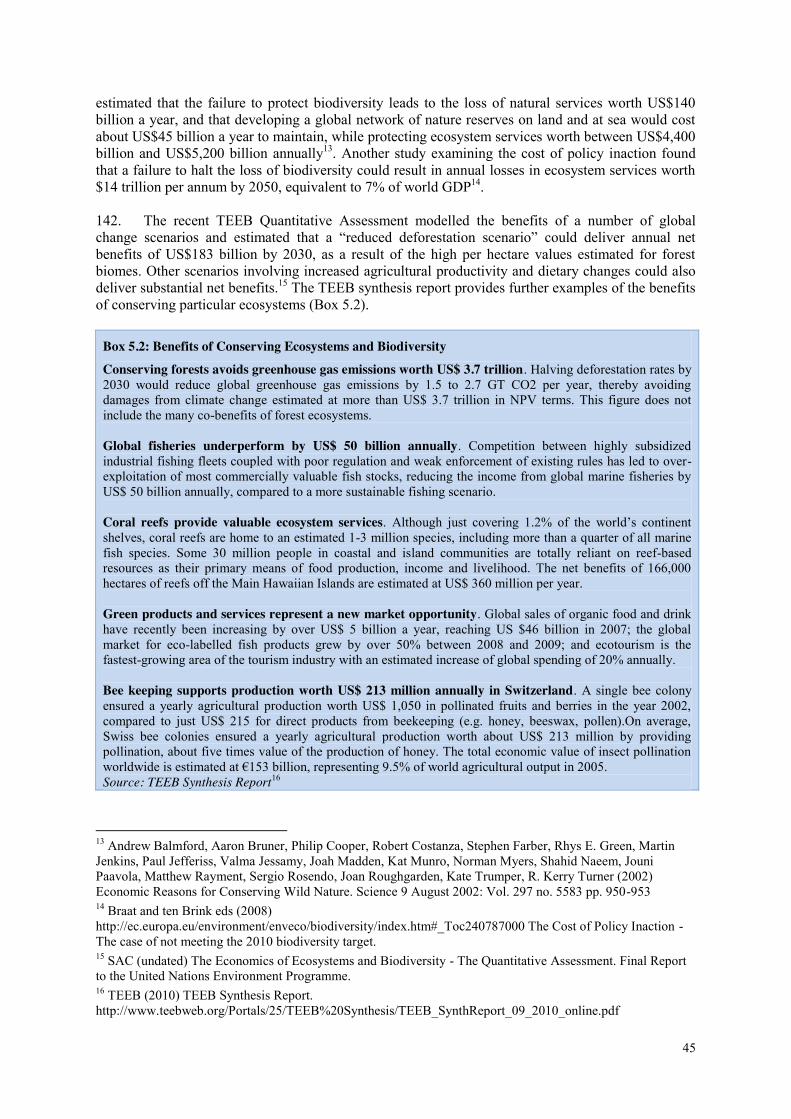
45
estimated that the failure to protect biodiversity leads to the loss of natural services worth US$140 billion a year, and that developing a global network of nature reserves on land and at sea would cost about US$45 billion a year to maintain, while protecting ecosystem services worth between US$4,400 billion and US$5,200 billion annually13. Another study examining the cost of policy inaction found that a failure to halt the loss of biodiversity could result in annual losses in ecosystem services worth $14 trillion per annum by 2050, equivalent to 7% of world GDP14. 142. The recent TEEB Quantitative Assessment modelled the benefits of a number of global change scenarios and estimated that a “reduced deforestation scenario” could deliver annual net benefits of US$183 billion by 2030, as a result of the high per hectare values estimated for forest biomes. Other scenarios involving increased agricultural productivity and dietary changes could also deliver substantial net benefits.15 The TEEB synthesis report provides further examples of the benefits of conserving particular ecosystems (Box 5.2).
Box 5.2: Benefits of Conserving Ecosystems and Biodiversity
Conserving forests avoids greenhouse gas emissions worth US$ 3.7 trillion. Halving deforestation rates by 2030 would reduce global greenhouse gas emissions by 1.5 to 2.7 GT CO2 per year, thereby avoiding damages from climate change estimated at more than US$ 3.7 trillion in NPV terms. This figure does not include the many co-benefits of forest ecosystems. Global fisheries underperform by US$ 50 billion annually. Competition between highly subsidized industrial fishing fleets coupled with poor regulation and weak enforcement of existing rules has led to over-exploitation of most commercially valuable fish stocks, reducing the income from global marine fisheries by US$ 50 billion annually, compared to a more sustainable fishing scenario. Coral reefs provide valuable ecosystem services. Although just covering 1.2% of the world’s continent shelves, coral reefs are home to an estimated 1-3 million species, including more than a quarter of all marine fish species. Some 30 million people in coastal and island communities are totally reliant on reef-based resources as their primary means of food production, income and livelihood. The net benefits of 166,000 hectares of reefs off the Main Hawaiian Islands are estimated at US$ 360 million per year. Green products and services represent a new market opportunity. Global sales of organic food and drink have recently been increasing by over US$ 5 billion a year, reaching US $46 billion in 2007; the global market for eco-labelled fish products grew by over 50% between 2008 and 2009; and ecotourism is the fastest-growing area of the tourism industry with an estimated increase of global spending of 20% annually. Bee keeping supports production worth US$ 213 million annually in Switzerland. A single bee colony ensured a yearly agricultural production worth US$ 1,050 in pollinated fruits and berries in the year 2002, compared to just US$ 215 for direct products from beekeeping (e.g. honey, beeswax, pollen).On average, Swiss bee colonies ensured a yearly agricultural production worth about US$ 213 million by providing pollination, about five times value of the production of honey. The total economic value of insect pollination worldwide is estimated at €153 billion, representing 9.5% of world agricultural output in 2005. Source: TEEB Synthesis Report16
13 Andrew Balmford, Aaron Bruner, Philip Cooper, Robert Costanza, Stephen Farber, Rhys E. Green, Martin Jenkins, Paul Jefferiss, Valma Jessamy, Joah Madden, Kat Munro, Norman Myers, Shahid Naeem, Jouni Paavola, Matthew Rayment, Sergio Rosendo, Joan Roughgarden, Kate Trumper, R. Kerry Turner (2002) Economic Reasons for Conserving Wild Nature. Science 9 August 2002: Vol. 297 no. 5583 pp. 950-953 14 Braat and ten Brink eds (2008) http://ec.europa.eu/environment/enveco/biodiversity/index.htm#_Toc240787000 The Cost of Policy Inaction - The case of not meeting the 2010 biodiversity target. 15 SAC (undated) The Economics of Ecosystems and Biodiversity - The Quantitative Assessment. Final Report to the United Nations Environment Programme. 16 TEEB (2010) TEEB Synthesis Report. http://www.teebweb.org/Portals/25/TEEB%20Synthesis/TEEB_SynthReport_09_2010_online.pdf
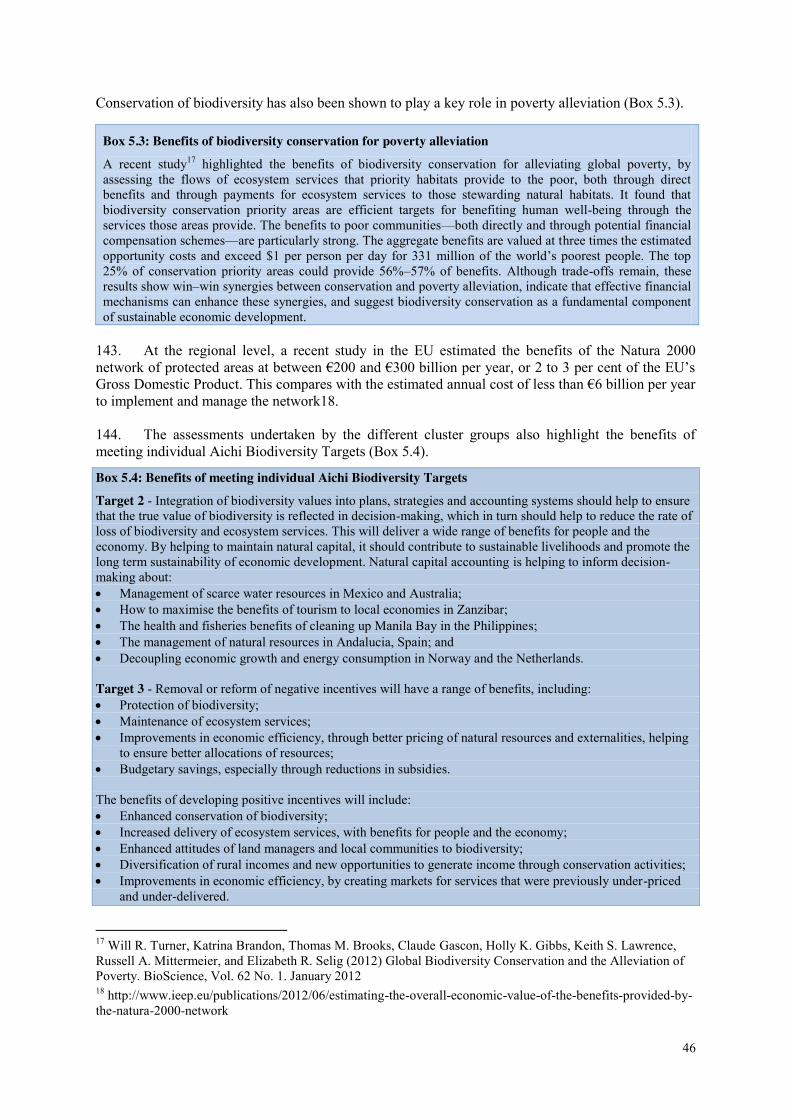
46
Conservation of biodiversity has also been shown to play a key role in poverty alleviation (Box 5.3).
Box 5.3: Benefits of biodiversity conservation for poverty alleviation
A recent study17 highlighted the benefits of biodiversity conservation for alleviating global poverty, by assessing the flows of ecosystem services that priority habitats provide to the poor, both through direct benefits and through payments for ecosystem services to those stewarding natural habitats. It found that biodiversity conservation priority areas are efficient targets for benefiting human well-being through the services those areas provide. The benefits to poor communities—both directly and through potential financial compensation schemes—are particularly strong. The aggregate benefits are valued at three times the estimated opportunity costs and exceed $1 per person per day for 331 million of the world’s poorest people. The top 25% of conservation priority areas could provide 56%–57% of benefits. Although trade-offs remain, these results show win–win synergies between conservation and poverty alleviation, indicate that effective financial mechanisms can enhance these synergies, and suggest biodiversity conservation as a fundamental component of sustainable economic development.
143. At the regional level, a recent study in the EU estimated the benefits of the Natura 2000 network of protected areas at between €200 and €300 billion per year, or 2 to 3 per cent of the EU’s Gross Domestic Product. This compares with the estimated annual cost of less than €6 billion per year to implement and manage the network18. 144. The assessments undertaken by the different cluster groups also highlight the benefits of meeting individual Aichi Biodiversity Targets (Box 5.4).
Box 5.4: Benefits of meeting individual Aichi Biodiversity Targets
Target 2 - Integration of biodiversity values into plans, strategies and accounting systems should help to ensure that the true value of biodiversity is reflected in decision-making, which in turn should help to reduce the rate of loss of biodiversity and ecosystem services. This will deliver a wide range of benefits for people and the economy. By helping to maintain natural capital, it should contribute to sustainable livelihoods and promote the long term sustainability of economic development. Natural capital accounting is helping to inform decision-making about: x Management of scarce water resources in Mexico and Australia; x How to maximise the benefits of tourism to local economies in Zanzibar; x The health and fisheries benefits of cleaning up Manila Bay in the Philippines; x The management of natural resources in Andalucia, Spain; and x Decoupling economic growth and energy consumption in Norway and the Netherlands. Target 3 - Removal or reform of negative incentives will have a range of benefits, including: x Protection of biodiversity; x Maintenance of ecosystem services; x Improvements in economic efficiency, through better pricing of natural resources and externalities, helping
to ensure better allocations of resources; x Budgetary savings, especially through reductions in subsidies. The benefits of developing positive incentives will include: x Enhanced conservation of biodiversity; x Increased delivery of ecosystem services, with benefits for people and the economy; x Enhanced attitudes of land managers and local communities to biodiversity; x Diversification of rural incomes and new opportunities to generate income through conservation activities; x Improvements in economic efficiency, by creating markets for services that were previously under-priced
and under-delivered.
17 Will R. Turner, Katrina Brandon, Thomas M. Brooks, Claude Gascon, Holly K. Gibbs, Keith S. Lawrence, Russell A. Mittermeier, and Elizabeth R. Selig (2012) Global Biodiversity Conservation and the Alleviation of Poverty. BioScience, Vol. 62 No. 1. January 2012 18 http://www.ieep.eu/publications/2012/06/estimating-the-overall-economic-value-of-the-benefits-provided-by-the-natura-2000-network
47
Target 4 - Implementation of plans for sustainable consumption and production will have a range of benefits, including: x Environmental benefits: more efficient use of natural resources, reduced pollution, enhanced conservation
of biodiversity, and maintenance of ecosystem services. x Social benefits: improved quality of life, meeting the basic needs, creating jobs and contributing to poverty
alleviation. According to the 2011 Human Development Report, unless SCP is achieved, there will be no further increase in the Human Development Index of some developing from 2030 onwards.
x Economic benefits: wide potential for increases in resource productivity, and as a consequence, for reductions in production costs - enabling business to "do more with less".
Target 5 - Wetland conservation protects a wide range of ecosystem services including flood control, recreational and commercial fisheries, wildlife watching, hunting, amenities, habitat and storm protection. The economic value of these ecosystem services could be expected to range between US$125 and US$2,156 per hectare per year and enhance policy objectives related to coastal zone management, water quality, water infrastructure, climate and recreation. Protection of wetlands could involve annual savings in expenditures on dams of US$5.7 billion and in other public water infrastructure of US$11.4 billion globally.
Target 6 - Society is expected to gain from sustainably managing global fisheries through increases in resource rent, with an estimated total net present value of US$ 125 billion by 2020 (central estimate). The full benefits of rebuilding fish stocks would not be realized for several decades. The long-term (2013 – 2050) gain in resource rent is estimated to have a net present value of US $1,076.5 billion, yielding a long-term benefit-to-cost ratio of 4.3 (central estimates).
Target 7 - Benefits of sustainable aquaculture include: x Enhanced incomes for producers - integrated systems often have a higher profitability than monoculture
systems, due to increased efficiency, better survival rates and increased revenue. x Improved resilience - integrated systems are better able to cope with market fluctuations and failures in
production, and are more resilient to disease than single species aquaculture. x Ecosystem services - mangrove forests provide at least US$1.6 billion per year in ecosystem services
worldwide, and it is estimated that almost 80% of global fish catches are directly or indirectly dependent on mangroves. Aquaculture that has minimum impact on mangroves, or even restores mangrove forest for biofiltration purposes, enhances ecosystem service delivery.
x Increase in global food supplies and employment - sustainable aquaculture can deliver increased supplies of seafood to meet the needs of a growing human populations, increased economic growth, employment, and relaxation of fishing pressure.
Target 8 - Addressing nutrient and marine pollution lowers the costs of treating water, increases recreational opportunities, improves fish habitat and health, increases property values, avoids costs associated with dredging and finding water supply substitutes, and increases aesthetic and existence values for biodiversity. A recent report estimated that eliminating marine debris would lead to an avoided cost of $1.27 billion per year. Studies in the US have shown that green stormwater controls provide substantially higher benefits than traditional storm-water controls. Benefits of wastewater treatment include time savings associated with better water access, improved human health and increase in productivity, and value of prevented deaths. One study estimated that every dollar spent on improving sanitation generates an average economic benefit of US$8.5, suggesting that the investments estimated in this assessment could bring global economic benefits of US$1.88–$2.87 billion USD per year. Air pollution control brings benefits by reducing premature deaths and illness, and improvements in visibility, commercial timber, agriculture, recreational fishing, and materials damage. In the US, each dollar spent on reducing air pollution results in an economic benefit of $30.
Target 9 - Meeting this Target would substantially reduce the total economic cost of damage caused by invasive alien species, which is estimated at 2-5% of world GDP, or approximately US$2.6 to 6.5 trillion per annum. There would be benefits to many sectors such as agriculture, forestry and fisheries as well as to biodiversity and the environment. IAS control offers substantial opportunities for job creation and poverty alleviation. Early action against IAS can significantly reduce overall control costs.
Target 10 - In the city of Xiamen, China, socioeconomic benefits of integrated coastal management based on estimated incremental revenues in ports and shipping, marine fisheries and tourism, real estate and property development and direct nature and environmental services were estimated to be $3.6 billion in 2006, delivering a benefit-cost ratio of more than 15. Locally managed marine area initiatives, mainly in the Western Pacific, have been shown to deliver a range of benefits including biodiversity conservation, enhanced fish catches, improved community organisation and local governance, enhanced stewardship of natural resources, enhanced social and human capital, and security of tenure. Improving the status of coral reefs has been shown to enhance
48
fisheries catches and incomes, safeguard biodiversity and rebuild marine resource populations and biomass, strengthen coastal communities, reduce food insecurity, address poverty and health issues, and benefit coastal tourism.
Target 11 - Developing effective networks of protected areas would deliver considerable co-benefits, including major contributions to (a) conservation of genes, populations, species and ecosystems; (b) climate change mitigation (through reducing emissions from habitat conversion and degradation); (c) climate change adaptation (through conserving intact habitats to facilitate accommodation and resilience of biodiversity, and through contributing to ecosystem-based adaptation for people); (d) safeguarding the delivery of a range of other ecosystem services (for both proximate and distant beneficiaries), including, for example, human health (e.g. through medicinal plants), agriculture (e.g. through pollination), forestry (e.g. through ensuring sustainable yields), food security, energy security, water security (e.g. through watershed protection and hydrological regulation) etc. No-take marine protected areas (MPAs) have been shown to offer numerous benefits that most other marine conservation strategies cannot claim. They include: x Preservation of representative samples of biological diversity; x Protection of critical sites for reproduction and growth of species; x Protection of sites with minimal direct human stress to maximise their resilience or self-repair from other
stresses such as increased ocean temperature; x Settlement and growth areas providing spill-over recruitment to fished stocks in adjacent areas; x Focal points for education about the nature of marine ecosystems and human interactions with them; x Sites for nature-based recreation and tourism; and x Undisturbed control or reference sites serving as a baseline for scientific research and for design and
evaluation of management of other areas. Target 12 - Conservation of species – as well as preserving essential intrinsic values – may be important for providing ecosystem services such as food (e.g. wild relatives of crop or livestock species), medicine (many threatened plant species), pest control (e.g. mammalian predators of rats, avian predators of pest insects), pollination (e.g. wild bee species), seed-dispersal (e.g. granivorous birds), nutrient recycling (e.g. Asian vultures) and cultural services (e.g. aesthetic and existence values and eco-tourism - especially for charismatic species). Species conservation also contributes to wider ecosystem services through the management of ecosystems on which species depend.
Target 13 - Genetic diversity is an international public good and the benefits of conservation extend well beyond national boundaries. Plant and animal genetic resources for food and agriculture provide the biological basis for agricultural production and world food security. Plant genetic resources are critical raw material for farmers and for plant breeders. The genetic diversity in these resources allows crops and varieties to adapt to ever-changing conditions and to overcome the constraints caused by pests, diseases and abiotic stresses.
Targets 14, 15 - Wetland, forest, and coral reef restoration enhances a wide range of ecosystem services associated with cleaning and purifying water, regulating floods, sequestering carbon, producing food and medicines, pollination and a wide range of cultural and recreational uses. One example determined that each hectare of wetlands restored in the Mississippi Alluvial Valley could be expected to generate services worth at least US$1,435 to US$1,486 per year in terms of carbon mitigation, nitrogen mitigation, and waterfowl recreation services, enabling wetland restoration costs to be fully recouped in just two years.
Target 16 - By enhancing legal certainty and promoting benefit-sharing, the Nagoya Protocol encourages the advancement of research on genetic resources which could lead to new discoveries for the benefit of all. It creates incentives to conserve and sustainably use genetic resources, and thereby enhances the contribution of biodiversity to development and human well-being. By setting-out clear provisions on access to traditional knowledge associated with genetic resources, it will assist in strengthening the ability of indigenous and local communities to benefit from the use of their knowledge, innovations and practices. It will also provide incentives for the promotion and protection of traditional knowledge by encouraging the development of community protocols, minimum requirements for mutually agreed terms and model contractual clauses related to access and benefit-sharing of traditional knowledge associated with genetic resources.
Target 17 - NBSAPs, when well designed and implemented, provide an overall framework for national implementation of the three objectives of the Convention, through actions for the conservation and sustainable use of biodiversity, and fair and equitable sharing of benefits arising from the utilization of genetic resources. They can serve as a key element in national and sub-national policy development and planning processes and
49
could result in demonstrable mainstreaming of biodiversity concerns at all levels. Hence, in principle they have the potential to form part of a country’s overall sustainable development and poverty alleviation strategies.
Target 18 - There is a growing appreciation of the value of traditional knowledge. This knowledge is valuable not only to those who depend on it in their daily lives, but to modern industry and agriculture as well. Many widely used products, such as plant-based medicines, health products and cosmetics, are derived from traditional knowledge. Other valuable products based on traditional knowledge include agricultural and non-wood forest products as well as handicraft. The skills and techniques of indigenous communities provide valuable information to the global community and a useful model for biodiversity policies.
Target 20 - Where Target 20 is met, proactive and strategic measures can be readily taken to conserve, sustainably use and fairly and equitably access and share the benefits of biological resources. Through better funding for biodiversity, the achievement of the Target will contribute to sustainable development and the well-being of society as a whole. Source: Cluster reports 145. Although it is clear that significant national and international investments will be required to meet the Targets, evidence from other studies indicates that the scale of the benefits that would be provided to the economy and society at local, regional and national levels are likely to be significantly greater, and should outweigh these resource requirements. Existing evidence therefore suggests that benefits are likely significantly to outweigh costs. Furthermore, without immediate action, the social and economic costs of biodiversity loss and the loss of ecosystem services will be felt at an accelerating rate in the future and will limit growth and stability. Investments made now will reduce resource requirements in the future.
50
VI. CONCLUSIONS AND NEXT STEPS
146. This section makes recommendations on potential next steps, including further work that might be considered useful to be conducted after COP 11 to assist the Conference of Parties to understand the required level of investment and ongoing costs to implement and meet the Aichi Biodiversity Targets; and to feed into the ongoing work to implement the Strategy for Resource Mobilisation. 147. The estimates of resource requirements made by the High-Level Panel are preliminary and are presented with caveats. For example, it has only been possible to conduct a ‘static assessment’ of resource needs across Targets. Although overlaps have been considered as far as possible to avoid double counting, the relationships between Targets have not been explored. In addition, the work of the Panel has not included a quantitative assessment of benefits. Further research and analysis will be needed to help further develop and refine these estimates. 148. Over the coming years, further assessments of resources required to meet the Aichi Biodiversity Targets would be useful as part of an ongoing process to improve data availability and comparability of actions and activities undertaken and those required in the future to meet the Targets. Such assessments could also be useful tools to track and monitor progress in achieving the goals of the Strategic Plan for Biodiversity 2011-2020. 149. There are a number of ways further research could be undertaken to strengthen the data and estimated resource requirements for achieving the Aichi Biodiversity Targets. 150. Firstly, further research could be undertaken to further develop and refine the current estimates to:
x Address gaps in coverage of the Target clusters that were established for the underpinning research for this assessment.
x Address gaps in information and data highlighted by Target-by-Target assessments and by the aggregated assessment.
151. Secondly, given the limited time and resources available for this study, future areas of work that build on this assessment could include:
x A comprehensive global assessment involving wider stakeholder consultation and input, including information on
o baselines (i.e. current levels of expenditure on the Aichi Biodiversity Targets in order to accurately gauge what is ‘additional’ expenditure);
o prioritisation of Targets rather than a static assessment (i.e. dynamic assessment); o comprehensive analysis of the benefits of meeting the Aichi Biodiversity Targets; o potential sources of additional finance - including through other policy areas; and o country-by-country analyses (“bottom-up approach”) such as those proposed by the
UNDP and the CBD Secretariat on resources required to achieve the Targets. x An assessment of actions and costs necessary to establish the right policy framework and
transformational actions required at the national and regional levels, such as: o policy development; o environmental governance; o institutional and national planning reforms to achieve conservation and biodiversity
goals and targets; o opportunities for mainstreaming biodiversity.
x Further exploration to understand inter-linkages and co-dependencies across Targets and between Targets and policy goals for poverty alleviation, human health, agriculture, freshwater, desertification, fisheries, etc, to prioritise action.
x Support at the national level to:
51
o identify the need for further investment and progress on country level financial needs assessments;
o support revision of National Biodiversity Strategies and Action Plans; o identify opportunities to direct resources and further support.
152. The Panel also recognises that a key underlying driver to biodiversity loss is climate change. While this has not been referred to specifically in this assessment, further research could be useful into the extent to which actions to support the achievement of the Aichi Biodiversity Targets can be integrated into large scale programmes and activities underway to mitigate and adapt to the effects of climate change.
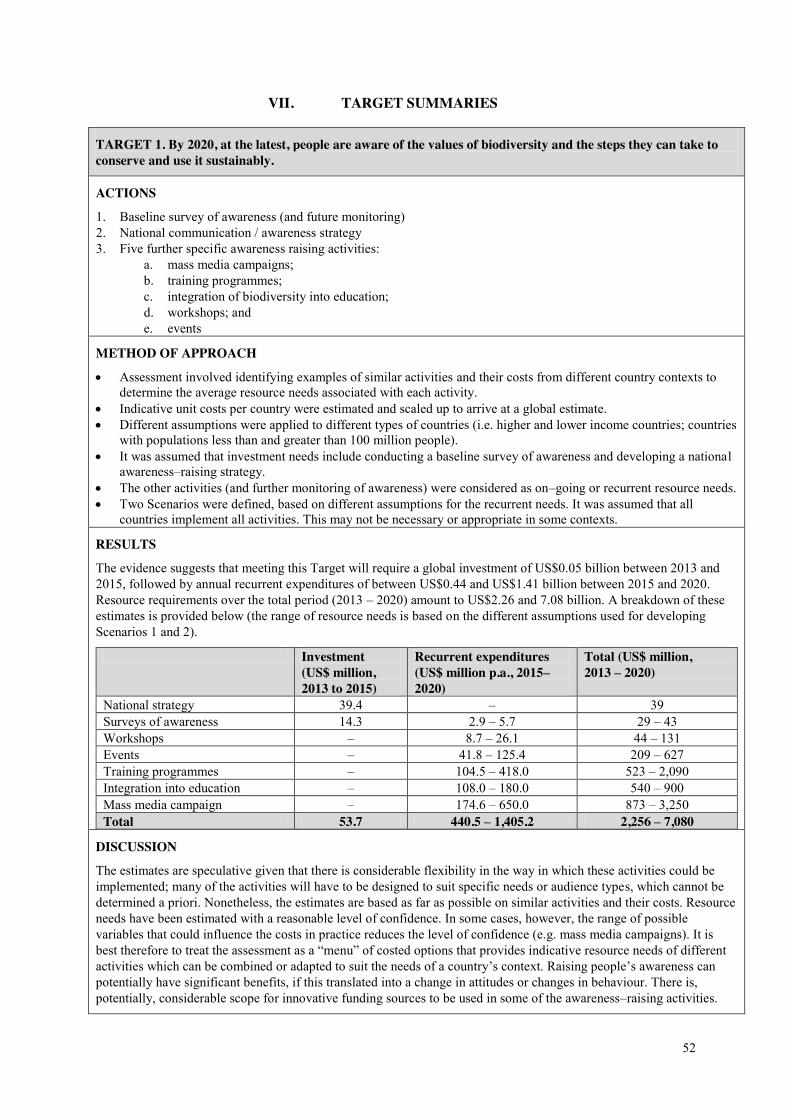
52
VII. TARGET SUMMARIES
TARGET 1. By 2020, at the latest, people are aware of the values of biodiversity and the steps they can take to conserve and use it sustainably.
ACTIONS
1. Baseline survey of awareness (and future monitoring) 2. National communication / awareness strategy 3. Five further specific awareness raising activities:
a. mass media campaigns; b. training programmes; c. integration of biodiversity into education; d. workshops; and e. events
METHOD OF APPROACH
x Assessment involved identifying examples of similar activities and their costs from different country contexts to determine the average resource needs associated with each activity.
x Indicative unit costs per country were estimated and scaled up to arrive at a global estimate. x Different assumptions were applied to different types of countries (i.e. higher and lower income countries; countries
with populations less than and greater than 100 million people). x It was assumed that investment needs include conducting a baseline survey of awareness and developing a national
awareness–raising strategy. x The other activities (and further monitoring of awareness) were considered as on–going or recurrent resource needs. x Two Scenarios were defined, based on different assumptions for the recurrent needs. It was assumed that all
countries implement all activities. This may not be necessary or appropriate in some contexts.
RESULTS
The evidence suggests that meeting this Target will require a global investment of US$0.05 billion between 2013 and 2015, followed by annual recurrent expenditures of between US$0.44 and US$1.41 billion between 2015 and 2020. Resource requirements over the total period (2013 – 2020) amount to US$2.26 and 7.08 billion. A breakdown of these estimates is provided below (the range of resource needs is based on the different assumptions used for developing Scenarios 1 and 2).
Investment (US$ million, 2013 to 2015)
Recurrent expenditures (US$ million p.a., 2015–2020)
Total (US$ million, 2013 – 2020)
National strategy 39.4 – 39 Surveys of awareness 14.3 2.9 – 5.7 29 – 43 Workshops – 8.7 – 26.1 44 – 131 Events – 41.8 – 125.4 209 – 627 Training programmes – 104.5 – 418.0 523 – 2,090 Integration into education – 108.0 – 180.0 540 – 900 Mass media campaign – 174.6 – 650.0 873 – 3,250 Total 53.7 440.5 – 1,405.2 2,256 – 7,080
DISCUSSION
The estimates are speculative given that there is considerable flexibility in the way in which these activities could be implemented; many of the activities will have to be designed to suit specific needs or audience types, which cannot be determined a priori. Nonetheless, the estimates are based as far as possible on similar activities and their costs. Resource needs have been estimated with a reasonable level of confidence. In some cases, however, the range of possible variables that could influence the costs in practice reduces the level of confidence (e.g. mass media campaigns). It is best therefore to treat the assessment as a “menu” of costed options that provides indicative resource needs of different activities which can be combined or adapted to suit the needs of a country’s context. Raising people’s awareness can potentially have significant benefits, if this translated into a change in attitudes or changes in behaviour. There is, potentially, considerable scope for innovative funding sources to be used in some of the awareness–raising activities.
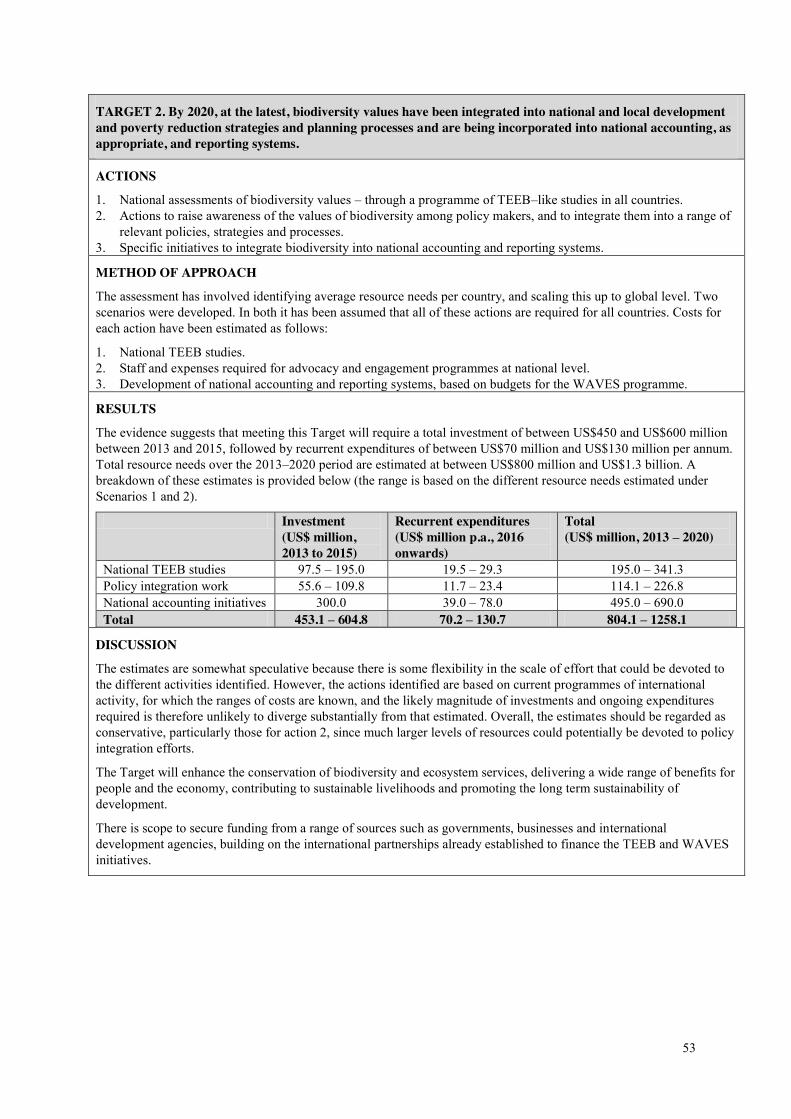
53
TARGET 2. By 2020, at the latest, biodiversity values have been integrated into national and local development and poverty reduction strategies and planning processes and are being incorporated into national accounting, as appropriate, and reporting systems.
ACTIONS
1. National assessments of biodiversity values – through a programme of TEEB–like studies in all countries. 2. Actions to raise awareness of the values of biodiversity among policy makers, and to integrate them into a range of
relevant policies, strategies and processes. 3. Specific initiatives to integrate biodiversity into national accounting and reporting systems.
METHOD OF APPROACH
The assessment has involved identifying average resource needs per country, and scaling this up to global level. Two scenarios were developed. In both it has been assumed that all of these actions are required for all countries. Costs for each action have been estimated as follows:
1. National TEEB studies. 2. Staff and expenses required for advocacy and engagement programmes at national level. 3. Development of national accounting and reporting systems, based on budgets for the WAVES programme.
RESULTS
The evidence suggests that meeting this Target will require a total investment of between US$450 and US$600 million between 2013 and 2015, followed by recurrent expenditures of between US$70 million and US$130 million per annum. Total resource needs over the 2013–2020 period are estimated at between US$800 million and US$1.3 billion. A breakdown of these estimates is provided below (the range is based on the different resource needs estimated under Scenarios 1 and 2).
Investment (US$ million, 2013 to 2015)
Recurrent expenditures (US$ million p.a., 2016 onwards)
Total (US$ million, 2013 – 2020)
National TEEB studies 97.5 – 195.0 19.5 – 29.3 195.0 – 341.3 Policy integration work 55.6 – 109.8 11.7 – 23.4 114.1 – 226.8 National accounting initiatives 300.0 39.0 – 78.0 495.0 – 690.0 Total 453.1 – 604.8 70.2 – 130.7 804.1 – 1258.1
DISCUSSION
The estimates are somewhat speculative because there is some flexibility in the scale of effort that could be devoted to the different activities identified. However, the actions identified are based on current programmes of international activity, for which the ranges of costs are known, and the likely magnitude of investments and ongoing expenditures required is therefore unlikely to diverge substantially from that estimated. Overall, the estimates should be regarded as conservative, particularly those for action 2, since much larger levels of resources could potentially be devoted to policy integration efforts.
The Target will enhance the conservation of biodiversity and ecosystem services, delivering a wide range of benefits for people and the economy, contributing to sustainable livelihoods and promoting the long term sustainability of development.
There is scope to secure funding from a range of sources such as governments, businesses and international development agencies, building on the international partnerships already established to finance the TEEB and WAVES initiatives.
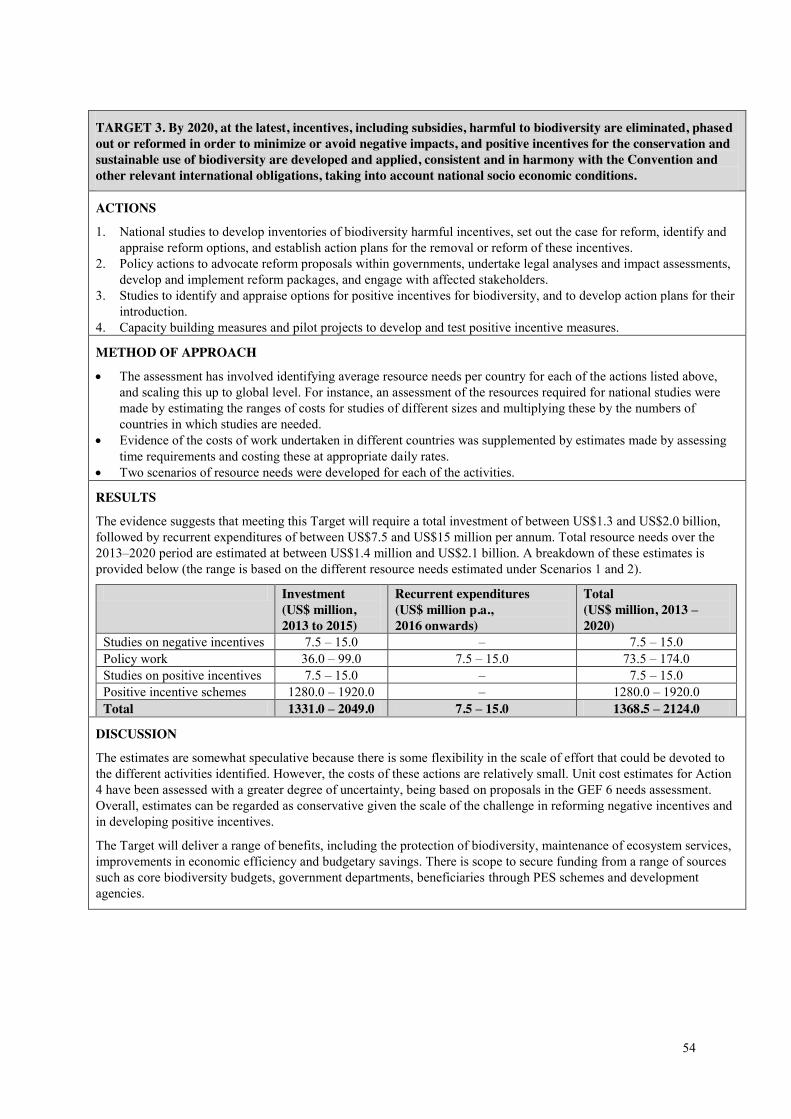
54
TARGET 3. By 2020, at the latest, incentives, including subsidies, harmful to biodiversity are eliminated, phased out or reformed in order to minimize or avoid negative impacts, and positive incentives for the conservation and sustainable use of biodiversity are developed and applied, consistent and in harmony with the Convention and other relevant international obligations, taking into account national socio economic conditions.
ACTIONS
1. National studies to develop inventories of biodiversity harmful incentives, set out the case for reform, identify and appraise reform options, and establish action plans for the removal or reform of these incentives.
2. Policy actions to advocate reform proposals within governments, undertake legal analyses and impact assessments, develop and implement reform packages, and engage with affected stakeholders.
3. Studies to identify and appraise options for positive incentives for biodiversity, and to develop action plans for their introduction.
4. Capacity building measures and pilot projects to develop and test positive incentive measures.
METHOD OF APPROACH
x The assessment has involved identifying average resource needs per country for each of the actions listed above, and scaling this up to global level. For instance, an assessment of the resources required for national studies were made by estimating the ranges of costs for studies of different sizes and multiplying these by the numbers of countries in which studies are needed.
x Evidence of the costs of work undertaken in different countries was supplemented by estimates made by assessing time requirements and costing these at appropriate daily rates.
x Two scenarios of resource needs were developed for each of the activities.
RESULTS
The evidence suggests that meeting this Target will require a total investment of between US$1.3 and US$2.0 billion, followed by recurrent expenditures of between US$7.5 and US$15 million per annum. Total resource needs over the 2013–2020 period are estimated at between US$1.4 million and US$2.1 billion. A breakdown of these estimates is provided below (the range is based on the different resource needs estimated under Scenarios 1 and 2).
Investment (US$ million, 2013 to 2015)
Recurrent expenditures (US$ million p.a., 2016 onwards)
Total (US$ million, 2013 – 2020)
Studies on negative incentives 7.5 – 15.0 – 7.5 – 15.0 Policy work 36.0 – 99.0 7.5 – 15.0 73.5 – 174.0 Studies on positive incentives 7.5 – 15.0 – 7.5 – 15.0 Positive incentive schemes 1280.0 – 1920.0 – 1280.0 – 1920.0 Total 1331.0 – 2049.0 7.5 – 15.0 1368.5 – 2124.0
DISCUSSION
The estimates are somewhat speculative because there is some flexibility in the scale of effort that could be devoted to the different activities identified. However, the costs of these actions are relatively small. Unit cost estimates for Action 4 have been assessed with a greater degree of uncertainty, being based on proposals in the GEF 6 needs assessment. Overall, estimates can be regarded as conservative given the scale of the challenge in reforming negative incentives and in developing positive incentives.
The Target will deliver a range of benefits, including the protection of biodiversity, maintenance of ecosystem services, improvements in economic efficiency and budgetary savings. There is scope to secure funding from a range of sources such as core biodiversity budgets, government departments, beneficiaries through PES schemes and development agencies.
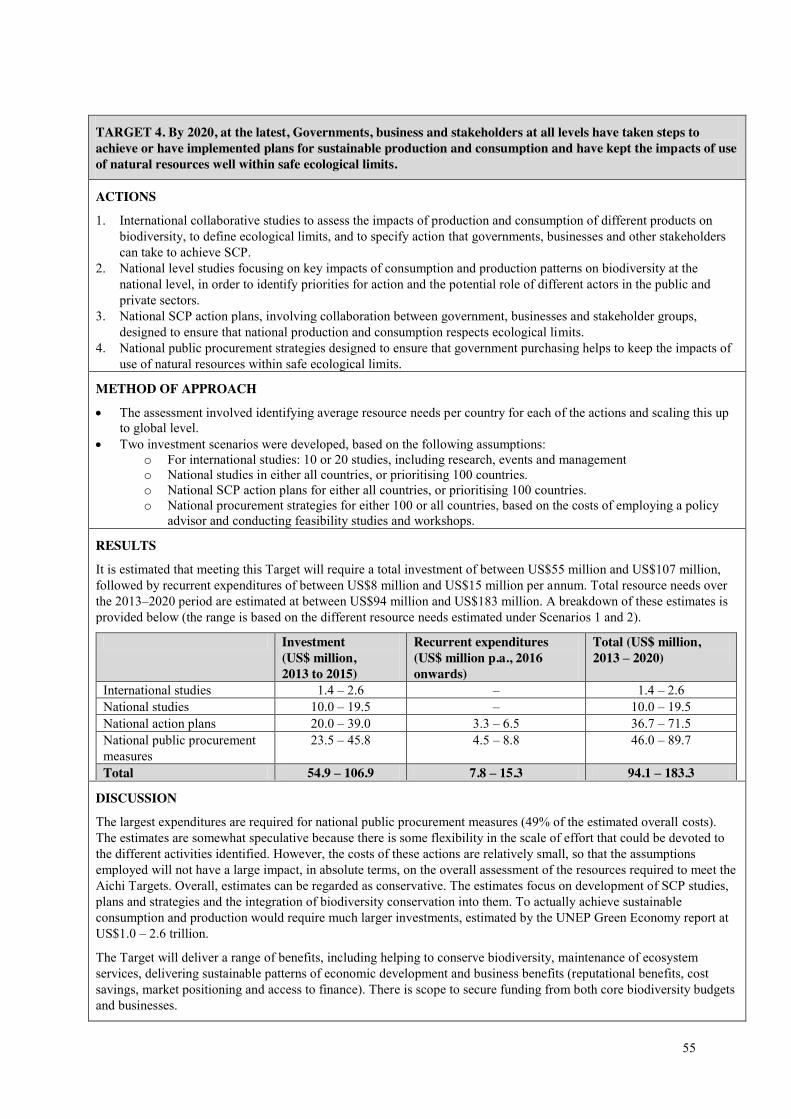
55
TARGET 4. By 2020, at the latest, Governments, business and stakeholders at all levels have taken steps to achieve or have implemented plans for sustainable production and consumption and have kept the impacts of use of natural resources well within safe ecological limits.
ACTIONS
1. International collaborative studies to assess the impacts of production and consumption of different products on biodiversity, to define ecological limits, and to specify action that governments, businesses and other stakeholders can take to achieve SCP.
2. National level studies focusing on key impacts of consumption and production patterns on biodiversity at the national level, in order to identify priorities for action and the potential role of different actors in the public and private sectors.
3. National SCP action plans, involving collaboration between government, businesses and stakeholder groups, designed to ensure that national production and consumption respects ecological limits.
4. National public procurement strategies designed to ensure that government purchasing helps to keep the impacts of use of natural resources within safe ecological limits.
METHOD OF APPROACH
x The assessment involved identifying average resource needs per country for each of the actions and scaling this up to global level.
x Two investment scenarios were developed, based on the following assumptions: o For international studies: 10 or 20 studies, including research, events and management o National studies in either all countries, or prioritising 100 countries. o National SCP action plans for either all countries, or prioritising 100 countries. o National procurement strategies for either 100 or all countries, based on the costs of employing a policy
advisor and conducting feasibility studies and workshops.
RESULTS
It is estimated that meeting this Target will require a total investment of between US$55 million and US$107 million, followed by recurrent expenditures of between US$8 million and US$15 million per annum. Total resource needs over the 2013–2020 period are estimated at between US$94 million and US$183 million. A breakdown of these estimates is provided below (the range is based on the different resource needs estimated under Scenarios 1 and 2).
Investment (US$ million, 2013 to 2015)
Recurrent expenditures (US$ million p.a., 2016 onwards)
Total (US$ million, 2013 – 2020)
International studies 1.4 – 2.6 – 1.4 – 2.6 National studies 10.0 – 19.5 – 10.0 – 19.5 National action plans 20.0 – 39.0 3.3 – 6.5 36.7 – 71.5 National public procurement measures
23.5 – 45.8 4.5 – 8.8 46.0 – 89.7
Total 54.9 – 106.9 7.8 – 15.3 94.1 – 183.3
DISCUSSION
The largest expenditures are required for national public procurement measures (49% of the estimated overall costs). The estimates are somewhat speculative because there is some flexibility in the scale of effort that could be devoted to the different activities identified. However, the costs of these actions are relatively small, so that the assumptions employed will not have a large impact, in absolute terms, on the overall assessment of the resources required to meet the Aichi Targets. Overall, estimates can be regarded as conservative. The estimates focus on development of SCP studies, plans and strategies and the integration of biodiversity conservation into them. To actually achieve sustainable consumption and production would require much larger investments, estimated by the UNEP Green Economy report at US$1.0 – 2.6 trillion.
The Target will deliver a range of benefits, including helping to conserve biodiversity, maintenance of ecosystem services, delivering sustainable patterns of economic development and business benefits (reputational benefits, cost savings, market positioning and access to finance). There is scope to secure funding from both core biodiversity budgets and businesses.
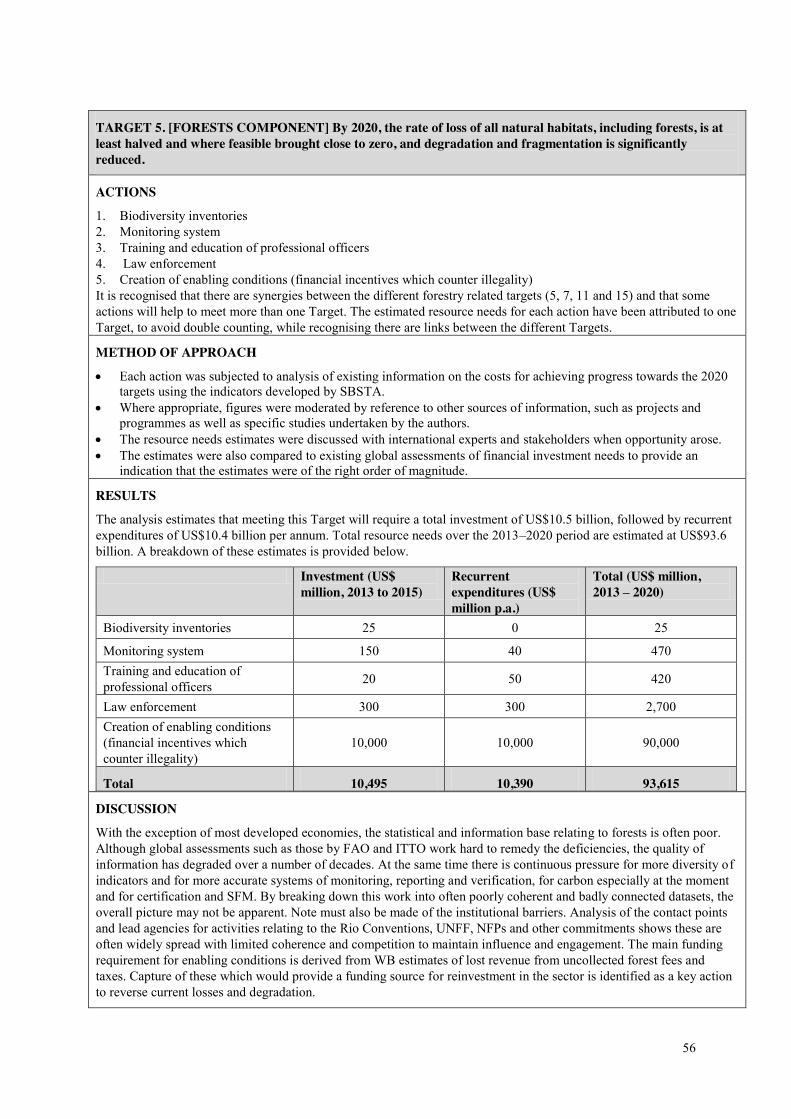
56
TARGET 5. [FORESTS COMPONENT] By 2020, the rate of loss of all natural habitats, including forests, is at least halved and where feasible brought close to zero, and degradation and fragmentation is significantly reduced.
ACTIONS
1. Biodiversity inventories 2. Monitoring system 3. Training and education of professional officers 4. Law enforcement 5. Creation of enabling conditions (financial incentives which counter illegality) It is recognised that there are synergies between the different forestry related targets (5, 7, 11 and 15) and that some actions will help to meet more than one Target. The estimated resource needs for each action have been attributed to one Target, to avoid double counting, while recognising there are links between the different Targets.
METHOD OF APPROACH
x Each action was subjected to analysis of existing information on the costs for achieving progress towards the 2020 targets using the indicators developed by SBSTA.
x Where appropriate, figures were moderated by reference to other sources of information, such as projects and programmes as well as specific studies undertaken by the authors.
x The resource needs estimates were discussed with international experts and stakeholders when opportunity arose. x The estimates were also compared to existing global assessments of financial investment needs to provide an
indication that the estimates were of the right order of magnitude.
RESULTS
The analysis estimates that meeting this Target will require a total investment of US$10.5 billion, followed by recurrent expenditures of US$10.4 billion per annum. Total resource needs over the 2013–2020 period are estimated at US$93.6 billion. A breakdown of these estimates is provided below.
Investment (US$ million, 2013 to 2015)
Recurrent expenditures (US$ million p.a.)
Total (US$ million, 2013 – 2020)
Biodiversity inventories 25 0 25
Monitoring system 150 40 470 Training and education of professional officers 20 50 420
Law enforcement 300 300 2,700 Creation of enabling conditions (financial incentives which counter illegality)
10,000 10,000 90,000
Total 10,495 10,390 93,615
DISCUSSION
With the exception of most developed economies, the statistical and information base relating to forests is often poor. Although global assessments such as those by FAO and ITTO work hard to remedy the deficiencies, the quality of information has degraded over a number of decades. At the same time there is continuous pressure for more diversity of indicators and for more accurate systems of monitoring, reporting and verification, for carbon especially at the moment and for certification and SFM. By breaking down this work into often poorly coherent and badly connected datasets, the overall picture may not be apparent. Note must also be made of the institutional barriers. Analysis of the contact points and lead agencies for activities relating to the Rio Conventions, UNFF, NFPs and other commitments shows these are often widely spread with limited coherence and competition to maintain influence and engagement. The main funding requirement for enabling conditions is derived from WB estimates of lost revenue from uncollected forest fees and taxes. Capture of these which would provide a funding source for reinvestment in the sector is identified as a key action to reverse current losses and degradation.
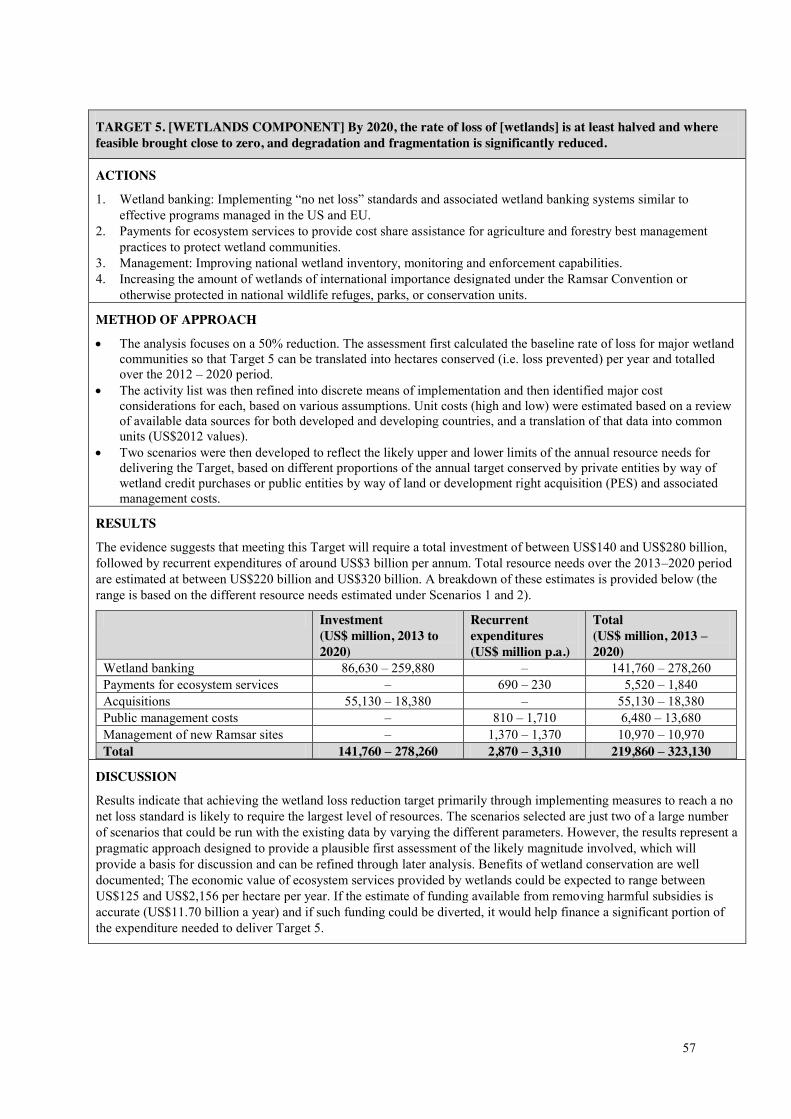
57
TARGET 5. [WETLANDS COMPONENT] By 2020, the rate of loss of [wetlands] is at least halved and where feasible brought close to zero, and degradation and fragmentation is significantly reduced.
ACTIONS
1. Wetland banking: Implementing “no net loss” standards and associated wetland banking systems similar to effective programs managed in the US and EU.
2. Payments for ecosystem services to provide cost share assistance for agriculture and forestry best management practices to protect wetland communities.
3. Management: Improving national wetland inventory, monitoring and enforcement capabilities. 4. Increasing the amount of wetlands of international importance designated under the Ramsar Convention or
otherwise protected in national wildlife refuges, parks, or conservation units.
METHOD OF APPROACH
x The analysis focuses on a 50% reduction. The assessment first calculated the baseline rate of loss for major wetland communities so that Target 5 can be translated into hectares conserved (i.e. loss prevented) per year and totalled over the 2012 – 2020 period.
x The activity list was then refined into discrete means of implementation and then identified major cost considerations for each, based on various assumptions. Unit costs (high and low) were estimated based on a review of available data sources for both developed and developing countries, and a translation of that data into common units (US$2012 values).
x Two scenarios were then developed to reflect the likely upper and lower limits of the annual resource needs for delivering the Target, based on different proportions of the annual target conserved by private entities by way of wetland credit purchases or public entities by way of land or development right acquisition (PES) and associated management costs.
RESULTS
The evidence suggests that meeting this Target will require a total investment of between US$140 and US$280 billion, followed by recurrent expenditures of around US$3 billion per annum. Total resource needs over the 2013–2020 period are estimated at between US$220 billion and US$320 billion. A breakdown of these estimates is provided below (the range is based on the different resource needs estimated under Scenarios 1 and 2).
Investment (US$ million, 2013 to 2020)
Recurrent expenditures (US$ million p.a.)
Total (US$ million, 2013 – 2020)
Wetland banking 86,630 – 259,880 – 141,760 – 278,260 Payments for ecosystem services – 690 – 230 5,520 – 1,840 Acquisitions 55,130 – 18,380 – 55,130 – 18,380 Public management costs – 810 – 1,710 6,480 – 13,680 Management of new Ramsar sites – 1,370 – 1,370 10,970 – 10,970 Total 141,760 – 278,260 2,870 – 3,310 219,860 – 323,130
DISCUSSION
Results indicate that achieving the wetland loss reduction target primarily through implementing measures to reach a no net loss standard is likely to require the largest level of resources. The scenarios selected are just two of a large number of scenarios that could be run with the existing data by varying the different parameters. However, the results represent a pragmatic approach designed to provide a plausible first assessment of the likely magnitude involved, which will provide a basis for discussion and can be refined through later analysis. Benefits of wetland conservation are well documented; The economic value of ecosystem services provided by wetlands could be expected to range between US$125 and US$2,156 per hectare per year. If the estimate of funding available from removing harmful subsidies is accurate (US$11.70 billion a year) and if such funding could be diverted, it would help finance a significant portion of the expenditure needed to deliver Target 5.
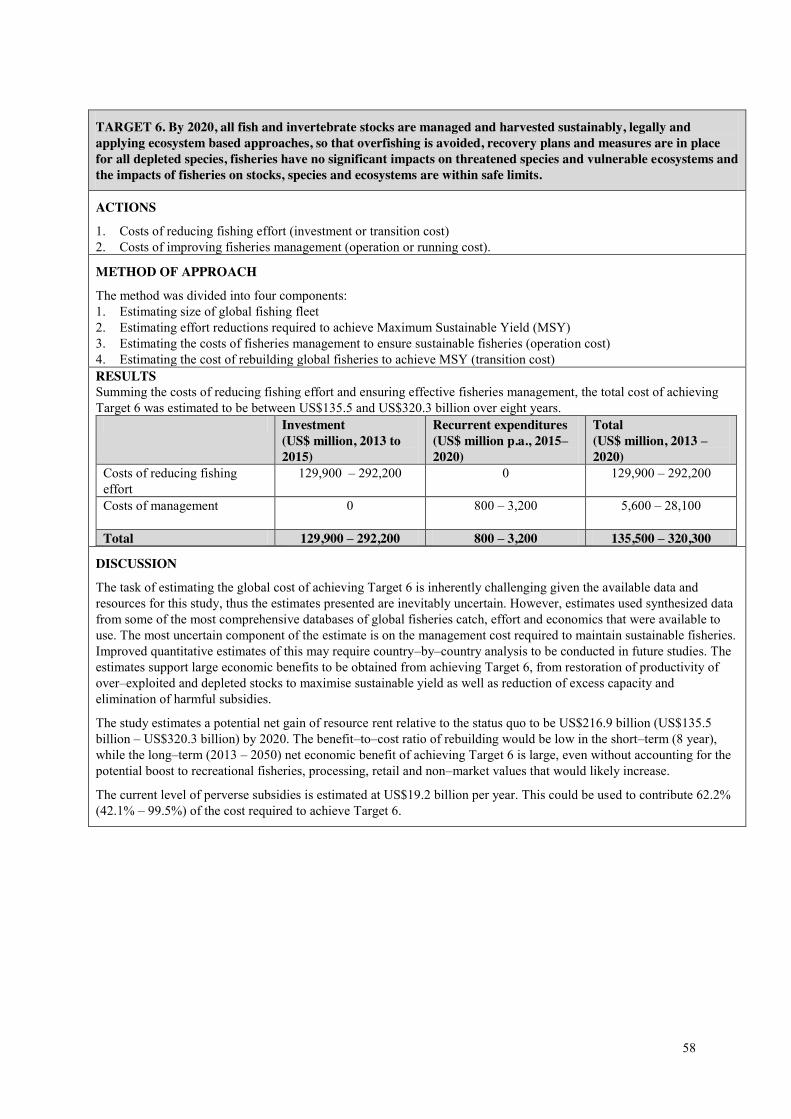
58
TARGET 6. By 2020, all fish and invertebrate stocks are managed and harvested sustainably, legally and applying ecosystem based approaches, so that overfishing is avoided, recovery plans and measures are in place for all depleted species, fisheries have no significant impacts on threatened species and vulnerable ecosystems and the impacts of fisheries on stocks, species and ecosystems are within safe limits.
ACTIONS
1. Costs of reducing fishing effort (investment or transition cost) 2. Costs of improving fisheries management (operation or running cost).
METHOD OF APPROACH
The method was divided into four components: 1. Estimating size of global fishing fleet 2. Estimating effort reductions required to achieve Maximum Sustainable Yield (MSY) 3. Estimating the costs of fisheries management to ensure sustainable fisheries (operation cost) 4. Estimating the cost of rebuilding global fisheries to achieve MSY (transition cost) RESULTS Summing the costs of reducing fishing effort and ensuring effective fisheries management, the total cost of achieving Target 6 was estimated to be between US$135.5 and US$320.3 billion over eight years.
Investment (US$ million, 2013 to 2015)
Recurrent expenditures (US$ million p.a., 2015–2020)
Total (US$ million, 2013 – 2020)
Costs of reducing fishing effort
129,900 – 292,200 0 129,900 – 292,200
Costs of management 0 800 – 3,200
5,600 – 28,100
Total 129,900 – 292,200 800 – 3,200 135,500 – 320,300
DISCUSSION
The task of estimating the global cost of achieving Target 6 is inherently challenging given the available data and resources for this study, thus the estimates presented are inevitably uncertain. However, estimates used synthesized data from some of the most comprehensive databases of global fisheries catch, effort and economics that were available to use. The most uncertain component of the estimate is on the management cost required to maintain sustainable fisheries. Improved quantitative estimates of this may require country–by–country analysis to be conducted in future studies. The estimates support large economic benefits to be obtained from achieving Target 6, from restoration of productivity of over–exploited and depleted stocks to maximise sustainable yield as well as reduction of excess capacity and elimination of harmful subsidies.
The study estimates a potential net gain of resource rent relative to the status quo to be US$216.9 billion (US$135.5 billion – US$320.3 billion) by 2020. The benefit–to–cost ratio of rebuilding would be low in the short–term (8 year), while the long–term (2013 – 2050) net economic benefit of achieving Target 6 is large, even without accounting for the potential boost to recreational fisheries, processing, retail and non–market values that would likely increase.
The current level of perverse subsidies is estimated at US$19.2 billion per year. This could be used to contribute 62.2% (42.1% – 99.5%) of the cost required to achieve Target 6.
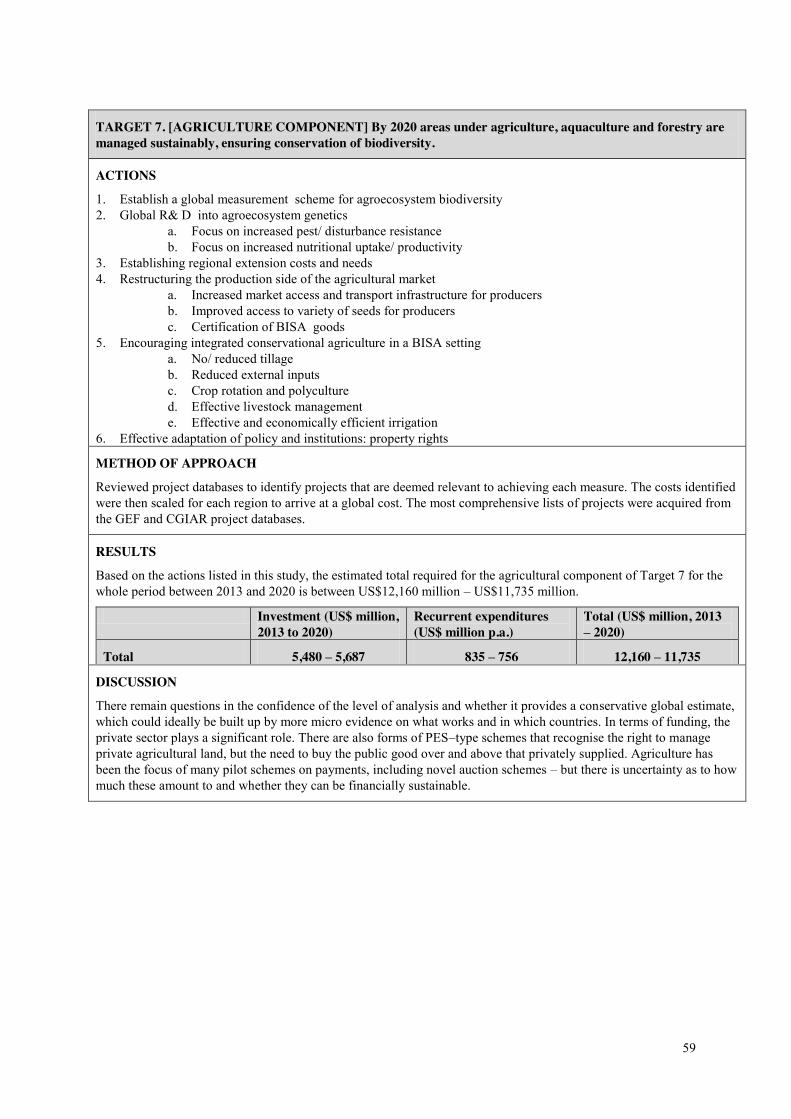
59
TARGET 7. [AGRICULTURE COMPONENT] By 2020 areas under agriculture, aquaculture and forestry are managed sustainably, ensuring conservation of biodiversity.
ACTIONS
1. Establish a global measurement scheme for agroecosystem biodiversity 2. Global R& D into agroecosystem genetics
a. Focus on increased pest/ disturbance resistance b. Focus on increased nutritional uptake/ productivity
3. Establishing regional extension costs and needs 4. Restructuring the production side of the agricultural market
a. Increased market access and transport infrastructure for producers b. Improved access to variety of seeds for producers c. Certification of BISA goods
5. Encouraging integrated conservational agriculture in a BISA setting a. No/ reduced tillage b. Reduced external inputs c. Crop rotation and polyculture d. Effective livestock management e. Effective and economically efficient irrigation
6. Effective adaptation of policy and institutions: property rights
METHOD OF APPROACH
Reviewed project databases to identify projects that are deemed relevant to achieving each measure. The costs identified were then scaled for each region to arrive at a global cost. The most comprehensive lists of projects were acquired from the GEF and CGIAR project databases.
RESULTS
Based on the actions listed in this study, the estimated total required for the agricultural component of Target 7 for the whole period between 2013 and 2020 is between US$12,160 million – US$11,735 million.
Investment (US$ million, 2013 to 2020)
Recurrent expenditures (US$ million p.a.)
Total (US$ million, 2013 – 2020)
Total 5,480 – 5,687 835 – 756 12,160 – 11,735
DISCUSSION
There remain questions in the confidence of the level of analysis and whether it provides a conservative global estimate, which could ideally be built up by more micro evidence on what works and in which countries. In terms of funding, the private sector plays a significant role. There are also forms of PES–type schemes that recognise the right to manage private agricultural land, but the need to buy the public good over and above that privately supplied. Agriculture has been the focus of many pilot schemes on payments, including novel auction schemes – but there is uncertainty as to how much these amount to and whether they can be financially sustainable.
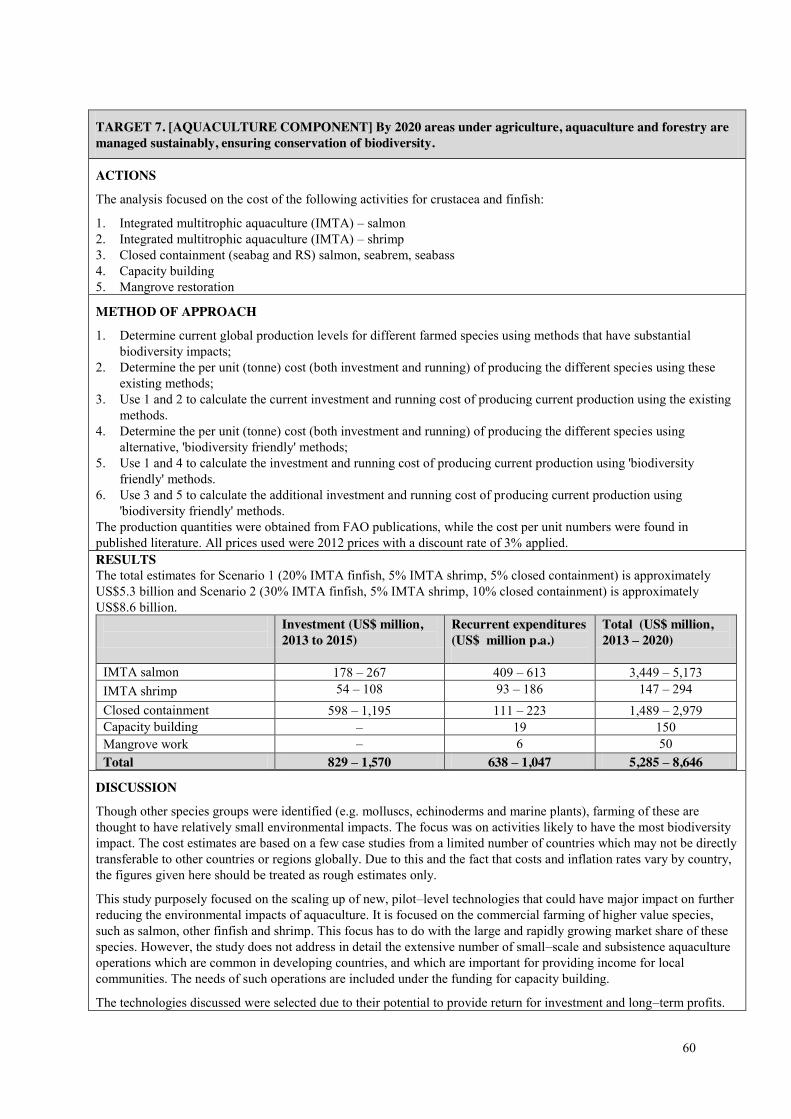
60
TARGET 7. [AQUACULTURE COMPONENT] By 2020 areas under agriculture, aquaculture and forestry are managed sustainably, ensuring conservation of biodiversity.
ACTIONS
The analysis focused on the cost of the following activities for crustacea and finfish:
1. Integrated multitrophic aquaculture (IMTA) – salmon 2. Integrated multitrophic aquaculture (IMTA) – shrimp 3. Closed containment (seabag and RS) salmon, seabrem, seabass 4. Capacity building 5. Mangrove restoration
METHOD OF APPROACH
1. Determine current global production levels for different farmed species using methods that have substantial biodiversity impacts;
2. Determine the per unit (tonne) cost (both investment and running) of producing the different species using these existing methods;
3. Use 1 and 2 to calculate the current investment and running cost of producing current production using the existing methods.
4. Determine the per unit (tonne) cost (both investment and running) of producing the different species using alternative, 'biodiversity friendly' methods;
5. Use 1 and 4 to calculate the investment and running cost of producing current production using 'biodiversity friendly' methods.
6. Use 3 and 5 to calculate the additional investment and running cost of producing current production using 'biodiversity friendly' methods.
The production quantities were obtained from FAO publications, while the cost per unit numbers were found in published literature. All prices used were 2012 prices with a discount rate of 3% applied. RESULTS The total estimates for Scenario 1 (20% IMTA finfish, 5% IMTA shrimp, 5% closed containment) is approximately US$5.3 billion and Scenario 2 (30% IMTA finfish, 5% IMTA shrimp, 10% closed containment) is approximately US$8.6 billion.
Investment (US$ million, 2013 to 2015)
Recurrent expenditures (US$ million p.a.)
Total (US$ million, 2013 – 2020)
IMTA salmon 178 – 267 409 – 613 3,449 – 5,173 IMTA shrimp 54 – 108 93 – 186 147 – 294 Closed containment 598 – 1,195 111 – 223 1,489 – 2,979 Capacity building – 19 150 Mangrove work – 6 50 Total 829 – 1,570 638 – 1,047 5,285 – 8,646
DISCUSSION
Though other species groups were identified (e.g. molluscs, echinoderms and marine plants), farming of these are thought to have relatively small environmental impacts. The focus was on activities likely to have the most biodiversity impact. The cost estimates are based on a few case studies from a limited number of countries which may not be directly transferable to other countries or regions globally. Due to this and the fact that costs and inflation rates vary by country, the figures given here should be treated as rough estimates only.
This study purposely focused on the scaling up of new, pilot–level technologies that could have major impact on further reducing the environmental impacts of aquaculture. It is focused on the commercial farming of higher value species, such as salmon, other finfish and shrimp. This focus has to do with the large and rapidly growing market share of these species. However, the study does not address in detail the extensive number of small–scale and subsistence aquaculture operations which are common in developing countries, and which are important for providing income for local communities. The needs of such operations are included under the funding for capacity building.
The technologies discussed were selected due to their potential to provide return for investment and long–term profits.

61
For example, integrated multitrophic aquaculture is likely to lead to an increase in revenue particularly if the other cultivated species (such as shellfish and/or marine algae) are also marketed. Similarly, while the investment in closed containment systems is initially expensive, the NPV for the technologies discussed in this study is positive in the long term. This is particularly true when environmental costs of the aquaculture operation are taken into account and internalised. Both integrated aquaculture and closed containment systems require industry buy–in, which could be supported by government incentives and regulation to help with their implementation.
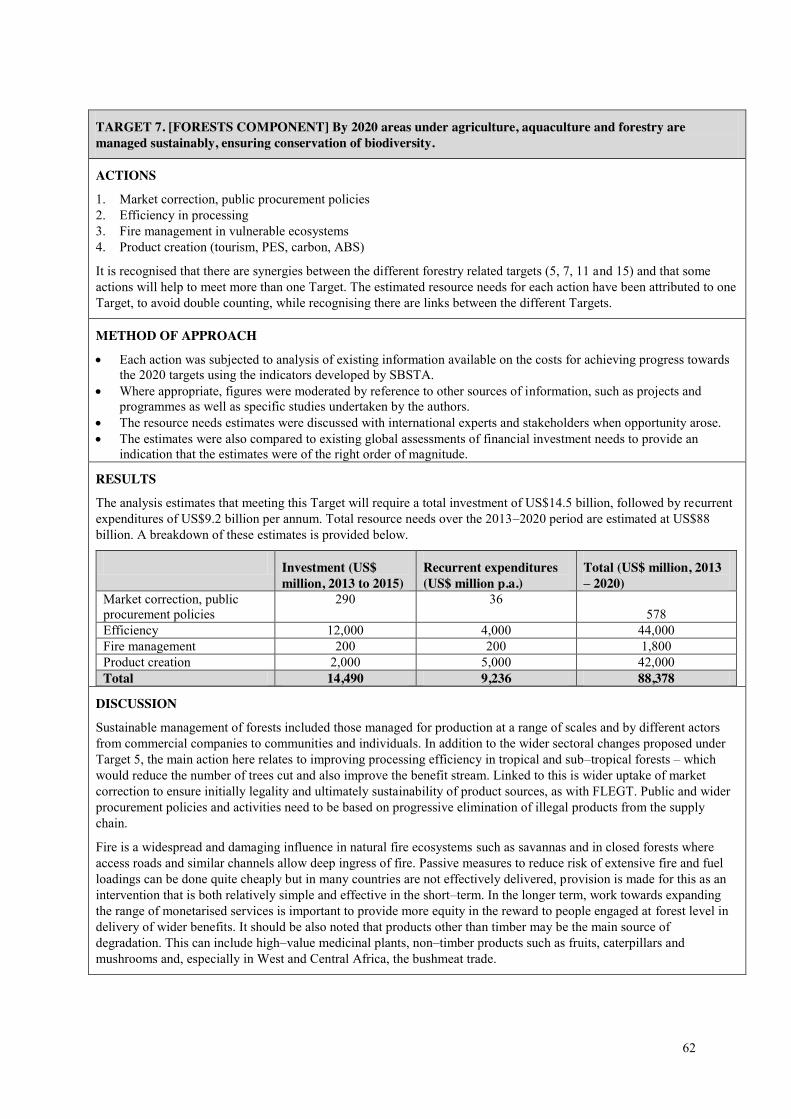
62
TARGET 7. [FORESTS COMPONENT] By 2020 areas under agriculture, aquaculture and forestry are managed sustainably, ensuring conservation of biodiversity.
ACTIONS
1. Market correction, public procurement policies 2. Efficiency in processing 3. Fire management in vulnerable ecosystems 4. Product creation (tourism, PES, carbon, ABS)
It is recognised that there are synergies between the different forestry related targets (5, 7, 11 and 15) and that some actions will help to meet more than one Target. The estimated resource needs for each action have been attributed to one Target, to avoid double counting, while recognising there are links between the different Targets.
METHOD OF APPROACH
x Each action was subjected to analysis of existing information available on the costs for achieving progress towards the 2020 targets using the indicators developed by SBSTA.
x Where appropriate, figures were moderated by reference to other sources of information, such as projects and programmes as well as specific studies undertaken by the authors.
x The resource needs estimates were discussed with international experts and stakeholders when opportunity arose. x The estimates were also compared to existing global assessments of financial investment needs to provide an
indication that the estimates were of the right order of magnitude.
RESULTS
The analysis estimates that meeting this Target will require a total investment of US$14.5 billion, followed by recurrent expenditures of US$9.2 billion per annum. Total resource needs over the 2013–2020 period are estimated at US$88 billion. A breakdown of these estimates is provided below.
Investment (US$ million, 2013 to 2015)
Recurrent expenditures (US$ million p.a.)
Total (US$ million, 2013 – 2020)
Market correction, public procurement policies
290 36 578
Efficiency 12,000 4,000 44,000 Fire management 200 200 1,800 Product creation 2,000 5,000 42,000 Total 14,490 9,236 88,378
DISCUSSION
Sustainable management of forests included those managed for production at a range of scales and by different actors from commercial companies to communities and individuals. In addition to the wider sectoral changes proposed under Target 5, the main action here relates to improving processing efficiency in tropical and sub–tropical forests – which would reduce the number of trees cut and also improve the benefit stream. Linked to this is wider uptake of market correction to ensure initially legality and ultimately sustainability of product sources, as with FLEGT. Public and wider procurement policies and activities need to be based on progressive elimination of illegal products from the supply chain.
Fire is a widespread and damaging influence in natural fire ecosystems such as savannas and in closed forests where access roads and similar channels allow deep ingress of fire. Passive measures to reduce risk of extensive fire and fuel loadings can be done quite cheaply but in many countries are not effectively delivered, provision is made for this as an intervention that is both relatively simple and effective in the short–term. In the longer term, work towards expanding the range of monetarised services is important to provide more equity in the reward to people engaged at forest level in delivery of wider benefits. It should be also noted that products other than timber may be the main source of degradation. This can include high–value medicinal plants, non–timber products such as fruits, caterpillars and mushrooms and, especially in West and Central Africa, the bushmeat trade.
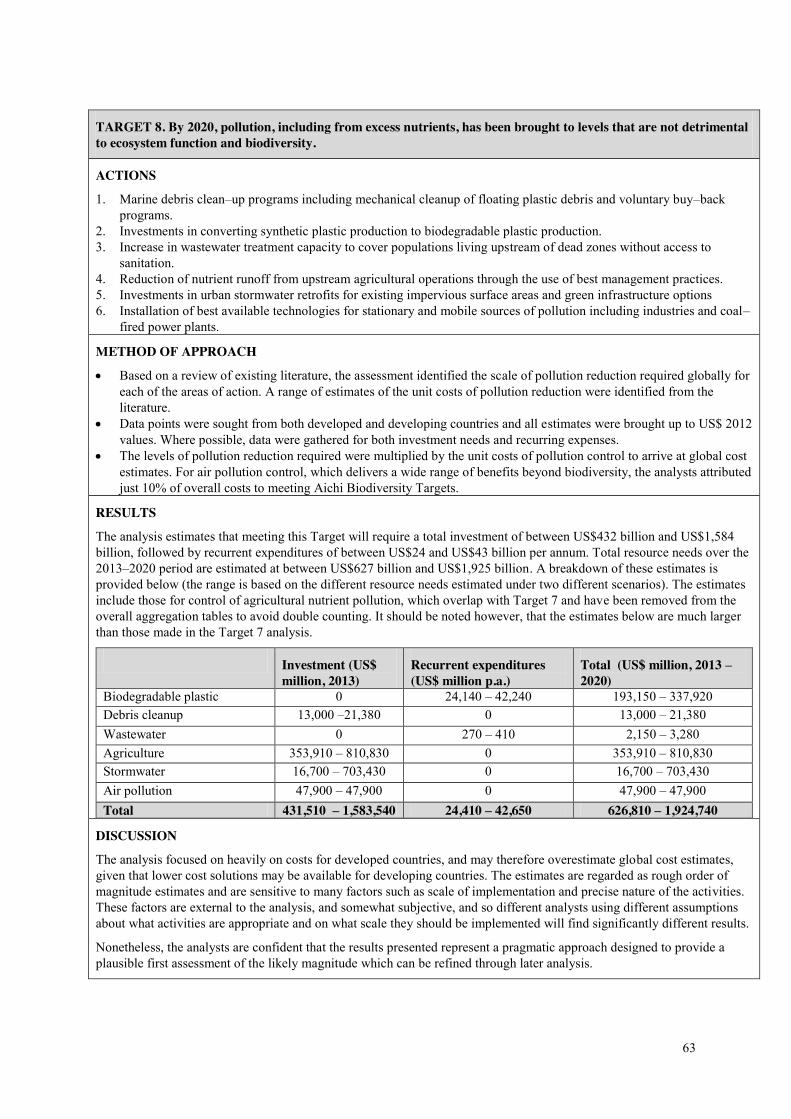
63
TARGET 8. By 2020, pollution, including from excess nutrients, has been brought to levels that are not detrimental to ecosystem function and biodiversity.
ACTIONS
1. Marine debris clean–up programs including mechanical cleanup of floating plastic debris and voluntary buy–back programs.
2. Investments in converting synthetic plastic production to biodegradable plastic production. 3. Increase in wastewater treatment capacity to cover populations living upstream of dead zones without access to
sanitation. 4. Reduction of nutrient runoff from upstream agricultural operations through the use of best management practices. 5. Investments in urban stormwater retrofits for existing impervious surface areas and green infrastructure options 6. Installation of best available technologies for stationary and mobile sources of pollution including industries and coal–
fired power plants.
METHOD OF APPROACH
x Based on a review of existing literature, the assessment identified the scale of pollution reduction required globally for each of the areas of action. A range of estimates of the unit costs of pollution reduction were identified from the literature.
x Data points were sought from both developed and developing countries and all estimates were brought up to US$ 2012 values. Where possible, data were gathered for both investment needs and recurring expenses.
x The levels of pollution reduction required were multiplied by the unit costs of pollution control to arrive at global cost estimates. For air pollution control, which delivers a wide range of benefits beyond biodiversity, the analysts attributed just 10% of overall costs to meeting Aichi Biodiversity Targets.
RESULTS
The analysis estimates that meeting this Target will require a total investment of between US$432 billion and US$1,584 billion, followed by recurrent expenditures of between US$24 and US$43 billion per annum. Total resource needs over the 2013–2020 period are estimated at between US$627 billion and US$1,925 billion. A breakdown of these estimates is provided below (the range is based on the different resource needs estimated under two different scenarios). The estimates include those for control of agricultural nutrient pollution, which overlap with Target 7 and have been removed from the overall aggregation tables to avoid double counting. It should be noted however, that the estimates below are much larger than those made in the Target 7 analysis.
Investment (US$ million, 2013)
Recurrent expenditures (US$ million p.a.)
Total (US$ million, 2013 – 2020)
Biodegradable plastic 0 24,140 – 42,240 193,150 – 337,920 Debris cleanup 13,000 –21,380 0 13,000 – 21,380 Wastewater 0 270 – 410 2,150 – 3,280 Agriculture 353,910 – 810,830 0 353,910 – 810,830 Stormwater 16,700 – 703,430 0 16,700 – 703,430 Air pollution 47,900 – 47,900 0 47,900 – 47,900 Total 431,510 – 1,583,540 24,410 – 42,650 626,810 – 1,924,740
DISCUSSION
The analysis focused on heavily on costs for developed countries, and may therefore overestimate global cost estimates, given that lower cost solutions may be available for developing countries. The estimates are regarded as rough order of magnitude estimates and are sensitive to many factors such as scale of implementation and precise nature of the activities. These factors are external to the analysis, and somewhat subjective, and so different analysts using different assumptions about what activities are appropriate and on what scale they should be implemented will find significantly different results.
Nonetheless, the analysts are confident that the results presented represent a pragmatic approach designed to provide a plausible first assessment of the likely magnitude which can be refined through later analysis.
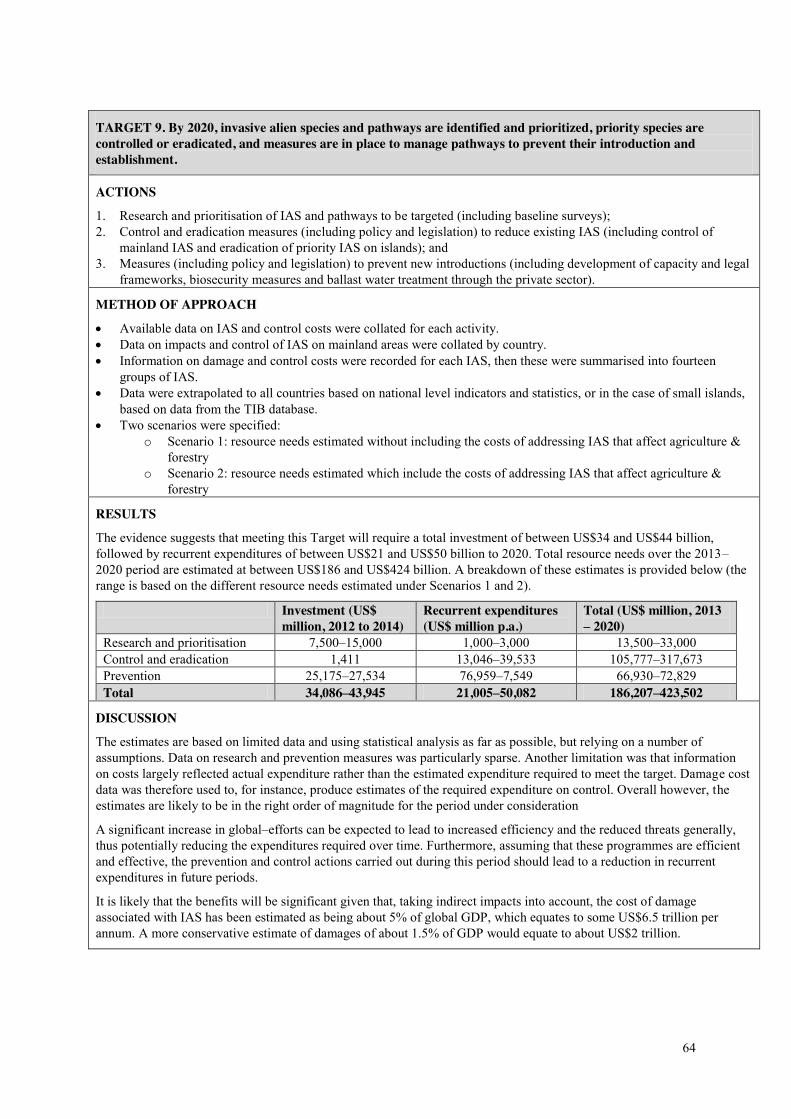
64
TARGET 9. By 2020, invasive alien species and pathways are identified and prioritized, priority species are controlled or eradicated, and measures are in place to manage pathways to prevent their introduction and establishment.
ACTIONS
1. Research and prioritisation of IAS and pathways to be targeted (including baseline surveys); 2. Control and eradication measures (including policy and legislation) to reduce existing IAS (including control of
mainland IAS and eradication of priority IAS on islands); and 3. Measures (including policy and legislation) to prevent new introductions (including development of capacity and legal
frameworks, biosecurity measures and ballast water treatment through the private sector).
METHOD OF APPROACH
x Available data on IAS and control costs were collated for each activity. x Data on impacts and control of IAS on mainland areas were collated by country. x Information on damage and control costs were recorded for each IAS, then these were summarised into fourteen
groups of IAS. x Data were extrapolated to all countries based on national level indicators and statistics, or in the case of small islands,
based on data from the TIB database. x Two scenarios were specified:
o Scenario 1: resource needs estimated without including the costs of addressing IAS that affect agriculture & forestry
o Scenario 2: resource needs estimated which include the costs of addressing IAS that affect agriculture & forestry
RESULTS
The evidence suggests that meeting this Target will require a total investment of between US$34 and US$44 billion, followed by recurrent expenditures of between US$21 and US$50 billion to 2020. Total resource needs over the 2013–2020 period are estimated at between US$186 and US$424 billion. A breakdown of these estimates is provided below (the range is based on the different resource needs estimated under Scenarios 1 and 2).
Investment (US$ million, 2012 to 2014)
Recurrent expenditures (US$ million p.a.)
Total (US$ million, 2013 – 2020)
Research and prioritisation 7,500–15,000 1,000–3,000 13,500–33,000 Control and eradication 1,411 13,046–39,533 105,777–317,673 Prevention 25,175–27,534 76,959–7,549 66,930–72,829 Total 34,086–43,945 21,005–50,082 186,207–423,502
DISCUSSION
The estimates are based on limited data and using statistical analysis as far as possible, but relying on a number of assumptions. Data on research and prevention measures was particularly sparse. Another limitation was that information on costs largely reflected actual expenditure rather than the estimated expenditure required to meet the target. Damage cost data was therefore used to, for instance, produce estimates of the required expenditure on control. Overall however, the estimates are likely to be in the right order of magnitude for the period under consideration
A significant increase in global–efforts can be expected to lead to increased efficiency and the reduced threats generally, thus potentially reducing the expenditures required over time. Furthermore, assuming that these programmes are efficient and effective, the prevention and control actions carried out during this period should lead to a reduction in recurrent expenditures in future periods.
It is likely that the benefits will be significant given that, taking indirect impacts into account, the cost of damage associated with IAS has been estimated as being about 5% of global GDP, which equates to some US$6.5 trillion per annum. A more conservative estimate of damages of about 1.5% of GDP would equate to about US$2 trillion.
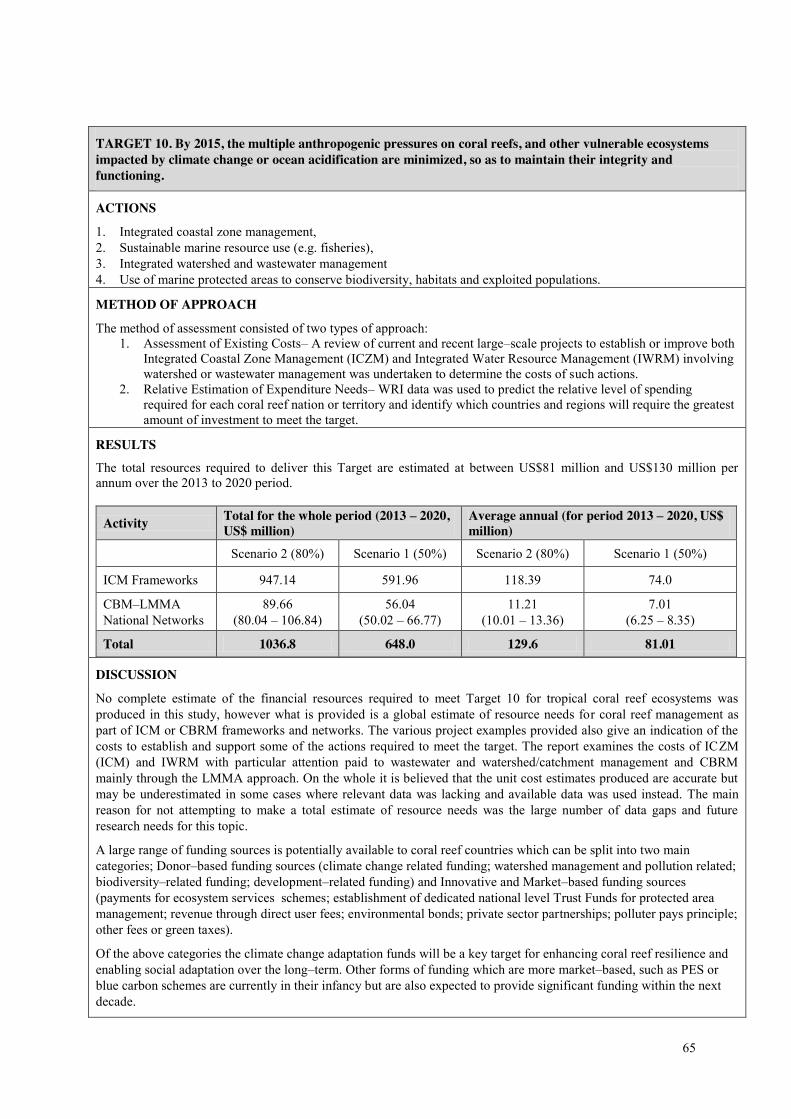
65
TARGET 10. By 2015, the multiple anthropogenic pressures on coral reefs, and other vulnerable ecosystems impacted by climate change or ocean acidification are minimized, so as to maintain their integrity and functioning.
ACTIONS
1. Integrated coastal zone management, 2. Sustainable marine resource use (e.g. fisheries), 3. Integrated watershed and wastewater management 4. Use of marine protected areas to conserve biodiversity, habitats and exploited populations.
METHOD OF APPROACH
The method of assessment consisted of two types of approach: 1. Assessment of Existing Costs– A review of current and recent large–scale projects to establish or improve both
Integrated Coastal Zone Management (ICZM) and Integrated Water Resource Management (IWRM) involving watershed or wastewater management was undertaken to determine the costs of such actions.
2. Relative Estimation of Expenditure Needs– WRI data was used to predict the relative level of spending required for each coral reef nation or territory and identify which countries and regions will require the greatest amount of investment to meet the target.
RESULTS The total resources required to deliver this Target are estimated at between US$81 million and US$130 million per annum over the 2013 to 2020 period.
Activity Total for the whole period (2013 – 2020, US$ million)
Average annual (for period 2013 – 2020, US$ million)
Scenario 2 (80%) Scenario 1 (50%) Scenario 2 (80%) Scenario 1 (50%)
ICM Frameworks 947.14 591.96 118.39 74.0
CBM–LMMA National Networks
89.66 (80.04 – 106.84)
56.04 (50.02 – 66.77)
11.21 (10.01 – 13.36)
7.01 (6.25 – 8.35)
Total 1036.8 648.0 129.6 81.01
DISCUSSION
No complete estimate of the financial resources required to meet Target 10 for tropical coral reef ecosystems was produced in this study, however what is provided is a global estimate of resource needs for coral reef management as part of ICM or CBRM frameworks and networks. The various project examples provided also give an indication of the costs to establish and support some of the actions required to meet the target. The report examines the costs of ICZM (ICM) and IWRM with particular attention paid to wastewater and watershed/catchment management and CBRM mainly through the LMMA approach. On the whole it is believed that the unit cost estimates produced are accurate but may be underestimated in some cases where relevant data was lacking and available data was used instead. The main reason for not attempting to make a total estimate of resource needs was the large number of data gaps and future research needs for this topic.
A large range of funding sources is potentially available to coral reef countries which can be split into two main categories; Donor–based funding sources (climate change related funding; watershed management and pollution related; biodiversity–related funding; development–related funding) and Innovative and Market–based funding sources (payments for ecosystem services schemes; establishment of dedicated national level Trust Funds for protected area management; revenue through direct user fees; environmental bonds; private sector partnerships; polluter pays principle; other fees or green taxes).
Of the above categories the climate change adaptation funds will be a key target for enhancing coral reef resilience and enabling social adaptation over the long–term. Other forms of funding which are more market–based, such as PES or blue carbon schemes are currently in their infancy but are also expected to provide significant funding within the next decade.
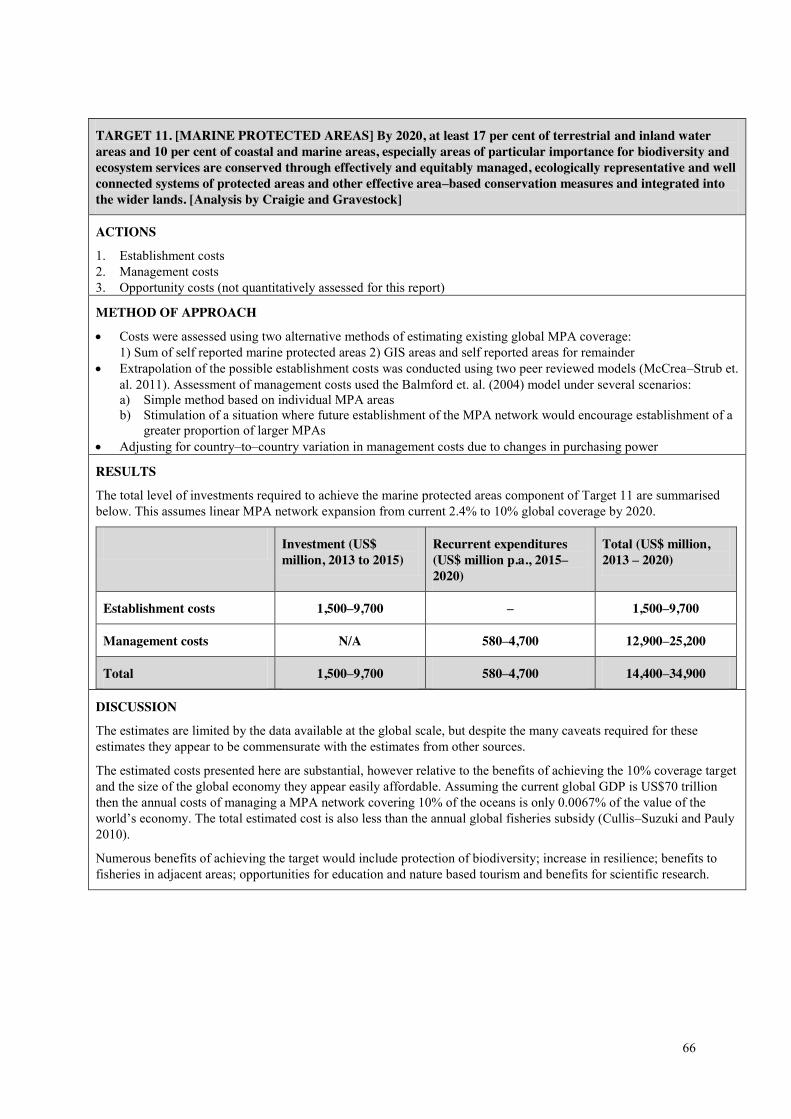
66
TARGET 11. [MARINE PROTECTED AREAS] By 2020, at least 17 per cent of terrestrial and inland water areas and 10 per cent of coastal and marine areas, especially areas of particular importance for biodiversity and ecosystem services are conserved through effectively and equitably managed, ecologically representative and well connected systems of protected areas and other effective area–based conservation measures and integrated into the wider lands. [Analysis by Craigie and Gravestock]
ACTIONS
1. Establishment costs 2. Management costs 3. Opportunity costs (not quantitatively assessed for this report)
METHOD OF APPROACH
x Costs were assessed using two alternative methods of estimating existing global MPA coverage: 1) Sum of self reported marine protected areas 2) GIS areas and self reported areas for remainder
x Extrapolation of the possible establishment costs was conducted using two peer reviewed models (McCrea–Strub et. al. 2011). Assessment of management costs used the Balmford et. al. (2004) model under several scenarios: a) Simple method based on individual MPA areas b) Stimulation of a situation where future establishment of the MPA network would encourage establishment of a
greater proportion of larger MPAs x Adjusting for country–to–country variation in management costs due to changes in purchasing power
RESULTS
The total level of investments required to achieve the marine protected areas component of Target 11 are summarised below. This assumes linear MPA network expansion from current 2.4% to 10% global coverage by 2020.
Investment (US$ million, 2013 to 2015)
Recurrent expenditures (US$ million p.a., 2015–2020)
Total (US$ million, 2013 – 2020)
Establishment costs 1,500–9,700 – 1,500–9,700
Management costs N/A 580–4,700 12,900–25,200
Total 1,500–9,700 580–4,700 14,400–34,900
DISCUSSION
The estimates are limited by the data available at the global scale, but despite the many caveats required for these estimates they appear to be commensurate with the estimates from other sources.
The estimated costs presented here are substantial, however relative to the benefits of achieving the 10% coverage target and the size of the global economy they appear easily affordable. Assuming the current global GDP is US$70 trillion then the annual costs of managing a MPA network covering 10% of the oceans is only 0.0067% of the value of the world’s economy. The total estimated cost is also less than the annual global fisheries subsidy (Cullis–Suzuki and Pauly 2010).
Numerous benefits of achieving the target would include protection of biodiversity; increase in resilience; benefits to fisheries in adjacent areas; opportunities for education and nature based tourism and benefits for scientific research.
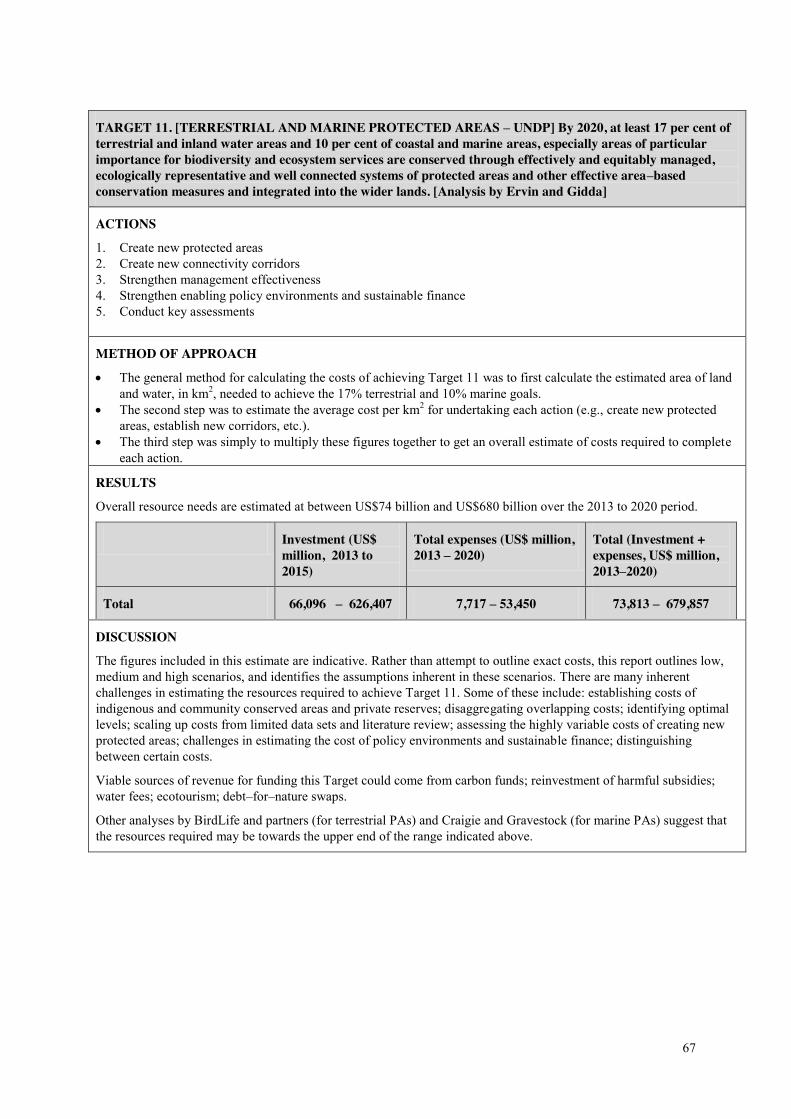
67
TARGET 11. [TERRESTRIAL AND MARINE PROTECTED AREAS – UNDP] By 2020, at least 17 per cent of terrestrial and inland water areas and 10 per cent of coastal and marine areas, especially areas of particular importance for biodiversity and ecosystem services are conserved through effectively and equitably managed, ecologically representative and well connected systems of protected areas and other effective area–based conservation measures and integrated into the wider lands. [Analysis by Ervin and Gidda]
ACTIONS
1. Create new protected areas 2. Create new connectivity corridors 3. Strengthen management effectiveness 4. Strengthen enabling policy environments and sustainable finance 5. Conduct key assessments
METHOD OF APPROACH
x The general method for calculating the costs of achieving Target 11 was to first calculate the estimated area of land and water, in km2, needed to achieve the 17% terrestrial and 10% marine goals.
x The second step was to estimate the average cost per km2 for undertaking each action (e.g., create new protected areas, establish new corridors, etc.).
x The third step was simply to multiply these figures together to get an overall estimate of costs required to complete each action.
RESULTS
Overall resource needs are estimated at between US$74 billion and US$680 billion over the 2013 to 2020 period.
Investment (US$ million, 2013 to 2015)
Total expenses (US$ million, 2013 – 2020)
Total (Investment + expenses, US$ million, 2013–2020)
Total 66,096 – 626,407 7,717 – 53,450 73,813 – 679,857
DISCUSSION
The figures included in this estimate are indicative. Rather than attempt to outline exact costs, this report outlines low, medium and high scenarios, and identifies the assumptions inherent in these scenarios. There are many inherent challenges in estimating the resources required to achieve Target 11. Some of these include: establishing costs of indigenous and community conserved areas and private reserves; disaggregating overlapping costs; identifying optimal levels; scaling up costs from limited data sets and literature review; assessing the highly variable costs of creating new protected areas; challenges in estimating the cost of policy environments and sustainable finance; distinguishing between certain costs.
Viable sources of revenue for funding this Target could come from carbon funds; reinvestment of harmful subsidies; water fees; ecotourism; debt–for–nature swaps.
Other analyses by BirdLife and partners (for terrestrial PAs) and Craigie and Gravestock (for marine PAs) suggest that the resources required may be towards the upper end of the range indicated above.
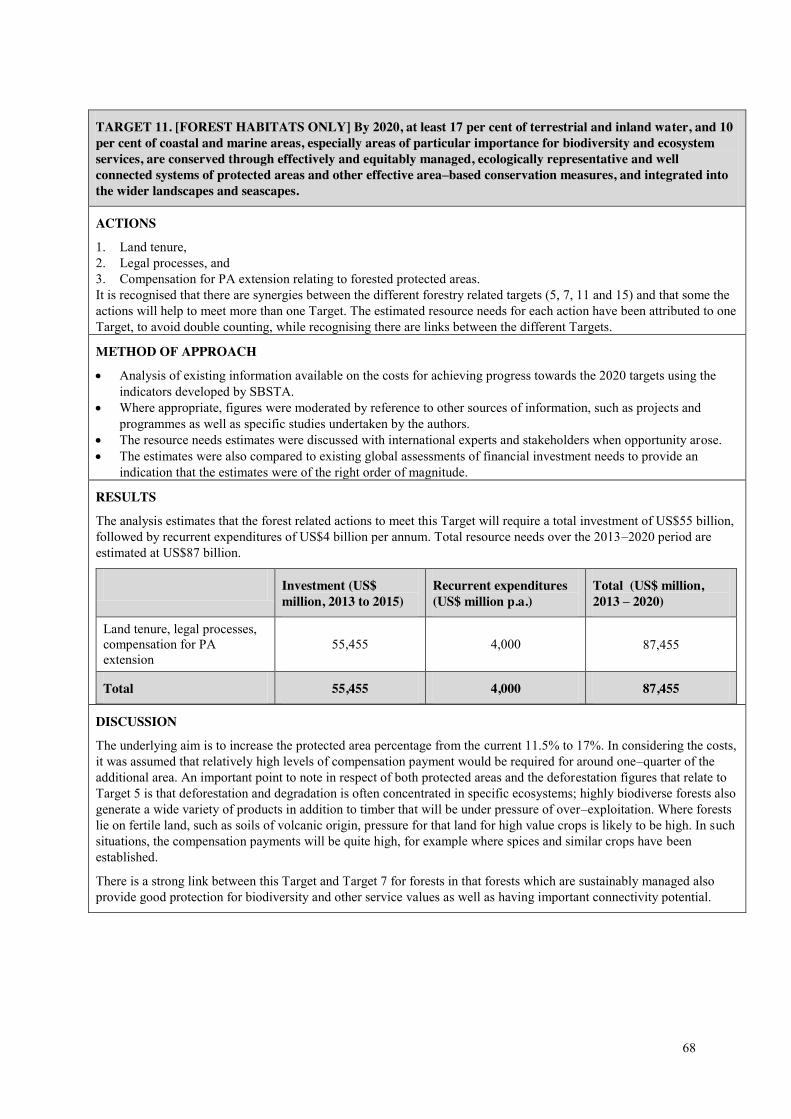
68
TARGET 11. [FOREST HABITATS ONLY] By 2020, at least 17 per cent of terrestrial and inland water, and 10 per cent of coastal and marine areas, especially areas of particular importance for biodiversity and ecosystem services, are conserved through effectively and equitably managed, ecologically representative and well connected systems of protected areas and other effective area–based conservation measures, and integrated into the wider landscapes and seascapes.
ACTIONS
1. Land tenure, 2. Legal processes, and 3. Compensation for PA extension relating to forested protected areas. It is recognised that there are synergies between the different forestry related targets (5, 7, 11 and 15) and that some the actions will help to meet more than one Target. The estimated resource needs for each action have been attributed to one Target, to avoid double counting, while recognising there are links between the different Targets.
METHOD OF APPROACH
x Analysis of existing information available on the costs for achieving progress towards the 2020 targets using the indicators developed by SBSTA.
x Where appropriate, figures were moderated by reference to other sources of information, such as projects and programmes as well as specific studies undertaken by the authors.
x The resource needs estimates were discussed with international experts and stakeholders when opportunity arose. x The estimates were also compared to existing global assessments of financial investment needs to provide an
indication that the estimates were of the right order of magnitude.
RESULTS
The analysis estimates that the forest related actions to meet this Target will require a total investment of US$55 billion, followed by recurrent expenditures of US$4 billion per annum. Total resource needs over the 2013–2020 period are estimated at US$87 billion.
Investment (US$ million, 2013 to 2015)
Recurrent expenditures (US$ million p.a.)
Total (US$ million, 2013 – 2020)
Land tenure, legal processes, compensation for PA extension
55,455 4,000 87,455
Total 55,455 4,000 87,455
DISCUSSION
The underlying aim is to increase the protected area percentage from the current 11.5% to 17%. In considering the costs, it was assumed that relatively high levels of compensation payment would be required for around one–quarter of the additional area. An important point to note in respect of both protected areas and the deforestation figures that relate to Target 5 is that deforestation and degradation is often concentrated in specific ecosystems; highly biodiverse forests also generate a wide variety of products in addition to timber that will be under pressure of over–exploitation. Where forests lie on fertile land, such as soils of volcanic origin, pressure for that land for high value crops is likely to be high. In such situations, the compensation payments will be quite high, for example where spices and similar crops have been established.
There is a strong link between this Target and Target 7 for forests in that forests which are sustainably managed also provide good protection for biodiversity and other service values as well as having important connectivity potential.
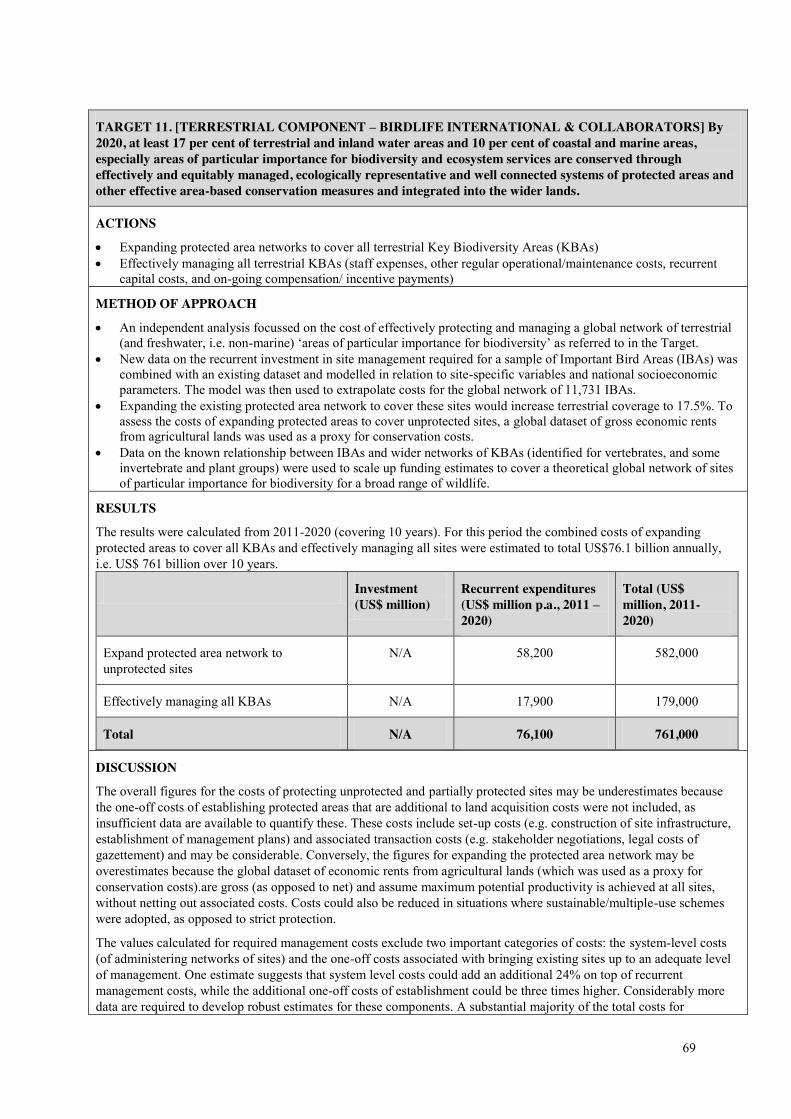
69
TARGET 11. [TERRESTRIAL COMPONENT – BIRDLIFE INTERNATIONAL & COLLABORATORS] By 2020, at least 17 per cent of terrestrial and inland water areas and 10 per cent of coastal and marine areas, especially areas of particular importance for biodiversity and ecosystem services are conserved through effectively and equitably managed, ecologically representative and well connected systems of protected areas and other effective area-based conservation measures and integrated into the wider lands.
ACTIONS
x Expanding protected area networks to cover all terrestrial Key Biodiversity Areas (KBAs) x Effectively managing all terrestrial KBAs (staff expenses, other regular operational/maintenance costs, recurrent
capital costs, and on-going compensation/ incentive payments)
METHOD OF APPROACH
x An independent analysis focussed on the cost of effectively protecting and managing a global network of terrestrial (and freshwater, i.e. non-marine) ‘areas of particular importance for biodiversity’ as referred to in the Target.
x New data on the recurrent investment in site management required for a sample of Important Bird Areas (IBAs) was combined with an existing dataset and modelled in relation to site-specific variables and national socioeconomic parameters. The model was then used to extrapolate costs for the global network of 11,731 IBAs.
x Expanding the existing protected area network to cover these sites would increase terrestrial coverage to 17.5%. To assess the costs of expanding protected areas to cover unprotected sites, a global dataset of gross economic rents from agricultural lands was used as a proxy for conservation costs.
x Data on the known relationship between IBAs and wider networks of KBAs (identified for vertebrates, and some invertebrate and plant groups) were used to scale up funding estimates to cover a theoretical global network of sites of particular importance for biodiversity for a broad range of wildlife.
RESULTS
The results were calculated from 2011-2020 (covering 10 years). For this period the combined costs of expanding protected areas to cover all KBAs and effectively managing all sites were estimated to total US$76.1 billion annually, i.e. US$ 761 billion over 10 years.
Investment (US$ million)
Recurrent expenditures (US$ million p.a., 2011 – 2020)
Total (US$ million, 2011-2020)
Expand protected area network to unprotected sites
N/A 58,200 582,000
Effectively managing all KBAs N/A 17,900 179,000
Total N/A 76,100 761,000
DISCUSSION
The overall figures for the costs of protecting unprotected and partially protected sites may be underestimates because the one-off costs of establishing protected areas that are additional to land acquisition costs were not included, as insufficient data are available to quantify these. These costs include set-up costs (e.g. construction of site infrastructure, establishment of management plans) and associated transaction costs (e.g. stakeholder negotiations, legal costs of gazettement) and may be considerable. Conversely, the figures for expanding the protected area network may be overestimates because the global dataset of economic rents from agricultural lands (which was used as a proxy for conservation costs).are gross (as opposed to net) and assume maximum potential productivity is achieved at all sites, without netting out associated costs. Costs could also be reduced in situations where sustainable/multiple-use schemes were adopted, as opposed to strict protection.
The values calculated for required management costs exclude two important categories of costs: the system-level costs (of administering networks of sites) and the one-off costs associated with bringing existing sites up to an adequate level of management. One estimate suggests that system level costs could add an additional 24% on top of recurrent management costs, while the additional one-off costs of establishment could be three times higher. Considerably more data are required to develop robust estimates for these components. A substantial majority of the total costs for

70
expanding protected areas and effectively managing them was required in higher income countries: only 29%—US$22.4 billion annually—is needed in lower-income countries. All figures were found to be reasonably consistent with previous published estimates at both the global and sub-global levels.
The analysis and estimates exclude the costs of expanding and effectively managing protected areas in the marine realm.
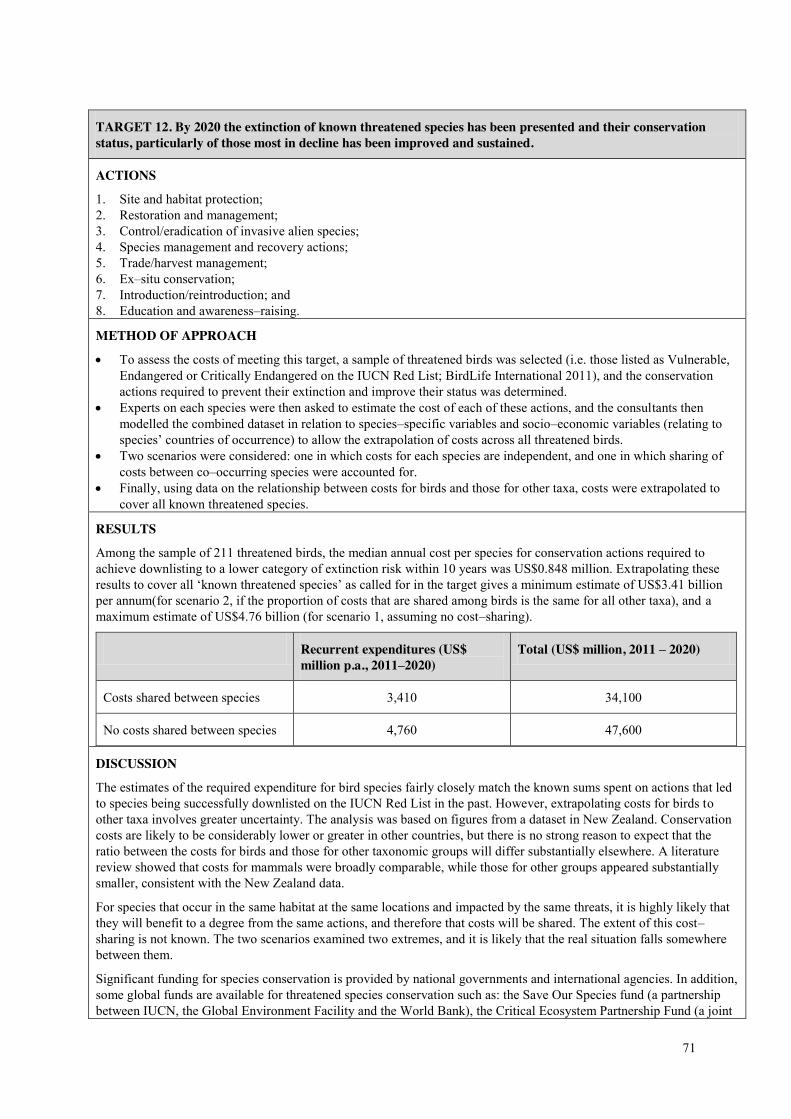
71
TARGET 12. By 2020 the extinction of known threatened species has been presented and their conservation status, particularly of those most in decline has been improved and sustained.
ACTIONS
1. Site and habitat protection; 2. Restoration and management; 3. Control/eradication of invasive alien species; 4. Species management and recovery actions; 5. Trade/harvest management; 6. Ex–situ conservation; 7. Introduction/reintroduction; and 8. Education and awareness–raising.
METHOD OF APPROACH
x To assess the costs of meeting this target, a sample of threatened birds was selected (i.e. those listed as Vulnerable, Endangered or Critically Endangered on the IUCN Red List; BirdLife International 2011), and the conservation actions required to prevent their extinction and improve their status was determined.
x Experts on each species were then asked to estimate the cost of each of these actions, and the consultants then modelled the combined dataset in relation to species–specific variables and socio–economic variables (relating to species’ countries of occurrence) to allow the extrapolation of costs across all threatened birds.
x Two scenarios were considered: one in which costs for each species are independent, and one in which sharing of costs between co–occurring species were accounted for.
x Finally, using data on the relationship between costs for birds and those for other taxa, costs were extrapolated to cover all known threatened species.
RESULTS
Among the sample of 211 threatened birds, the median annual cost per species for conservation actions required to achieve downlisting to a lower category of extinction risk within 10 years was US$0.848 million. Extrapolating these results to cover all ‘known threatened species’ as called for in the target gives a minimum estimate of US$3.41 billion per annum(for scenario 2, if the proportion of costs that are shared among birds is the same for all other taxa), and a maximum estimate of US$4.76 billion (for scenario 1, assuming no cost–sharing).
Recurrent expenditures (US$ million p.a., 2011–2020)
Total (US$ million, 2011 – 2020)
Costs shared between species 3,410 34,100
No costs shared between species 4,760 47,600
DISCUSSION
The estimates of the required expenditure for bird species fairly closely match the known sums spent on actions that led to species being successfully downlisted on the IUCN Red List in the past. However, extrapolating costs for birds to other taxa involves greater uncertainty. The analysis was based on figures from a dataset in New Zealand. Conservation costs are likely to be considerably lower or greater in other countries, but there is no strong reason to expect that the ratio between the costs for birds and those for other taxonomic groups will differ substantially elsewhere. A literature review showed that costs for mammals were broadly comparable, while those for other groups appeared substantially smaller, consistent with the New Zealand data.
For species that occur in the same habitat at the same locations and impacted by the same threats, it is highly likely that they will benefit to a degree from the same actions, and therefore that costs will be shared. The extent of this cost–sharing is not known. The two scenarios examined two extremes, and it is likely that the real situation falls somewhere between them.
Significant funding for species conservation is provided by national governments and international agencies. In addition, some global funds are available for threatened species conservation such as: the Save Our Species fund (a partnership between IUCN, the Global Environment Facility and the World Bank), the Critical Ecosystem Partnership Fund (a joint

72
program of l'Agence Française de Développement, the GEF, the Government of Japan, Conservation International, Catherine T. MacArthur Foundation, and the World Bank, as well as a host of smaller funding bodies.
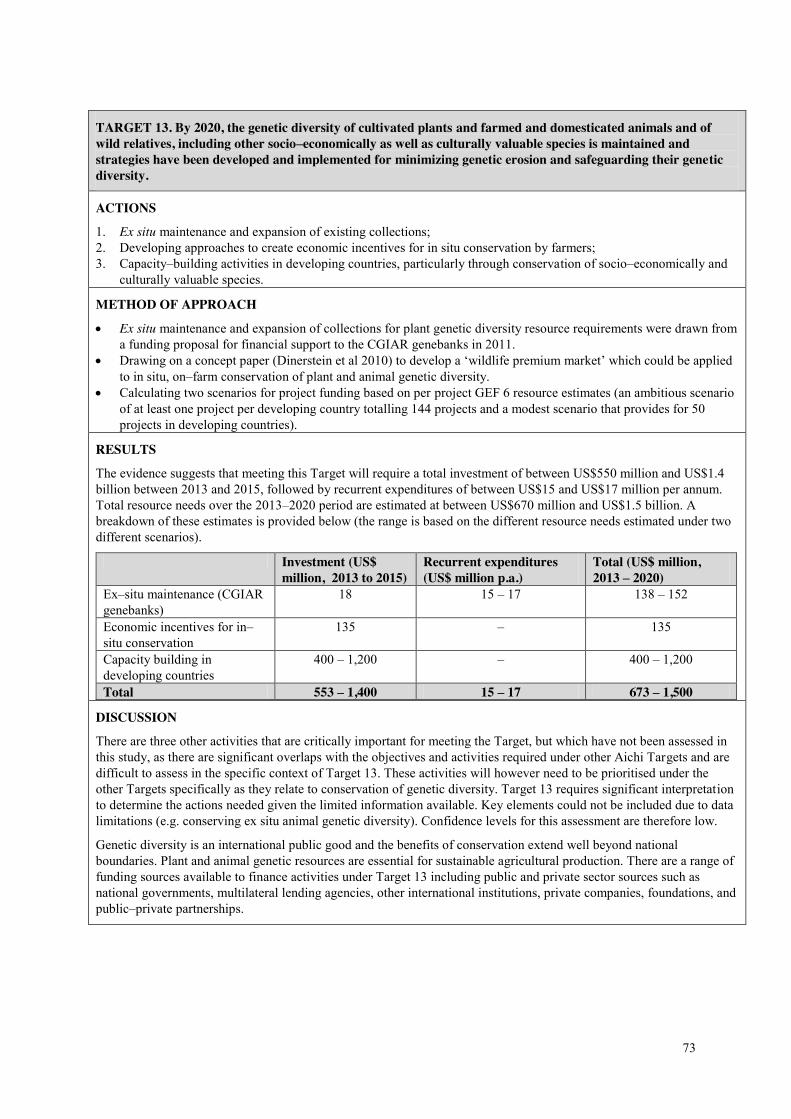
73
TARGET 13. By 2020, the genetic diversity of cultivated plants and farmed and domesticated animals and of wild relatives, including other socio–economically as well as culturally valuable species is maintained and strategies have been developed and implemented for minimizing genetic erosion and safeguarding their genetic diversity.
ACTIONS
1. Ex situ maintenance and expansion of existing collections; 2. Developing approaches to create economic incentives for in situ conservation by farmers; 3. Capacity–building activities in developing countries, particularly through conservation of socio–economically and
culturally valuable species.
METHOD OF APPROACH
x Ex situ maintenance and expansion of collections for plant genetic diversity resource requirements were drawn from a funding proposal for financial support to the CGIAR genebanks in 2011.
x Drawing on a concept paper (Dinerstein et al 2010) to develop a ‘wildlife premium market’ which could be applied to in situ, on–farm conservation of plant and animal genetic diversity.
x Calculating two scenarios for project funding based on per project GEF 6 resource estimates (an ambitious scenario of at least one project per developing country totalling 144 projects and a modest scenario that provides for 50 projects in developing countries).
RESULTS
The evidence suggests that meeting this Target will require a total investment of between US$550 million and US$1.4 billion between 2013 and 2015, followed by recurrent expenditures of between US$15 and US$17 million per annum. Total resource needs over the 2013–2020 period are estimated at between US$670 million and US$1.5 billion. A breakdown of these estimates is provided below (the range is based on the different resource needs estimated under two different scenarios).
Investment (US$ million, 2013 to 2015)
Recurrent expenditures (US$ million p.a.)
Total (US$ million, 2013 – 2020)
Ex–situ maintenance (CGIAR genebanks)
18 15 – 17 138 – 152
Economic incentives for in–situ conservation
135 – 135
Capacity building in developing countries
400 – 1,200 – 400 – 1,200
Total 553 – 1,400 15 – 17 673 – 1,500
DISCUSSION
There are three other activities that are critically important for meeting the Target, but which have not been assessed in this study, as there are significant overlaps with the objectives and activities required under other Aichi Targets and are difficult to assess in the specific context of Target 13. These activities will however need to be prioritised under the other Targets specifically as they relate to conservation of genetic diversity. Target 13 requires significant interpretation to determine the actions needed given the limited information available. Key elements could not be included due to data limitations (e.g. conserving ex situ animal genetic diversity). Confidence levels for this assessment are therefore low.
Genetic diversity is an international public good and the benefits of conservation extend well beyond national boundaries. Plant and animal genetic resources are essential for sustainable agricultural production. There are a range of funding sources available to finance activities under Target 13 including public and private sector sources such as national governments, multilateral lending agencies, other international institutions, private companies, foundations, and public–private partnerships.
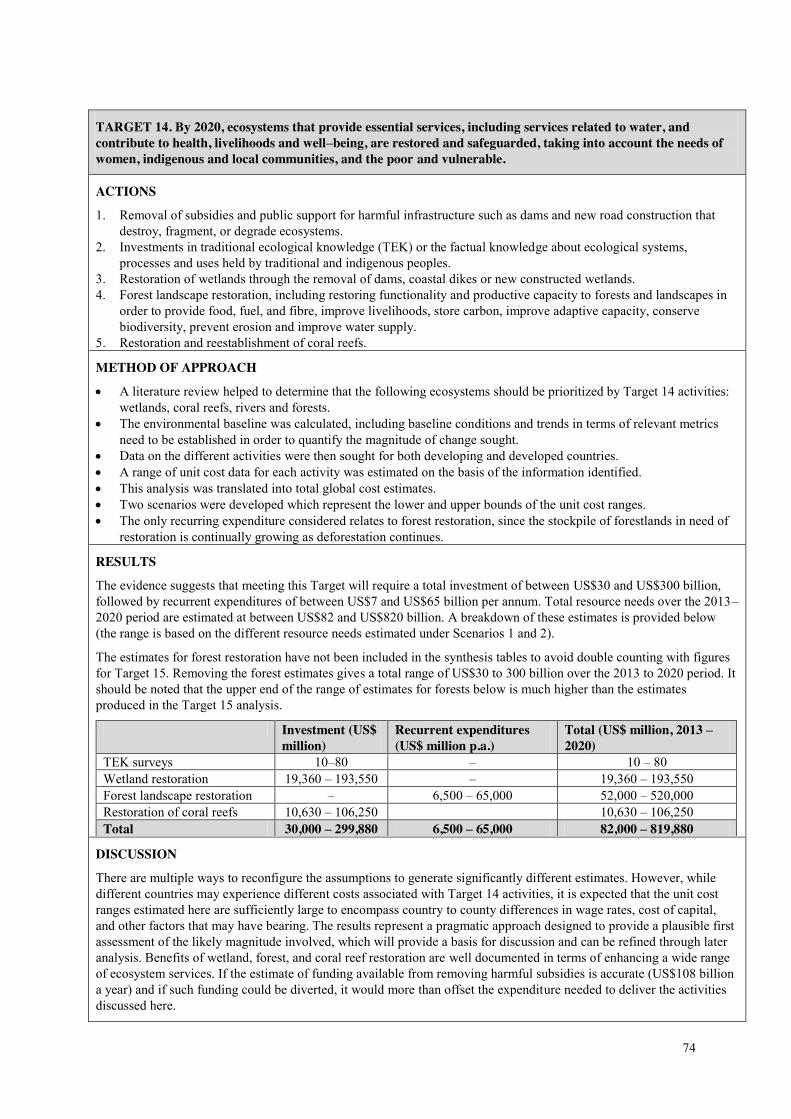
74
TARGET 14. By 2020, ecosystems that provide essential services, including services related to water, and contribute to health, livelihoods and well–being, are restored and safeguarded, taking into account the needs of women, indigenous and local communities, and the poor and vulnerable.
ACTIONS
1. Removal of subsidies and public support for harmful infrastructure such as dams and new road construction that destroy, fragment, or degrade ecosystems.
2. Investments in traditional ecological knowledge (TEK) or the factual knowledge about ecological systems, processes and uses held by traditional and indigenous peoples.
3. Restoration of wetlands through the removal of dams, coastal dikes or new constructed wetlands. 4. Forest landscape restoration, including restoring functionality and productive capacity to forests and landscapes in
order to provide food, fuel, and fibre, improve livelihoods, store carbon, improve adaptive capacity, conserve biodiversity, prevent erosion and improve water supply.
5. Restoration and reestablishment of coral reefs.
METHOD OF APPROACH
x A literature review helped to determine that the following ecosystems should be prioritized by Target 14 activities: wetlands, coral reefs, rivers and forests.
x The environmental baseline was calculated, including baseline conditions and trends in terms of relevant metrics need to be established in order to quantify the magnitude of change sought.
x Data on the different activities were then sought for both developing and developed countries. x A range of unit cost data for each activity was estimated on the basis of the information identified. x This analysis was translated into total global cost estimates. x Two scenarios were developed which represent the lower and upper bounds of the unit cost ranges. x The only recurring expenditure considered relates to forest restoration, since the stockpile of forestlands in need of
restoration is continually growing as deforestation continues.
RESULTS
The evidence suggests that meeting this Target will require a total investment of between US$30 and US$300 billion, followed by recurrent expenditures of between US$7 and US$65 billion per annum. Total resource needs over the 2013–2020 period are estimated at between US$82 and US$820 billion. A breakdown of these estimates is provided below (the range is based on the different resource needs estimated under Scenarios 1 and 2).
The estimates for forest restoration have not been included in the synthesis tables to avoid double counting with figures for Target 15. Removing the forest estimates gives a total range of US$30 to 300 billion over the 2013 to 2020 period. It should be noted that the upper end of the range of estimates for forests below is much higher than the estimates produced in the Target 15 analysis.
Investment (US$ million)
Recurrent expenditures (US$ million p.a.)
Total (US$ million, 2013 – 2020)
TEK surveys 10–80 – 10 – 80 Wetland restoration 19,360 – 193,550 – 19,360 – 193,550 Forest landscape restoration – 6,500 – 65,000 52,000 – 520,000 Restoration of coral reefs 10,630 – 106,250 10,630 – 106,250 Total 30,000 – 299,880 6,500 – 65,000 82,000 – 819,880
DISCUSSION
There are multiple ways to reconfigure the assumptions to generate significantly different estimates. However, while different countries may experience different costs associated with Target 14 activities, it is expected that the unit cost ranges estimated here are sufficiently large to encompass country to county differences in wage rates, cost of capital, and other factors that may have bearing. The results represent a pragmatic approach designed to provide a plausible first assessment of the likely magnitude involved, which will provide a basis for discussion and can be refined through later analysis. Benefits of wetland, forest, and coral reef restoration are well documented in terms of enhancing a wide range of ecosystem services. If the estimate of funding available from removing harmful subsidies is accurate (US$108 billion a year) and if such funding could be diverted, it would more than offset the expenditure needed to deliver the activities discussed here.
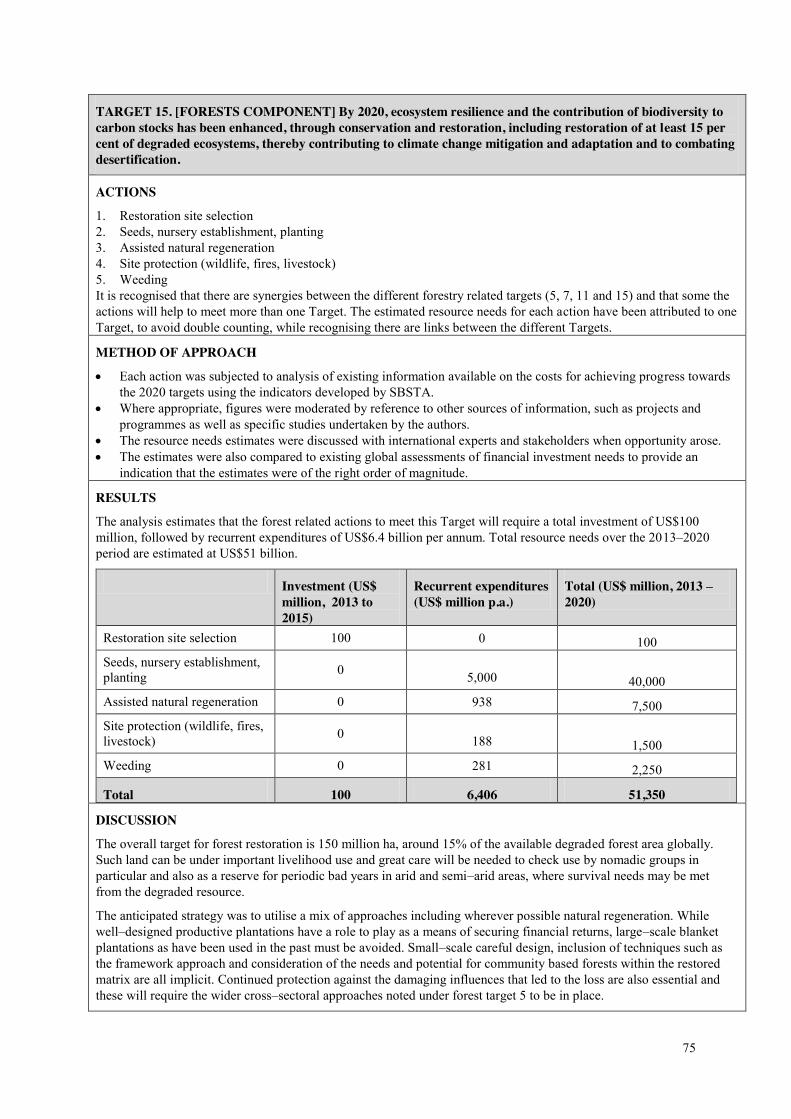
75
TARGET 15. [FORESTS COMPONENT] By 2020, ecosystem resilience and the contribution of biodiversity to carbon stocks has been enhanced, through conservation and restoration, including restoration of at least 15 per cent of degraded ecosystems, thereby contributing to climate change mitigation and adaptation and to combating desertification.
ACTIONS
1. Restoration site selection 2. Seeds, nursery establishment, planting 3. Assisted natural regeneration 4. Site protection (wildlife, fires, livestock) 5. Weeding It is recognised that there are synergies between the different forestry related targets (5, 7, 11 and 15) and that some the actions will help to meet more than one Target. The estimated resource needs for each action have been attributed to one Target, to avoid double counting, while recognising there are links between the different Targets.
METHOD OF APPROACH
x Each action was subjected to analysis of existing information available on the costs for achieving progress towards the 2020 targets using the indicators developed by SBSTA.
x Where appropriate, figures were moderated by reference to other sources of information, such as projects and programmes as well as specific studies undertaken by the authors.
x The resource needs estimates were discussed with international experts and stakeholders when opportunity arose. x The estimates were also compared to existing global assessments of financial investment needs to provide an
indication that the estimates were of the right order of magnitude.
RESULTS
The analysis estimates that the forest related actions to meet this Target will require a total investment of US$100 million, followed by recurrent expenditures of US$6.4 billion per annum. Total resource needs over the 2013–2020 period are estimated at US$51 billion.
Investment (US$ million, 2013 to 2015)
Recurrent expenditures (US$ million p.a.)
Total (US$ million, 2013 – 2020)
Restoration site selection 100 0 100 Seeds, nursery establishment, planting 0 5,000 40,000 Assisted natural regeneration 0 938 7,500 Site protection (wildlife, fires, livestock) 0 188 1,500 Weeding 0 281 2,250
Total 100 6,406 51,350
DISCUSSION
The overall target for forest restoration is 150 million ha, around 15% of the available degraded forest area globally. Such land can be under important livelihood use and great care will be needed to check use by nomadic groups in particular and also as a reserve for periodic bad years in arid and semi–arid areas, where survival needs may be met from the degraded resource.
The anticipated strategy was to utilise a mix of approaches including wherever possible natural regeneration. While well–designed productive plantations have a role to play as a means of securing financial returns, large–scale blanket plantations as have been used in the past must be avoided. Small–scale careful design, inclusion of techniques such as the framework approach and consideration of the needs and potential for community based forests within the restored matrix are all implicit. Continued protection against the damaging influences that led to the loss are also essential and these will require the wider cross–sectoral approaches noted under forest target 5 to be in place.
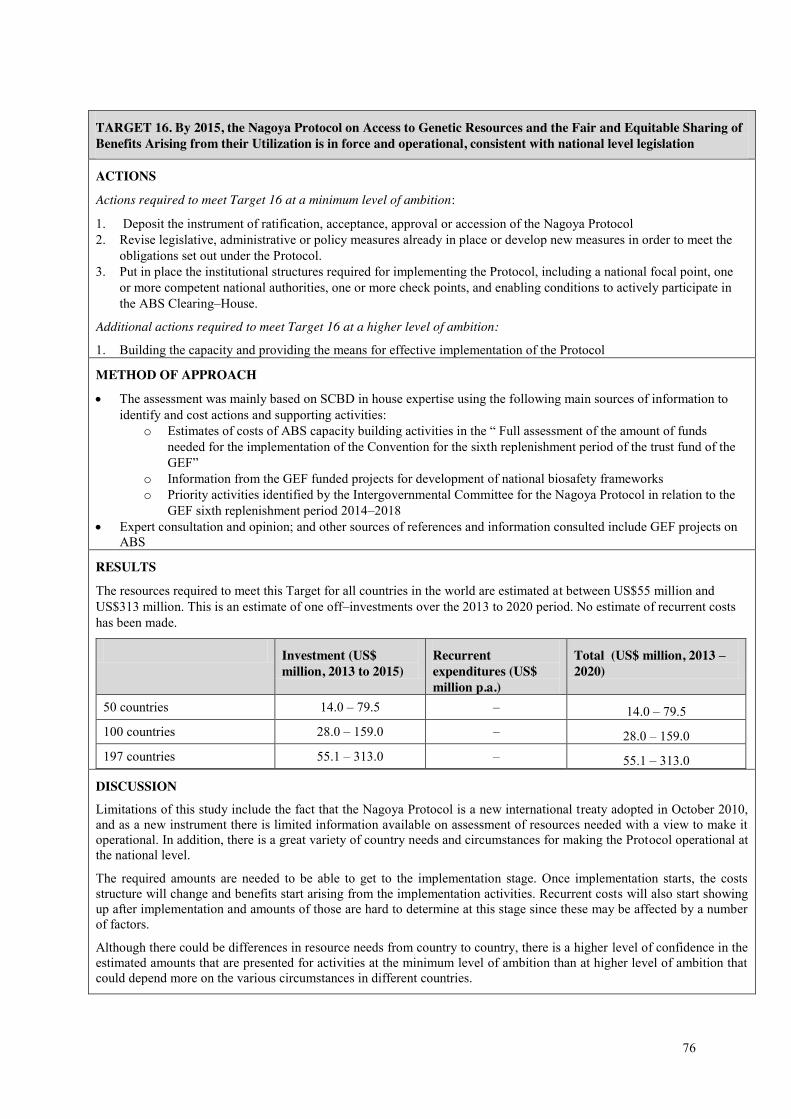
76
TARGET 16. By 2015, the Nagoya Protocol on Access to Genetic Resources and the Fair and Equitable Sharing of Benefits Arising from their Utilization is in force and operational, consistent with national level legislation
ACTIONS
Actions required to meet Target 16 at a minimum level of ambition:
1. Deposit the instrument of ratification, acceptance, approval or accession of the Nagoya Protocol 2. Revise legislative, administrative or policy measures already in place or develop new measures in order to meet the
obligations set out under the Protocol. 3. Put in place the institutional structures required for implementing the Protocol, including a national focal point, one
or more competent national authorities, one or more check points, and enabling conditions to actively participate in the ABS Clearing–House.
Additional actions required to meet Target 16 at a higher level of ambition:
1. Building the capacity and providing the means for effective implementation of the Protocol
METHOD OF APPROACH
x The assessment was mainly based on SCBD in house expertise using the following main sources of information to identify and cost actions and supporting activities:
o Estimates of costs of ABS capacity building activities in the “ Full assessment of the amount of funds needed for the implementation of the Convention for the sixth replenishment period of the trust fund of the GEF”
o Information from the GEF funded projects for development of national biosafety frameworks o Priority activities identified by the Intergovernmental Committee for the Nagoya Protocol in relation to the
GEF sixth replenishment period 2014–2018 x Expert consultation and opinion; and other sources of references and information consulted include GEF projects on
ABS
RESULTS
The resources required to meet this Target for all countries in the world are estimated at between US$55 million and US$313 million. This is an estimate of one off–investments over the 2013 to 2020 period. No estimate of recurrent costs has been made.
Investment (US$ million, 2013 to 2015)
Recurrent expenditures (US$ million p.a.)
Total (US$ million, 2013 – 2020)
50 countries 14.0 – 79.5 – 14.0 – 79.5 100 countries 28.0 – 159.0 – 28.0 – 159.0 197 countries 55.1 – 313.0 – 55.1 – 313.0
DISCUSSION Limitations of this study include the fact that the Nagoya Protocol is a new international treaty adopted in October 2010, and as a new instrument there is limited information available on assessment of resources needed with a view to make it operational. In addition, there is a great variety of country needs and circumstances for making the Protocol operational at the national level.
The required amounts are needed to be able to get to the implementation stage. Once implementation starts, the costs structure will change and benefits start arising from the implementation activities. Recurrent costs will also start showing up after implementation and amounts of those are hard to determine at this stage since these may be affected by a number of factors.
Although there could be differences in resource needs from country to country, there is a higher level of confidence in the estimated amounts that are presented for activities at the minimum level of ambition than at higher level of ambition that could depend more on the various circumstances in different countries.
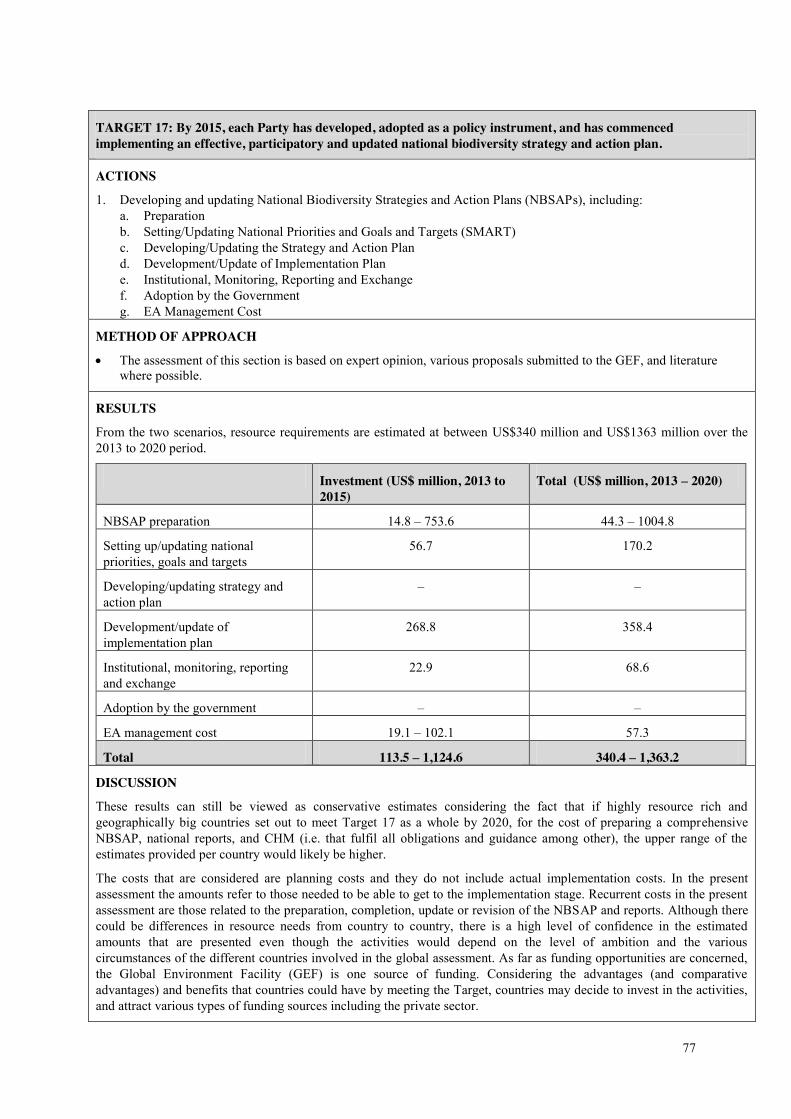
77
TARGET 17: By 2015, each Party has developed, adopted as a policy instrument, and has commenced implementing an effective, participatory and updated national biodiversity strategy and action plan.
ACTIONS
1. Developing and updating National Biodiversity Strategies and Action Plans (NBSAPs), including: a. Preparation b. Setting/Updating National Priorities and Goals and Targets (SMART) c. Developing/Updating the Strategy and Action Plan d. Development/Update of Implementation Plan e. Institutional, Monitoring, Reporting and Exchange f. Adoption by the Government g. EA Management Cost
METHOD OF APPROACH
x The assessment of this section is based on expert opinion, various proposals submitted to the GEF, and literature where possible.
RESULTS
From the two scenarios, resource requirements are estimated at between US$340 million and US$1363 million over the 2013 to 2020 period.
Investment (US$ million, 2013 to 2015)
Total (US$ million, 2013 – 2020)
NBSAP preparation 14.8 – 753.6 44.3 – 1004.8
Setting up/updating national priorities, goals and targets
56.7 170.2
Developing/updating strategy and action plan
– –
Development/update of implementation plan
268.8 358.4
Institutional, monitoring, reporting and exchange
22.9 68.6
Adoption by the government – –
EA management cost 19.1 – 102.1 57.3
Total 113.5 – 1,124.6 340.4 – 1,363.2
DISCUSSION
These results can still be viewed as conservative estimates considering the fact that if highly resource rich and geographically big countries set out to meet Target 17 as a whole by 2020, for the cost of preparing a comprehensive NBSAP, national reports, and CHM (i.e. that fulfil all obligations and guidance among other), the upper range of the estimates provided per country would likely be higher.
The costs that are considered are planning costs and they do not include actual implementation costs. In the present assessment the amounts refer to those needed to be able to get to the implementation stage. Recurrent costs in the present assessment are those related to the preparation, completion, update or revision of the NBSAP and reports. Although there could be differences in resource needs from country to country, there is a high level of confidence in the estimated amounts that are presented even though the activities would depend on the level of ambition and the various circumstances of the different countries involved in the global assessment. As far as funding opportunities are concerned, the Global Environment Facility (GEF) is one source of funding. Considering the advantages (and comparative advantages) and benefits that countries could have by meeting the Target, countries may decide to invest in the activities, and attract various types of funding sources including the private sector.
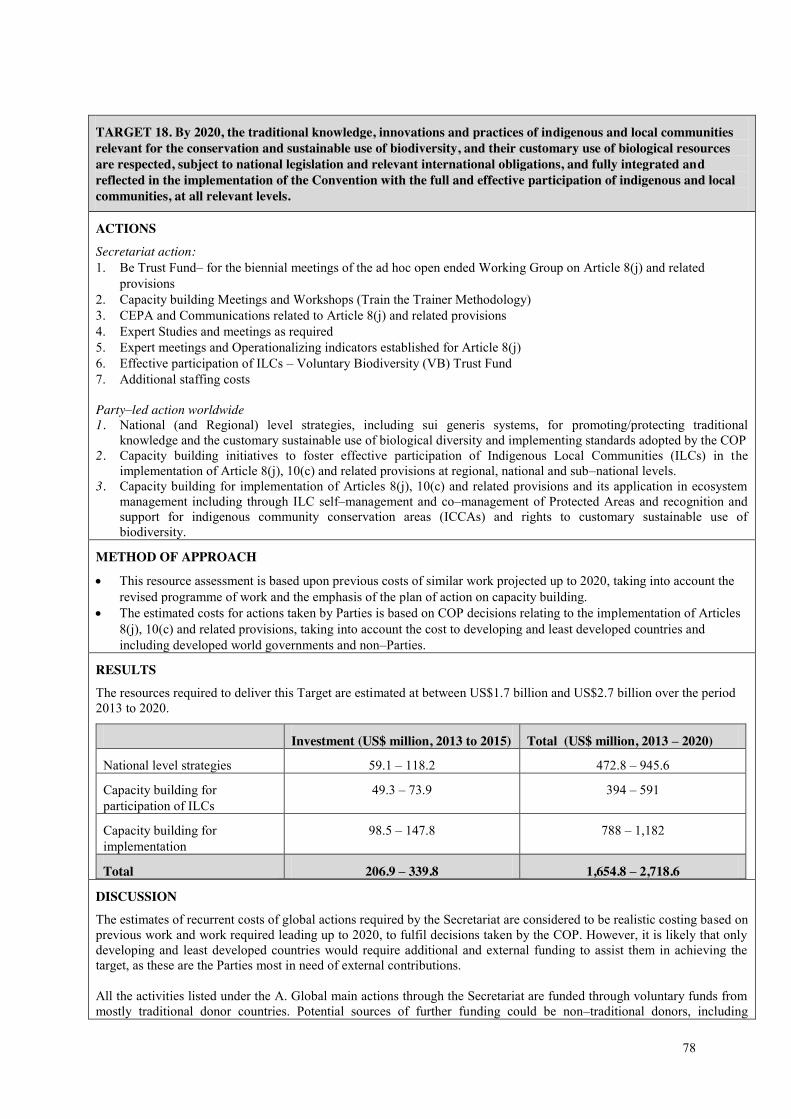
78
TARGET 18. By 2020, the traditional knowledge, innovations and practices of indigenous and local communities relevant for the conservation and sustainable use of biodiversity, and their customary use of biological resources are respected, subject to national legislation and relevant international obligations, and fully integrated and reflected in the implementation of the Convention with the full and effective participation of indigenous and local communities, at all relevant levels.
ACTIONS Secretariat action: 1. Be Trust Fund– for the biennial meetings of the ad hoc open ended Working Group on Article 8(j) and related
provisions 2. Capacity building Meetings and Workshops (Train the Trainer Methodology) 3. CEPA and Communications related to Article 8(j) and related provisions 4. Expert Studies and meetings as required 5. Expert meetings and Operationalizing indicators established for Article 8(j) 6. Effective participation of ILCs – Voluntary Biodiversity (VB) Trust Fund 7. Additional staffing costs
Party–led action worldwide 1. National (and Regional) level strategies, including sui generis systems, for promoting/protecting traditional
knowledge and the customary sustainable use of biological diversity and implementing standards adopted by the COP 2. Capacity building initiatives to foster effective participation of Indigenous Local Communities (ILCs) in the
implementation of Article 8(j), 10(c) and related provisions at regional, national and sub–national levels. 3. Capacity building for implementation of Articles 8(j), 10(c) and related provisions and its application in ecosystem
management including through ILC self–management and co–management of Protected Areas and recognition and support for indigenous community conservation areas (ICCAs) and rights to customary sustainable use of biodiversity.
METHOD OF APPROACH
x This resource assessment is based upon previous costs of similar work projected up to 2020, taking into account the revised programme of work and the emphasis of the plan of action on capacity building.
x The estimated costs for actions taken by Parties is based on COP decisions relating to the implementation of Articles 8(j), 10(c) and related provisions, taking into account the cost to developing and least developed countries and including developed world governments and non–Parties.
RESULTS The resources required to deliver this Target are estimated at between US$1.7 billion and US$2.7 billion over the period 2013 to 2020.
Investment (US$ million, 2013 to 2015) Total (US$ million, 2013 – 2020)
National level strategies 59.1 – 118.2 472.8 – 945.6
Capacity building for participation of ILCs
49.3 – 73.9 394 – 591
Capacity building for implementation
98.5 – 147.8 788 – 1,182
Total 206.9 – 339.8 1,654.8 – 2,718.6
DISCUSSION The estimates of recurrent costs of global actions required by the Secretariat are considered to be realistic costing based on previous work and work required leading up to 2020, to fulfil decisions taken by the COP. However, it is likely that only developing and least developed countries would require additional and external funding to assist them in achieving the target, as these are the Parties most in need of external contributions. All the activities listed under the A. Global main actions through the Secretariat are funded through voluntary funds from mostly traditional donor countries. Potential sources of further funding could be non–traditional donors, including

79
emerging and developing economies and economies in transition or even the private sector. At this time, funds for developing and least developed Parties are mainly sources through GEF and do not target Article 8(j) or 10(c) related activities, and thus there is little if any assistance for Parties for actions to implement Target 18 related articles.
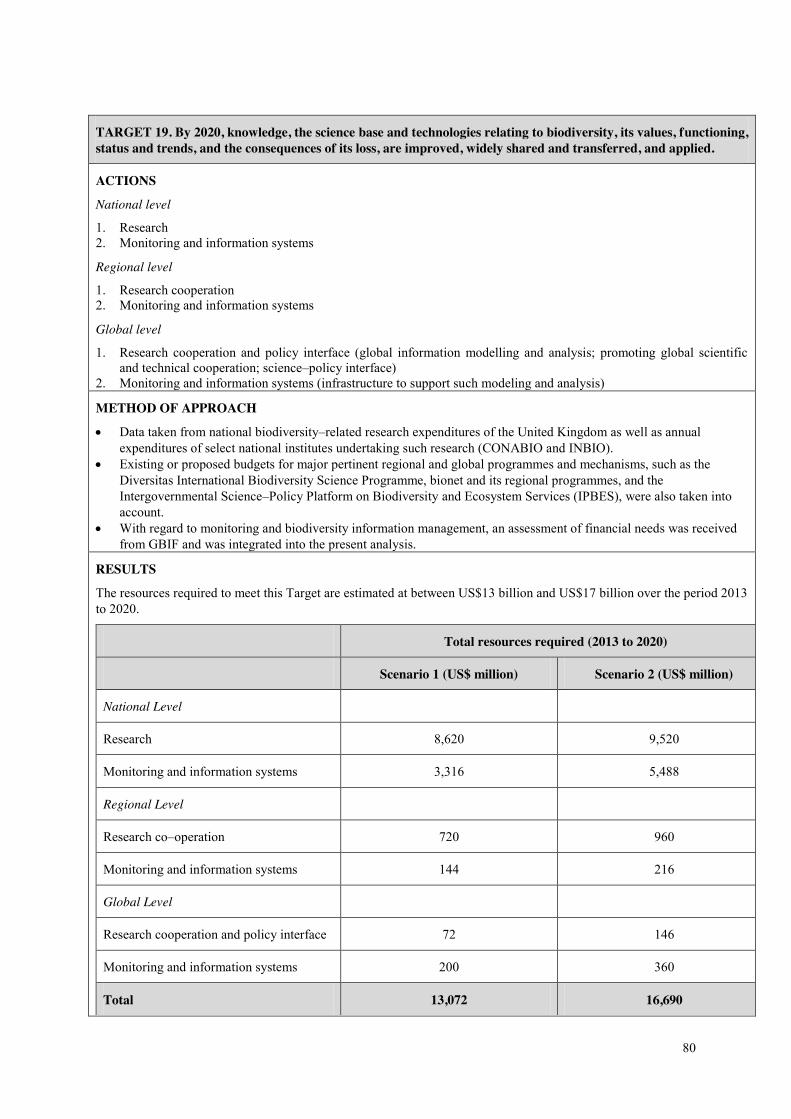
80
TARGET 19. By 2020, knowledge, the science base and technologies relating to biodiversity, its values, functioning, status and trends, and the consequences of its loss, are improved, widely shared and transferred, and applied.
ACTIONS
National level
1. Research 2. Monitoring and information systems
Regional level
1. Research cooperation 2. Monitoring and information systems
Global level
1. Research cooperation and policy interface (global information modelling and analysis; promoting global scientific and technical cooperation; science–policy interface)
2. Monitoring and information systems (infrastructure to support such modeling and analysis)
METHOD OF APPROACH
x Data taken from national biodiversity–related research expenditures of the United Kingdom as well as annual expenditures of select national institutes undertaking such research (CONABIO and INBIO).
x Existing or proposed budgets for major pertinent regional and global programmes and mechanisms, such as the Diversitas International Biodiversity Science Programme, bionet and its regional programmes, and the Intergovernmental Science–Policy Platform on Biodiversity and Ecosystem Services (IPBES), were also taken into account.
x With regard to monitoring and biodiversity information management, an assessment of financial needs was received from GBIF and was integrated into the present analysis.
RESULTS
The resources required to meet this Target are estimated at between US$13 billion and US$17 billion over the period 2013 to 2020.
Total resources required (2013 to 2020)
Scenario 1 (US$ million) Scenario 2 (US$ million)
National Level
Research 8,620 9,520
Monitoring and information systems 3,316 5,488
Regional Level
Research co–operation 720 960
Monitoring and information systems 144 216
Global Level
Research cooperation and policy interface 72 146
Monitoring and information systems 200 360
Total 13,072 16,690

81
DISCUSSION
Target 19 also relates to technology transfer which, according to Article 16 of the Convention, is essential to attain its objectives. However, no attempt is made here to quantify associated expenditures as a separate activity. This approach has been taken because it has been recognized under the Convention that “technology transfer, in particular in the context of the third objective of the Convention, will not be effective as an on–off and one–way activity, but needs to be embedded in integrated, long–term scientific and technological cooperation, which may involve the joint development of new technologies and, as based on reciprocity, would also provide a key mechanism for the effective building or enhancement of capacity in developing countries and countries with economies in transition.” Such integration is needed because technologies that are relevant for implementing the Convention are frequently ‘soft’ technologies (technological information or know–how), and it is such ‘soft’ technology that “is often transferred within long–term scientific and technological cooperation including though joint research and innovation which move ideas from invention to new products, processes and services.” Scientific and technological cooperation is however an integral part of research, and trying to showcase associated expenditures separately would arguably imply a major risk of double–counting.
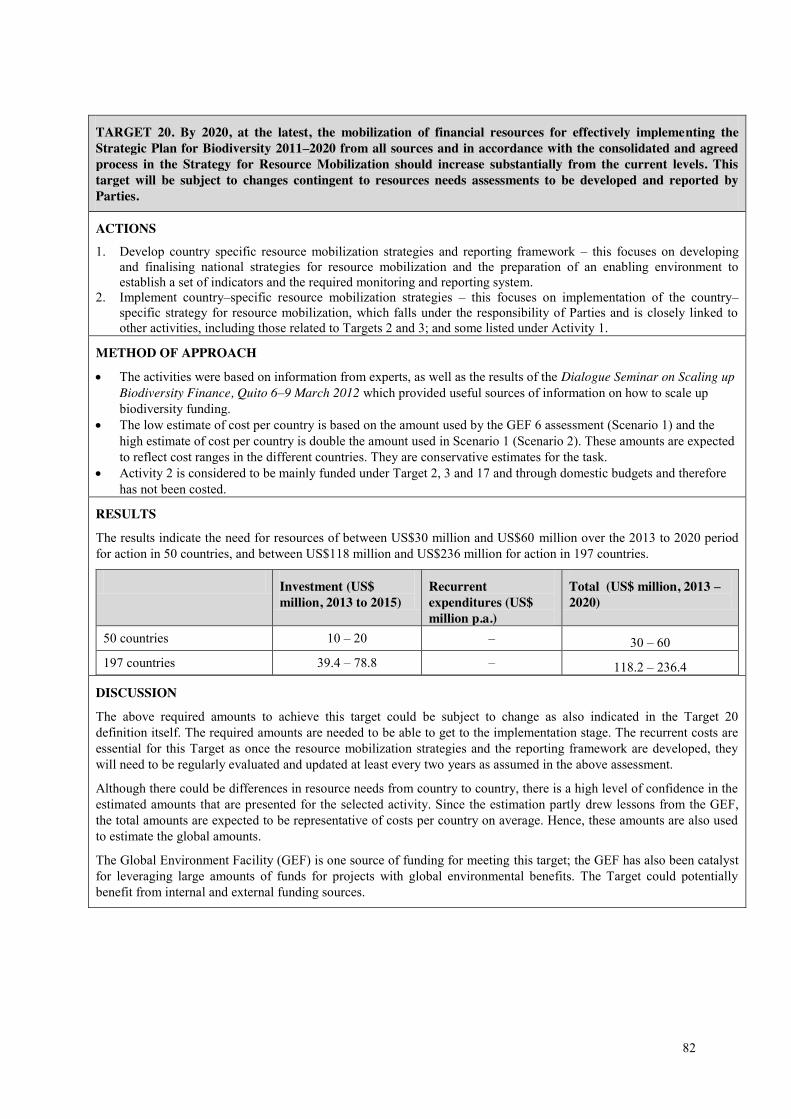
82
TARGET 20. By 2020, at the latest, the mobilization of financial resources for effectively implementing the Strategic Plan for Biodiversity 2011–2020 from all sources and in accordance with the consolidated and agreed process in the Strategy for Resource Mobilization should increase substantially from the current levels. This target will be subject to changes contingent to resources needs assessments to be developed and reported by Parties.
ACTIONS 1. Develop country specific resource mobilization strategies and reporting framework – this focuses on developing
and finalising national strategies for resource mobilization and the preparation of an enabling environment to establish a set of indicators and the required monitoring and reporting system.
2. Implement country–specific resource mobilization strategies – this focuses on implementation of the country–specific strategy for resource mobilization, which falls under the responsibility of Parties and is closely linked to other activities, including those related to Targets 2 and 3; and some listed under Activity 1.
METHOD OF APPROACH
x The activities were based on information from experts, as well as the results of the Dialogue Seminar on Scaling up Biodiversity Finance, Quito 6–9 March 2012 which provided useful sources of information on how to scale up biodiversity funding.
x The low estimate of cost per country is based on the amount used by the GEF 6 assessment (Scenario 1) and the high estimate of cost per country is double the amount used in Scenario 1 (Scenario 2). These amounts are expected to reflect cost ranges in the different countries. They are conservative estimates for the task.
x Activity 2 is considered to be mainly funded under Target 2, 3 and 17 and through domestic budgets and therefore has not been costed.
RESULTS
The results indicate the need for resources of between US$30 million and US$60 million over the 2013 to 2020 period for action in 50 countries, and between US$118 million and US$236 million for action in 197 countries.
Investment (US$ million, 2013 to 2015)
Recurrent expenditures (US$ million p.a.)
Total (US$ million, 2013 – 2020)
50 countries 10 – 20 – 30 – 60 197 countries 39.4 – 78.8 – 118.2 – 236.4
DISCUSSION
The above required amounts to achieve this target could be subject to change as also indicated in the Target 20 definition itself. The required amounts are needed to be able to get to the implementation stage. The recurrent costs are essential for this Target as once the resource mobilization strategies and the reporting framework are developed, they will need to be regularly evaluated and updated at least every two years as assumed in the above assessment.
Although there could be differences in resource needs from country to country, there is a high level of confidence in the estimated amounts that are presented for the selected activity. Since the estimation partly drew lessons from the GEF, the total amounts are expected to be representative of costs per country on average. Hence, these amounts are also used to estimate the global amounts.
The Global Environment Facility (GEF) is one source of funding for meeting this target; the GEF has also been catalyst for leveraging large amounts of funds for projects with global environmental benefits. The Target could potentially benefit from internal and external funding sources.
83
VIII. REFERENCES
Balmford, A., Bruner, A., Cooper, P., Costanza, R., Farber, S., Green, R. E., et al. (2002). Economic Reasons for Conserving Wild Nature. Science , 297 (5583), 950-953.
Braat, L., ten Brink, P., & eds. (2008). The Cost of Policy Inaction - The case of not meeting the 2010 biodiversity target. Retrieved from http://ec.europa.eu/environment/enveco/biodiversity/index.htm#_Toc240787000
Hussain, S. S., Brander, L., McVittie, A., Vardakoulias, O., Wagtendonk, A., Verburg, P., et al. (2011). The Economics of Ecosystems and Biodiversity Quantitative Assessment Final Report. Geneva: UNEP.
Institute for European Environmental Policy. (2012, June 22). Estimating the Overall Economic Value of the Benefits provided by the Natura 2000 Network . Retrieved from http://www.ieep.eu/publications/2012/06/estimating-the-overall-economic-value-of-the-benefits-provided-by-the-natura-2000-network
Secretariat of the Convention on Biological Diversity. (2011). Collection of Submissions on Innovative Financial Mechanisms. UNEP/CBD/SRM/Innovative-Financial-Mechanisms/1. Secretariat of the Convention on Biological Diversity.
Secretariat of the Convention on Biological Diversity. (2010). Global Monitoring Report 2010 - Innovative Financing for Biodiversity (UNEP/CBD/COP/10/INF/22). Retrieved from http://www.cbd.int/financial/doc/global-monitoring-report-2010-en.pdf
TEEB. (2010). TEEB Synthesis Report. Retrieved from http://www.teebweb.org/Portals/25/TEEB%20Synthesis/TEEB_SynthReport_09_2010_online.pdf
Turner, W. R., Brandon, K., Brooks, T. M., Gascon, C., Gibbs, H. K., Lawrence, K. S., et al. (2012). Global Biodiversity Conservation and the Alleviation of Poverty. BioScience , 62 (1).