Embed Size (px)
Citation preview
Respiratory Arrest and Cardiovascular Collapse in a Young Autistic
Woman
Mario D. Gonzalez M.D. PhD.
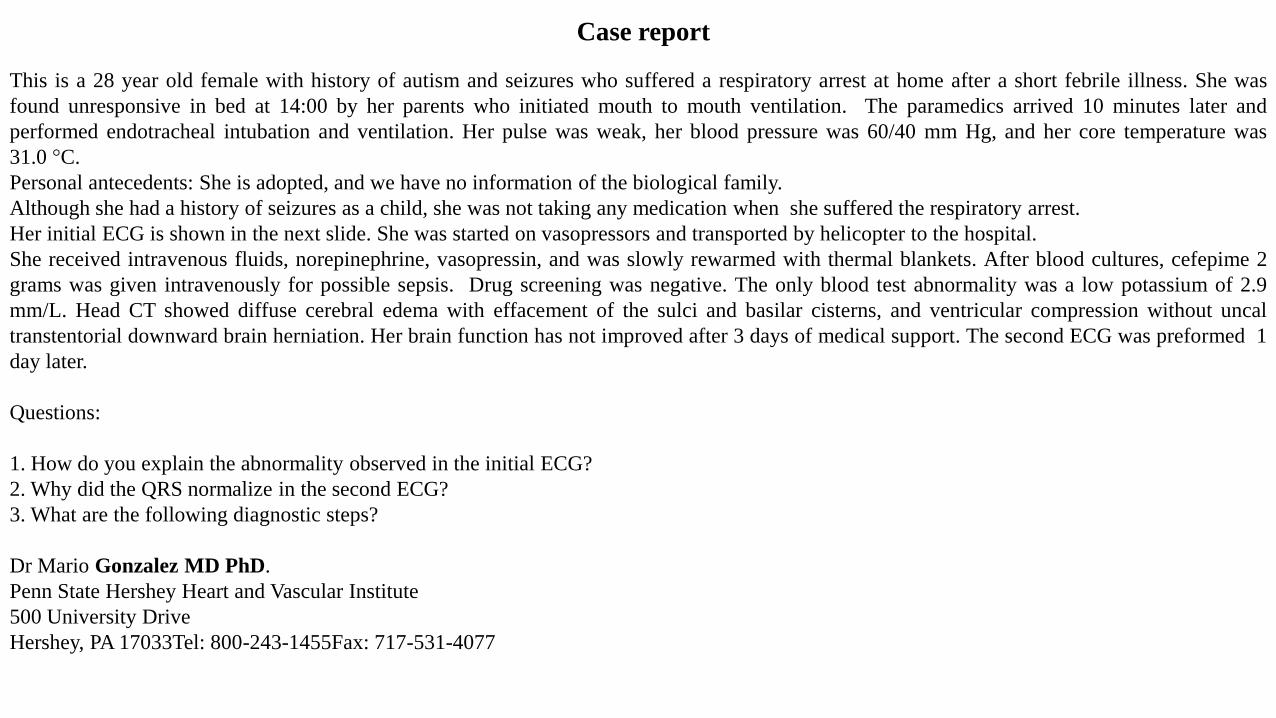
This is a 28 year old female with history of autism and seizures who suffered a respiratory arrest at home after a short febrile illness. She was
found unresponsive in bed at 14:00 by her parents who initiated mouth to mouth ventilation. The paramedics arrived 10 minutes later and
performed endotracheal intubation and ventilation. Her pulse was weak, her blood pressure was 60/40 mm Hg, and her core temperature was
31.0 °C.
Personal antecedents: She is adopted, and we have no information of the biological family.
Although she had a history of seizures as a child, she was not taking any medication when she suffered the respiratory arrest.
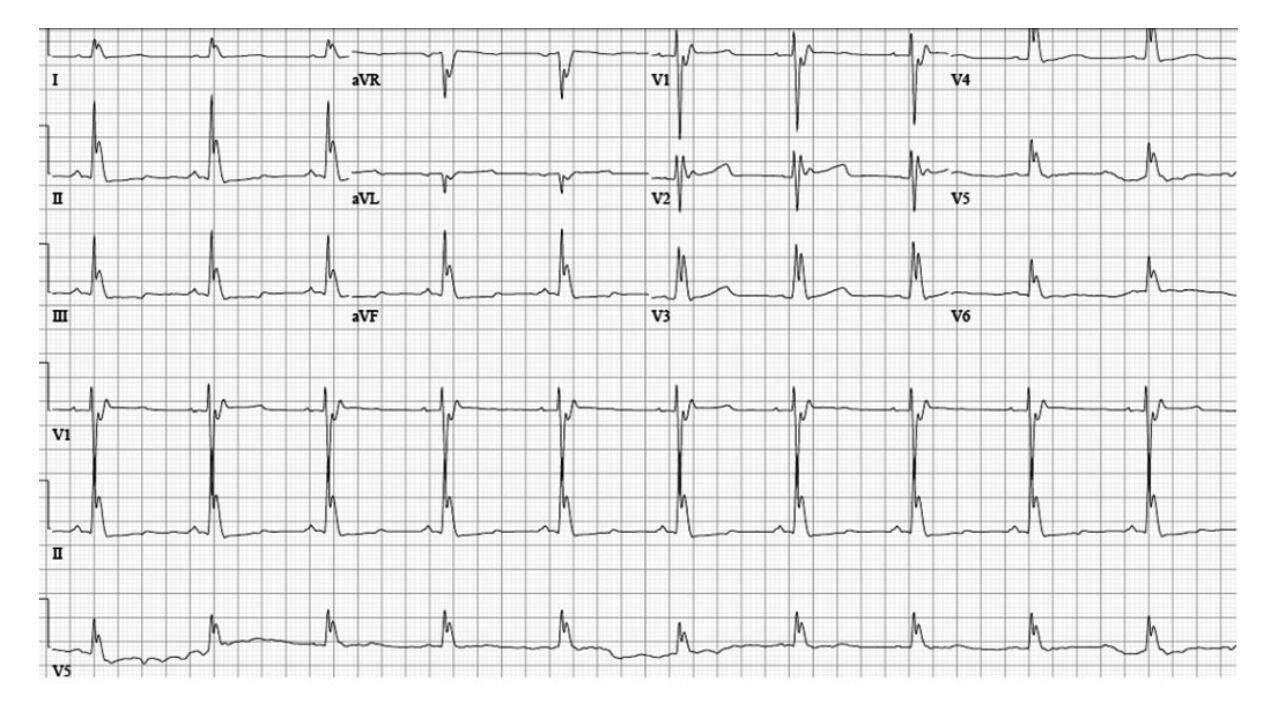
Her initial ECG is shown in the next slide. She was started on vasopressors and transported by helicopter to the hospital.
She received intravenous fluids, norepinephrine, vasopressin, and was slowly rewarmed with thermal blankets. After blood cultures, cefepime 2
grams was given intravenously for possible sepsis. Drug screening was negative. The only blood test abnormality was a low potassium of 2.9
mm/L. Head CT showed diffuse cerebral edema with effacement of the sulci and basilar cisterns, and ventricular compression without uncal
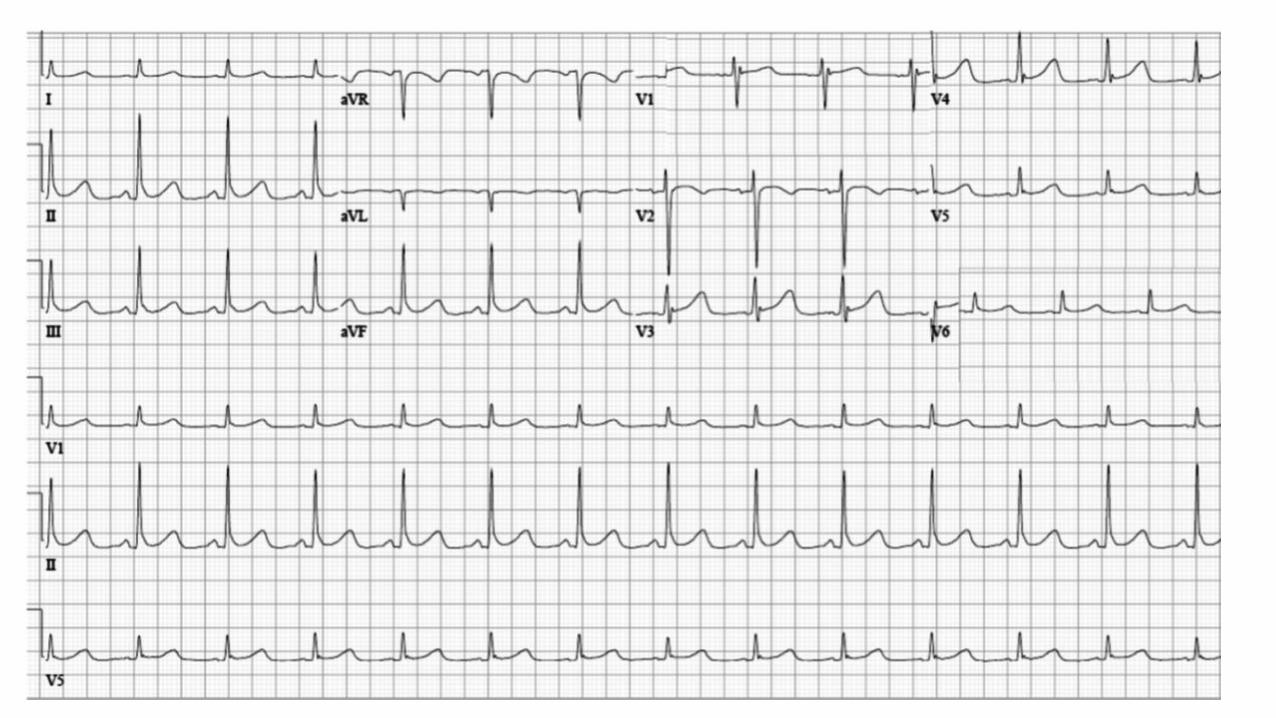
transtentorial downward brain herniation. Her brain function has not improved after 3 days of medical support. The second ECG was preformed 1
day later.
Questions:
1. How do you explain the abnormality observed in the initial ECG?
2. Why did the QRS normalize in the second ECG?
3. What are the following diagnostic steps?
Dr Mario Gonzalez MD PhD.
Penn State Hershey Heart and Vascular Institute
500 University Drive
Hershey, PA 17033Tel: 800-243-1455Fax: 717-531-4077
Case report

Colleagues opinions
Hi Thanks Mario for this incredible ECG and case!
1. The first ECG resembles the one from hypothermia with diffuse Osborn waves
2. It would be nice to determine whether hypokalemia presented along with acidosis, as some of the "J-waves" seen in the limb leads resemble
acidosis too. So my question is:
3. Are we assisting to an ECG of the recovery phase of something else than spontaneously terminated?
4. QT is quite prolonged: is this the initial event? Long QT syndrome, self-terminated VF, hypothermia and hypokalemia and acidosis?
5. Is this a primary neurological event?
6. My plan from the CV perspective
Echo: to R/O structural heart disease and;
Cardiac MRI to visualize the RV (R/O ARVD) and check the septum
If neurological recovery, Epinephrine test (long QT) and Procainamide/Ajmaline test (Brugada)
I do not think that this is primarily ischemic (young woman) but the echo will help in determining whether we need to R/O CAD.
Renal function, filtration etc with sodium and potassium in urine to determine whether there is a structural reason for hypokalemia;
playing a role on possible self limited VF...
I would like to hear other opinions
Thanks for sharing this case AB
Dear Andres, Mario, and friends,
The first ECG from this sad case of autism and seizures shows the characteristic changes of hypothermia with large J (Osborn) waves in all leads.
The QT interval (~500 ms) is also prolonged which is another finding in hypothermia. Since the clinical story does not suggest that the patient
was exposed to an unusually cold external environment, the likely cause of the hypothermic condition is impaired central nervous system
temperature regulation perhaps related the abnormalities seen on her brain scan. It is possible that sepsis also played a role. Workup should rule
out other endocrine abnormalities that might be associated with impaired temperature regulation and decreased heat production (hypothyroidism,
hypopituitarism, and hypoadrenalism). The second ECG shows resolution of the large J waves as the patient was warmed.
I will be interested in the valuable opinions of other contributors in this case.
Best regards,
Frank G. Yanowitz, M.D. Professor of Medicine University of
Utah School of Medicine Medical Director,
ECG Services Intermountain Healthcare. Alan Lindsay. ECG Outline·
Live Well Center-Salt Lake City
389 S 900 E
Salt Lake City, UT 84102 USA.
If the first ECG was taken prior to hypothermia it is classic for the J wave syndrome with tall J waves in the inferolateral leads and likely cause of
cardiac arrest especially if she was at rest or sleeping. The drug of choice would be Quinidine, consider ICD if co morbidities are not
contraindication.
Melvin M Scheinman Professor of Medicine Electrophysiology Service
Department of Cardiac Electrophysiology, University of California San Francisco, San Francisco, California, USA.
500 Parnassus Avenue
Boa noite Professor, primeiramente obrigado por me incluir em seus contatos e me enviar esse caso. Vou dar minha humilde opinião com um mero
R1 de clínica médica (desculpe-me se estiver errado)
O primeiro ECG tem características de hipotermia, com ondas J (de Osborn) evidentes e aumento do intervalo QT.
O segundo ECG é um ritmo sinusal, com atraso final de condução tipo III e padrão de repolarização precoce, com normalização do QRS após o
aquecimento da paciente.
Os próximos passos diagnósticos devem ser voltados para a avaliação neurológica: punção lombar se possível, RNM e pesquisa de causas
metabólicas.
Espero receber mais casos interessantes como esse.
Um abraço cordial,
Gabriel Afonso Dutra Kreling R1 de clinica Medica
English
Good evening, Professor,
First, thank you for including me in your contacts and for sending me this case.
I will express my modest opinion as a mere 1st year resident in clinical practice
(I apologize if I am mistaken).
The first ECG has characteristics of hypothermia, with evident J waves (Osborn waves) and increase in QT interval.
The second ECG is sinus rhythm, with type III end conduction delay and early repolarization pattern, with QRS normalization after warming up
the patient.
The next diagnostic steps should be sent to a neurological evaluation: spinal tap if possible, NMR and research of metabolic causes.
I hope you receive more interesting cases like this one.
Cordially,
Gabriel Kreling R1 de clinica Medica
Querido Potro: En el ECG inicial las típicas Ondas J de Osborn descriptas por hipotermia con temperaturas menores a 32,2 grados, además se
encuentra la bradicardia sinusal, asociada a prolongación progresiva del intervalo PR, el complejo QRS y el intervalo QTc. Asimismo la
hipokalemia severa es causa de falla muscular e insuficiencia respiratoria, también anormalidades del fósforo y magnesio,
causando Insuficiencia respiratoria aguda.
En el segundo electrocardiograma mejoro la FC a 75 latidos por minutos pero presenta un QTC prolongado, refiere no se utilizo ningún
medicamento previo. El mismo autismo puede asociarse con QT prolongado (El síndrome del QT largo SQTL 8 o síndrome de Timothy de
carácter genético, pero se asocia a cardiopatías congénitas, sindactilia, hipoglucemia intermitente, desarrollo tardío y autismo. De está paciente
solo refieren autismo, así que supongo que el QT prolongado debe ser por la hipopotasemia, o hipomagnesemia asociada.
Que la MS se haya presentado en el contexto de un Síndrome febril obviamente obliga a descartar una canalopatía, luego de la reanimación
presenta un Supra ST elevado y ondas J en cara inferior y de V3 a V6.
Asimismo la fiebre causa un estado catecolaminérgico similar al ejercicio, que puede contribuir a la aparición de arritmias como la taquicardia
ventricular polimorfa.
Por lo referido presenta hipertensión endocraneana por encefalitis o por la hipoxia en la reanimación dado por el edema intersticial que presenta
también puede ser secundaria a la utilización de soluciones salinas hipertónicas y manitol en su tratamiento o su uso en la reanimación
cardiopulmonar. Creo una RNM de cerebro brindaría mejor definición que una TAC y realizaría con cuidado una punción de LCR para su análisis
y cultivo.
Descartó virus de la inmunodeficiencia? dado que desconocen antecedentes dado que puede dar meningitis por criptococo que suele ocasionar
edema difuso cerebral e hipertensión endocraneana además del síndrome febril.
Un abrazo
Martín Ibarrola
Dear Pony: In the initial ECG typical Osborn J waves described by hypothermia with temperatures below 32.2 degrees, plus sinus bradycardia
associated with progressive prolongation of the PR interval, QRS complex and QTc interval. Also severe hypokalemia causes muscle and
respiratory failure, also phosphorus and magnesium abnormalities, causing acute respiratory failure.
In the second ECG the HR normalizes (75 beats per minute) but remains the prolonged QTc, it refers any previous medication was not used. The
same autism may be associated with prolonged QT (the long QT syndrome LQTS 8 or Timothy genetic character syndrome, but is associated with
congenital heart defects, syndactyly, intermittent hypoglycemia, late and autism development. This patient only refer autism, so I guess prolonged
QT should be by hypokalemia, or hypomagnesemia associated.
The event has been presented in the context of a febrile syndrome must be ruled obviously a channelopathy after resuscitation has ST segment
elevation in inferior leads and V3 to V6.
Fever also causes a similar exercise catecholaminergic state, which may contribute to the onset of arrhythmias such as polymorphic ventricular
tachycardia.
It has referred encephalitis intracranial hypertension or hypoxia in resuscitation given by interstitial edema that presents can also be secondary to
the use of hypertonic saline and mannitol solutions treatment or use in cardiopulmonary resuscitation. I think an MRI brain would provide a better
definition TAC and perform carefully puncture for CSF analysis and culture.
Did you rule out immunodeficiency virus? as unknown background can give as cryptococcal meningitis usually cause diffuse cerebral edema and
intracranial hypertension in addition to the febrile syndrome.
Hugs
Martín Ibarrola, MD from Argentina
Final comments by.....
I also have the right to have my "Yoko Ono". This is my wife Helena Akemi.
Possible diagnosis sequence: Autism spectrum disorder (ASD) Mitochondrial dysfunction dysautonomia (or autonomic neuropathy)
Impaired thermogenesis moderate hypothermia ( remember that her core temperature was 31.0 °C.) Respiratory Arrest
Cardiovascular Collapse.
I. Mild hypothermia: 32-35°C or 90°-95°F;
II. Moderate hypothermia: (28-32°C or 82°-90° F);
III. Severe hypothermia: less than 28°C.
Autism spectrum disorder (ASD) is a devastating neurodevelopmental disorder. Evidence has emerged that some children, adolescents and young
adults with ASD suffer from undiagnosed comorbid medical conditions. One of the medical disorders that has been consistently associated with
ASD is mitochondrial dysfunction. Individuals with mitochondrial disorders without concomitant ASD manifest dysfunction in multiple high-
energy organ systems, such as the central nervous, muscular, and gastrointestinal systems. Interestingly, these are the identical organ systems
affected in a significant number of patients with ASD. Mitochondrial dysfunction may lead to the emergence of dysautonomia.
What is dysautonomia? For many, it is a one word description that explains some of the most troublesome and puzzling symptoms that adults and
children with mitochondrial disease experience. The autonomic nervous system functions to moderate and allow adaption of the body to
everything in our environment. The autonomic nervous system, when functioning properly, regulates the response to very basic changes such as
body temperature, walking, sitting, sleeping, eating, desiring, and digesting food, thirst, etc. Dysfunction of the autonomic nervous system, also
known as dysautonomia, can present some of the greatest daily quality of life challenges for people who are affected. This finding increases the
possibility that mitochondrial dysfunction may be one of the keys that explains the many diverse symptoms observed in some individuals with
ASD. Frye et al (Frye 2011). Mitochondria are a predominant source of reactive oxygen species (ROS), especially in the context of abnormal
electron transport chain function (Trushina2007). Individuals with ASD have been shown, as a group, to be under higher oxidative stress and have
reduced levels of antioxidants as compared to controls (James 2009). It is likely that mitochondrial dysfunction could be the cause of abnormally
high levels of oxidative stress found in ASD individuals. Mitochondrial function can also contribute to abnormalities in neuronal functional that
have been reported in ASD. For example, an imbalance in the excitatory (glutamate) and inhibitory (gamma-aminobutyric acid) neurotransmitter
systems has been implicated in the pathogenesis of ASD, with a relative increase in the excitatory-to-inhibitory ratio. Mitochondrial dysfunction
can lead to reduced synaptic neurotransmitter release in neurons that have high firing rates, such as inhibitory gamma-aminobutyric acid
interneurons. Thus, mitochondrial dysfunction can result in a reduction in inhibition and the relative increase in the excitatory-to-inhibitory ratio
observed in ASD. Furthermore, calcium signaling is essential for the integrity of synaptic function and abnormal calcium signaling has also been
implicated in ASD. Mitochondria are well known to have a pivotal role in the regulation of plasma membrane calcium channels and transporter
activities.
This new understanding of ASD should provide researchers a pathway for understanding the etiopathogenesis of ASD and clinicians the potential
to develop medical therapies. Disorders of energy metabolism have been associated with ASD. Children with autism were more likely to
have mitochondrial dysfunction, mtDNA over replication, and mtDNA deletions than typically developing children (Giulivi 2010).
Mitochondria are the main intracellular source of oxygen free radicals, which are very reactive and can harm cellular structures and DNA. Cells
can repair typical levels of oxidative damage. However, in the children with autism the cells produced more free radicals and were less able to
repair the damage, and as a result experienced more oxidative stress. The free radical levels in the blood cells of children with autism were 1 ½
times greater than those without the disorder.
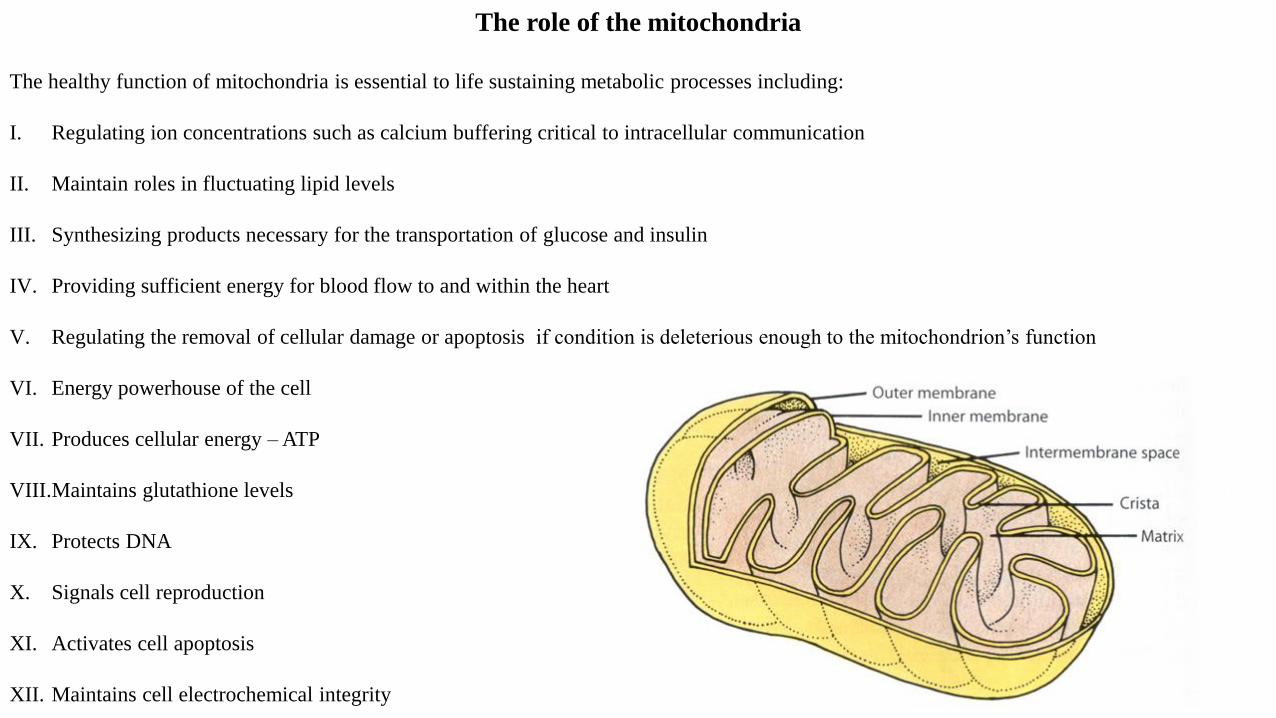
The healthy function of mitochondria is essential to life sustaining metabolic processes including:
I. Regulating ion concentrations such as calcium buffering critical to intracellular communication
II. Maintain roles in fluctuating lipid levels
III. Synthesizing products necessary for the transportation of glucose and insulin
IV. Providing sufficient energy for blood flow to and within the heart
V. Regulating the removal of cellular damage or apoptosis if condition is deleterious enough to the mitochondrion’s function
VI. Energy powerhouse of the cell
VII. Produces cellular energy – ATP
VIII.Maintains glutathione levels
IX. Protects DNA
X. Signals cell reproduction
XI. Activates cell apoptosis
XII. Maintains cell electrochemical integrity
The role of the mitochondria
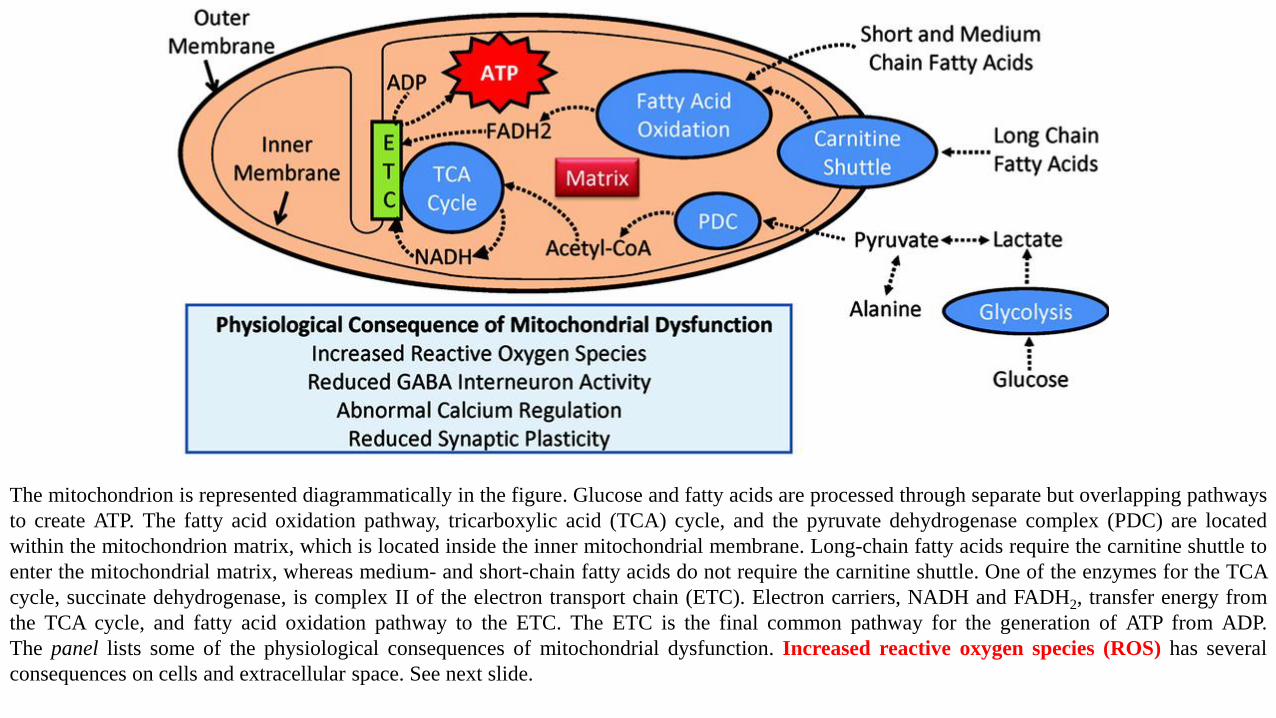
The mitochondrion is represented diagrammatically in the figure. Glucose and fatty acids are processed through separate but overlapping pathways
to create ATP. The fatty acid oxidation pathway, tricarboxylic acid (TCA) cycle, and the pyruvate dehydrogenase complex (PDC) are located
within the mitochondrion matrix, which is located inside the inner mitochondrial membrane. Long-chain fatty acids require the carnitine shuttle to
enter the mitochondrial matrix, whereas medium- and short-chain fatty acids do not require the carnitine shuttle. One of the enzymes for the TCA
cycle, succinate dehydrogenase, is complex II of the electron transport chain (ETC). Electron carriers, NADH and FADH2, transfer energy from
the TCA cycle, and fatty acid oxidation pathway to the ETC. The ETC is the final common pathway for the generation of ATP from ADP.
The panel lists some of the physiological consequences of mitochondrial dysfunction. Increased reactive oxygen species (ROS) has several
consequences on cells and extracellular space. See next slide.
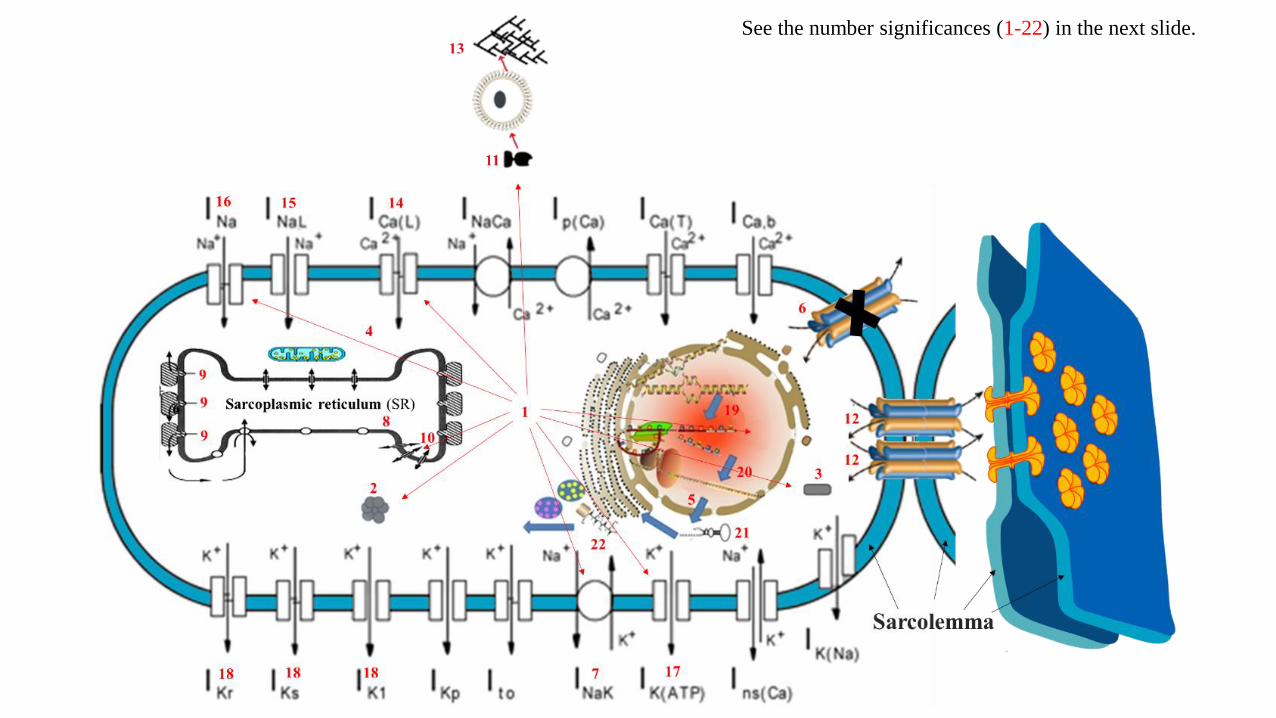
See the number significances (1-22) in the next slide.
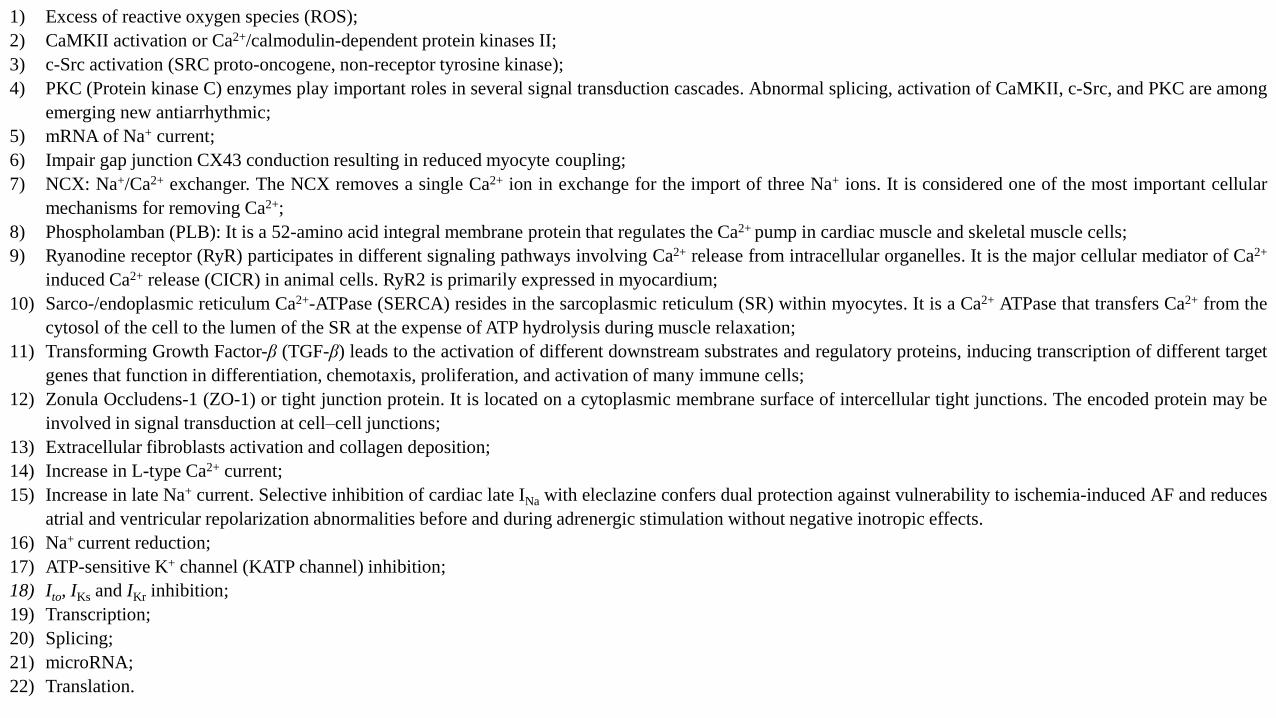
1) Excess of reactive oxygen species (ROS);
2) CaMKII activation or Ca2+/calmodulin-dependent protein kinases II;
3) c-Src activation (SRC proto-oncogene, non-receptor tyrosine kinase);
4) PKC (Protein kinase C) enzymes play important roles in several signal transduction cascades. Abnormal splicing, activation of CaMKII, c-Src, and PKC are among
emerging new antiarrhythmic;
5) mRNA of Na+ current;
6) Impair gap junction CX43 conduction resulting in reduced myocyte coupling;
7) NCX: Na+/Ca2+ exchanger. The NCX removes a single Ca2+ ion in exchange for the import of three Na+ ions. It is considered one of the most important cellular
mechanisms for removing Ca2+;
8) Phospholamban (PLB): It is a 52-amino acid integral membrane protein that regulates the Ca2+ pump in cardiac muscle and skeletal muscle cells;
9) Ryanodine receptor (RyR) participates in different signaling pathways involving Ca2+ release from intracellular organelles. It is the major cellular mediator of Ca2+
induced Ca2+ release (CICR) in animal cells. RyR2 is primarily expressed in myocardium;
10) Sarco-/endoplasmic reticulum Ca2+-ATPase (SERCA) resides in the sarcoplasmic reticulum (SR) within myocytes. It is a Ca2+ ATPase that transfers Ca2+ from the
cytosol of the cell to the lumen of the SR at the expense of ATP hydrolysis during muscle relaxation;
11) Transforming Growth Factor-β (TGF-β) leads to the activation of different downstream substrates and regulatory proteins, inducing transcription of different target
genes that function in differentiation, chemotaxis, proliferation, and activation of many immune cells;
12) Zonula Occludens-1 (ZO-1) or tight junction protein. It is located on a cytoplasmic membrane surface of intercellular tight junctions. The encoded protein may be
involved in signal transduction at cell–cell junctions;
13) Extracellular fibroblasts activation and collagen deposition;
14) Increase in L-type Ca2+ current;
15) Increase in late Na+ current. Selective inhibition of cardiac late INa with eleclazine confers dual protection against vulnerability to ischemia-induced AF and reduces
atrial and ventricular repolarization abnormalities before and during adrenergic stimulation without negative inotropic effects.
16) Na+ current reduction;
17) ATP-sensitive K+ channel (KATP channel) inhibition;
18) Ito, IKs and IKr inhibition;
19) Transcription;
20) Splicing;
21) microRNA;
22) Translation.
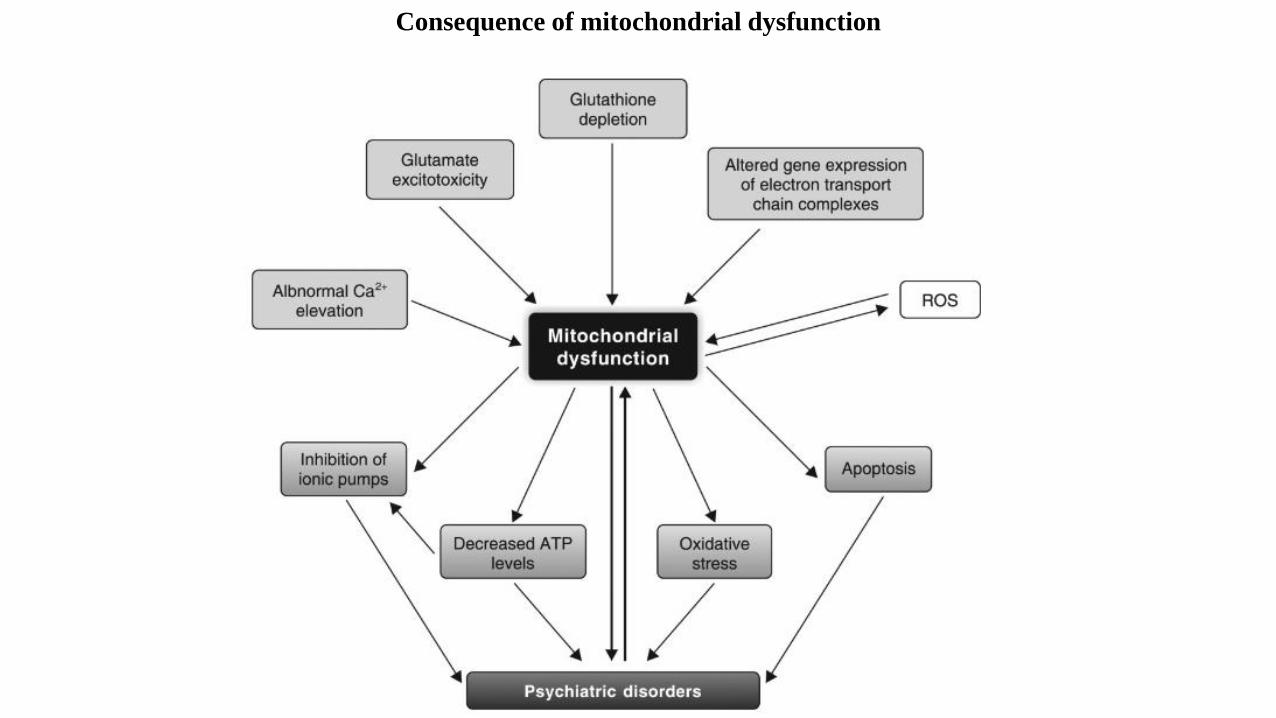
Consequence of mitochondrial dysfunction
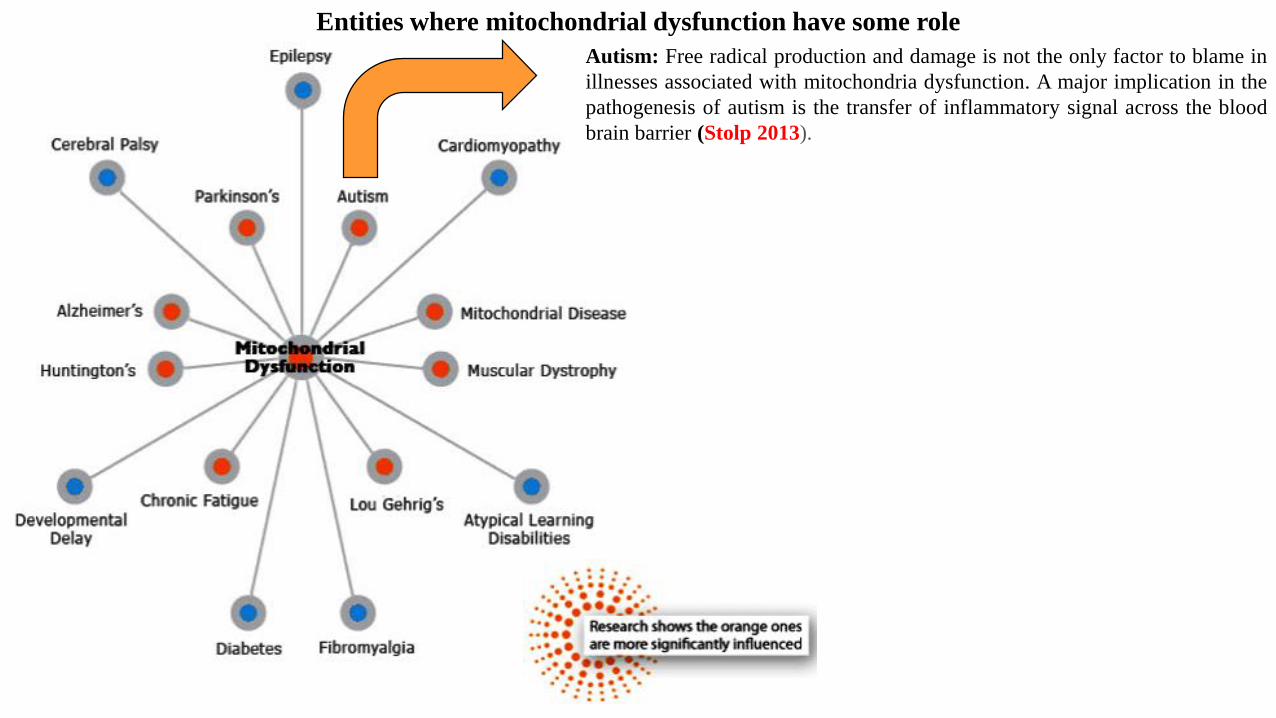
Autism: Free radical production and damage is not the only factor to blame in
illnesses associated with mitochondria dysfunction. A major implication in the
pathogenesis of autism is the transfer of inflammatory signal across the blood
brain barrier (Stolp 2013).
Entities where mitochondrial dysfunction have some role
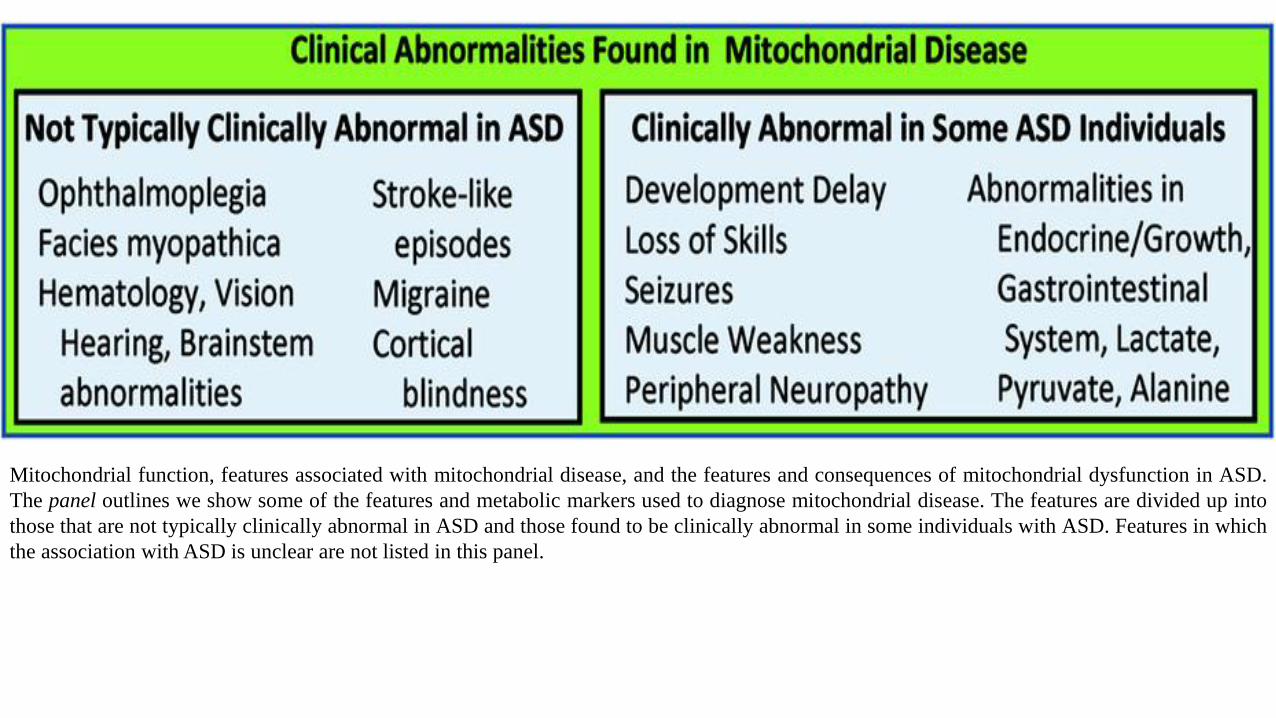
Mitochondrial function, features associated with mitochondrial disease, and the features and consequences of mitochondrial dysfunction in ASD.
The panel outlines we show some of the features and metabolic markers used to diagnose mitochondrial disease. The features are divided up into
those that are not typically clinically abnormal in ASD and those found to be clinically abnormal in some individuals with ASD. Features in which
the association with ASD is unclear are not listed in this panel.
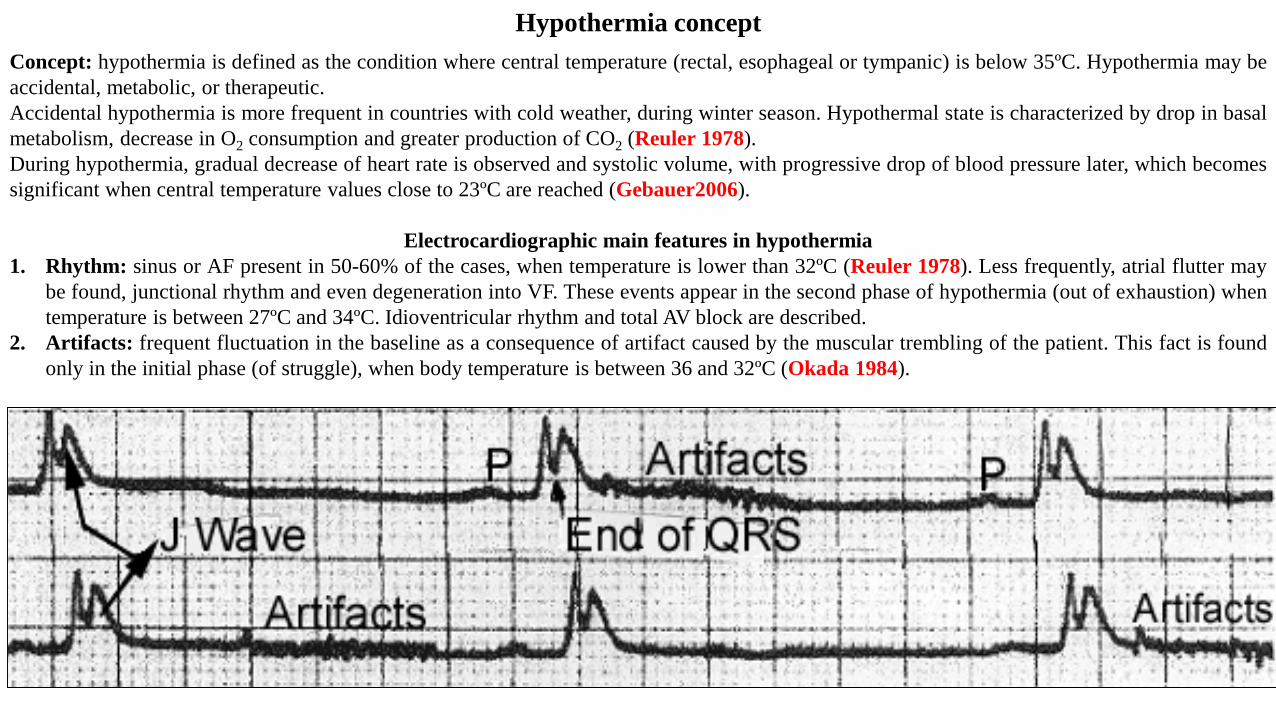
Hypothermia concept
Concept: hypothermia is defined as the condition where central temperature (rectal, esophageal or tympanic) is below 35ºC. Hypothermia may be
accidental, metabolic, or therapeutic.
Accidental hypothermia is more frequent in countries with cold weather, during winter season. Hypothermal state is characterized by drop in basal
metabolism, decrease in O2 consumption and greater production of CO2 (Reuler 1978).
During hypothermia, gradual decrease of heart rate is observed and systolic volume, with progressive drop of blood pressure later, which becomes
significant when central temperature values close to 23ºC are reached (Gebauer2006).
Electrocardiographic main features in hypothermia
1. Rhythm: sinus or AF present in 50-60% of the cases, when temperature is lower than 32ºC (Reuler 1978). Less frequently, atrial flutter may
be found, junctional rhythm and even degeneration into VF. These events appear in the second phase of hypothermia (out of exhaustion) when
temperature is between 27ºC and 34ºC. Idioventricular rhythm and total AV block are described.
2. Artifacts: frequent fluctuation in the baseline as a consequence of artifact caused by the muscular trembling of the patient. This fact is found
only in the initial phase (of struggle), when body temperature is between 36 and 32ºC (Okada 1984).
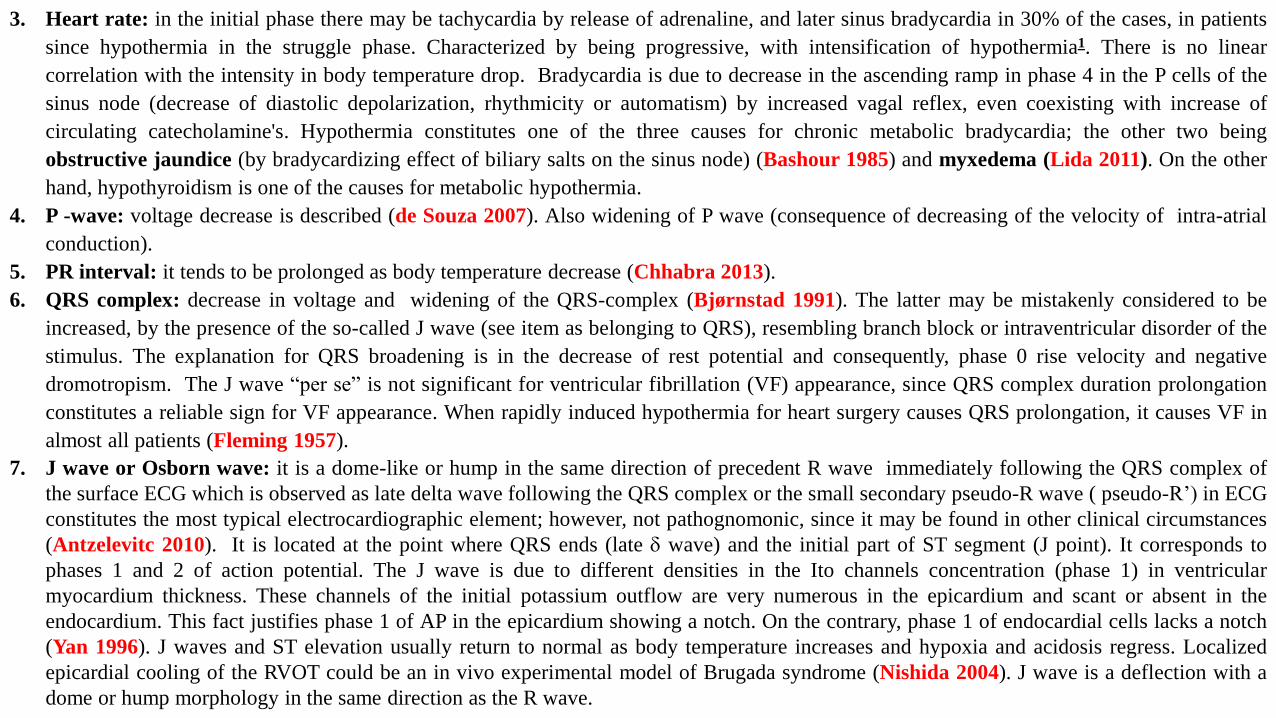
3. Heart rate: in the initial phase there may be tachycardia by release of adrenaline, and later sinus bradycardia in 30% of the cases, in patients
since hypothermia in the struggle phase. Characterized by being progressive, with intensification of hypothermia1. There is no linear
correlation with the intensity in body temperature drop. Bradycardia is due to decrease in the ascending ramp in phase 4 in the P cells of the
sinus node (decrease of diastolic depolarization, rhythmicity or automatism) by increased vagal reflex, even coexisting with increase of
circulating catecholamine's. Hypothermia constitutes one of the three causes for chronic metabolic bradycardia; the other two being
obstructive jaundice (by bradycardizing effect of biliary salts on the sinus node) (Bashour 1985) and myxedema (Lida 2011). On the other
hand, hypothyroidism is one of the causes for metabolic hypothermia.
4. P -wave: voltage decrease is described (de Souza 2007). Also widening of P wave (consequence of decreasing of the velocity of intra-atrial
conduction).
5. PR interval: it tends to be prolonged as body temperature decrease (Chhabra 2013).
6. QRS complex: decrease in voltage and widening of the QRS-complex (Bjørnstad 1991). The latter may be mistakenly considered to be
increased, by the presence of the so-called J wave (see item as belonging to QRS), resembling branch block or intraventricular disorder of the
stimulus. The explanation for QRS broadening is in the decrease of rest potential and consequently, phase 0 rise velocity and negative
dromotropism. The J wave “per se” is not significant for ventricular fibrillation (VF) appearance, since QRS complex duration prolongation
constitutes a reliable sign for VF appearance. When rapidly induced hypothermia for heart surgery causes QRS prolongation, it causes VF in
almost all patients (Fleming 1957).
7. J wave or Osborn wave: it is a dome-like or hump in the same direction of precedent R wave immediately following the QRS complex of
the surface ECG which is observed as late delta wave following the QRS complex or the small secondary pseudo-R wave ( pseudo-R’) in ECG
constitutes the most typical electrocardiographic element; however, not pathognomonic, since it may be found in other clinical circumstances
(Antzelevitc 2010). It is located at the point where QRS ends (late wave) and the initial part of ST segment (J point). It corresponds to
phases 1 and 2 of action potential. The J wave is due to different densities in the Ito channels concentration (phase 1) in ventricular
myocardium thickness. These channels of the initial potassium outflow are very numerous in the epicardium and scant or absent in the
endocardium. This fact justifies phase 1 of AP in the epicardium showing a notch. On the contrary, phase 1 of endocardial cells lacks a notch
(Yan 1996). J waves and ST elevation usually return to normal as body temperature increases and hypoxia and acidosis regress. Localized
epicardial cooling of the RVOT could be an in vivo experimental model of Brugada syndrome (Nishida 2004). J wave is a deflection with a
dome or hump morphology in the same direction as the R wave.
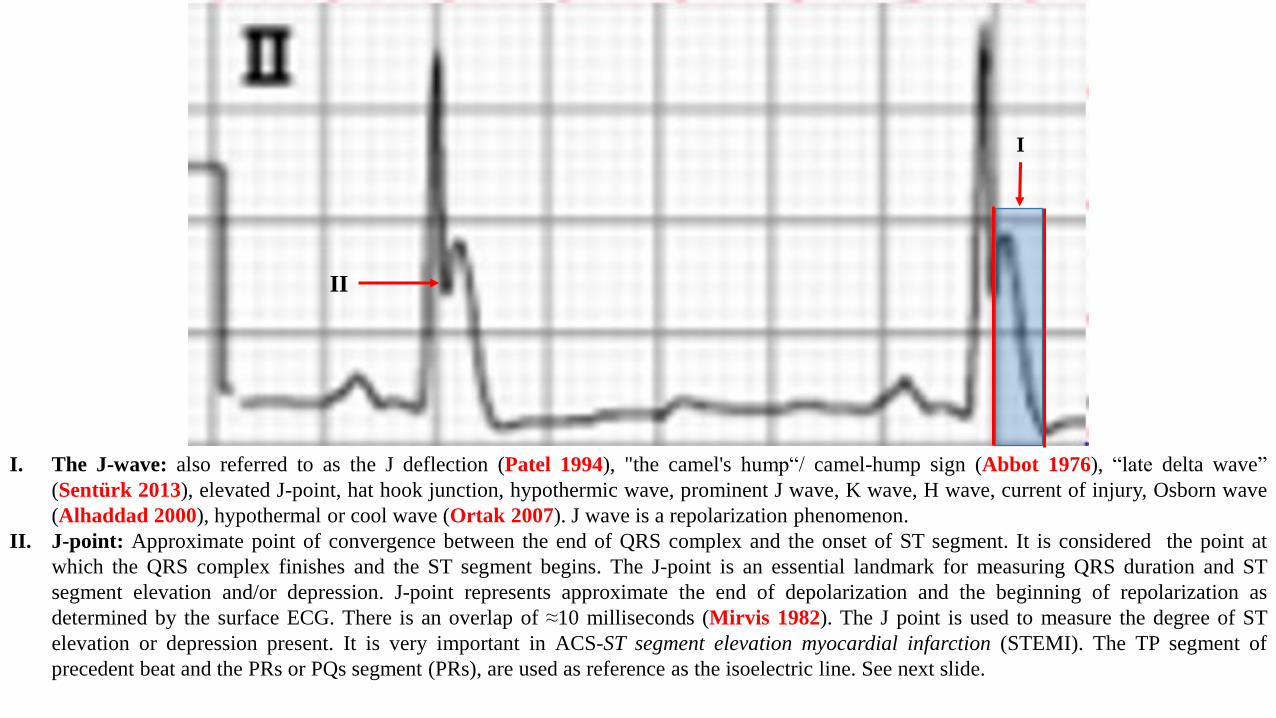
I. The J-wave: also referred to as the J deflection (Patel 1994), "the camel's hump“/ camel-hump sign (Abbot 1976), “late delta wave”
(Sentürk 2013), elevated J-point, hat hook junction, hypothermic wave, prominent J wave, K wave, H wave, current of injury, Osborn wave
(Alhaddad 2000), hypothermal or cool wave (Ortak 2007). J wave is a repolarization phenomenon.
II. J-point: Approximate point of convergence between the end of QRS complex and the onset of ST segment. It is considered the point at
which the QRS complex finishes and the ST segment begins. The J-point is an essential landmark for measuring QRS duration and ST
segment elevation and/or depression. J-point represents approximate the end of depolarization and the beginning of repolarization as
determined by the surface ECG. There is an overlap of ≈10 milliseconds (Mirvis 1982). The J point is used to measure the degree of ST
elevation or depression present. It is very important in ACS-ST segment elevation myocardial infarction (STEMI). The TP segment of
precedent beat and the PRs or PQs segment (PRs), are used as reference as the isoelectric line. See next slide.
II
I
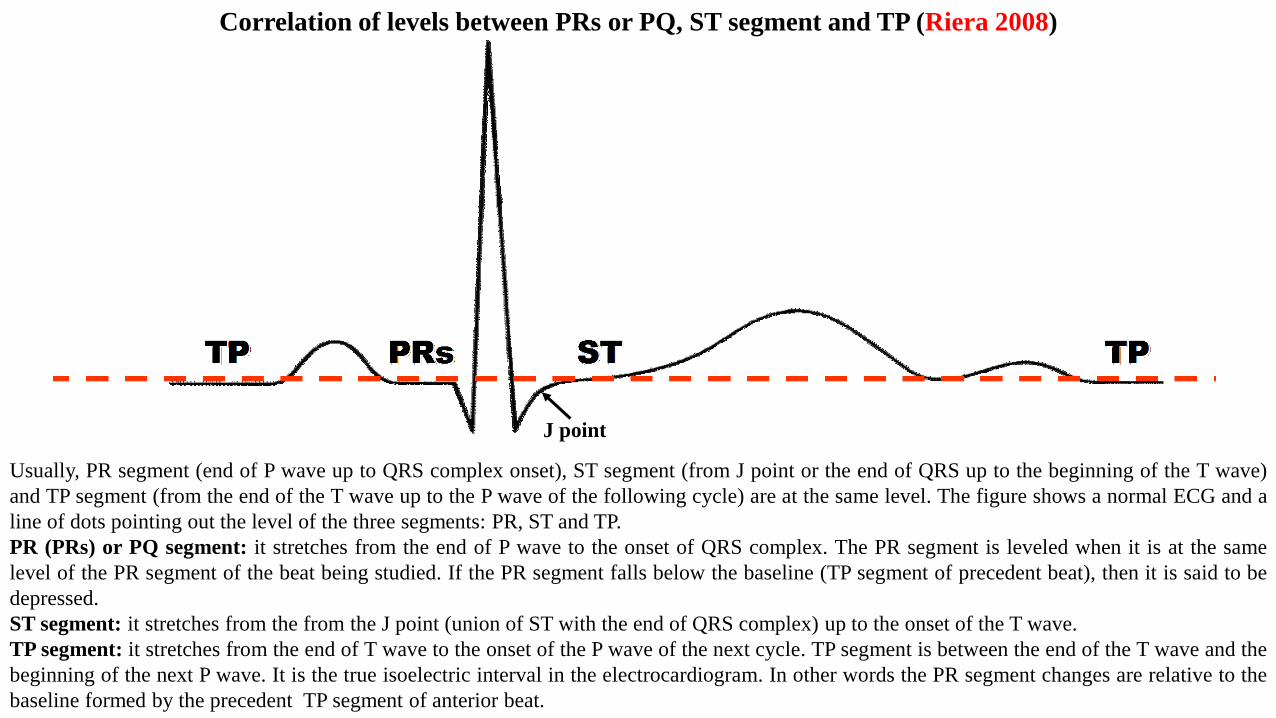
Usually, PR segment (end of P wave up to QRS complex onset), ST segment (from J point or the end of QRS up to the beginning of the T wave)
and TP segment (from the end of the T wave up to the P wave of the following cycle) are at the same level. The figure shows a normal ECG and a
line of dots pointing out the level of the three segments: PR, ST and TP.
PR (PRs) or PQ segment: it stretches from the end of P wave to the onset of QRS complex. The PR segment is leveled when it is at the same
level of the PR segment of the beat being studied. If the PR segment falls below the baseline (TP segment of precedent beat), then it is said to be
depressed.
ST segment: it stretches from the from the J point (union of ST with the end of QRS complex) up to the onset of the T wave.
TP segment: it stretches from the end of T wave to the onset of the P wave of the next cycle. TP segment is between the end of the T wave and the
beginning of the next P wave. It is the true isoelectric interval in the electrocardiogram. In other words the PR segment changes are relative to the
baseline formed by the precedent TP segment of anterior beat.
J point
Correlation of levels between PRs or PQ, ST segment and TP (Riera 2008)
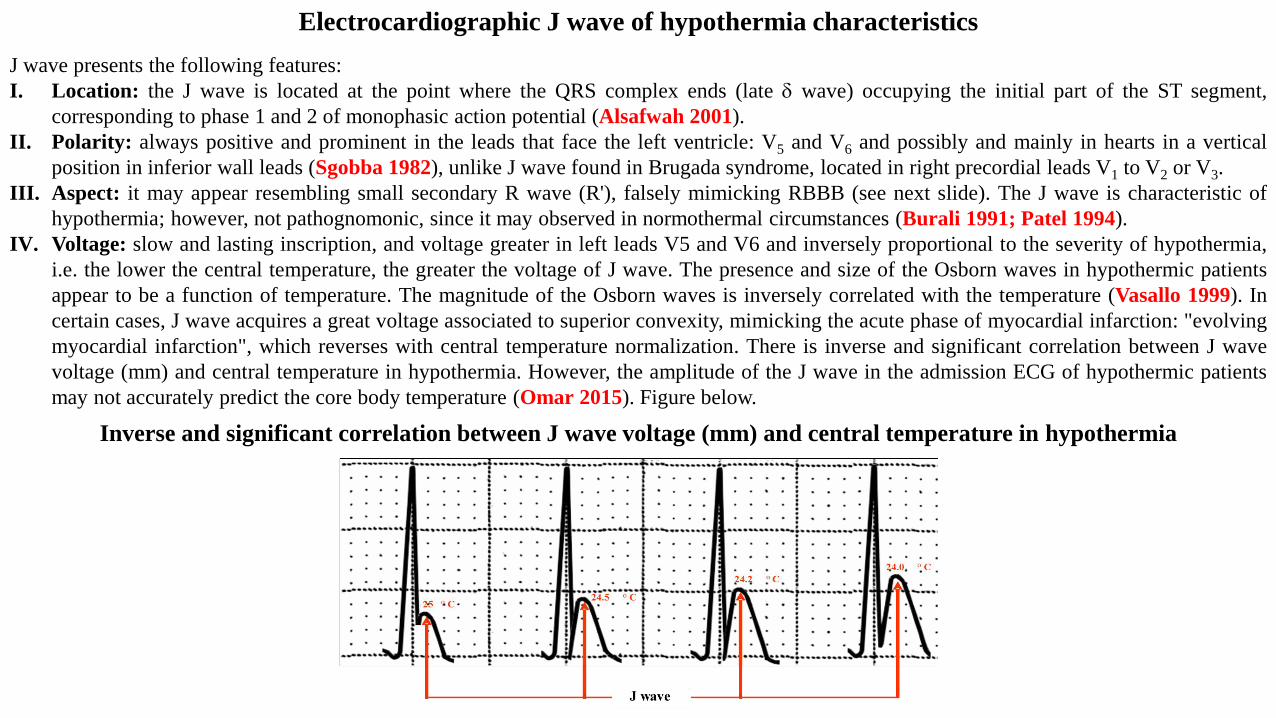
J wave presents the following features:
I. Location: the J wave is located at the point where the QRS complex ends (late wave) occupying the initial part of the ST segment,
corresponding to phase 1 and 2 of monophasic action potential (Alsafwah 2001).
II. Polarity: always positive and prominent in the leads that face the left ventricle: V5 and V6 and possibly and mainly in hearts in a vertical
position in inferior wall leads (Sgobba 1982), unlike J wave found in Brugada syndrome, located in right precordial leads V1 to V2 or V3.
III. Aspect: it may appear resembling small secondary R wave (R'), falsely mimicking RBBB (see next slide). The J wave is characteristic of
hypothermia; however, not pathognomonic, since it may observed in normothermal circumstances (Burali 1991; Patel 1994).
IV. Voltage: slow and lasting inscription, and voltage greater in left leads V5 and V6 and inversely proportional to the severity of hypothermia,
i.e. the lower the central temperature, the greater the voltage of J wave. The presence and size of the Osborn waves in hypothermic patients
appear to be a function of temperature. The magnitude of the Osborn waves is inversely correlated with the temperature (Vasallo 1999). In
certain cases, J wave acquires a great voltage associated to superior convexity, mimicking the acute phase of myocardial infarction: "evolving
myocardial infarction", which reverses with central temperature normalization. There is inverse and significant correlation between J wave
voltage (mm) and central temperature in hypothermia. However, the amplitude of the J wave in the admission ECG of hypothermic patients
may not accurately predict the core body temperature (Omar 2015). Figure below.
Electrocardiographic J wave of hypothermia characteristics
Inverse and significant correlation between J wave voltage (mm) and central temperature in hypothermia
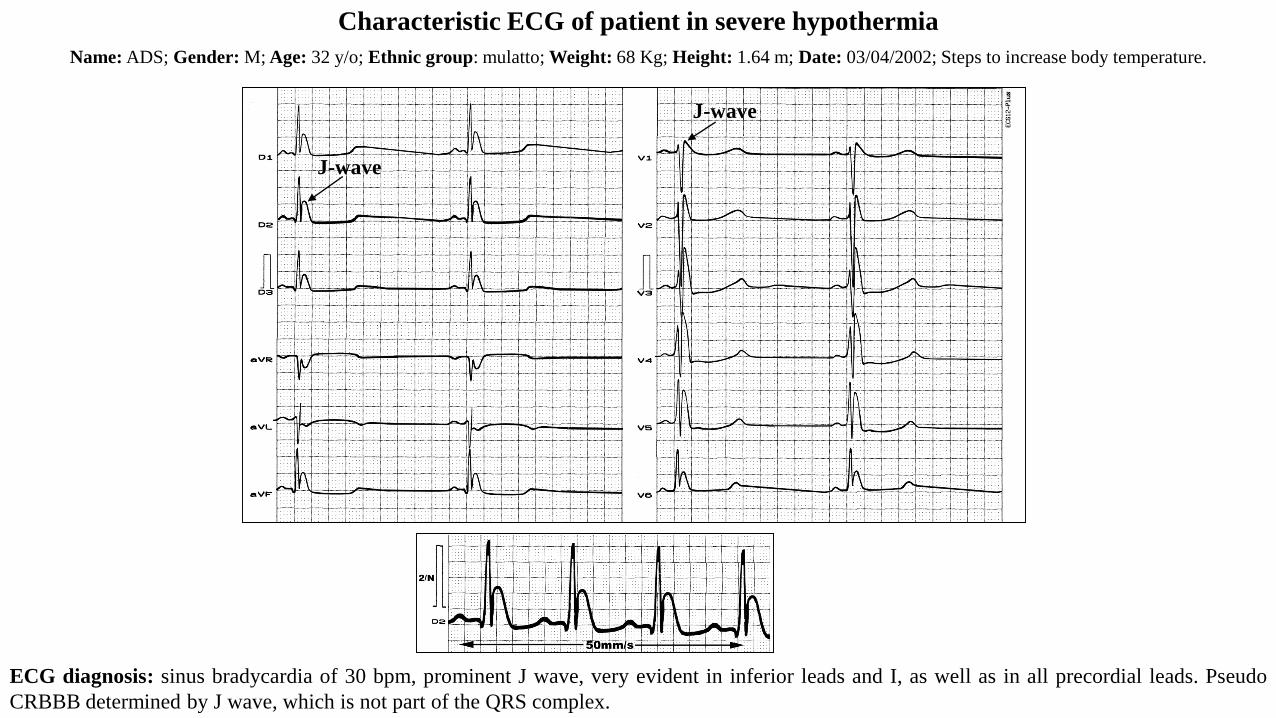
Name: ADS; Gender: M; Age: 32 y/o; Ethnic group: mulatto; Weight: 68 Kg; Height: 1.64 m; Date: 03/04/2002; Steps to increase body temperature.
ECG diagnosis: sinus bradycardia of 30 bpm, prominent J wave, very evident in inferior leads and I, as well as in all precordial leads. Pseudo
CRBBB determined by J wave, which is not part of the QRS complex.
Characteristic ECG of patient in severe hypothermia
J-wave
J-wave
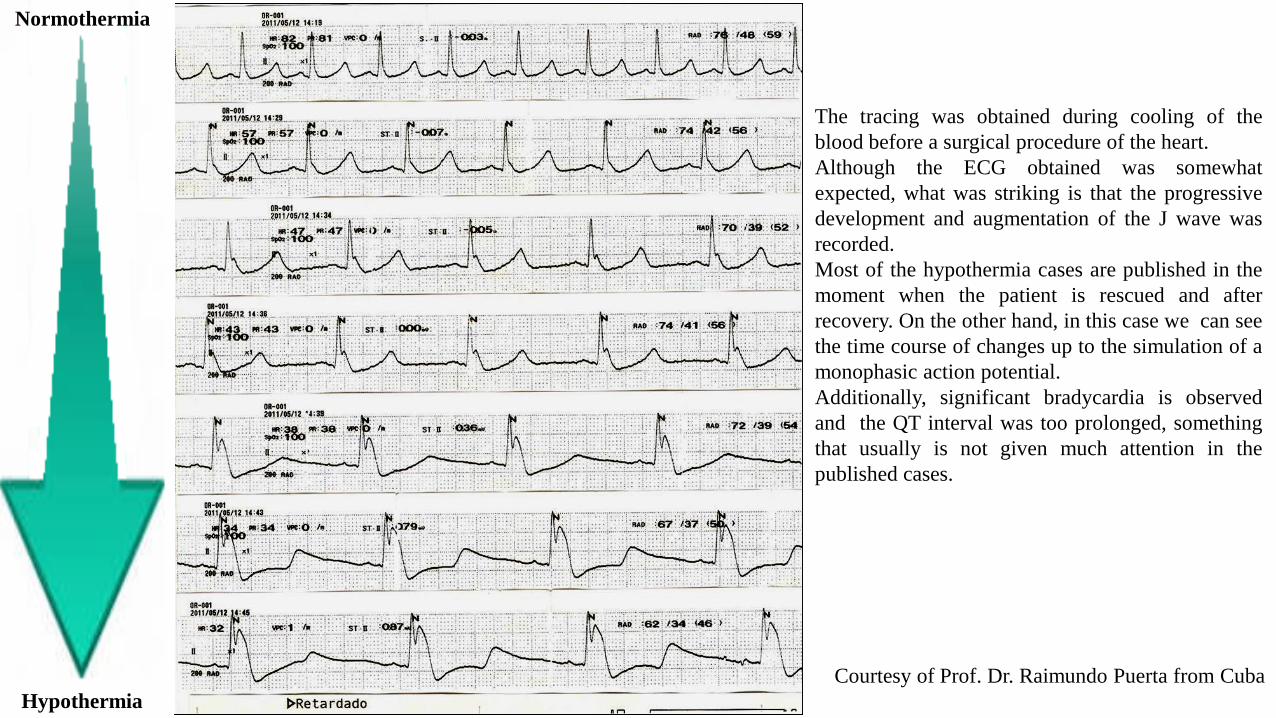
The tracing was obtained during cooling of the
blood before a surgical procedure of the heart.
Although the ECG obtained was somewhat
expected, what was striking is that the progressive
development and augmentation of the J wave was
recorded.
Most of the hypothermia cases are published in the
moment when the patient is rescued and after
recovery. On the other hand, in this case we can see
the time course of changes up to the simulation of a
monophasic action potential.
Additionally, significant bradycardia is observed
and the QT interval was too prolonged, something
that usually is not given much attention in the
published cases.
Courtesy of Prof. Dr. Raimundo Puerta from Cuba
Normothermia
Hypothermia
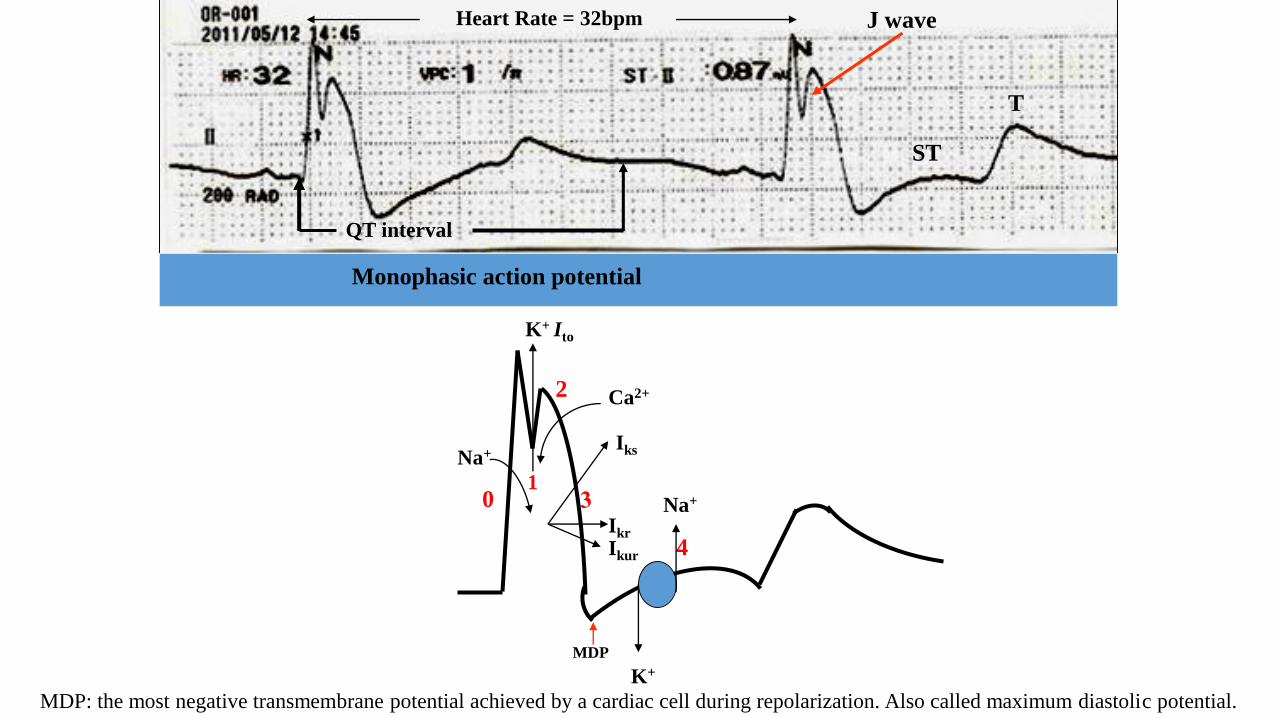
Monophasic action potential
Heart Rate = 32bpm
0
QT interval
4
Na+
Na+
K+
2 Ca2+
K+ Ito
ST
T
Iks
Ikr
Ikur
MDP: the most negative transmembrane potential achieved by a cardiac cell during repolarization. Also called maximum diastolic potential.
MDP
1
J wave
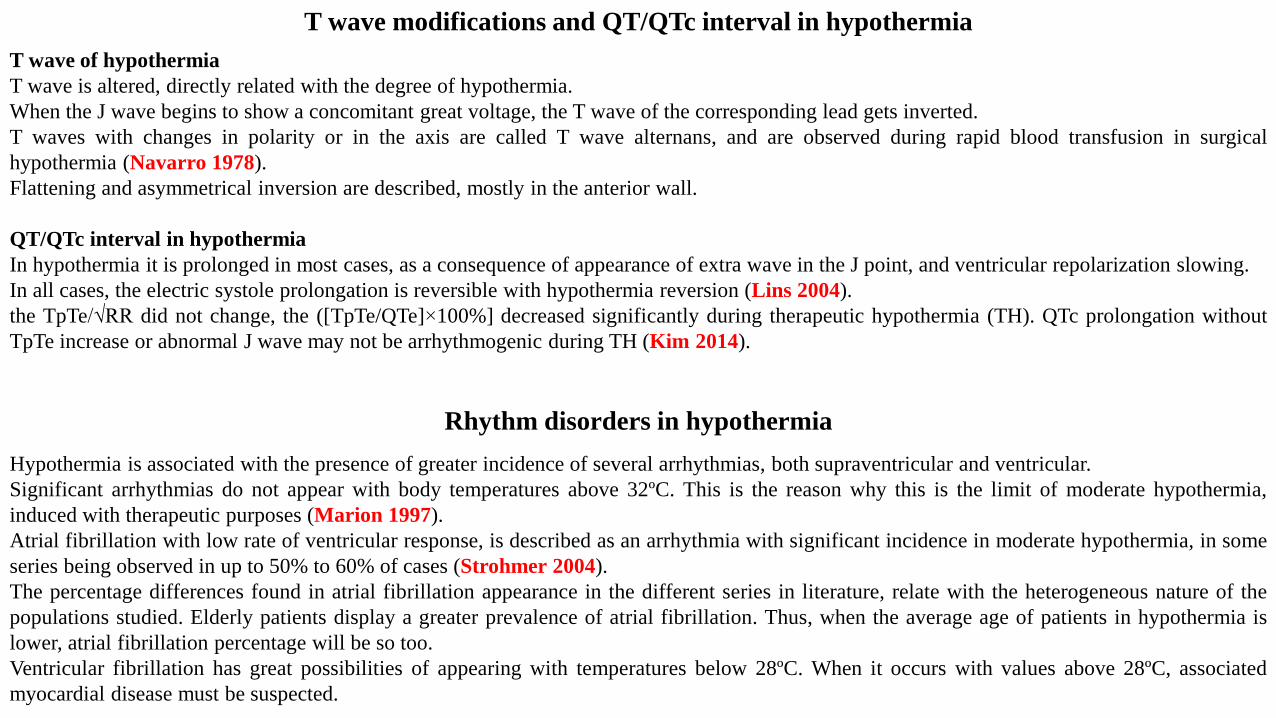
T wave modifications and QT/QTc interval in hypothermia
T wave of hypothermia
T wave is altered, directly related with the degree of hypothermia.
When the J wave begins to show a concomitant great voltage, the T wave of the corresponding lead gets inverted.
T waves with changes in polarity or in the axis are called T wave alternans, and are observed during rapid blood transfusion in surgical
hypothermia (Navarro 1978).
Flattening and asymmetrical inversion are described, mostly in the anterior wall.
QT/QTc interval in hypothermia
In hypothermia it is prolonged in most cases, as a consequence of appearance of extra wave in the J point, and ventricular repolarization slowing.
In all cases, the electric systole prolongation is reversible with hypothermia reversion (Lins 2004).
the TpTe/√RR did not change, the ([TpTe/QTe]×100%] decreased significantly during therapeutic hypothermia (TH). QTc prolongation without
TpTe increase or abnormal J wave may not be arrhythmogenic during TH (Kim 2014).
Rhythm disorders in hypothermia
Hypothermia is associated with the presence of greater incidence of several arrhythmias, both supraventricular and ventricular.
Significant arrhythmias do not appear with body temperatures above 32ºC. This is the reason why this is the limit of moderate hypothermia,
induced with therapeutic purposes (Marion 1997).
Atrial fibrillation with low rate of ventricular response, is described as an arrhythmia with significant incidence in moderate hypothermia, in some
series being observed in up to 50% to 60% of cases (Strohmer 2004).
The percentage differences found in atrial fibrillation appearance in the different series in literature, relate with the heterogeneous nature of the
populations studied. Elderly patients display a greater prevalence of atrial fibrillation. Thus, when the average age of patients in hypothermia is
lower, atrial fibrillation percentage will be so too.
Ventricular fibrillation has great possibilities of appearing with temperatures below 28ºC. When it occurs with values above 28ºC, associated
myocardial disease must be suspected.
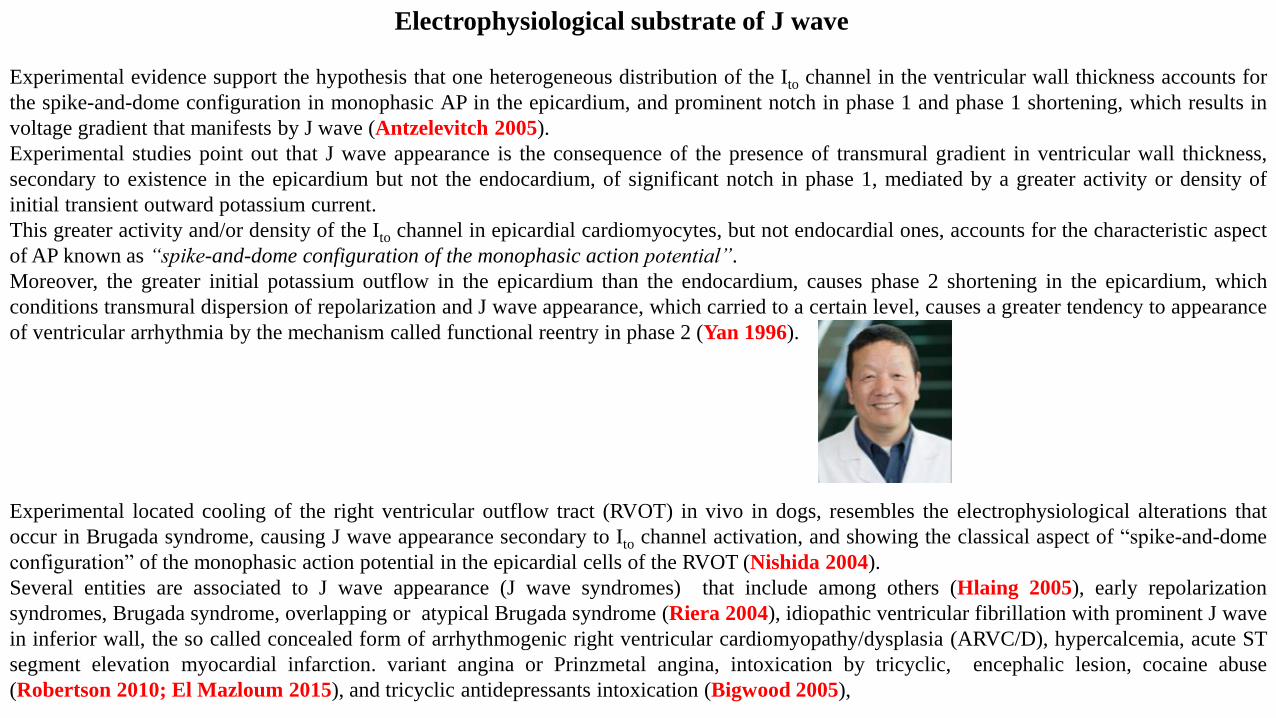
Experimental evidence support the hypothesis that one heterogeneous distribution of the Ito channel in the ventricular wall thickness accounts for
the spike-and-dome configuration in monophasic AP in the epicardium, and prominent notch in phase 1 and phase 1 shortening, which results in
voltage gradient that manifests by J wave (Antzelevitch 2005).
Experimental studies point out that J wave appearance is the consequence of the presence of transmural gradient in ventricular wall thickness,
secondary to existence in the epicardium but not the endocardium, of significant notch in phase 1, mediated by a greater activity or density of
initial transient outward potassium current.
This greater activity and/or density of the Ito channel in epicardial cardiomyocytes, but not endocardial ones, accounts for the characteristic aspect
of AP known as “spike-and-dome configuration of the monophasic action potential”.
Moreover, the greater initial potassium outflow in the epicardium than the endocardium, causes phase 2 shortening in the epicardium, which
conditions transmural dispersion of repolarization and J wave appearance, which carried to a certain level, causes a greater tendency to appearance
of ventricular arrhythmia by the mechanism called functional reentry in phase 2 (Yan 1996).
Experimental located cooling of the right ventricular outflow tract (RVOT) in vivo in dogs, resembles the electrophysiological alterations that
occur in Brugada syndrome, causing J wave appearance secondary to Ito channel activation, and showing the classical aspect of “spike-and-dome
configuration” of the monophasic action potential in the epicardial cells of the RVOT (Nishida 2004).
Several entities are associated to J wave appearance (J wave syndromes) that include among others (Hlaing 2005), early repolarization
syndromes, Brugada syndrome, overlapping or atypical Brugada syndrome (Riera 2004), idiopathic ventricular fibrillation with prominent J wave
in inferior wall, the so called concealed form of arrhythmogenic right ventricular cardiomyopathy/dysplasia (ARVC/D), hypercalcemia, acute ST
segment elevation myocardial infarction. variant angina or Prinzmetal angina, intoxication by tricyclic, encephalic lesion, cocaine abuse
(Robertson 2010; El Mazloum 2015), and tricyclic antidepressants intoxication (Bigwood 2005),
Electrophysiological substrate of J wave
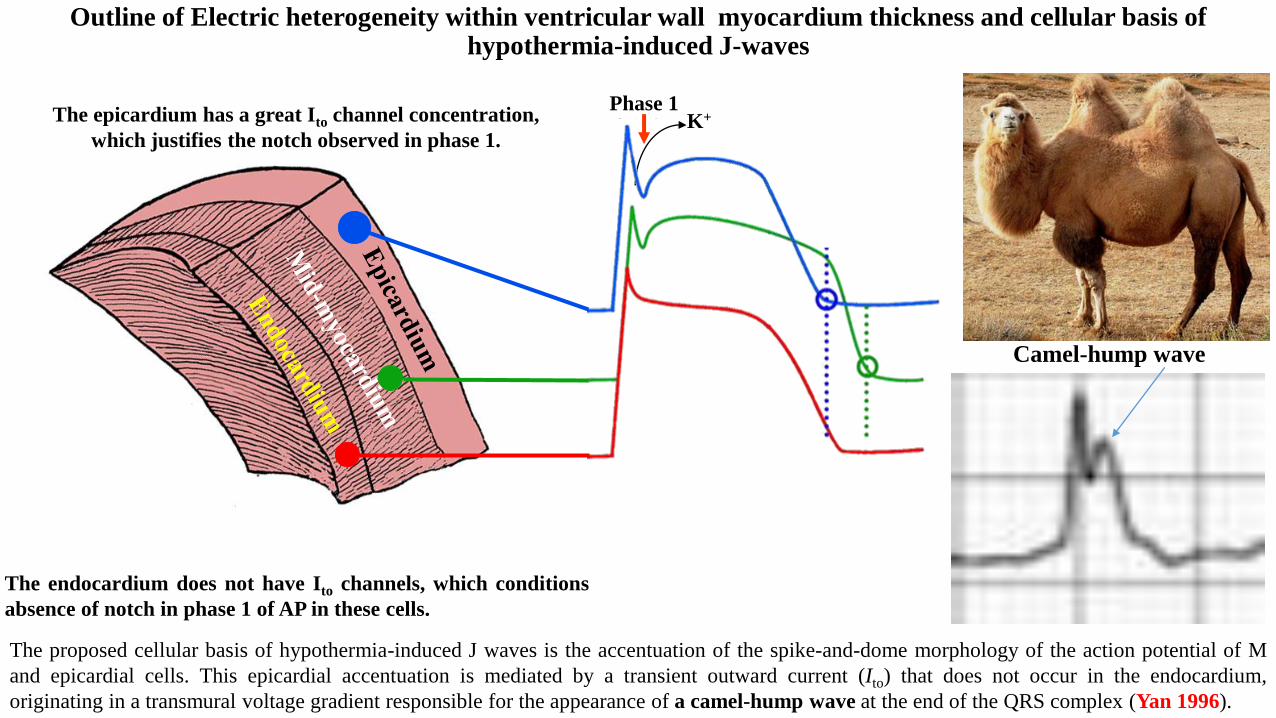
Outline of Electric heterogeneity within ventricular wall myocardium thickness and cellular basis of hypothermia-induced J-waves
The epicardium has a great Ito channel concentration,
which justifies the notch observed in phase 1.
Phase 1K+
The endocardium does not have Ito channels, which conditions
absence of notch in phase 1 of AP in these cells.
The proposed cellular basis of hypothermia-induced J waves is the accentuation of the spike-and-dome morphology of the action potential of M
and epicardial cells. This epicardial accentuation is mediated by a transient outward current (Ito) that does not occur in the endocardium,
originating in a transmural voltage gradient responsible for the appearance of a camel-hump wave at the end of the QRS complex (Yan 1996).
Camel-hump wave
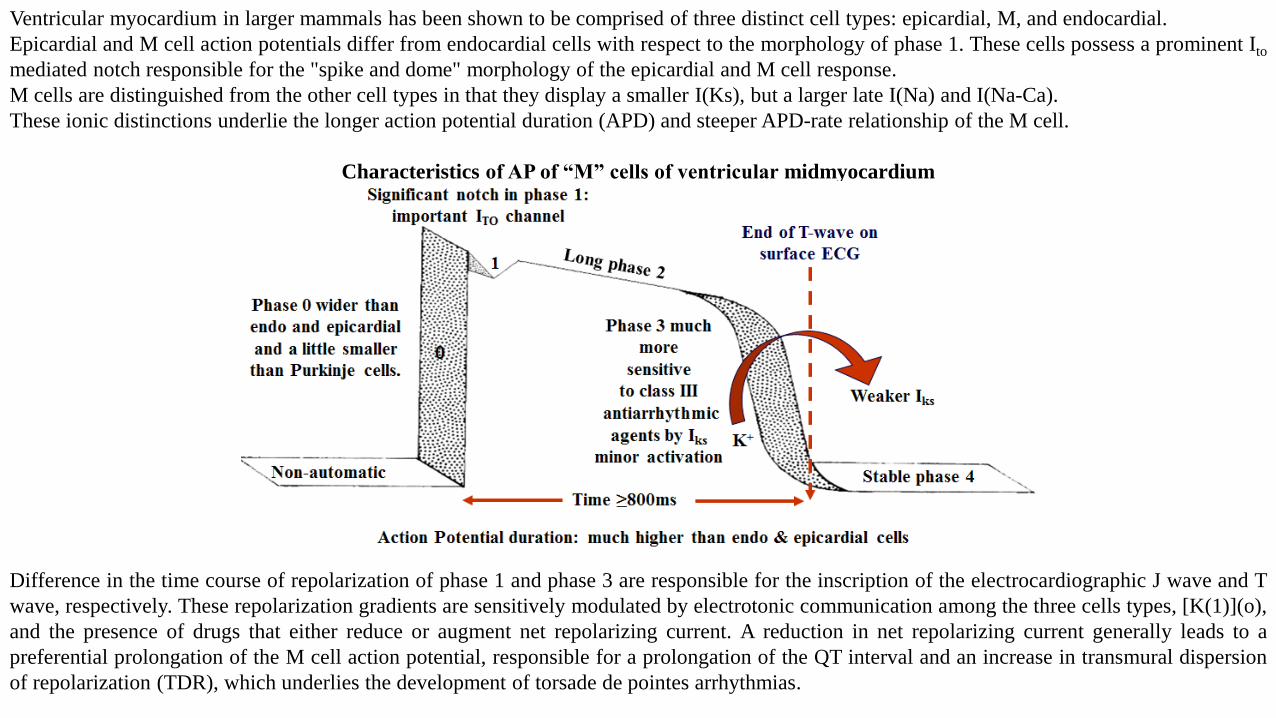
Ventricular myocardium in larger mammals has been shown to be comprised of three distinct cell types: epicardial, M, and endocardial.
Epicardial and M cell action potentials differ from endocardial cells with respect to the morphology of phase 1. These cells possess a prominent Ito
mediated notch responsible for the "spike and dome" morphology of the epicardial and M cell response.
M cells are distinguished from the other cell types in that they display a smaller I(Ks), but a larger late I(Na) and I(Na-Ca).
These ionic distinctions underlie the longer action potential duration (APD) and steeper APD-rate relationship of the M cell.
Characteristics of AP of “M” cells of ventricular midmyocardium
Difference in the time course of repolarization of phase 1 and phase 3 are responsible for the inscription of the electrocardiographic J wave and T
wave, respectively. These repolarization gradients are sensitively modulated by electrotonic communication among the three cells types, [K(1)](o),
and the presence of drugs that either reduce or augment net repolarizing current. A reduction in net repolarizing current generally leads to a
preferential prolongation of the M cell action potential, responsible for a prolongation of the QT interval and an increase in transmural dispersion
of repolarization (TDR), which underlies the development of torsade de pointes arrhythmias.
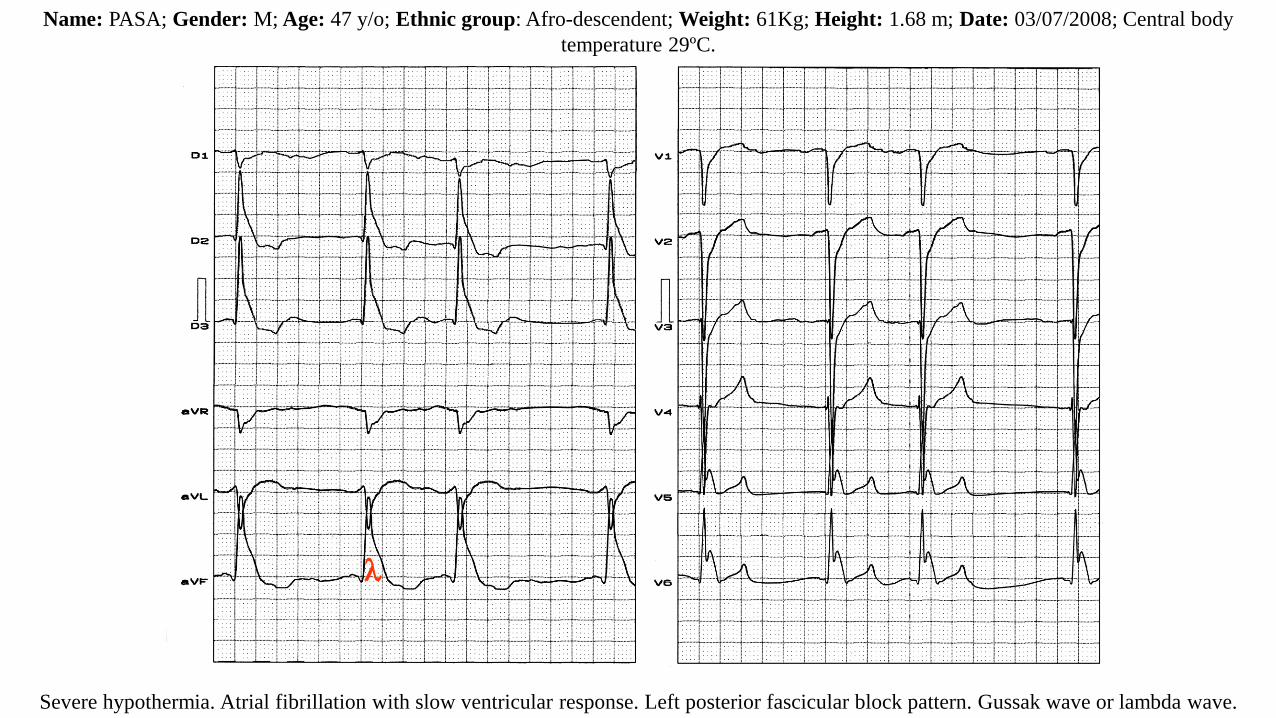
Name: PASA; Gender: M; Age: 47 y/o; Ethnic group: Afro-descendent; Weight: 61Kg; Height: 1.68 m; Date: 03/07/2008; Central body
temperature 29ºC.
Severe hypothermia. Atrial fibrillation with slow ventricular response. Left posterior fascicular block pattern. Gussak wave or lambda wave.
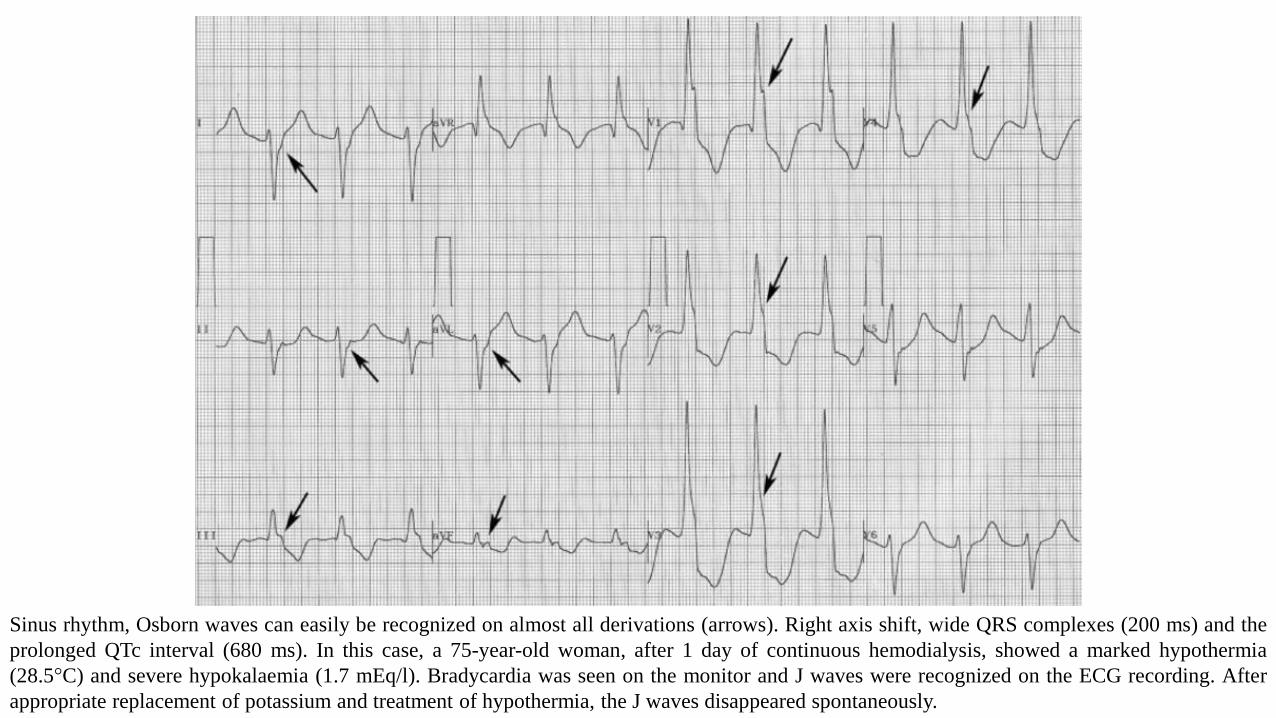
Sinus rhythm, Osborn waves can easily be recognized on almost all derivations (arrows). Right axis shift, wide QRS complexes (200 ms) and the
prolonged QTc interval (680 ms). In this case, a 75-year-old woman, after 1 day of continuous hemodialysis, showed a marked hypothermia
(28.5°C) and severe hypokalaemia (1.7 mEq/l). Bradycardia was seen on the monitor and J waves were recognized on the ECG recording. After
appropriate replacement of potassium and treatment of hypothermia, the J waves disappeared spontaneously.
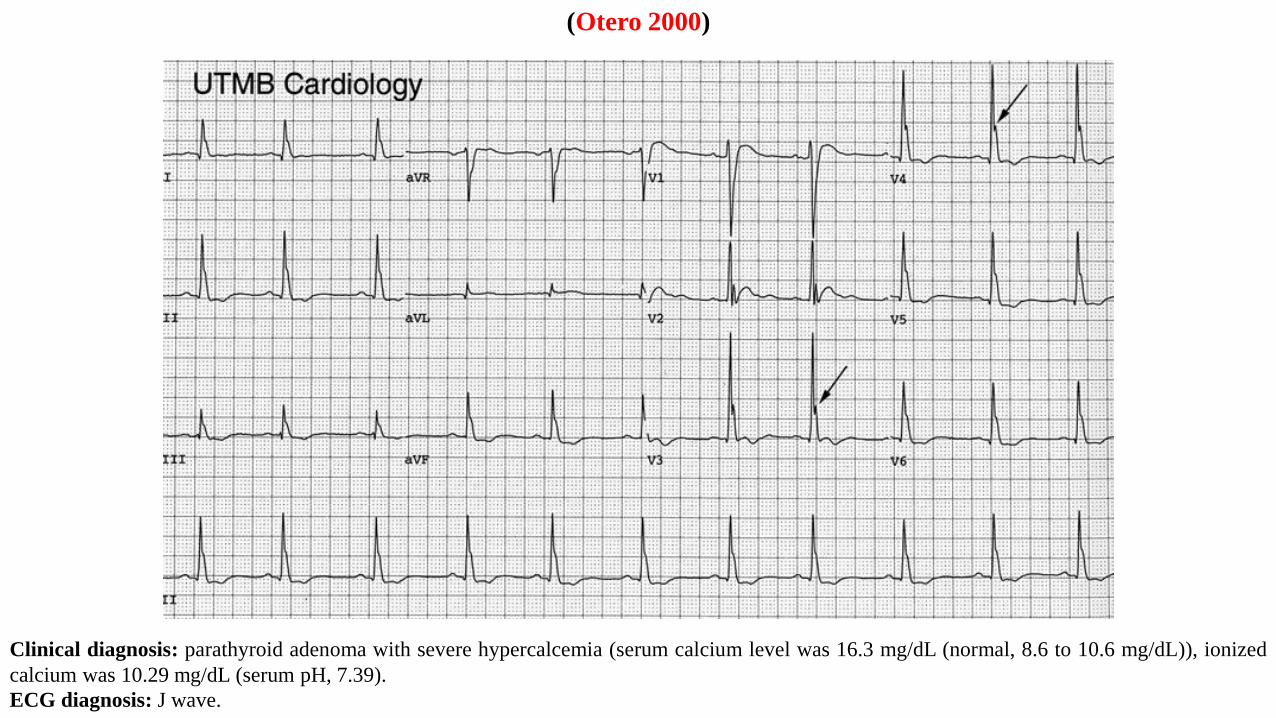
Clinical diagnosis: parathyroid adenoma with severe hypercalcemia (serum calcium level was 16.3 mg/dL (normal, 8.6 to 10.6 mg/dL)), ionized
calcium was 10.29 mg/dL (serum pH, 7.39).
ECG diagnosis: J wave.
(Otero 2000)
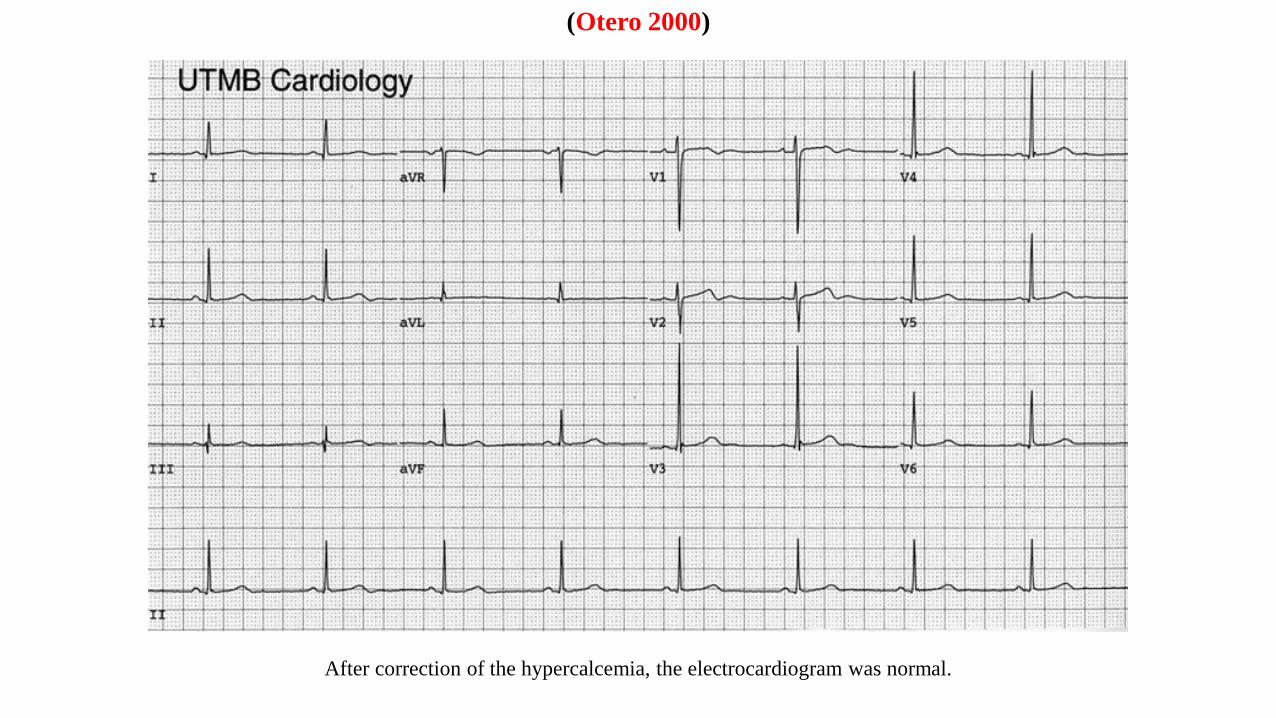
After correction of the hypercalcemia, the electrocardiogram was normal.
(Otero 2000)
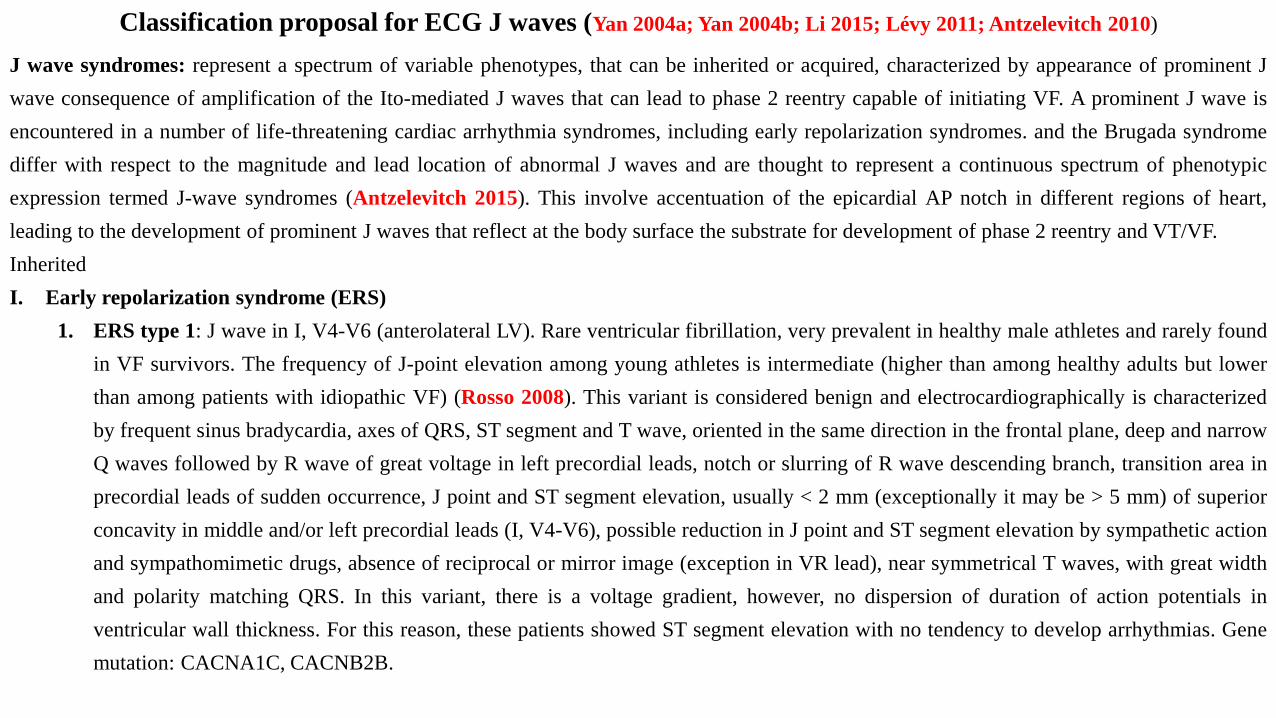
Classification proposal for ECG J waves (Yan 2004a; Yan 2004b; Li 2015; Lévy 2011; Antzelevitch 2010)
J wave syndromes: represent a spectrum of variable phenotypes, that can be inherited or acquired, characterized by appearance of prominent J
wave consequence of amplification of the Ito-mediated J waves that can lead to phase 2 reentry capable of initiating VF. A prominent J wave is
encountered in a number of life-threatening cardiac arrhythmia syndromes, including early repolarization syndromes. and the Brugada syndrome
differ with respect to the magnitude and lead location of abnormal J waves and are thought to represent a continuous spectrum of phenotypic
expression termed J-wave syndromes (Antzelevitch 2015). This involve accentuation of the epicardial AP notch in different regions of heart,
leading to the development of prominent J waves that reflect at the body surface the substrate for development of phase 2 reentry and VT/VF.
Inherited
I. Early repolarization syndrome (ERS)
1. ERS type 1: J wave in I, V4-V6 (anterolateral LV). Rare ventricular fibrillation, very prevalent in healthy male athletes and rarely found
in VF survivors. The frequency of J-point elevation among young athletes is intermediate (higher than among healthy adults but lower
than among patients with idiopathic VF) (Rosso 2008). This variant is considered benign and electrocardiographically is characterized
by frequent sinus bradycardia, axes of QRS, ST segment and T wave, oriented in the same direction in the frontal plane, deep and narrow
Q waves followed by R wave of great voltage in left precordial leads, notch or slurring of R wave descending branch, transition area in
precordial leads of sudden occurrence, J point and ST segment elevation, usually < 2 mm (exceptionally it may be > 5 mm) of superior
concavity in middle and/or left precordial leads (I, V4-V6), possible reduction in J point and ST segment elevation by sympathetic action
and sympathomimetic drugs, absence of reciprocal or mirror image (exception in VR lead), near symmetrical T waves, with great width
and polarity matching QRS. In this variant, there is a voltage gradient, however, no dispersion of duration of action potentials in
ventricular wall thickness. For this reason, these patients showed ST segment elevation with no tendency to develop arrhythmias. Gene
mutation: CACNA1C, CACNB2B.
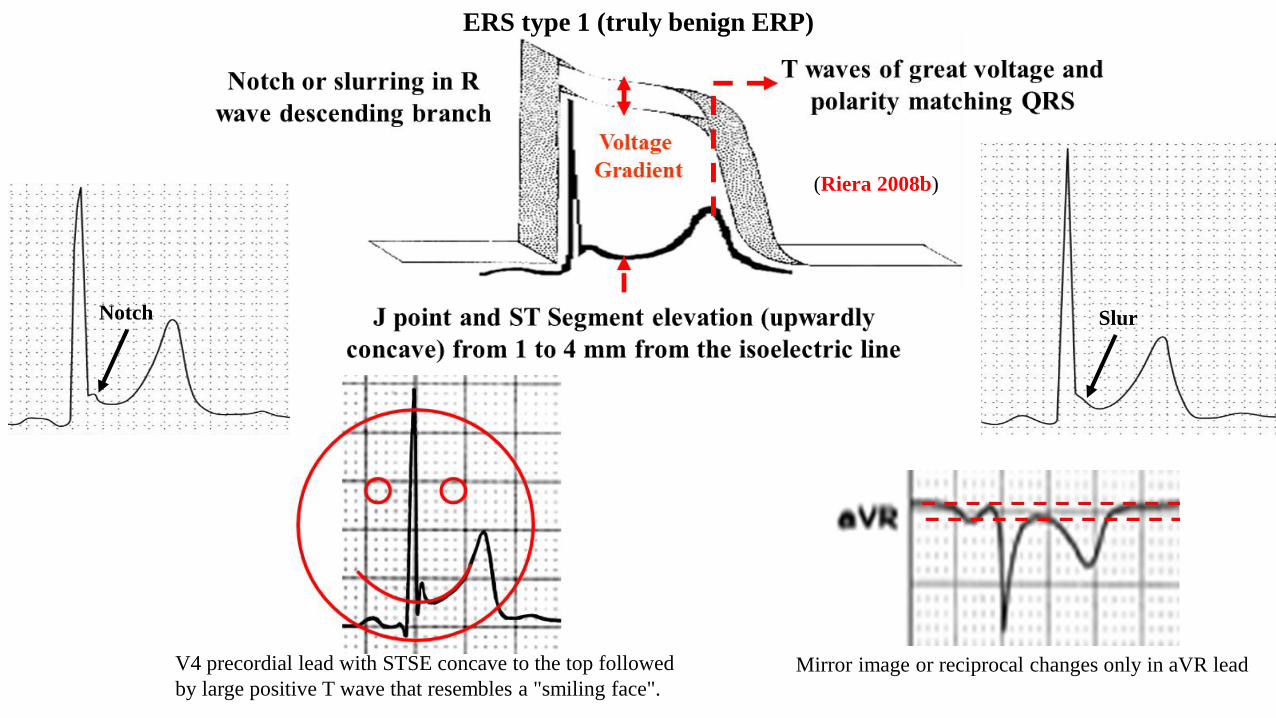
Notch Slur
(Riera 2008b)
V4 precordial lead with STSE concave to the top followed
by large positive T wave that resembles a "smiling face".Mirror image or reciprocal changes only in aVR lead
ERS type 1 (truly benign ERP)
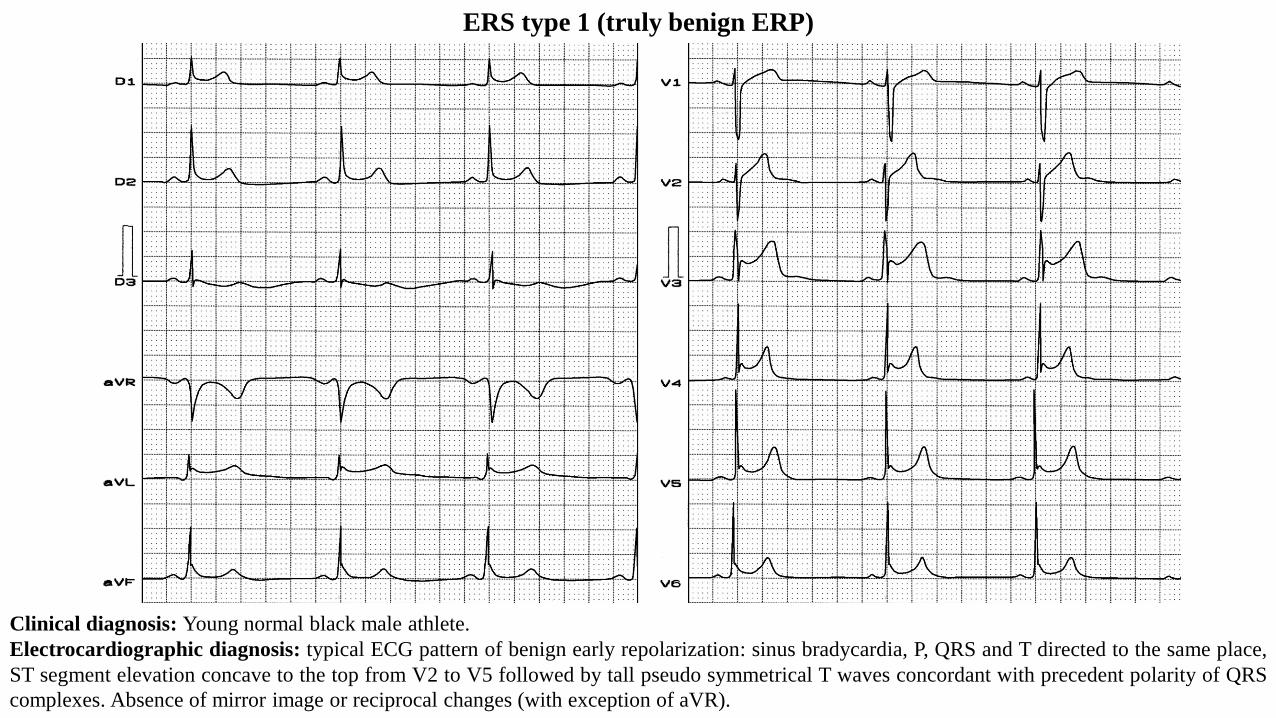
Clinical diagnosis: Young normal black male athlete.
Electrocardiographic diagnosis: typical ECG pattern of benign early repolarization: sinus bradycardia, P, QRS and T directed to the same place,
ST segment elevation concave to the top from V2 to V5 followed by tall pseudo symmetrical T waves concordant with precedent polarity of QRS
complexes. Absence of mirror image or reciprocal changes (with exception of aVR).
ERS type 1 (truly benign ERP)
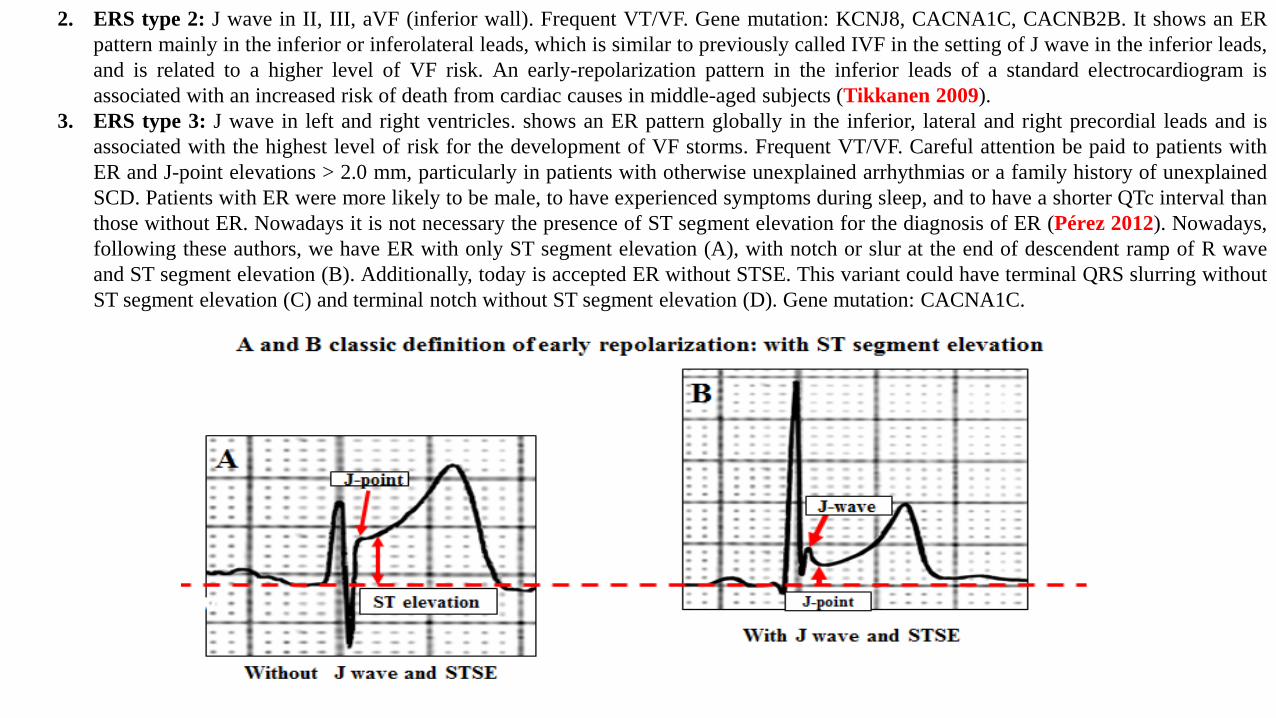
2. ERS type 2: J wave in II, III, aVF (inferior wall). Frequent VT/VF. Gene mutation: KCNJ8, CACNA1C, CACNB2B. It shows an ER
pattern mainly in the inferior or inferolateral leads, which is similar to previously called IVF in the setting of J wave in the inferior leads,
and is related to a higher level of VF risk. An early-repolarization pattern in the inferior leads of a standard electrocardiogram is
associated with an increased risk of death from cardiac causes in middle-aged subjects (Tikkanen 2009).
3. ERS type 3: J wave in left and right ventricles. shows an ER pattern globally in the inferior, lateral and right precordial leads and is
associated with the highest level of risk for the development of VF storms. Frequent VT/VF. Careful attention be paid to patients with
ER and J-point elevations > 2.0 mm, particularly in patients with otherwise unexplained arrhythmias or a family history of unexplained
SCD. Patients with ER were more likely to be male, to have experienced symptoms during sleep, and to have a shorter QTc interval than
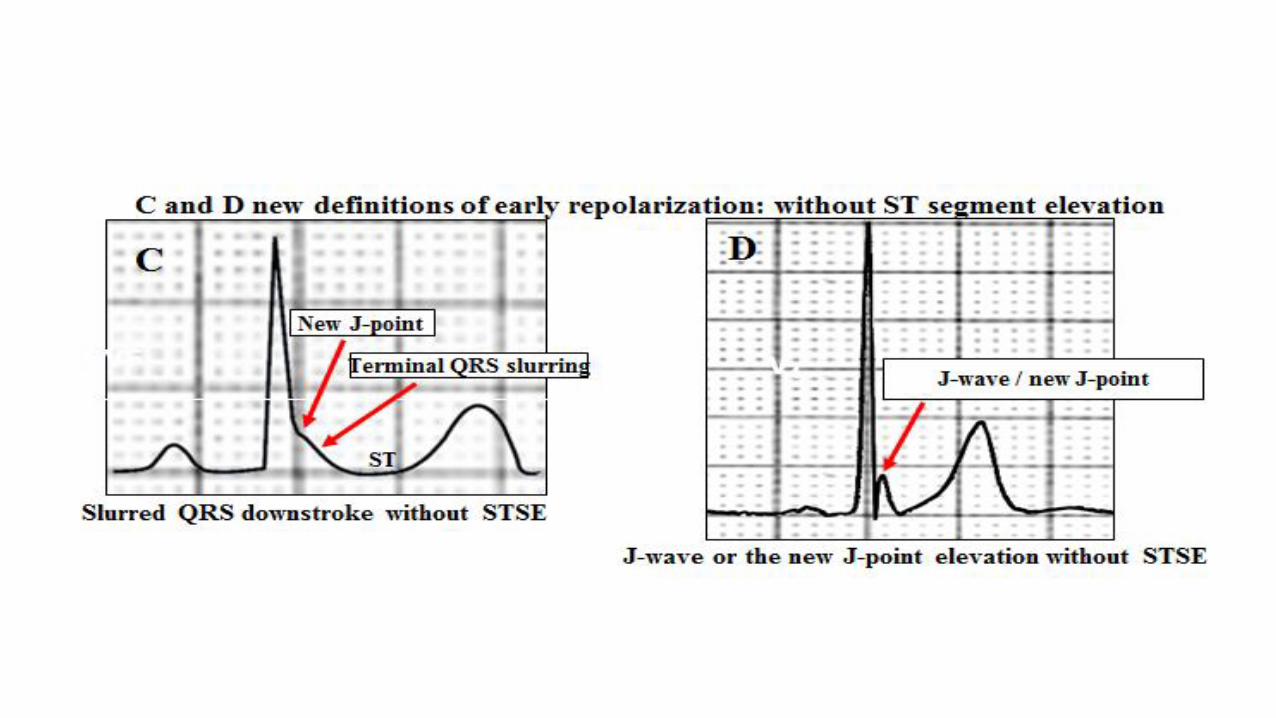
those without ER. Nowadays it is not necessary the presence of ST segment elevation for the diagnosis of ER (Pérez 2012). Nowadays,
following these authors, we have ER with only ST segment elevation (A), with notch or slur at the end of descendent ramp of R wave
and ST segment elevation (B). Additionally, today is accepted ER without STSE. This variant could have terminal QRS slurring without
ST segment elevation (C) and terminal notch without ST segment elevation (D). Gene mutation: CACNA1C.
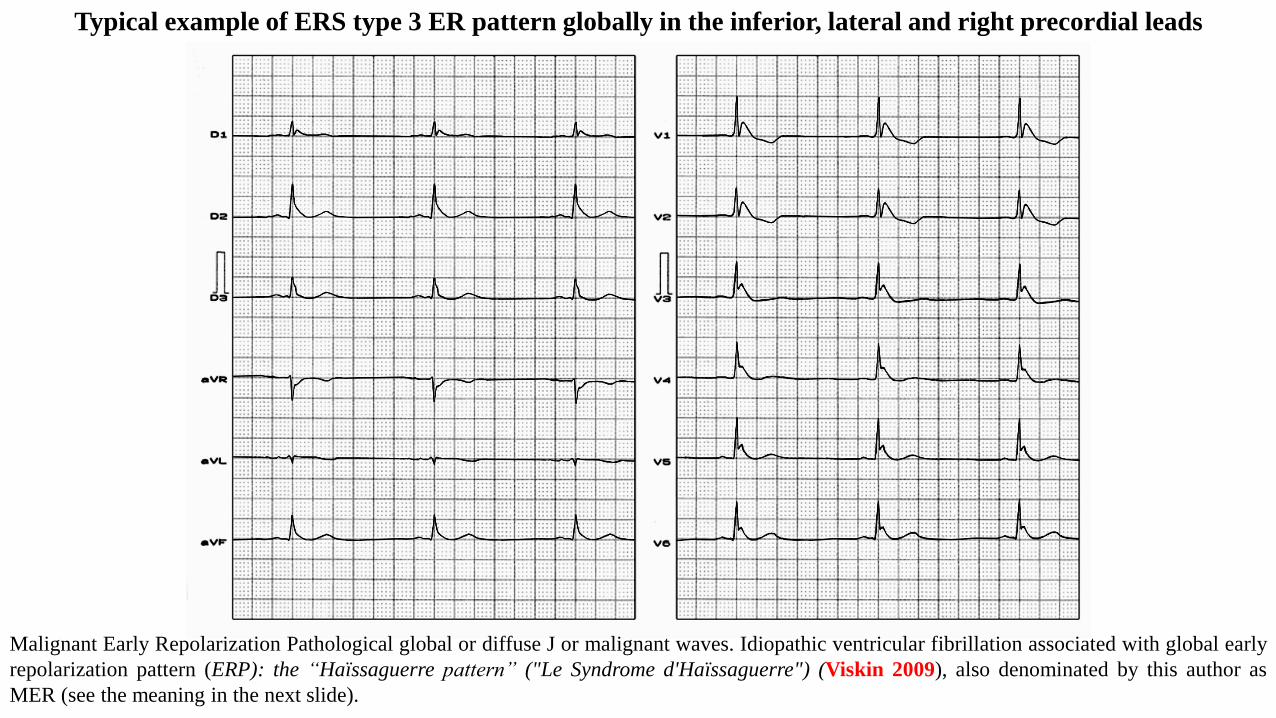
Typical example of ERS type 3 ER pattern globally in the inferior, lateral and right precordial leads
Malignant Early Repolarization Pathological global or diffuse J or malignant waves. Idiopathic ventricular fibrillation associated with global early
repolarization pattern (ERP): the “Haïssaguerre pattern” ("Le Syndrome d'Haïssaguerre") (Viskin 2009), also denominated by this author as
MER (see the meaning in the next slide).
V6
V1
V4
V5
V2
V3
X
Z
J
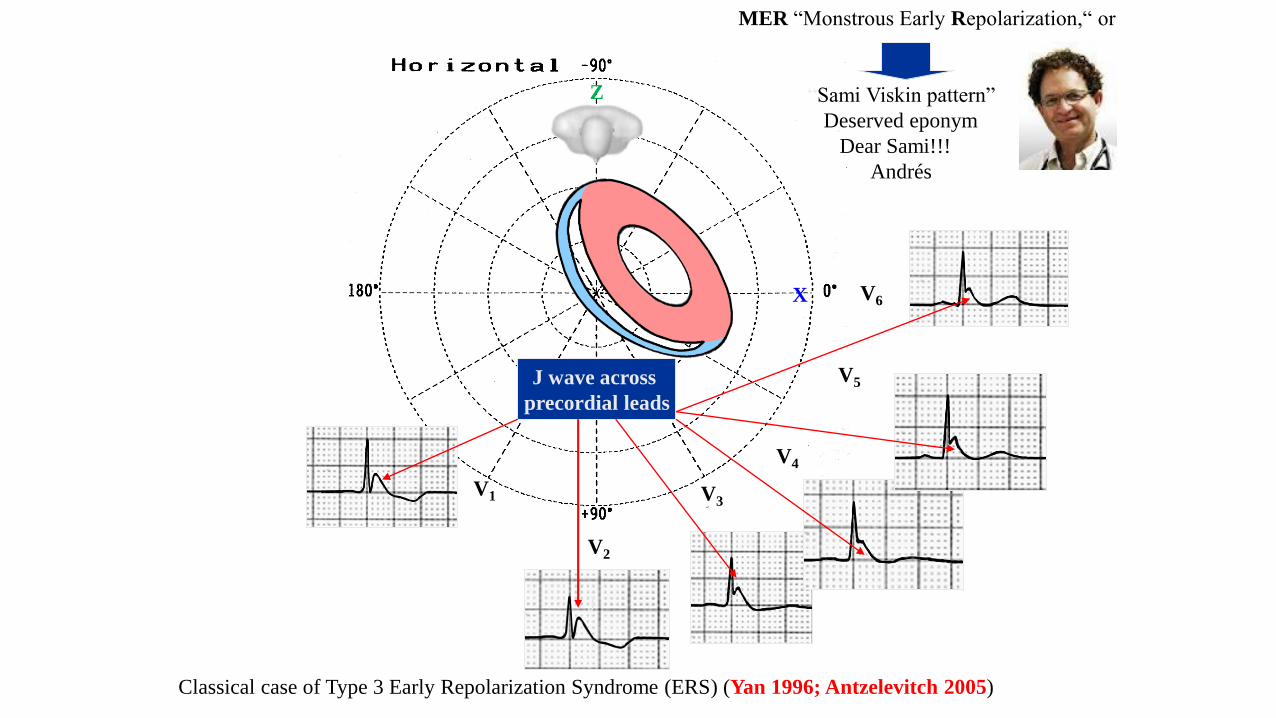
J wave across
precordial leads
MER “Monstrous Early Repolarization,“ or
“Sami Viskin pattern”
Deserved eponym
Dear Sami!!!
Andrés
Classical case of Type 3 Early Repolarization Syndrome (ERS) (Yan 1996; Antzelevitch 2005)
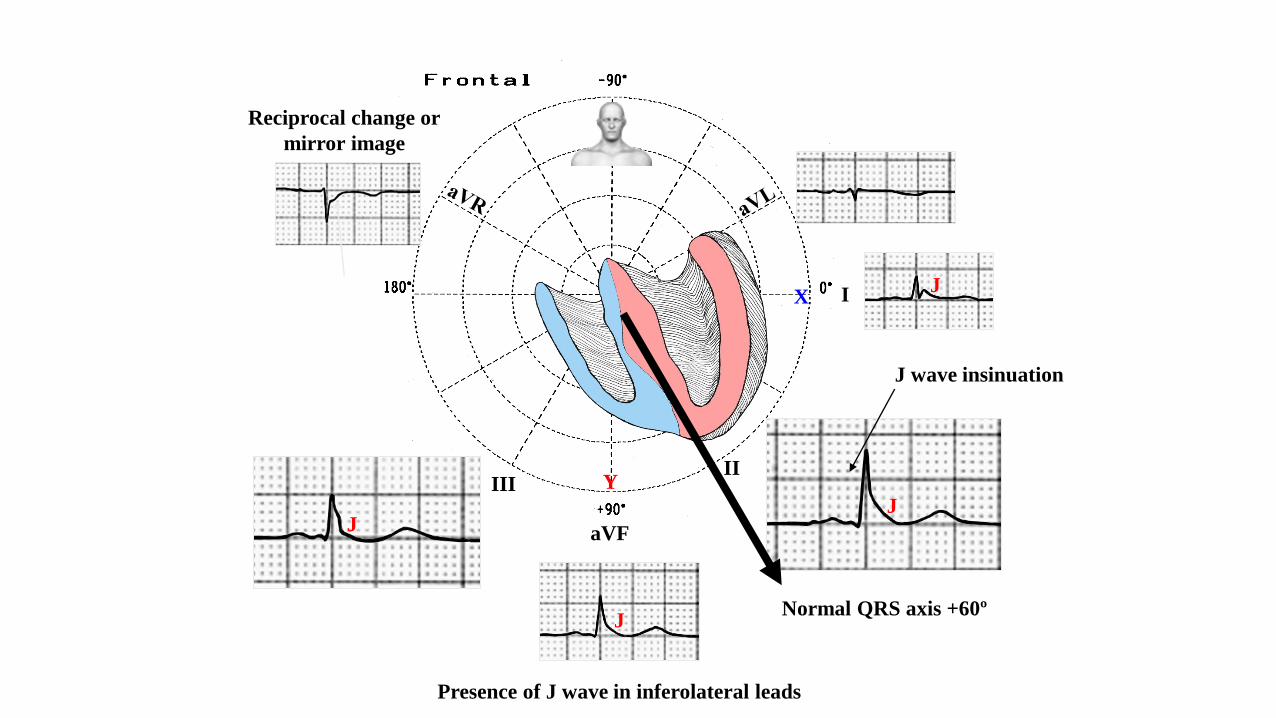
I
IIIII
aVF
X
Y
J wave insinuation
Reciprocal change or
mirror image
Normal QRS axis +60º
J
J
J
Presence of J wave in inferolateral leads
J
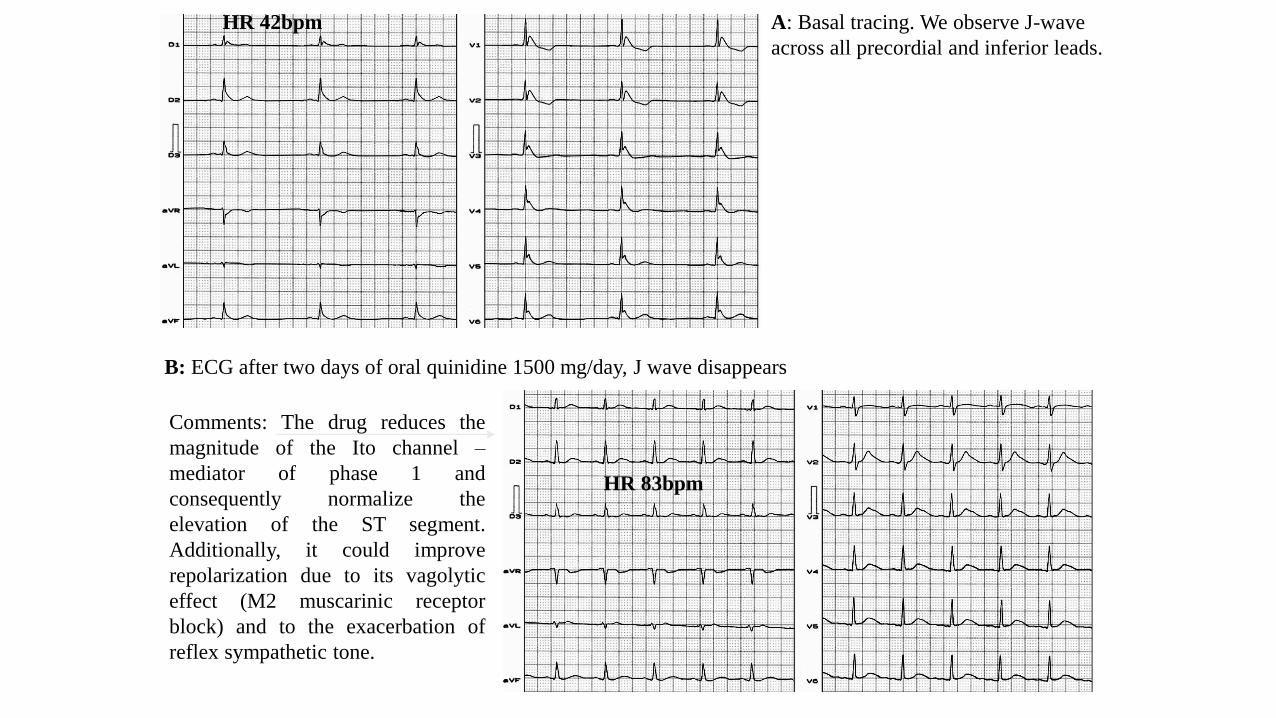
Comments: The drug reduces the
magnitude of the Ito channel –
mediator of phase 1 and
consequently normalize the
elevation of the ST segment.
Additionally, it could improve
repolarization due to its vagolytic
effect (M2 muscarinic receptor
block) and to the exacerbation of
reflex sympathetic tone.
HR 42bpm
HR 83bpm
A: Basal tracing. We observe J-wave
across all precordial and inferior leads.
B: ECG after two days of oral quinidine 1500 mg/day, J wave disappears
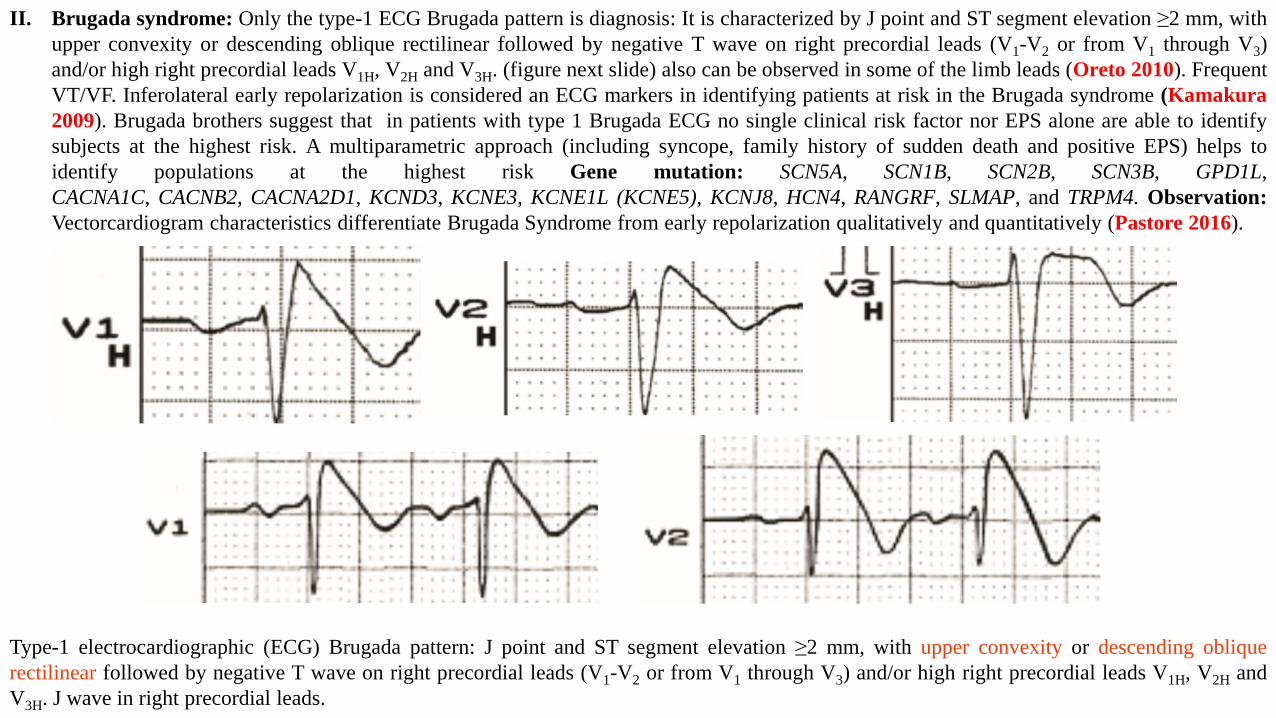
II. Brugada syndrome: Only the type-1 ECG Brugada pattern is diagnosis: It is characterized by J point and ST segment elevation ≥2 mm, with
upper convexity or descending oblique rectilinear followed by negative T wave on right precordial leads (V1-V2 or from V1 through V3)
and/or high right precordial leads V1H, V2H and V3H. (figure next slide) also can be observed in some of the limb leads (Oreto 2010). Frequent
VT/VF. Inferolateral early repolarization is considered an ECG markers in identifying patients at risk in the Brugada syndrome (Kamakura
2009). Brugada brothers suggest that in patients with type 1 Brugada ECG no single clinical risk factor nor EPS alone are able to identify
subjects at the highest risk. A multiparametric approach (including syncope, family history of sudden death and positive EPS) helps to
identify populations at the highest risk Gene mutation: SCN5A, SCN1B, SCN2B, SCN3B, GPD1L,
CACNA1C, CACNB2, CACNA2D1, KCND3, KCNE3, KCNE1L (KCNE5), KCNJ8, HCN4, RANGRF, SLMAP, and TRPM4. Observation:
Vectorcardiogram characteristics differentiate Brugada Syndrome from early repolarization qualitatively and quantitatively (Pastore 2016).
Type-1 electrocardiographic (ECG) Brugada pattern: J point and ST segment elevation ≥2 mm, with upper convexity or descending oblique
rectilinear followed by negative T wave on right precordial leads (V1-V2 or from V1 through V3) and/or high right precordial leads V1H, V2H and
V3H. J wave in right precordial leads.
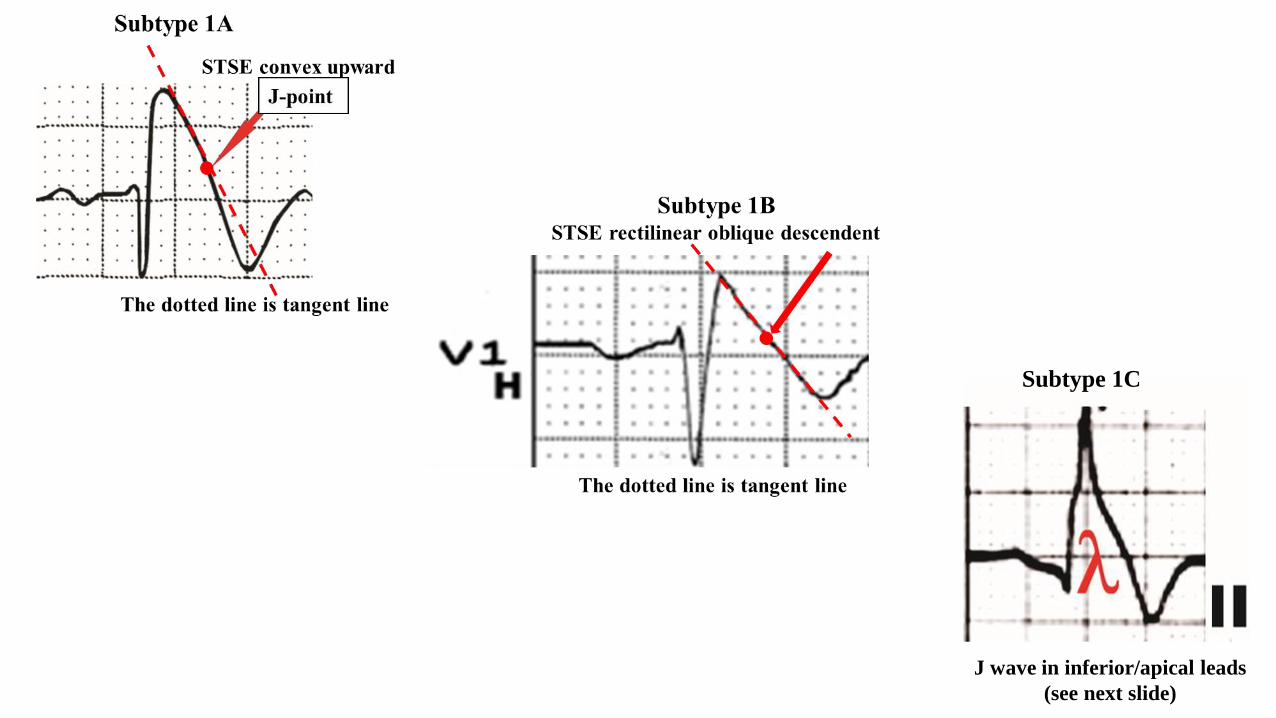
Subtype 1C
J wave in inferior/apical leads
(see next slide)
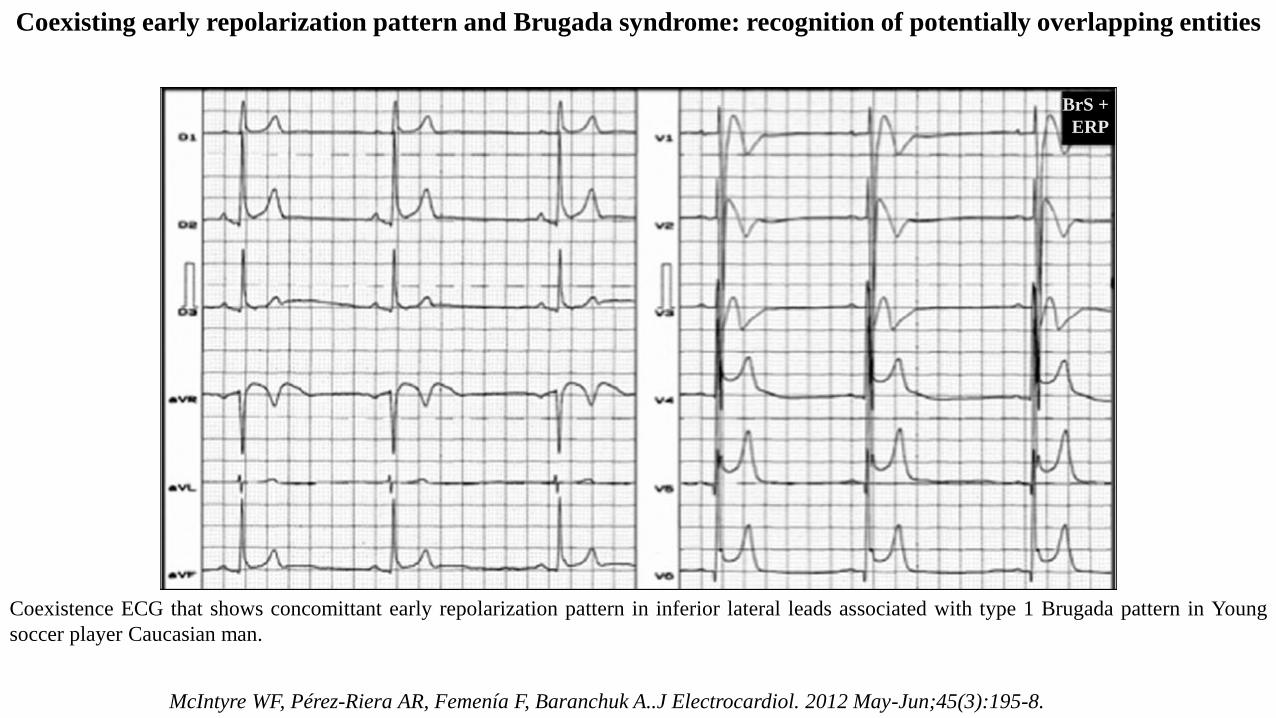
Coexisting early repolarization pattern and Brugada syndrome: recognition of potentially overlapping entities
Coexistence ECG that shows concomittant early repolarization pattern in inferior lateral leads associated with type 1 Brugada pattern in Young
soccer player Caucasian man.
BrS +
ERP
McIntyre WF, Pérez-Riera AR, Femenía F, Baranchuk A..J Electrocardiol. 2012 May-Jun;45(3):195-8.
3. Overlapping early repolarization and Brugada syndrome or atypical Brugada syndrome (Riera 2004; McIntyre 2012; Nademanee 2014; Talib
2014). See next slide.
4. Idiopathic Ventricular fibrillation (IVF). “Le syndrome d’Haïssaguerre” (Viskin 2009). Frequent VT/VF (Lévy 2011; Haïssaguerre 2008). IVF
patients with fragmented QRS (f-QRS) and J wave suffer the most frequent VF episodes compared to those with only J wave, or without f-QRS
and J wave (Wang 2012). The combination of J waves with horizontal/descending ST segment improved our ability to distinguish patients with
idiopathic VF from controls matched by gender and age (Rosso 2012). J waves, particularly of large amplitude and recorded in multiple leads, are
more prevalent among patients with idiopathic VF (Rosso 2011).
5. In concealed forms of arrhythmogenic right ventricular cardiomyopathy/ dysplasia (Nava 1988; Corrado 1996).
6. Overlap of Brugada syndrome and arrhythmogenic right ventricular cardiomyopathy/dysplasia (Pérez Riera 2005; Forkmann 20015; Kataoka S
2016; Corrado 2016; Peters 2015;; Peters 2016).
7. Congenital Short QT syndrome (Watanabe 2010; Adler 2016)
II. Acquired
1. Hypothermia mediated VT/VF (Pérez-Riera 2013;Omar 2016; )
2. Ischemia- mediated: Acute STEMI (Aizawa 2006; Shinde 2007) and vasospastic angina or variant angina of Prinzmetal’s angina (Sacha 2012;
Zhu 2015). Clinical observations suggest an association between Ito density and risk of primary VF during AMI. Women with CHD have only one
fourth the risk for SCD compared with men (Kannel 1998) This may be due, in part, to a more prominent Ito in males than in females, which is
thought to be responsible for the predominance of J-wave syndromes in men. The incidence of primary VF is higher in patients with acute inferior
MI who have RV involvement (8.4%) than in those without (2.7%) or in those with an anterior myocardial infarction (5.0%).67 This may be due to
the fact that Ito is much more prominent in right than left ventricular epicardium.38,68 Taken together, these observations suggest that the
fundamental mechanisms responsible for ST-segment elevation and initiation of VF are similar in the early phases of acute myocardial ischemia
and the inherited J-wave syndromes in which phase 2 reentry functions as a trigger and enhanced dispersion of repolarization as substrate for
reentry and the development of VF.
3. Hypercalcemia (Morales 2011; Topsakal 2003; Otero 2000; Jenkins 1987; Sridharan 1984)
4. Injuries in the central nervous system: subarachnoid hemorrhage (Katoh 1980), post-heart arrest (Jain 1990) and in cervical sympathetic system
dysfunction (Carrillo-Esper 2004).
5. Epileptic Hemiplegia: transient postictal hemiplegia (Todd's paralysis) (O'Connell 2013)
6. Psychotropic drugs: such as olanzapine, valproate, and flunitrazepam (Kataoka 2016)
7. Cocaine use (Ortega-Carnicer 2001; Talebi 2015)
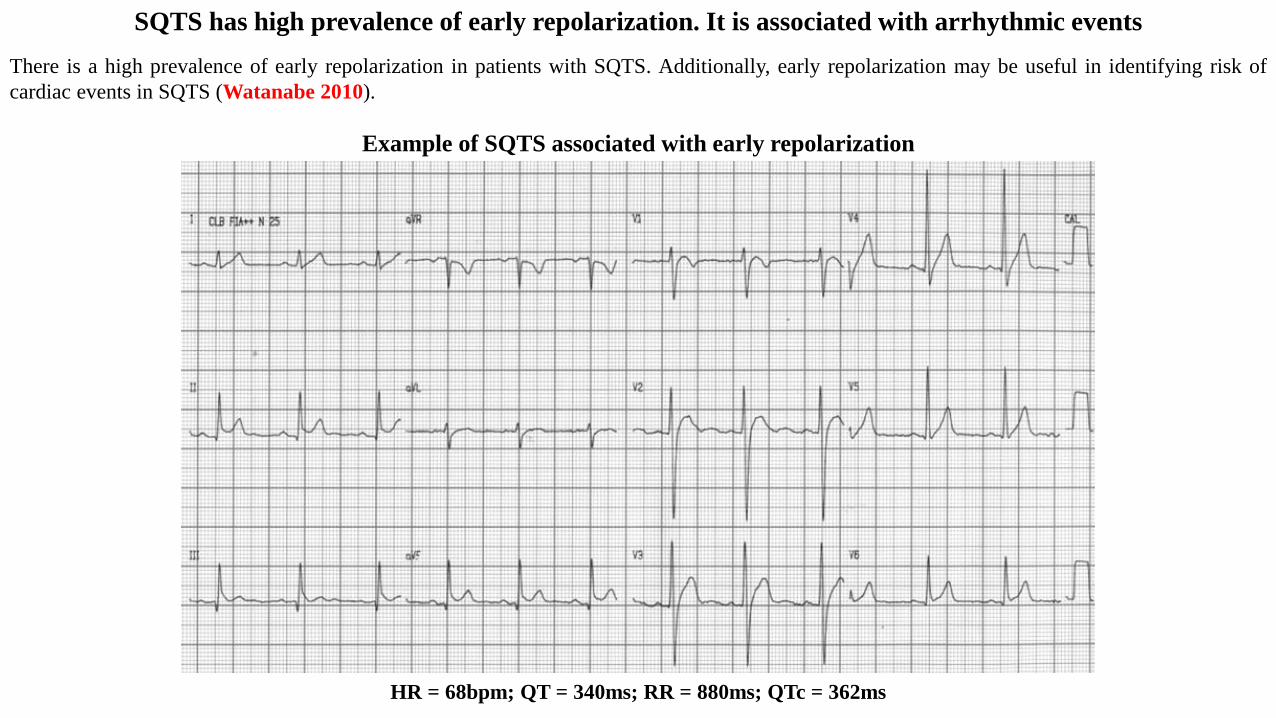
SQTS has high prevalence of early repolarization. It is associated with arrhythmic events
There is a high prevalence of early repolarization in patients with SQTS. Additionally, early repolarization may be useful in identifying risk of
cardiac events in SQTS (Watanabe 2010).
HR = 68bpm; QT = 340ms; RR = 880ms; QTc = 362ms
Example of SQTS associated with early repolarization
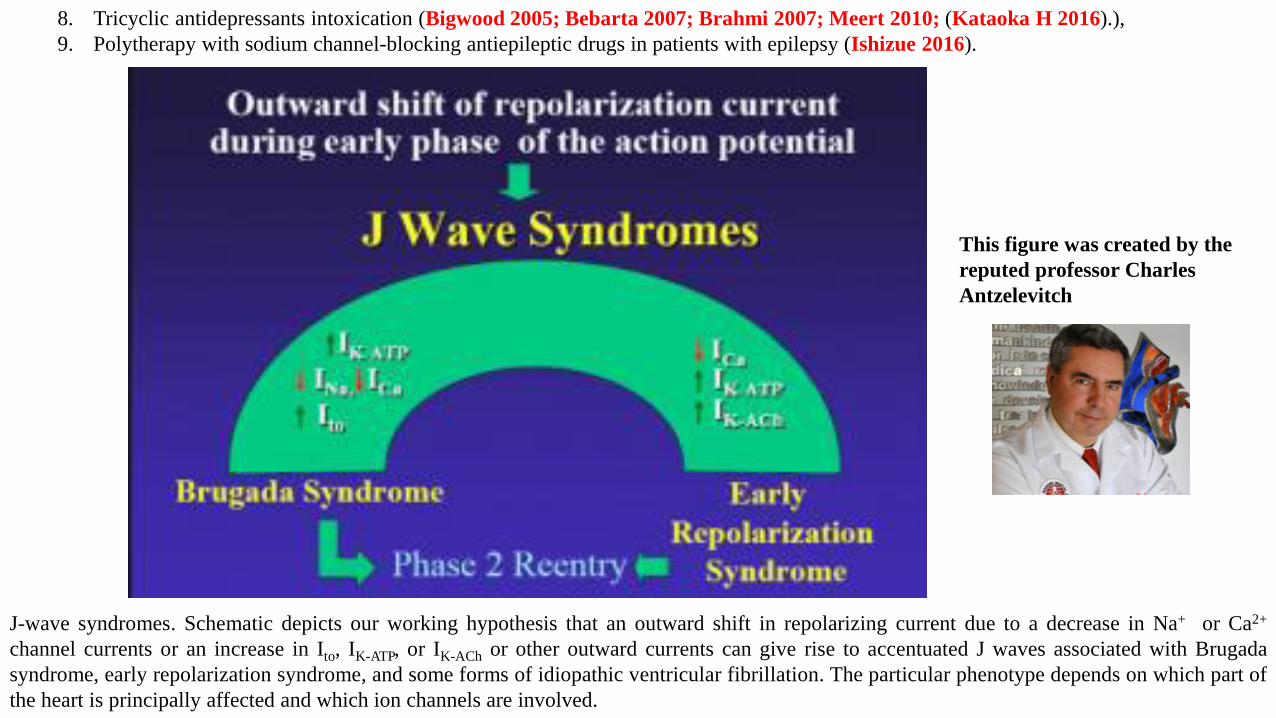
8. Tricyclic antidepressants intoxication (Bigwood 2005; Bebarta 2007; Brahmi 2007; Meert 2010; (Kataoka H 2016).),
9. Polytherapy with sodium channel-blocking antiepileptic drugs in patients with epilepsy (Ishizue 2016).
J-wave syndromes. Schematic depicts our working hypothesis that an outward shift in repolarizing current due to a decrease in Na+ or Ca2+
channel currents or an increase in Ito, IK-ATP, or IK-ACh or other outward currents can give rise to accentuated J waves associated with Brugada
syndrome, early repolarization syndrome, and some forms of idiopathic ventricular fibrillation. The particular phenotype depends on which part of
the heart is principally affected and which ion channels are involved.
This figure was created by the
reputed professor Charles
Antzelevitch
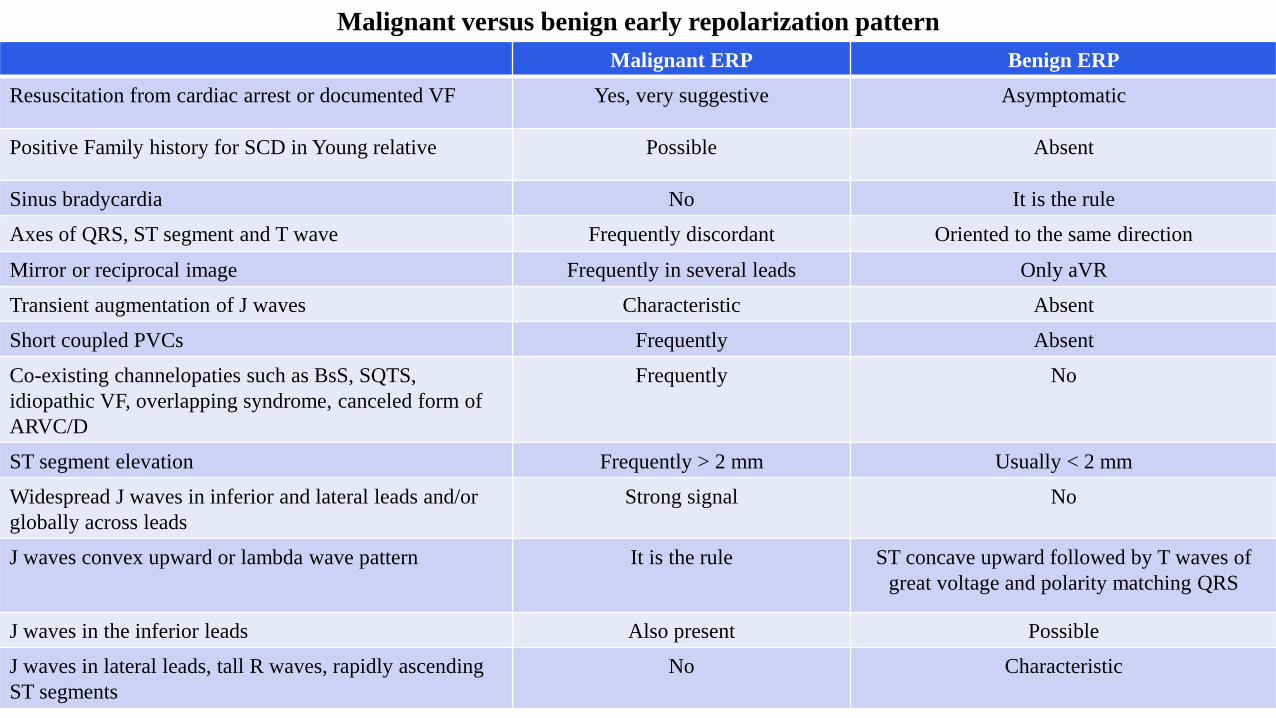
Malignant versus benign early repolarization pattern
Malignant ERP Benign ERP
Resuscitation from cardiac arrest or documented VF Yes, very suggestive Asymptomatic
Positive Family history for SCD in Young relative Possible Absent
Sinus bradycardia No It is the rule
Axes of QRS, ST segment and T wave Frequently discordant Oriented to the same direction
Mirror or reciprocal image Frequently in several leads Only aVR
Transient augmentation of J waves Characteristic Absent
Short coupled PVCs Frequently Absent
Co-existing channelopaties such as BsS, SQTS,
idiopathic VF, overlapping syndrome, canceled form of
ARVC/D
Frequently No
ST segment elevation Frequently > 2 mm Usually < 2 mm
Widespread J waves in inferior and lateral leads and/or
globally across leads
Strong signal No
J waves convex upward or lambda wave pattern It is the rule ST concave upward followed by T waves of
great voltage and polarity matching QRS
J waves in the inferior leads Also present Possible
J waves in lateral leads, tall R waves, rapidly ascending
ST segments
No Characteristic
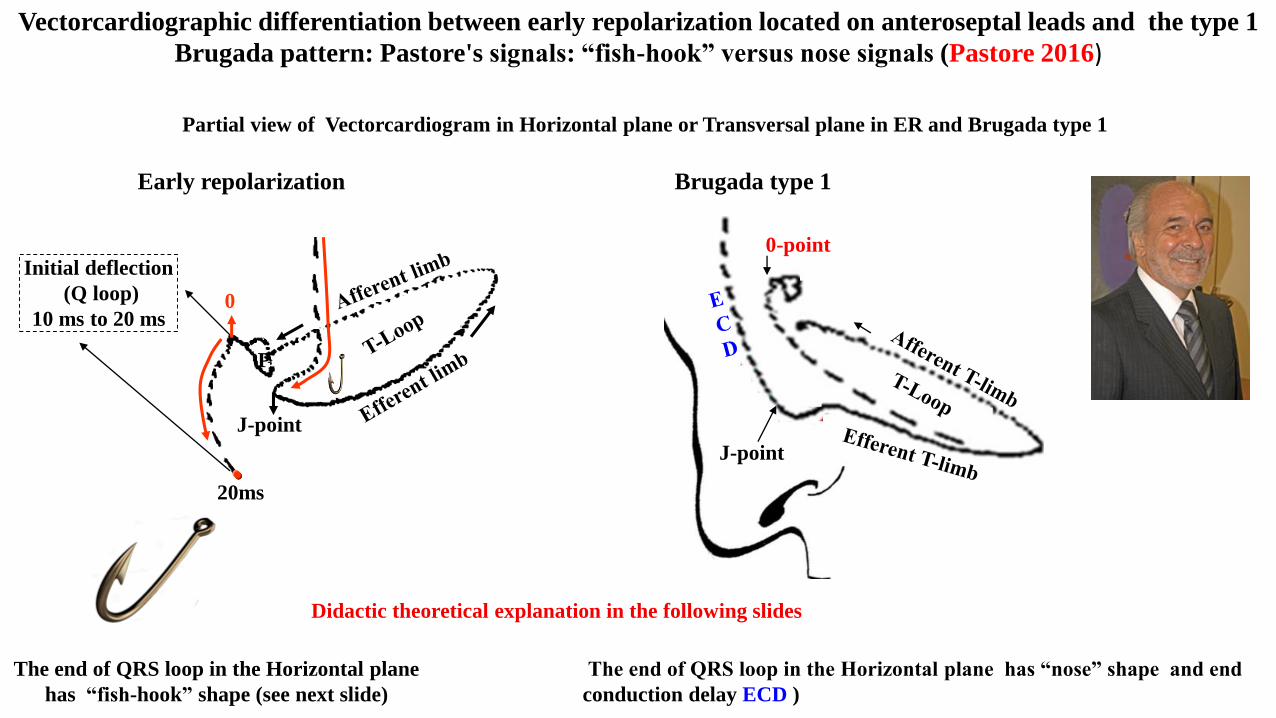
Vectorcardiographic differentiation between early repolarization located on anteroseptal leads and the type 1
Brugada pattern: Pastore's signals: “fish-hook” versus nose signals (Pastore 2016)
The end of QRS loop in the Horizontal plane has “nose” shape and end
conduction delay ECD )
The end of QRS loop in the Horizontal plane
has “fish-hook” shape (see next slide)
Partial view of Vectorcardiogram in Horizontal plane or Transversal plane in ER and Brugada type 1
Didactic theoretical explanation in the following slides
Early repolarization Brugada type 1
0-point
J-point
P
0
J-point
Initial deflection
(Q loop)
10 ms to 20 ms
20ms
V6
V1
V4
V5
T
VCG horizontal plane correlation
V2
V3
P
P
0
J
Initial deflection
(Q loop)
10 ms to 20 ms
20ms
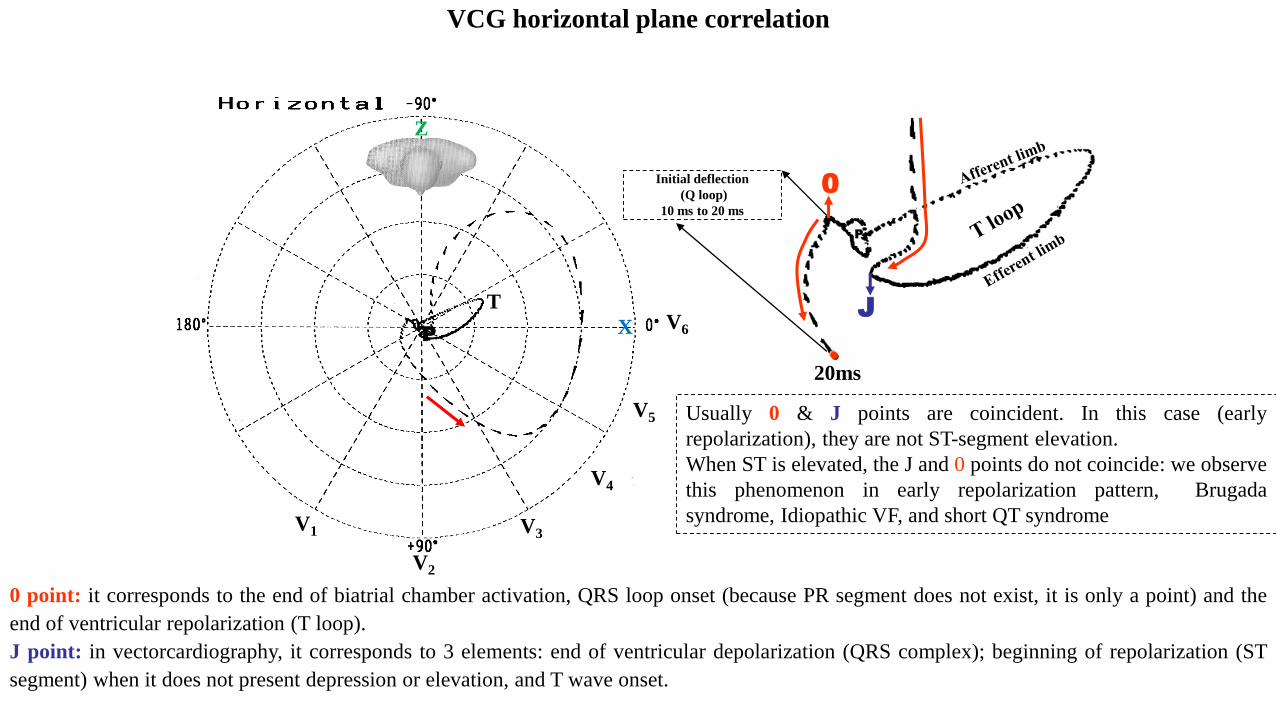
0 point: it corresponds to the end of biatrial chamber activation, QRS loop onset (because PR segment does not exist, it is only a point) and the
end of ventricular repolarization (T loop).
J point: in vectorcardiography, it corresponds to 3 elements: end of ventricular depolarization (QRS complex); beginning of repolarization (ST
segment) when it does not present depression or elevation, and T wave onset.
Usually 0 & J points are coincident. In this case (early
repolarization), they are not ST-segment elevation.
When ST is elevated, the J and 0 points do not coincide: we observe
this phenomenon in early repolarization pattern, Brugada
syndrome, Idiopathic VF, and short QT syndrome
X
Z
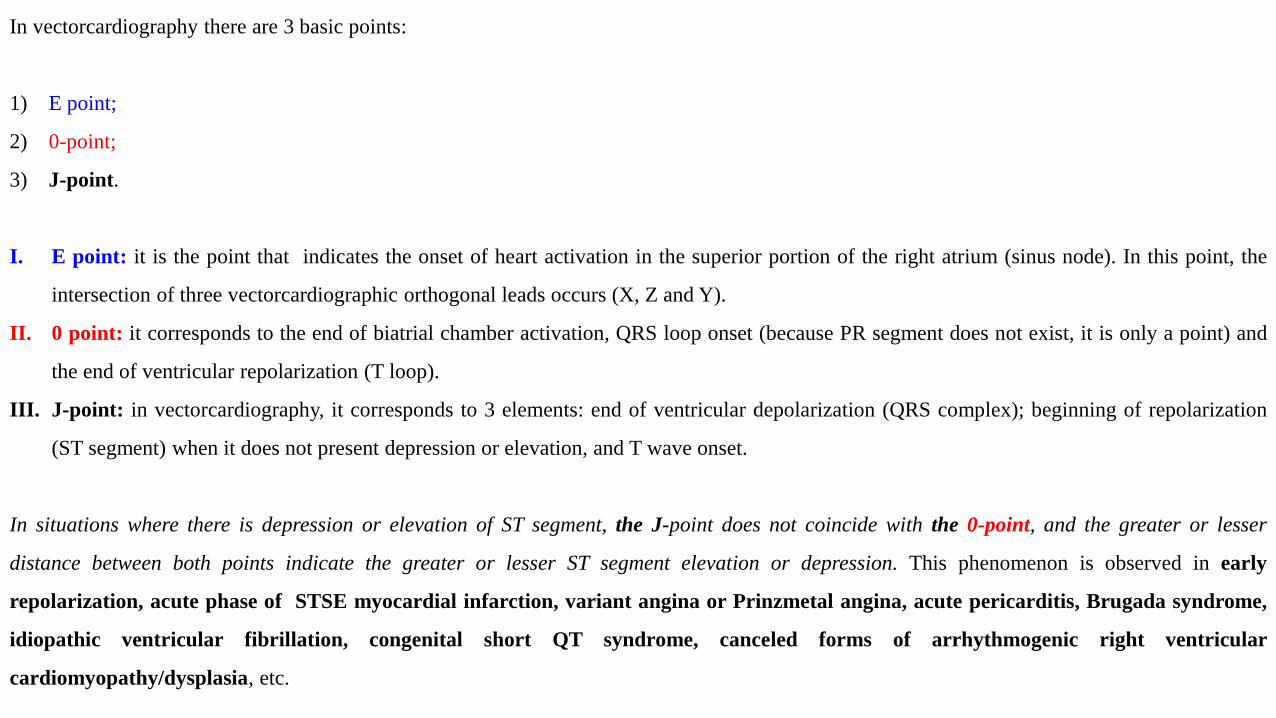
In vectorcardiography there are 3 basic points:
1) E point;
2) 0-point;
3) J-point.
I. E point: it is the point that indicates the onset of heart activation in the superior portion of the right atrium (sinus node). In this point, the
intersection of three vectorcardiographic orthogonal leads occurs (X, Z and Y).
II. 0 point: it corresponds to the end of biatrial chamber activation, QRS loop onset (because PR segment does not exist, it is only a point) and
the end of ventricular repolarization (T loop).
III. J-point: in vectorcardiography, it corresponds to 3 elements: end of ventricular depolarization (QRS complex); beginning of repolarization
(ST segment) when it does not present depression or elevation, and T wave onset.
In situations where there is depression or elevation of ST segment, the J-point does not coincide with the 0-point, and the greater or lesser
distance between both points indicate the greater or lesser ST segment elevation or depression. This phenomenon is observed in early
repolarization, acute phase of STSE myocardial infarction, variant angina or Prinzmetal angina, acute pericarditis, Brugada syndrome,
idiopathic ventricular fibrillation, congenital short QT syndrome, canceled forms of arrhythmogenic right ventricular
cardiomyopathy/dysplasia, etc.
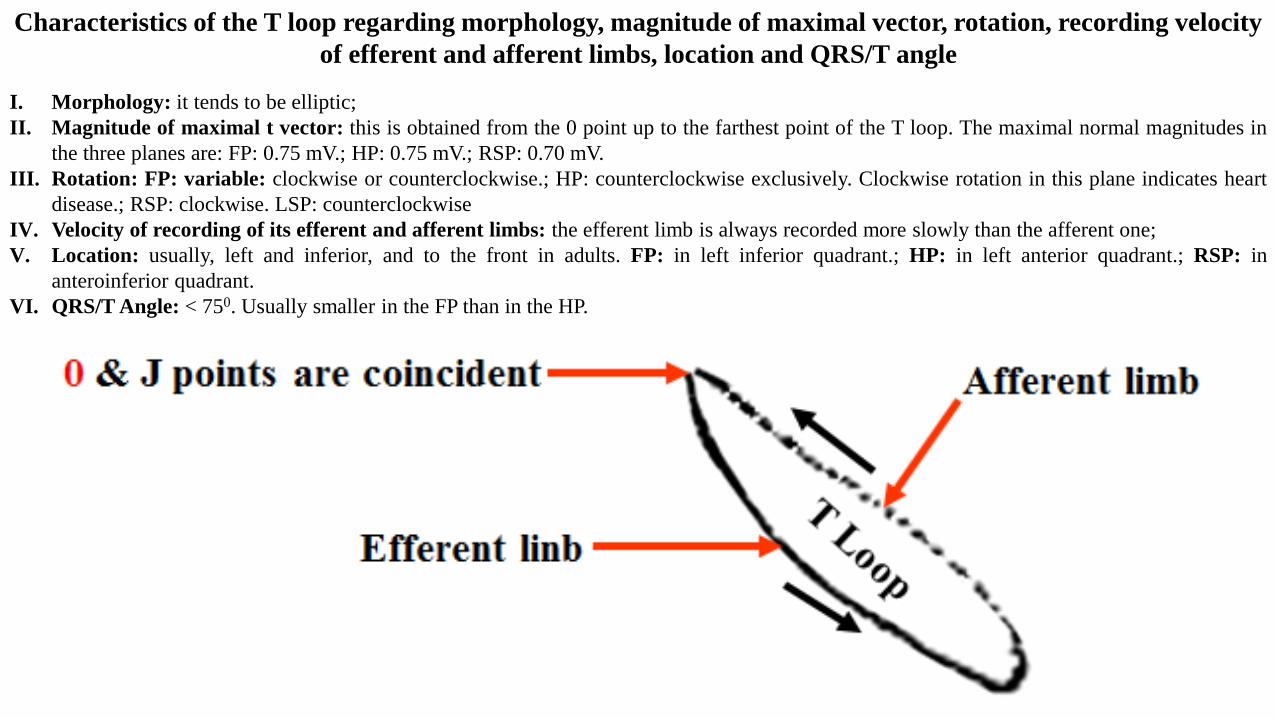
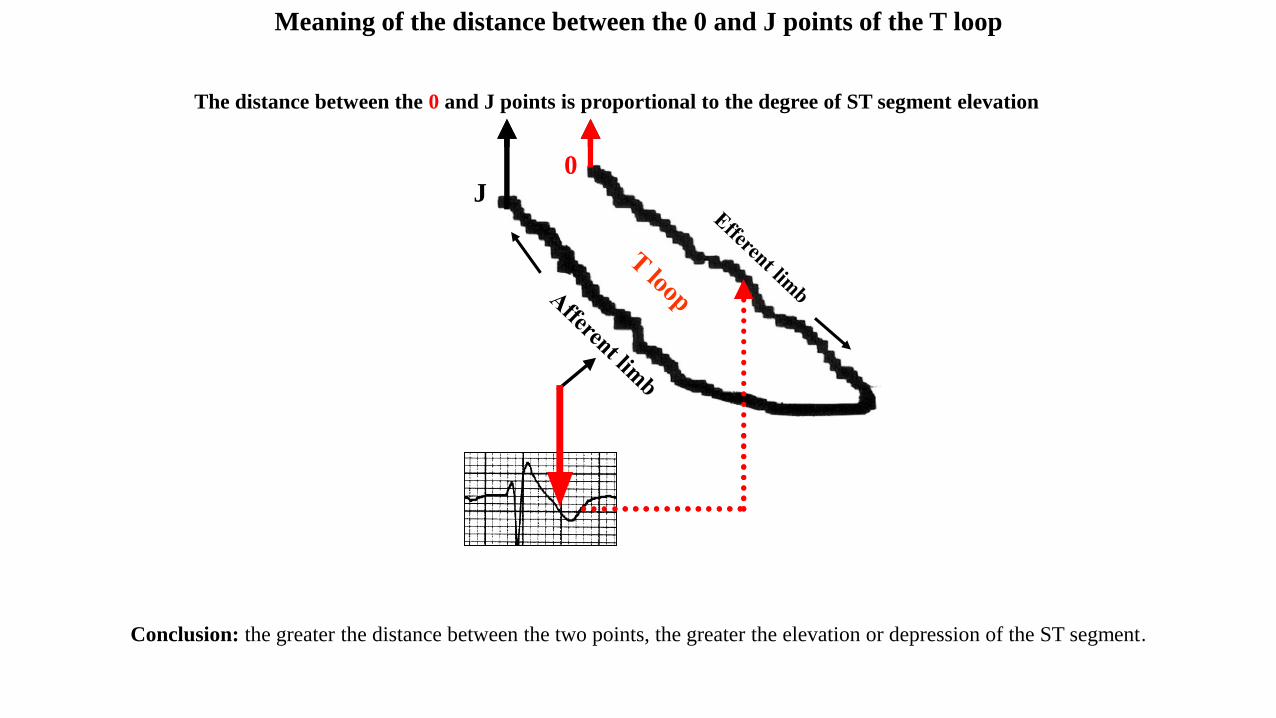
Characteristics of the T loop regarding morphology, magnitude of maximal vector, rotation, recording velocity
of efferent and afferent limbs, location and QRS/T angle
I. Morphology: it tends to be elliptic;
II. Magnitude of maximal t vector: this is obtained from the 0 point up to the farthest point of the T loop. The maximal normal magnitudes in
the three planes are: FP: 0.75 mV.; HP: 0.75 mV.; RSP: 0.70 mV.
III. Rotation: FP: variable: clockwise or counterclockwise.; HP: counterclockwise exclusively. Clockwise rotation in this plane indicates heart
disease.; RSP: clockwise. LSP: counterclockwise
IV. Velocity of recording of its efferent and afferent limbs: the efferent limb is always recorded more slowly than the afferent one;
V. Location: usually, left and inferior, and to the front in adults. FP: in left inferior quadrant.; HP: in left anterior quadrant.; RSP: in
anteroinferior quadrant.
VI. QRS/T Angle: < 750. Usually smaller in the FP than in the HP.
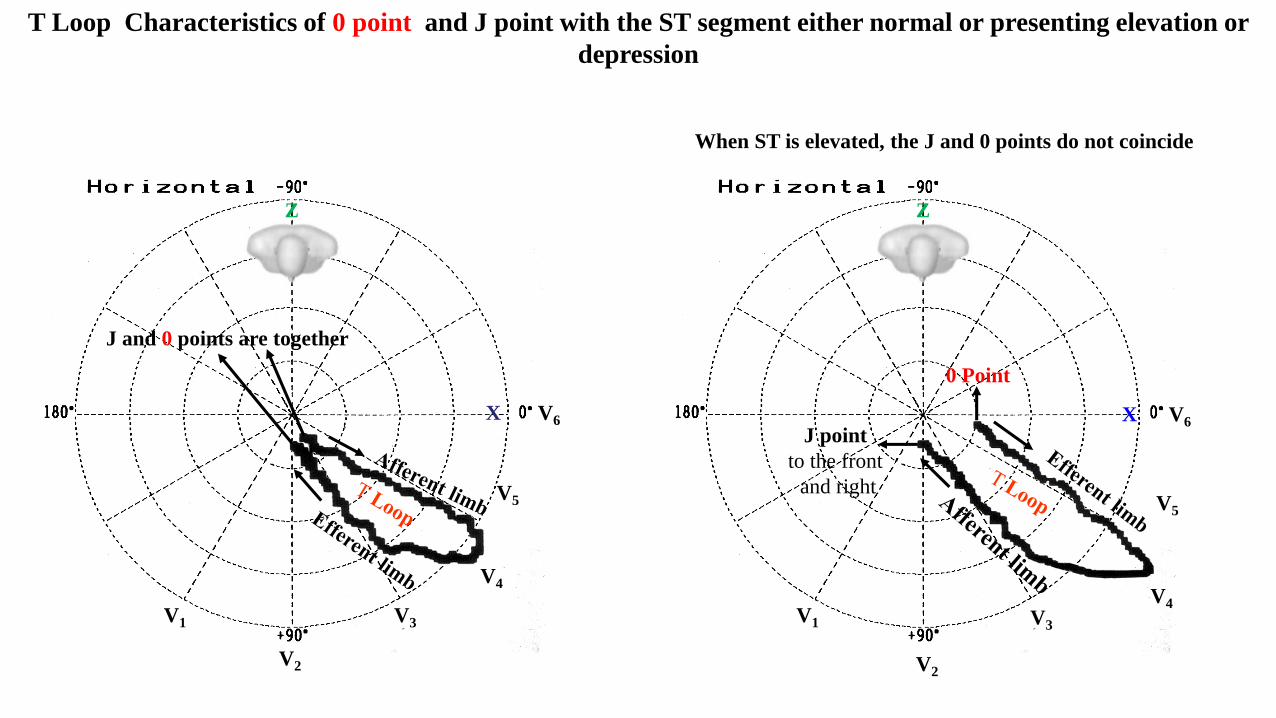
When ST is elevated, the J and 0 points do not coincide
T Loop Characteristics of 0 point and J point with the ST segment either normal or presenting elevation or
depression
X V6
V1
V4
V5
V2
V3
Z
X V6
V1
V4
V5
V2
V3
Z
J point
to the front
and right
0 Point
J and 0 points are together
0
AFFERENT
LIMB
Conclusion: the greater the distance between the two points, the greater the elevation or depression of the ST segment.
The distance between the 0 and J points is proportional to the degree of ST segment elevation
J0
Meaning of the distance between the 0 and J points of the T loop
1. Abbott JA, Cheitlin MD. The nonspecific camel-hump sign. JAMA. 1976;235(4):413-4.
2. Adler A, Viskin S. Clinical Features of Genetic Cardiac Diseases Related to Potassium Channelopathies. Card Electrophysiol Clin.
2016;8(2):361-72
3. Aizawa Y, Sato A. Brugada syndrome and vasospasitc angina do coexist: potential clinical importance. Intern Med. 2006;45(2):43-4.
4. Alhaddad IA, Khalil M, Brown EJ Jr. Osborn waves of hypothermia. Circulation. 2000;101(25):E233-44.
5. Antzelevitch C. Modulation of transmural repolarization. Ann N Y Acad Sci. 2005;1047:314-23.
6. Antzelevitch C, Yan GX. J wave syndromes. Heart Rhythm. 2010;7(4):549-58.
7. Antzelevitch C, Yan GX. J-wave syndromes: Brugada and early repolarization syndromes. Heart Rhythm. 2015;12(8):1852-66.
8. Bashour TT, Antonini C Sr, Fisher J. Severe sinus node dysfunction in obstructive jaundice. Ann Intern Med. 1985;103(3):384-5.
9. Bebarta VS, Waksman JC. Amitriptyline-induced Brugada pattern fails to respond to sodium bicarbonate. Clin Toxicol (Phila).
2007;45(2):186-8.
10. Bigwood B, Galler D, Amir N, Smith W. Brugada syndrome following tricyclic antidepressant overdose. Anaesth Intensive Care.
2005;33(2):266-70.
11. Bjørnstad H, Tande PM, Refsum H. Cardiac electrophysiology during hypothermia. Implications for medical treatment. Arctic Med Res.
1991;50 Suppl 6:71-5.
12. Brahmi N, Thabet H, Kouraichi N, Driss I, Amamou M. Brugada syndrome and other cardiovascular abnormalities related to tricyclic
antidepressants ans related drugs intoxication]. Arch Mal Coeur Vaiss. 2007;100(1):28-33.
13. Burali A, Porciello PI. [Osborn wave in normothermic patients?]. G Ital Cardiol. 1991;21(9):1005-9.
14. Carrillo-Esper R, Limón-Camacho L, Vallejo-Mora HL, et al. [Non-hypothermic J wave in subarachnoid hemorrhage]. Cir Cir.
2004;72(2):125-9.
15. Chhabra L, Devadoss R, Liti B, Spodick DH. Electrocardiographic changes in hypothermia: a review. Ther Hypothermia Temp
Manag. 2013;3(2):54-62.
16. Corrado D, Nava A, Buja G, et al. Familial cardiomyopathy underlies syndrome of right bundle branch block, ST segment elevation and
sudden death. J Am Coll Cardiol. 1996;27(2):443-8.
References
17. Corrado D, Zorzi A, Cerrone M, et al. Relationship Between Arrhythmogenic Right Ventricular Cardiomyopathy and Brugada Syndrome: New
Insights From Molecular Biology and Clinical Implications. Circ Arrhythm Electrophysiol. 2016 Apr;9(4). pii: e003631. doi:
10.1161/CIRCEP.115.003631
18. de Souza D, Riera AR, Bombig MT, et al. Electrocardiographic changes by accidental hypothermia in an urban and a tropical region. J
Electrocardiol. 2007;40(1):47-52.
19. Fleming PR, Muir FH. Electrocardiographic changes in induced hypothermia in man. Br Heart J. 1957;19(1):59-66.
20. Forkmann M, Tomala J, Huo Y, et al Epicardial Ventricular Tachycardia Ablation in a Patient With Brugada ECG Pattern and Mutation of
PKP2 and DSP Genes.Circ Arrhythm Electrophysiol. 2015;8(2):505-7.
21. Frye RE, Rossignol DA Mitochondrial dysfunction can connect the diverse medical symptoms associated with autism spectrum disorders.
Pediatr Res. 2011;69(5 Pt 2):41R-7R.
22. Gebauer CM, Knuepfer M, Robel-Tillig E, Pulzer F, Vogtmann C. Hemodynamics among neonates with hypoxic-ischemic encephalopathy
during whole-body hypothermia and passive rewarming. Pediatrics. 2006;117(3):843-50.
23. Giulivi C, Zhang YF, Omanska-Klusek A, et al. Mitochondrial dysfunction in autism. JAMA. 2010 ;304(21):2389-96.
24. Haïssaguerre M, Derval N, Sacher F, et al. Sudden cardiac arrest associated with early repolarization. N Engl J Med. 2008(19);358:2016–23.
25. Hlaing T, Di Mino T, Kowey PR, Yan GX. ECG repolarization waves: their genesis and clinical implications. Ann Noninvasive Electrocardiol.
2005;10(2):211-23.
26. Ishizue N, Niwano S, Saito M, et al. Polytherapy with sodium channel-blocking antiepileptic drugs is associated with arrhythmogenic ST-T
abnormality in patients with epilepsy. Seizure. 2016;40:81-87.
27. Iida K, Hino Y, Ohara T, Chihara K. A case of myxedema coma caused by isolated thyrotropin stimulating hormone deficiency and
Hashimoto's thyroiditis. Endocr J. 2011;58(2):143-8. 1990;98(5):1294–6.
28. Jain U, Wallis DE, Shah K, Blakeman BM, Moran JF. Electrocardiographic J waves after resuscitation from cardiac arrest. Chest.
1990;98(5):1294-6.
29. Jenkins JK, Best TR, Nicks SA, Murphy FY, Bussel KL, Vesely DL. Milk-alkali syndrome with a serum calcium level of 22 mg/dl and J
waves on the ECG. South Med J 1987;80(11):1444–9.
30. Kamakura S, Ohe T, Nakazawa K, et al. Long-term prognosis of probands with Brugada-pattern ST-elevation in leads V1-V3. Circ Arrhythm
Electrophysiol. 2009;2(5):495-503.
31. Kannel WB, Wilson PW, D’Agostino RB, Cobb J. Sudden coronary death in women. Am Heart J 1998;136(2):205–12.
32. Kataoka H, Kajiwara H, Yano E. Psychotropic drug-associated electrocardiographic presentation of diffuse J-waves in hypothermia: case
report and literature review. Heart Vessels. 2016;31(6):996-1002.
33. Kataoka S, Serizawa N, Kitamura K, et al. An overlap of Brugada syndrome and arrhythmogenic right ventricular cardiomyopathy/dysplasia. J
Arrhythm. 2016;32(1):70-3.
34. Katoh T, Takanashi T. [J-wave in a patient with subarachnoid hemorrhage and hypothermia (author's transl)]. Kokyu To Junkan.
1980;28(1):83-6.
35. Kim SM, Hwang GS, Park JS, et al. The pattern of Tpeak-Tend and QT interval, and J wave during therapeutic hypothermia. J Electrocardiol.
2014;47(1):84-92.
36. Lévy S, Sbragia P. ECG repolarization syndrome abnormalities (J wave syndromes) and idiopathic ventricular fibrillation: diagnostic and
management. J Interv Card Electrophysiol. 2011;32(3):181-6.
37. Li GL, Yang L, Cui CC, Sun CF, Yan GX. J wave syndromes: a decade of progress. Chin Med J (Engl). 2015;128(7):969-75.
38. Lins M, Petersen B, Tiroke A, Simon R. [Reversible electrocardiographic changes in hypothermia]. Z Kardiol. 2004;93(8):630-3.
39. Marion DW, Penrod LE, Kelsey SF, et al. Treatment of traumatic brain injury with moderate hypothermia. N Engl J Med. 1997;336(8):540-6.
McIntyre WF, Pérez-Riera AR, Femenía F, Baranchuk A. Coexisting early repolarization pattern and Brugada syndrome: recognition of
potentially overlapping entities. J Electrocardiol. 2012 ;45(3):195-8.
40. Meert A, Vermeersch N, Beckers R, Hoste W, Brugada P, Hubloue I. Brugada-like ECG pattern induced by tricyclic antidepressants. Eur J
Emerg Med. 2010;17(6):325-7.
41. Mirvis DM. Evaluation of normal variations in S-T segment patterns by body surface isopotential mapping: S-T segment elevation in absence
of heart disease. Am J Cardiol. 1982;50(1):122-8.
42. Morales GX, Bodiwala K, Elayi CS. Giant J-wave (Osborn wave) unrelated to hypothermia. Europace. 2011;13(2):283.
43. Nademanee K, Veerakul G. Overlapping risks of early repolarization and Brugada syndrome. J Am Coll Cardiol. 2014;63(20):2139-40.
44. Nava A, Canciani B, Schiavinato ML, Martini B, Buja GF. La repolarisation precoce dans le precordiales droites: trouble de la conduction
intraventriculaire droite? Correlations de l’electrocardiographie-vectorcardiographie avec l’electrophysiologie. Mises Jour Cardiologiques.
1988;17:157–159.
45. Navarro-Lopez F, Cinca J, Sanz G, Periz A, Magriña J, Betriu A. Isolated T wave alternans. Am Heart J. 1978;95(3):369-74.
46. Nishida K, Fujiki A, Mizumaki K, et al. Canine model of Brugada syndrome using regional epicardial cooling of the right ventricular outflow
tract. J Cardiovasc Electrophysiol. 2004;15(8):936-41.
47. O'Connell E, Baker N, Dandamudi G, Steinhubl S. Dynamic J-Point Elevation Associated with Epileptic Hemiplegia: The Osborn Wave of
Todd's Paralysis. Case Rep Neurol. 2013;5(1):6-9.
48. Okada M. The cardiac rhythm in accidental hypothermia. J Electrocardiol. 1984;17(2):123-8.
49. Omar HR. The Osborn wave: what have we learned? Herz. 2016;41(1):48-56. Omar HR, Camporesi EM. The correlation between the
amplitude of Osborn wave and core body temperature. Eur Heart J Acute Cardiovasc Care. 2015;4(4):373-7.
50. Oreto G, Corrado D, Delise P, et al. Doubts of the cardiologist regarding an electrocardiogram presenting QRS V1-V2 complexes with positive
terminal wave and ST segment elevation. Consensus. G Ital Cardiol (Rome). 2010;11(11 Suppl 2):3S-22S.
51. Ortak J, Bonnemeier H. Cool waves: resolution of Osborn waves after prolonged hypothermia. Resuscitation. 2007;75(1):5-6.
52. Ortega-Carnicer J, Bertos-Polo J, Gutiérrez-Tirado C. Aborted sudden death, transient Brugada pattern, and wide QRS dysrrhythmias after
massive cocaine ingestion. J Electrocardiol. 2001;34(4):345-9.
53. Otero J, Lenihan DJ. The "normothermic" Osborn wave induced by severe hypercalcemia. Tex Heart Inst J. 2000;27(3):316-7.
54. Pastore CA, Samesima N, Filho HG, Madaloso BA. Controversial and similar aspects of the Brugada and J wave patterns: The
vectorcardiogram point of view-Revision 2. J Electrocardiol. 2016;49(3):439-45.
55. Patel A, Getsos JP, Moussa G, Damato AN. The Osborn wave of hypothermia in normothermic patients. Clin Cardiol. 1994;17(5):273-6.
56. Pérez MV, Friday K, Froelicher V. Semantic confusion: the case of early repolarization and the J point. Am J Med. 2012;125(9):843-4.
57. Pérez Riera AR, Antzelevitch C, Schapacknik E, Dubner S, Ferreira C. Is there an overlap between Brugada syndrome and arrhythmogenic
right ventricular cardiomyopathy/dysplasia? J Electrocardiol. 2005;38(3):260-3.
58. Pérez Riera AR. About hypothermal J wave. Kardiol Pol. 2013;71(11):1190-1.
59. Peters S. Is Brugada syndrome a variant of arrhythmogenic cardiomyopathy? Int J Cardiol. 2015;189:88-90.
60. Peters S. Early and late manifestation of Brugada syndrome ECG in arrhythmogenic cardiomyopathy. Int J Cardiol. 2016;220:260-1.
61. Reuler JB. Hypothermia: pathophysiology, clinical settings, and management. Ann Intern Med. 1978;89(4):519-27.
62. Riera AR, Ferreira C, Schapachnik E, Sanches PC, Moffa PJ. Brugada syndrome with atypical ECG: downsloping ST-segment elevation in
inferior leads. J Electrocardiol. 2004;37(2):101-4.
63. Riera AR. Correlation of levels between PRS or PQ, ST segment and TP. Cardiol J. 2008;15(2):204-5.
64. Riera AR, Uchida AH, Schapachnik E, et al. Early repolarization variant: epidemiological aspects, mechanism, and differential diagnosis.
Cardiol J. 2008;15(1):4-16.
.
.
65. Robertson KE, Martin TN, Rae AP. Brugada-pattern ECG and cardiac arrest in cocaine toxicity: reading between the white lines. Heart.
2010;96(8):643-4.
66. Rosso R, Adler A, Halkin A, Viskin S. Risk of sudden death among young individuals with J waves and early repolarization: putting the
evidence into perspective. Heart Rhythm. 2011;8(6):923-9.
67. Rosso R, Glikson E, Belhassen B, et al. Distinguishing "benign" from "malignant early repolarization": the value of the ST-segment
morphology. Heart Rhythm. 2012;9(2):225-9.
68. Sacha J, Barabach S, Feusette P, Kukla P. Vasospastic angina with J-wave pattern and polymorphic ventricular tachycardia effectively treated
with quinidine. Ann Noninvasive Electrocardiol. 2012;17(3):286-90.
69. Sentürk T, Ozbek C, Tolga D, Kazazoğlu AR. J deflections on ECG in severe hypothermia and hypokalaemia: a case report. Neth Heart J.
2013;21(2):106-8.
70. Sgobba G, Nassisi G, Giannelli F, et al. [Electrocardiographic changes in accidental hypothermia]. G Ital Cardiol. 1982;12(2):147-50.
71. Shinde R, Shinde S, Makhale C, et al. Occurrence of "J waves" in 12-lead ECG as a marker of acute ischemia and their cellular basis. Pacing
Clin Electrophysiol. 2007;30(6):817-9.
72. Sridharan MR, Horan LG. Electrocardiographic J wave of hypercalcemia. Am J Cardiol. 1984;54(6):672–3.
73. Stolp HB, Liddelow SA, Sá-Pereira I, Dziegielewska KM, Saunders NR. Immune responses at brain barriers and implications for brain
development and neurological function in later life. Front Integr Neurosci. 2013;7:61.
74. Strohmer B, Pichler M. Atrial fibrillation and prominent J (Osborn) waves in critical hypothermia. Int J Cardiol. 2004;96(2):291-3.
75. Talebi S, Pallavi R, Garofoli A, Visco F, Hassen GW. Cocaine: rare cause of Osborn wave. Acta Cardiol. 2015;70(6):739
76. Talib AK, Sato N, Kawabata N, et al. Repolarization characteristics in early repolarization and brugada syndromes: insight into an overlapping
mechanism of lethal arrhythmias. J Cardiovasc Electrophysiol. 2014;25(12):1376-84.
77. Tikkanen JT, Anttonen O, Junttila MJ, et al. Long-term outcome associated with early repolarization on electrocardiography. N Engl J
Med. 2009;361(26):2529–37.
78. Topsakal R, Sağlam H, Arinç H, Eryol NK, Cetin S. Electrocardiographic J wave as a result of hypercalcemia aggravated by thiazide diuretics
in a case of primary hyperparathyroidism. Jpn Heart J. 2003;44(6):1033-7.
79. Trushina E, McMurray CT. Oxidative stress and mitochondrial dysfunction in neurodegenerative diseases. Neuroscience. 2007;145(4):1233-
48.
80. Vassallo SU, Delaney KA, Hoffman RS, Slater W, Goldfrank LR. A prospective evaluation of the electrocardiographic manifestations of
hypothermia. Acad Emerg Med. 1999;6(11):1121-6.
81. Viskin S. Idiopathic ventricular fibrillation "Le Syndrome d'Haïssaguerre" and the fear of J waves. J Am Coll Cardiol. 2009;53(7):620-2.
82. Wang J, Tang M, Mao KX, et al. Idiopathic ventricular fibrillation with fragmented QRS complex and J wave in resting electrocardiogram. J
Geriatr Cardiol. 2012;9(2):143-7.
83. Watanabe H, Makiyama T, Koyama T, et al.. High prevalence of early repolarization in short QT syndrome. Heart Rhythm. 2010;7(5):647–52.
84. Yan GX, Antzelevitch C. Cellular basis for the electrocardiographic J wave. Circulation. 1996;93(2):372-9.
85. Yan GX, Joshi A, Guo D, Hlaing T, Martin J, Xu X, et al. Phase 2 reentry as a trigger to initiate ventricular fibrillation during early acute
myocardial ischemia. Circulation. 2004;110(9):1036–41.
86. Yan GX, Yao QH, Wang DQ, Cui CC. J wave and J wave syndromes. Chin J Card Arrhythm. 2004;8:360–5.
87. Zhu D, Luo YM, A KH, et al. Vasospastic angina with J waves formation in patients with sudden loss of consciousness. J Geriatr Cardiol.
2015;12(3):313-8.
.