Embed Size (px)
Citation preview
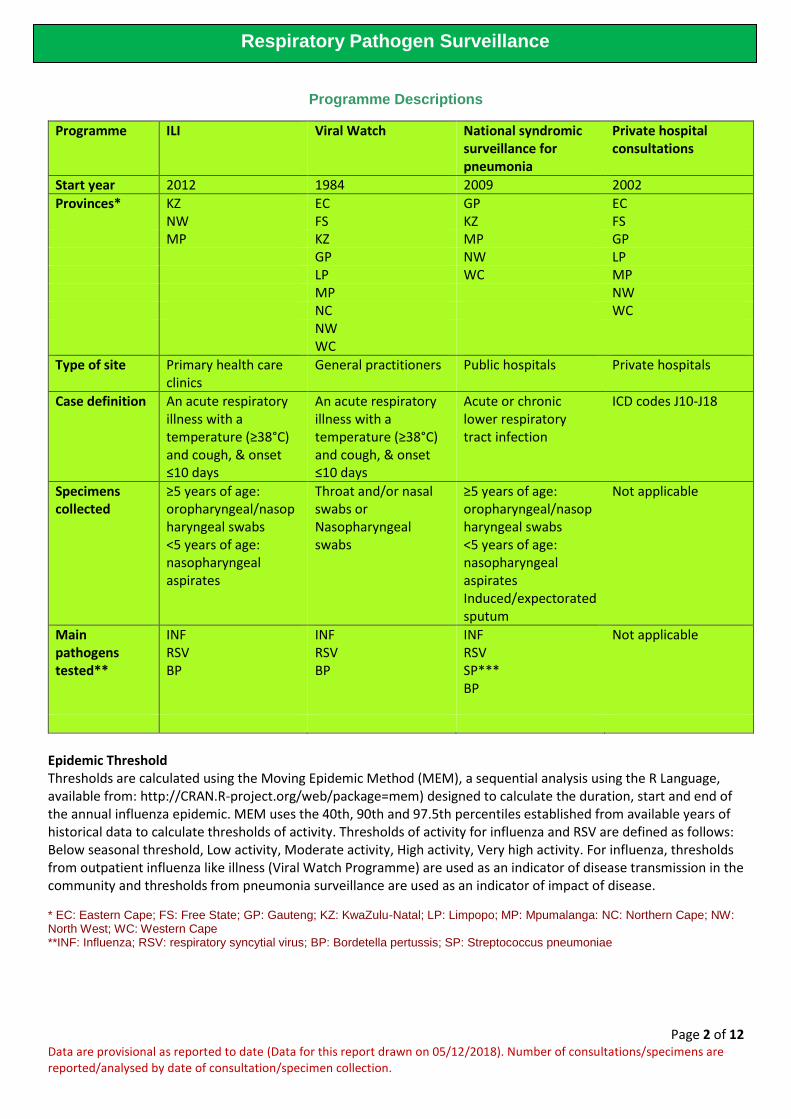
Page 2 Surveillance programme description 3 Comments Influenza-like illness (ILI) Primary health care clinics 4 Influenza 5 Respiratory syncytial virus 6 Bordetella pertussis Influenza-like illness (ILI) Viral Watch 7 Influenza National syndromic surveilance for pneumonia 8 Influenza 9 Respiratory syncytial virus 10 Streptococcus pneumoniae
11 Bordetella pertussis Private hospital respiratory consultations 12 Outpatient consultations In patient consultations
Respiratory Pathogens Surveillance Report Week 48, 2018
[Type text]
Page 2 of 12 Data are provisional as reported to date (Data for this report drawn on 05/12/2018). Number of consultations/specimens are reported/analysed by date of consultation/specimen collection.
Respiratory Pathogen Surveillance
Programme Descriptions
Programme ILI Viral Watch National syndromic surveillance for pneumonia
Private hospital consultations
Start year 2012 1984 2009 2002
Provinces* KZ EC GP EC NW FS KZ FS MP KZ MP GP GP NW LP LP WC MP MP NW NC WC NW WC
Type of site Primary health care clinics
General practitioners Public hospitals Private hospitals
Case definition An acute respiratory illness with a temperature (≥38°C) and cough, & onset ≤10 days
An acute respiratory illness with a temperature (≥38°C) and cough, & onset ≤10 days
Acute or chronic lower respiratory tract infection
ICD codes J10-J18
Specimens collected
≥5 years of age: oropharyngeal/nasopharyngeal swabs <5 years of age: nasopharyngeal aspirates
Throat and/or nasal swabs or Nasopharyngeal swabs
≥5 years of age: oropharyngeal/nasopharyngeal swabs <5 years of age: nasopharyngeal aspirates Induced/expectorated sputum
Not applicable
Main pathogens tested**
INF RSV BP
INF RSV BP
INF RSV SP*** BP
Not applicable
Epidemic Threshold Thresholds are calculated using the Moving Epidemic Method (MEM), a sequential analysis using the R Language, available from: http://CRAN.R-project.org/web/package=mem) designed to calculate the duration, start and end of the annual influenza epidemic. MEM uses the 40th, 90th and 97.5th percentiles established from available years of historical data to calculate thresholds of activity. Thresholds of activity for influenza and RSV are defined as follows: Below seasonal threshold, Low activity, Moderate activity, High activity, Very high activity. For influenza, thresholds from outpatient influenza like illness (Viral Watch Programme) are used as an indicator of disease transmission in the community and thresholds from pneumonia surveillance are used as an indicator of impact of disease. * EC: Eastern Cape; FS: Free State; GP: Gauteng; KZ: KwaZulu-Natal; LP: Limpopo; MP: Mpumalanga: NC: Northern Cape; NW: North West; WC: Western Cape **INF: Influenza; RSV: respiratory syncytial virus; BP: Bordetella pertussis; SP: Streptococcus pneumoniae
[Type text]
Page 3 of 12 Data are provisional as reported to date (Data for this report drawn on 05/12/2018). Number of consultations/specimens are reported/analysed by date of consultation/specimen collection.
Respiratory Pathogen Surveillance
Reporting period 01/01/2018 to 02/12/2018 Results until end of epidemiologic week 48 (2018) Comments:
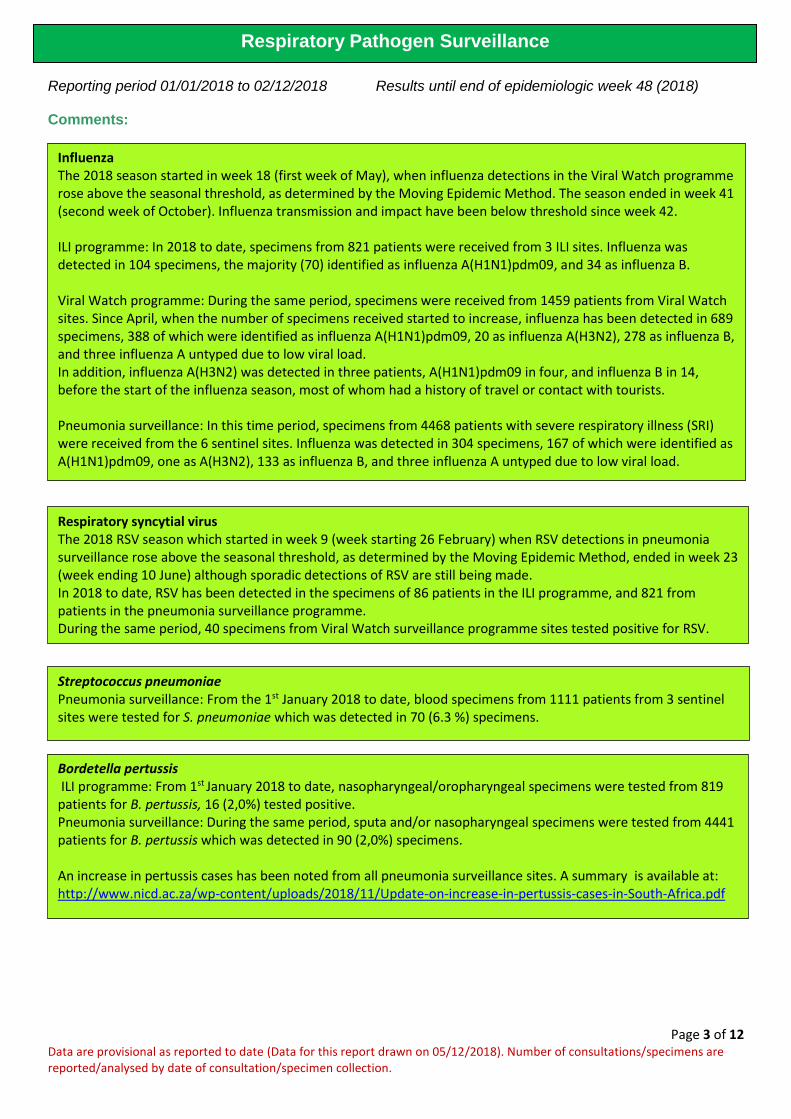
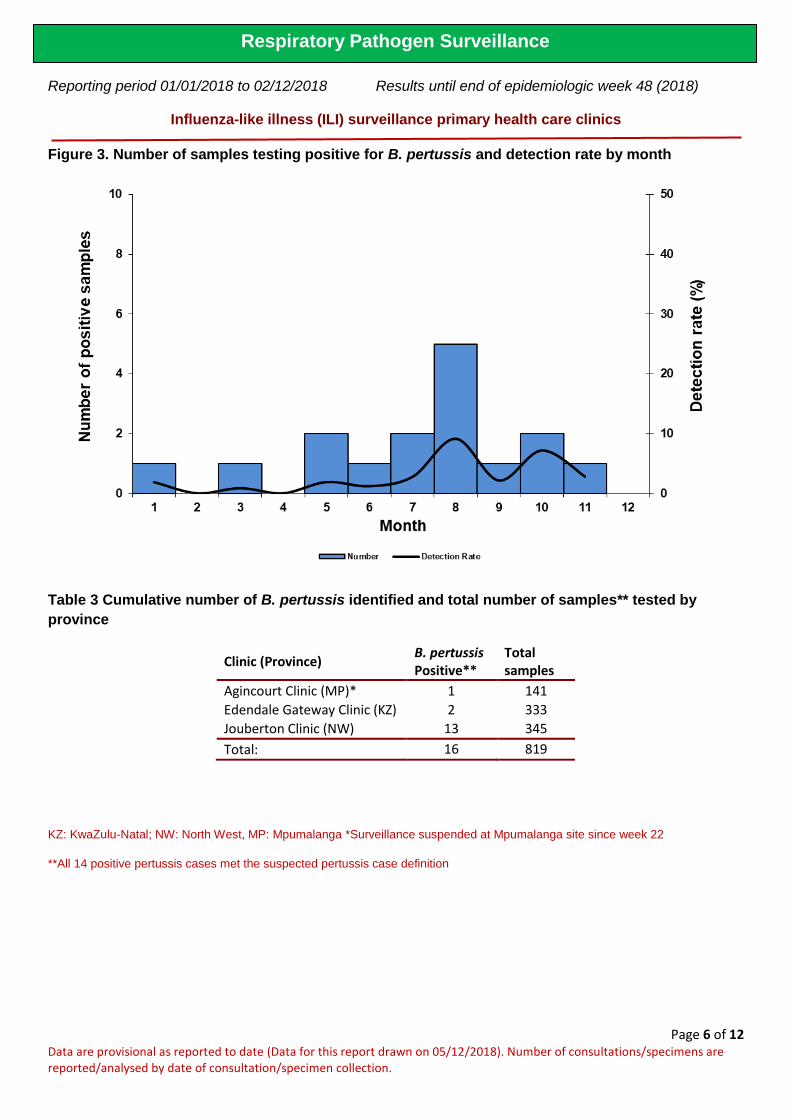
Influenza The 2018 season started in week 18 (first week of May), when influenza detections in the Viral Watch programme rose above the seasonal threshold, as determined by the Moving Epidemic Method. The season ended in week 41 (second week of October). Influenza transmission and impact have been below threshold since week 42. ILI programme: In 2018 to date, specimens from 821 patients were received from 3 ILI sites. Influenza was detected in 104 specimens, the majority (70) identified as influenza A(H1N1)pdm09, and 34 as influenza B. Viral Watch programme: During the same period, specimens were received from 1459 patients from Viral Watch sites. Since April, when the number of specimens received started to increase, influenza has been detected in 689 specimens, 388 of which were identified as influenza A(H1N1)pdm09, 20 as influenza A(H3N2), 278 as influenza B, and three influenza A untyped due to low viral load. In addition, influenza A(H3N2) was detected in three patients, A(H1N1)pdm09 in four, and influenza B in 14, before the start of the influenza season, most of whom had a history of travel or contact with tourists. Pneumonia surveillance: In this time period, specimens from 4468 patients with severe respiratory illness (SRI) were received from the 6 sentinel sites. Influenza was detected in 304 specimens, 167 of which were identified as A(H1N1)pdm09, one as A(H3N2), 133 as influenza B, and three influenza A untyped due to low viral load.
Respiratory syncytial virus The 2018 RSV season which started in week 9 (week starting 26 February) when RSV detections in pneumonia surveillance rose above the seasonal threshold, as determined by the Moving Epidemic Method, ended in week 23 (week ending 10 June) although sporadic detections of RSV are still being made. In 2018 to date, RSV has been detected in the specimens of 86 patients in the ILI programme, and 821 from patients in the pneumonia surveillance programme. During the same period, 40 specimens from Viral Watch surveillance programme sites tested positive for RSV.
Bordetella pertussis ILI programme: From 1st
January 2018 to date, nasopharyngeal/oropharyngeal specimens were tested from 819 patients for B. pertussis, 16 (2,0%) tested positive. Pneumonia surveillance: During the same period, sputa and/or nasopharyngeal specimens were tested from 4441 patients for B. pertussis which was detected in 90 (2,0%) specimens. An increase in pertussis cases has been noted from all pneumonia surveillance sites. A summary is available at: http://www.nicd.ac.za/wp-content/uploads/2018/11/Update-on-increase-in-pertussis-cases-in-South-Africa.pdf
Streptococcus pneumoniae Pneumonia surveillance: From the 1st January 2018 to date, blood specimens from 1111 patients from 3 sentinel sites were tested for S. pneumoniae which was detected in 70 (6.3 %) specimens.
[Type text]
Page 4 of 12 Data are provisional as reported to date (Data for this report drawn on 05/12/2018). Number of consultations/specimens are reported/analysed by date of consultation/specimen collection.
Respiratory Pathogen Surveillance
Reporting period 01/01/2018 to 02/12/2018 Results until end of epidemiologic week 48 (2018)
Influenza-like illness (ILI) surveillance primary health care clinics
Figure 1. Number of positive samples* by influenza types and subtypes and detection rate** by week
*Specimens from patients with influenza-like illnesses at 3 sentinel sites in 3 provinces from week 1 – week 21 and from 2 sites in 2 provinces from week 22 (surveillance in Mpumalanga suspended since week 22). **Only reported for weeks with >10 specimens submitted
Table 1. Cumulative number of influenza type and subtype and total number of samples tested by clinic and
province
Clinic (Province) A not
typed as yet
A(H1N1)pdm09 A(H3N2) B Total
samples
Agincourt Clinic (MP)* 3 141
Edendale Gateway Clinic (KZ) 40 14 334
Jouberton Clinic (NW) 27 20 346
Total: 70 34 821
KZ: KwaZulu-Natal; NW: North West, MP: Mpumalanga *Surveillance suspended at Mpumalanga site since week 22

[Type text]
Page 5 of 12 Data are provisional as reported to date (Data for this report drawn on 05/12/2018). Number of consultations/specimens are reported/analysed by date of consultation/specimen collection.
Respiratory Pathogen Surveillance
Reporting period 01/01/2018 to 02/12/2018 Results until end of epidemiologic week 48 (2018)
Influenza-like illness (ILI) surveillance primary health care clinics
Figure 2. Number of samples testing positive for respiratory syncytial virus and detection rate by week
Table 2. Cumulative number of respiratory syncytial virus identified and total number of samples tested by
clinic and province
Clinic (Province) RSV Positive Total
samples
Agincourt Clinic (MP)* 38 141 Edendale Gateway Clinic (KZ) 26 334
Jouberton Clinic (NW) 22 346
Total: 86 821
KZ: KwaZulu-Natal; NW: North West, MP: Mpumalanga *Surveillance suspended at Mpumalanga site since week 22
[Type text]
Page 6 of 12 Data are provisional as reported to date (Data for this report drawn on 05/12/2018). Number of consultations/specimens are reported/analysed by date of consultation/specimen collection.
Respiratory Pathogen Surveillance
Reporting period 01/01/2018 to 02/12/2018 Results until end of epidemiologic week 48 (2018)
Influenza-like illness (ILI) surveillance primary health care clinics
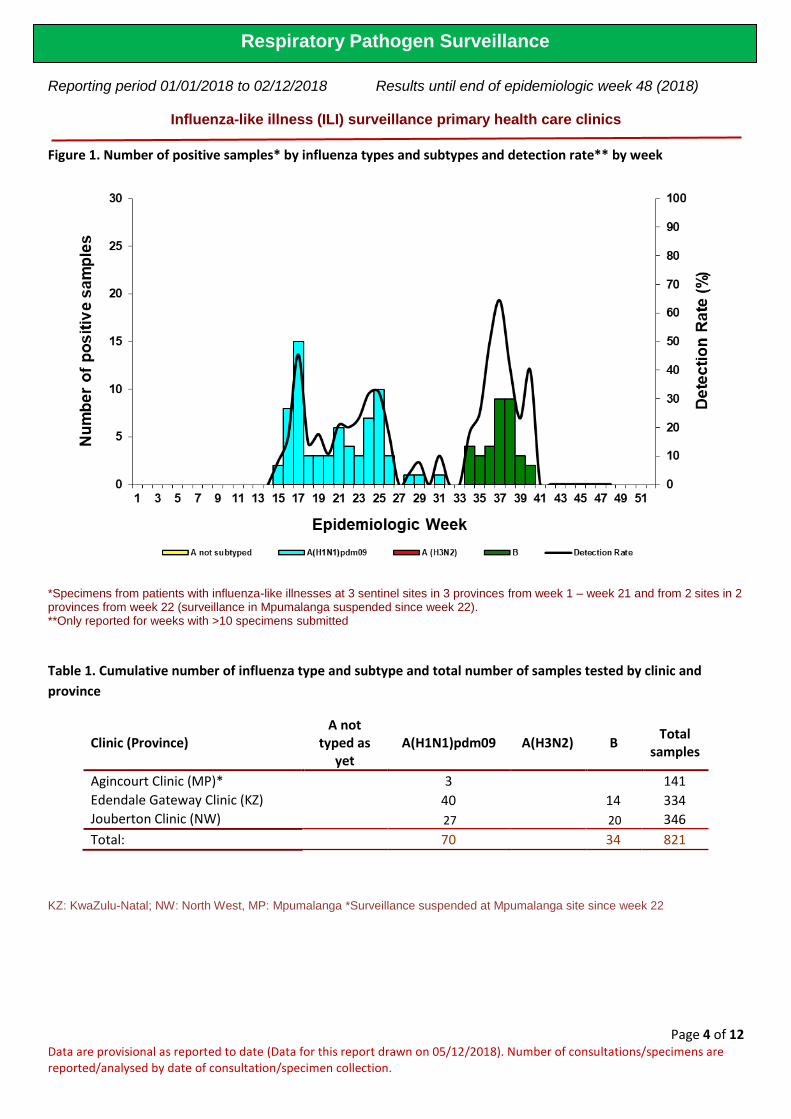
Figure 3. Number of samples testing positive for B. pertussis and detection rate by month
Table 3 Cumulative number of B. pertussis identified and total number of samples** tested by
province
Clinic (Province) B. pertussis Positive**
Total samples
Agincourt Clinic (MP)* 1 141
Edendale Gateway Clinic (KZ) 2 333
Jouberton Clinic (NW) 13 345
Total: 16 819
KZ: KwaZulu-Natal; NW: North West, MP: Mpumalanga *Surveillance suspended at Mpumalanga site since week 22
**All 14 positive pertussis cases met the suspected pertussis case definition
[Type text]
Page 7 of 12 Data are provisional as reported to date (Data for this report drawn on 05/12/2018). Number of consultations/specimens are reported/analysed by date of consultation/specimen collection.
Respiratory Pathogen Surveillance
Reporting period 01/01/2018 to 02/12/2018 Results until end of epidemiologic week 48 (2018)
Influenza-like illness (ILI) surveillance Viral Watch
Figure 4. Number of positive samples* by influenza types and subtypes and detection rate** by
week
*Specimens from patients with Influenza-like illnesses at 90 sentinel sites in 8 provinces ** Only reported for weeks with >10 specimens submitted.
Table 4. Cumulative number of influenza type and subtype and total number of samples tested
by province
Province A not subtyped A(H1N1)pdm09 A(H3N2) B Total
samples
Eastern Cape 1 52 31 131
Free State 1 15
Gauteng 1 199 17 89 692
Limpopo 15 8 38
Mpumalanga 1 20 11 83
North West 1 2 6
Northern Cape 3 1 17
Western Cape 98 3 135 477
Total: 3 388 20 278 1459
From 01 January 2018 to date, 126 patients were tested for influenza at the time of entry into South Africa following travel abroad and 35 tested influenza positive - 17 of which were identified as influenza A(H1N1)pdm09, 07 as influenza A(H3N2) and 11 as influenza B. Patients known to have acquired influenza abroad are not included in the table or epidemiological curve.

[Type text]
Page 8 of 12 Data are provisional as reported to date (Data for this report drawn on 05/12/2018). Number of consultations/specimens are reported/analysed by date of consultation/specimen collection.
Respiratory Pathogen Surveillance
Reporting period 01/01/2018 to 02/12/2018 Results until end of epidemiologic week 48 (2018)
National syndromic surveillance for pneumonia
Figure 6. Number of positive samples* by influenza types and A not typed as yet and detection rate** by week
*Specimens from patients hospitalised with pneumonia at 6 sentinel sites in 5 provinces **Only reported for weeks with >10 specimens submitted
Table 5. Cumulative number of identified influenza types and subtypes and total number of samples tested
by hospital
Hospital (Province) A not
typed as yet
A(H1N1)pdm09 A(H3N2) B Total
samples
Edendale (KZ) 1 28 11 681
Helen Joseph-Rahima Moosa (GP) 40 1 27 969
Klerksdorp-Tshepong (NW) 13 19 656
Mapulaneng-Matikwana (MP) 25 17 300
Red Cross (WC) 2 37 36 1242
Mitchell’s Plain (WC) 24 23 620
Total: 3 167 133 4468
GP: Gauteng; KZ: KwaZulu-Natal; NW: North West; MP: Mpumalanga; WC: Western Cape
In addition 98 specimens have been tested from pregnant women in Groote Schuur Hospital and
Mowbray Maternity Hospital, two of whom were positive for influenza A(H1N1)pdm09.

[Type text]
Page 9 of 12 Data are provisional as reported to date (Data for this report drawn on 05/12/2018). Number of consultations/specimens are reported/analysed by date of consultation/specimen collection.
Respiratory Pathogen Surveillance
Reporting period 01/01/2018 to 02/12/2018 Results until end of epidemiologic week 48 (2018)
National syndromic surveillance for pneumonia
Figure 8. Number of samples testing positive for respiratory syncytial virus and detection rate by week
Table 6: Cumulative number of respiratory syncytial virus identified and total number of samples tested by
hospital
Hospital (Province) RSV
Positive Total samples
Edendale (KZ) 81 681
Helen Joseph-Rahima Moosa (GP) 164 969
Klerksdorp-Tshepong (NW) 41 656
Mapulaneng-Matikwana (MP) 46 300
Red Cross (WC) 344 1242
Mitchell’s Plain (WC) 145 620
Total: 821 4468
GP: Gauteng; KZ: KwaZulu-Natal; NW: North West; MP: Mpumalanga; WC: Western Cape

[Type text]
Page 10 of 12 Data are provisional as reported to date (Data for this report drawn on 05/12/2018). Number of consultations/specimens are reported/analysed by date of consultation/specimen collection.
Respiratory Pathogen Surveillance
Reporting period 01/01/2018 to 02/12/2018 Results until end of epidemiologic week 48 (2018)
National syndromic surveillance for pneumonia
Figure 9. Number of samples testing positive for S. pneumoniae* and detection rate by week
Table 7. Cumulative number of S. pneumoniae identified and total number of samples tested by
hospital and province
Hospital (Province) S. pneumoniae
Positive Total
samples
Edendale (KZ) 6 155
Klerksdorp-Tshepong (NW) 39 656
Mapulaneng-Matikwana (MP) 25 300
Total: 70 1111
KZ: KwaZulu-Natal; NW: North West; MP: Mpumalanga;
* Children <1 year tested at KZ and all age groups tested at MP and NW

[Type text]
Page 11 of 12 Data are provisional as reported to date (Data for this report drawn on 05/12/2018). Number of consultations/specimens are reported/analysed by date of consultation/specimen collection.
Respiratory Pathogen Surveillance
Reporting period 01/01/2018 to 02/12/2018 Results until end of epidemiologic week 48 (2018)
National syndromic surveillance for pneumonia
Figure 10. Number of samples testing positive for B. pertussis and detection rate by month
Table 9. Cumulative number of B. pertussis identified and total number of samples tested by
hospital and province
Hospital (Province) B. pertussis Positive**
Total samples
Edendale (KZ) 7 673
Helen Joseph-Rahima Moosa (GP) 18 964
Klerksdorp-Tshepong (NW) 18 656
Mapulaneng-Matikwana (MP) 5 298
Red Cross (WC) 31 1234
Mitchell’s Plain (WC) 11 616
Total: 90 4441
GP: Gauteng; KZ: KwaZulu-Natal; NW: North West; MP: Mpumalanga; WC: Western Cape
**All 75 positive pertussis cases met the suspected pertussis case definition
[Type text]
Page 12 of 12 Data are provisional as reported to date (Data for this report drawn on 05/12/2018). Number of consultations/specimens are reported/analysed by date of consultation/specimen collection.
Respiratory Pathogen Surveillance
Reporting period 01/01/2018 to 21/10/2018 Results until end of epidemiologic week 42 (2018)
Private hospital consultations
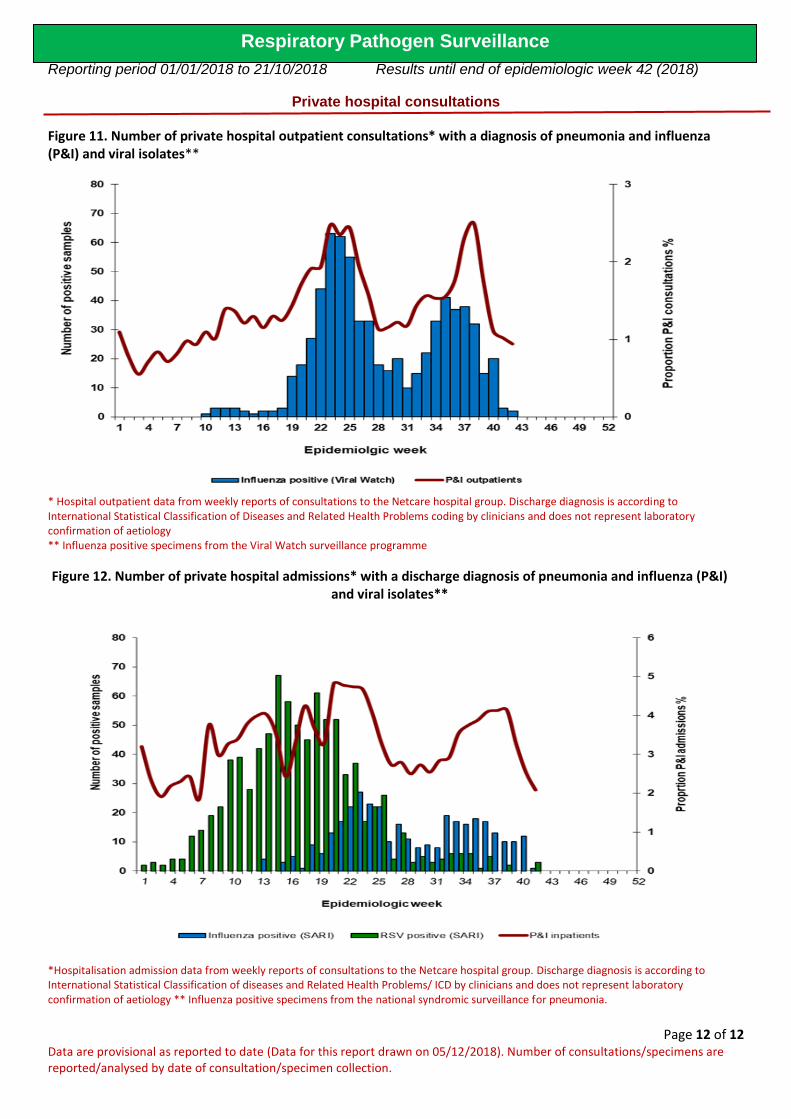
Figure 11. Number of private hospital outpatient consultations* with a diagnosis of pneumonia and influenza (P&I) and viral isolates**
* Hospital outpatient data from weekly reports of consultations to the Netcare hospital group. Discharge diagnosis is according to International Statistical Classification of Diseases and Related Health Problems coding by clinicians and does not represent laboratory confirmation of aetiology ** Influenza positive specimens from the Viral Watch surveillance programme
Figure 12. Number of private hospital admissions* with a discharge diagnosis of pneumonia and influenza (P&I) and viral isolates**
*Hospitalisation admission data from weekly reports of consultations to the Netcare hospital group. Discharge diagnosis is according to International Statistical Classification of diseases and Related Health Problems/ ICD by clinicians and does not represent laboratory confirmation of aetiology ** Influenza positive specimens from the national syndromic surveillance for pneumonia.


![wc EME žäC&ff DAIOU ILLUST MAP (77? wc wc wc ÞY5 260 260 ... · DAIOU ILLUST MAP (77? wc wc wc ÞY5 260 260 wc (DÎIÉ] 167 wc 9155} 7—Jb wc -k ;knlc 220km 61 km 55B R 167 45](https://img.pdfslide.net/doc/110x75/5f097c067e708231d4270c2d/wc-eme-cff-daiou-illust-map-77-wc-wc-wc-y5-260-260-daiou-illust.jpg)