Embed Size (px)
Citation preview
RESPONDING TO TURMOIL INNATURAL GAS MARKETS:
THE CONSUMER CASE FOR AGGRESSIVEPOLICIES TO BALANCE SUPPLY AND DEMAND
DR. MARK N. COOPERDIRECTOR OF RESEARCH
DECEMBER 2004
Contents
EXECUTIVE SUMMARY ................................................................................. i
I. NATURAL GAS DEMANDS IMMEDIATE POLICY ATTENTION ...... 1
THE IMPORTANCE OF NATURAL GAS FOR RESIDENTIAL CONSUMERS ...................... 1INDIRECT IMPACTS OF RISING NATURAL GAS PRICES .............................................. 3THE PRICE SHOCK ................................................................................................. 5PURPOSE AND OUTLINE OF THE PAPER .................................................................... 7
II. UNCERTAINTIES ABOUT NATURAL GAS MARKETS ...................... 9
CHANGING VIEWS OF NATURAL GAS MARKET FUNDAMENTALS ............................... 9CONSUMPTION AND THE ELASTICITY OF DEMAND ................................................... 10UNCERTAINTY ABOUT SCARCITY ............................................................................ 13PRICE VOLATILITY AND STOCKPILES ..................................................................... 16
III. THE URGENT NEED FOR AGGRESSIVE POLICY ......................... 19
DEMAND ............................................................................................................... 19SUPPLY ................................................................................................................. 19FILLING THE GAP ................................................................................................. 20CONCLUSION ........................................................................................................ 21
IV. POLICY FRAMEWORK ......................................................................... 23
COMPREHENSIVE SOLUTIONS MUST REFLECT THE COMPLEXITY
OF THE PROBLEM ............................................................................................ 23POLICY EVALUATION CRITERIA............................................................................. 25Economics ............................................................................................................................... 26Environment ........................................................................................................................... 26Security ................................................................................................................................... 26
V. FIRST STEPS IN A CONSUMER FRIENDLY APPROACHTO NATURAL GAS .................................................................................... 27
REDUCING TURMOIL ............................................................................................. 28Transparency.......................................................................................................................... 28Storage .................................................................................................................................... 28DEMAND REDUCTION ............................................................................................ 28Efficiency ................................................................................................................................ 28Fuel Switching ........................................................................................................................ 29ALTERNATIVE SOURCES OF SUPPLY ....................................................................... 29Coal Gasification ................................................................................................................... 29Alaskan Gas ........................................................................................................................... 30Imports of Liquefied Natural Gas ........................................................................................ 30TRADITIONAL SOURCES OF GAS ............................................................................ 30Undiscovered Resources ........................................................................................................ 30Sensitive Areas ....................................................................................................................... 31
ENDNOTES ...................................................................................................... 32
APPENDIX: GRAPHICAL PRESENTATION OF NATURAL GASMARKET EQUILIBRIUM ........................................................................ 37
i
RESPONDING TO TURMOIL IN NATURAL GAS MARKETS:THE CONSUMER CASE FOR AGGRESSIVE POLICIES
TO BALANCE SUPPLY AND DEMAND
EXECUTIVE SUMMARY
THE IMPACT OF RISING NATURAL GAS PRICES
For the past two years the average wellhead price of natural gas has been about twiceas high as it was throughout the 1990s. As a result, the Department of Energy projects that theaverage winter heating bill for a natural gas household will top $1,000 for the first timein U.S. history. Low income households that heat with natural gas will be especially hard hit,as their total natural gas bill will take almost ten percent of their income this year.
The impact of natural gas prices on households and the economy can be felt in morethan direct expenditures for heat and hot water. Electricity prices are strongly affected bynatural gas prices because for about a decade natural gas has been the overwhelming fuel ofchoice for new electricity generation. Natural gas prices are passed through to consumers inthe form of purchased gas adjustment clauses. Moreover, in many deregulated electricitymarkets the most expensive source of electricity sets the price for other sources of power.Natural gas price increases also flow through in the price of commercial services andindustrial goods in varying degrees.
THE PRICE SHOCK
The price increases and extreme volatility have taken policymakers by surprise. In1999 both the Energy Information Administration (EIA) and the National Petroleum Council(NPC) were quite optimistic about the prospects for domestic U.S. production of natural gas.At prices that are substantially below current levels, the NPC concluded that “sufficientresources exist to meet growing demand well into the 21st century.” Five years later, and inspite of the fact that “for almost 4 years, natural gas prices have remained at levelssubstantially higher than those of the 1990s,” the EIA projected “dependence on more costlysupplies of natural gas.”
ii
THE COMPLEX CHALLENGE OF NATURAL GAS MARKETS
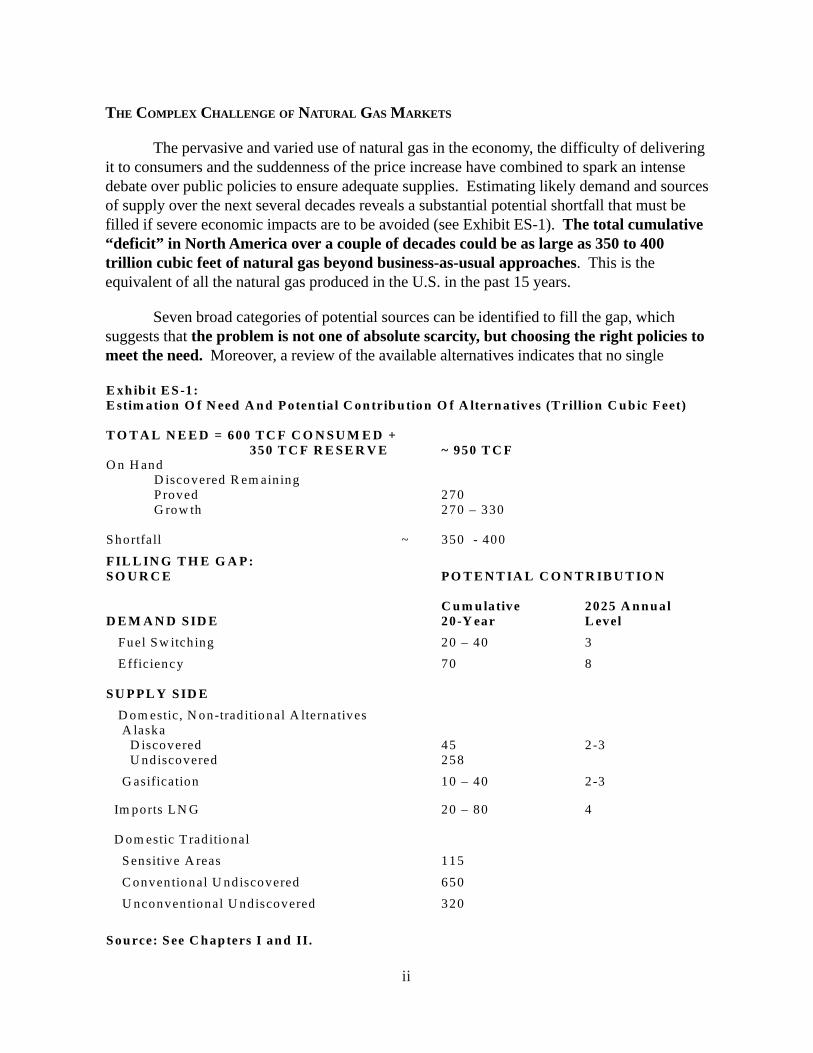
The pervasive and varied use of natural gas in the economy, the difficulty of deliveringit to consumers and the suddenness of the price increase have combined to spark an intensedebate over public policies to ensure adequate supplies. Estimating likely demand and sourcesof supply over the next several decades reveals a substantial potential shortfall that must befilled if severe economic impacts are to be avoided (see Exhibit ES-1). The total cumulative“deficit” in North America over a couple of decades could be as large as 350 to 400trillion cubic feet of natural gas beyond business-as-usual approaches. This is theequivalent of all the natural gas produced in the U.S. in the past 15 years.
Seven broad categories of potential sources can be identified to fill the gap, whichsuggests that the problem is not one of absolute scarcity, but choosing the right policies tomeet the need. Moreover, a review of the available alternatives indicates that no single
E xh ib it E S -1: E stim ation O f N eed A n d P oten tia l C on trib u tio n O f A ltern atives (T rillion C u b ic F eet) T O T A L N E E D = 600 T C F C O N S U M E D + 350 T C F R E S E R V E ~ 950 T C F O n H and D iscovered R em ain ing
P roved 270 G row th 270 – 330 S hortfall ~ 350 - 400
F IL L IN G T H E G A P : S O U R C E P O T E N T IA L C O N T R IB U T IO N C u m u lative 2025 A n n u al D E M A N D S ID E 20-Y ear L evel Fuel S w itch ing 20 – 40 3
E fficiency 70 8 S U P P L Y S ID E D om estic , N on-trad itio nal A lternatives A laska D iscovered 45 2 -3 U ndiscovered 258
G asification 10 – 40 2 -3
Im ports L N G 20 – 80 4 D om estic T rad itional
S ensitive A reas 115
C onventional U ndiscovered 650
U nconventional U ndiscovered 320
S ou rce: S ee C h ap ters I an d II.
iii
option can do the job. Multiple approaches must be followed. To evaluate the options, weestablish a comprehensive framework that considers when and how policies affect the naturalgas market.
POLICY FRAMEWORK
The objective of public policy should be to ensure a reliable supply of natural gasthat is delivered in an efficient and equitable manner at affordable prices. Balance iscritical to meet the needs of producers and consumers of natural gas both as a fuel andindustrial input, as well as the needs of the environment.
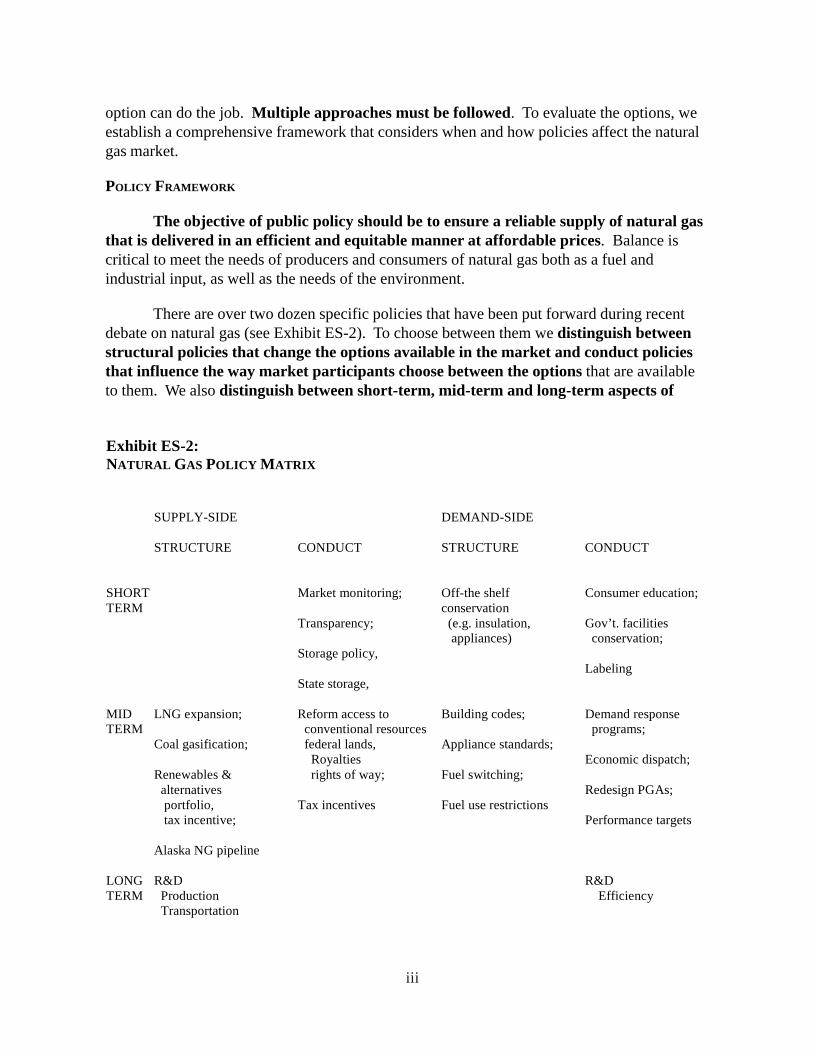
There are over two dozen specific policies that have been put forward during recentdebate on natural gas (see Exhibit ES-2). To choose between them we distinguish betweenstructural policies that change the options available in the market and conduct policiesthat influence the way market participants choose between the options that are availableto them. We also distinguish between short-term, mid-term and long-term aspects of
Exhibit ES-2: NATURAL GAS POLICY MATRIX SUPPLY-SIDE DEMAND-SIDE STRUCTURE CONDUCT STRUCTURE CONDUCT SHORT Market monitoring; Off-the shelf Consumer education; TERM conservation
Transparency; (e.g. insulation, Gov’t. facilities appliances) conservation;
Storage policy, Labeling
State storage, MID LNG expansion; Reform access to Building codes; Demand response TERM conventional resources programs;
Coal gasification; federal lands, Appliance standards; Royalties Economic dispatch;
Renewables & rights of way; Fuel switching; alternatives Redesign PGAs;
portfolio, Tax incentives Fuel use restrictions tax incentive; Performance targets
Alaska NG pipeline LONG R&D R&D TERM Production Efficiency Transportation
iv
policies. While this establishes the framework for policy choice, it does not give us thecriteria by which to evaluate specific options. We propose three broad categories of criteria bywhich to evaluate alternatives.
Economics includes both the basic benefit/cost of each option and the impact of theoption on the market structure. We prefer policies that meet the need for energy at the lowestcost. We prefer policies that increase the supply and demand elasticities in the market orbring new sources and actors to the market to promote competition, since this not onlylowers price but also dampens price volatility.
Environmental concerns are extremely important because energy production andconsumption involve major externalities – costs that are not easily reflected in markettransactions. Production and transportation of natural gas has environmental impacts, asdoes consumption. But natural gas is by far the cleanest of the fossil fuels.
Security of supply has traditionally focused on the operation of facilities to preventaccidents. Under current conditions, however, vulnerability to intentional acts of sabotagemust be considered. Moreover, because international energy markets are dominated by cartelsand producers with market power, any policy that relies on foreign resources of natural gasmust also be assessed in terms of the dependability of supply.
FIRST STEPS
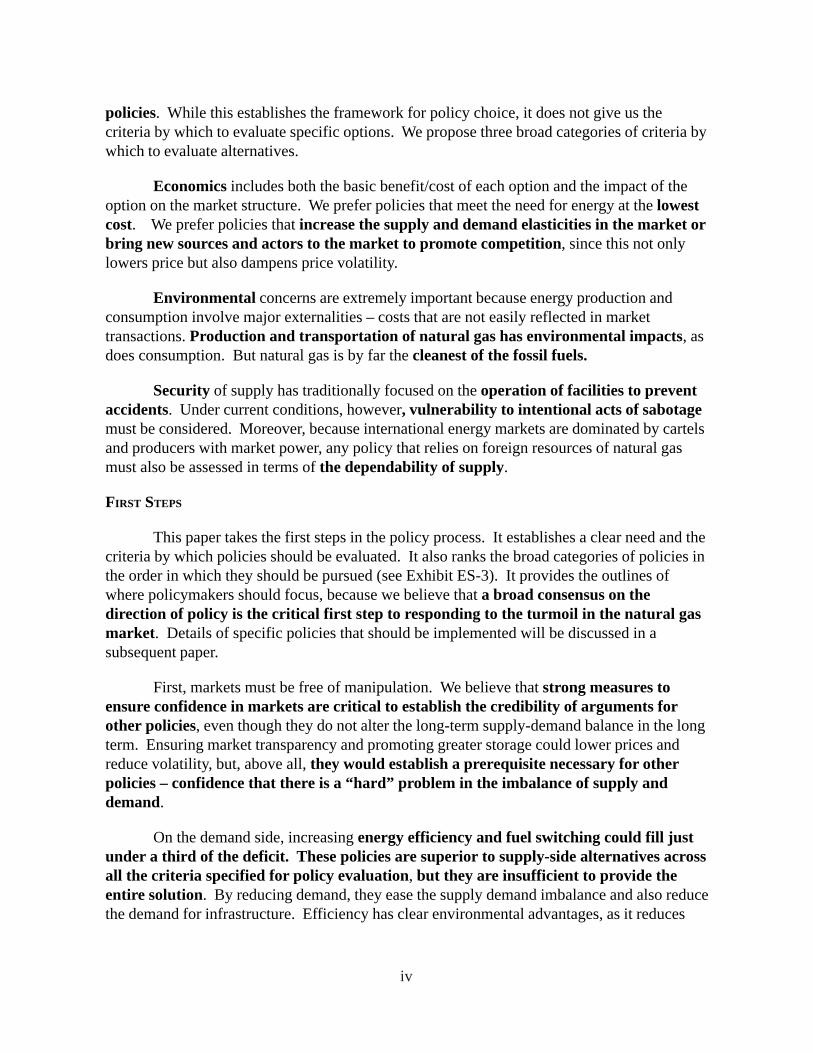
This paper takes the first steps in the policy process. It establishes a clear need and thecriteria by which policies should be evaluated. It also ranks the broad categories of policies inthe order in which they should be pursued (see Exhibit ES-3). It provides the outlines ofwhere policymakers should focus, because we believe that a broad consensus on thedirection of policy is the critical first step to responding to the turmoil in the natural gasmarket. Details of specific policies that should be implemented will be discussed in asubsequent paper.
First, markets must be free of manipulation. We believe that strong measures toensure confidence in markets are critical to establish the credibility of arguments forother policies, even though they do not alter the long-term supply-demand balance in the longterm. Ensuring market transparency and promoting greater storage could lower prices andreduce volatility, but, above all, they would establish a prerequisite necessary for otherpolicies – confidence that there is a “hard” problem in the imbalance of supply anddemand.
On the demand side, increasing energy efficiency and fuel switching could fill justunder a third of the deficit. These policies are superior to supply-side alternatives acrossall the criteria specified for policy evaluation, but they are insufficient to provide theentire solution. By reducing demand, they ease the supply demand imbalance and also reducethe demand for infrastructure. Efficiency has clear environmental advantages, as it reduces
v
Exhibit ES-3: Evaluation of Policy Alternatives SOURCE ECONOMIC ENVIRONMENT SECURITY OF SUPPLY Cost/ Market Volat- Facility Air Reli- Depend Vulner- Benefit Structure ility Footprint ability ability ability Reducing Turmoil Transparency + + Storage + + + + + Demand Reduction Efficiency + + + + + + + + Switching + + + + + + Alternative Domestic Suppy Gasification + + - + Alaska - + - - Imports LNG - - - Traditional Domestic Supply Sensitive Areas + - Undiscovered - - -
both production and consumption external effects. Fuel switching may increase externalitiesassociated with consumption, as it entails burning dirtier fuels.
Supply-side alternatives that rely on domestic resources, but not the traditionaldomestic natural gas resource base, are also attractive, since the domestic resource base isdeclining and has proven to be unreliable. Coal gasification is commercially proven, but inits infancy. It could expand for use in electricity generation in the mid-term and other uses inthe longer term. Coal gasification has the advantage of relying on a domestic resource that isvirtually inexhaustible. It might lower the need for widespread natural gas infrastructure,since it would be located at the sites where the output of gasified coal is consumed. It wouldrequire coal production and transportation facilities.
The Alaska natural gas pipeline appears to be under active development, with thestate of Alaska becoming more active. This is a substantial resource, not presently beingused.
vi
TOUGH SUPPLY-SIDE CHOICES
These policies would fill about half the projected shortfall in natural gas supplies. Thiswould go a long way toward alleviating the pressure on the domestic base, but tough supply-side choices would remain.
Imports: Liquefied natural gas currently accounts for about two percent ofconsumption, but it is much more widely used on a global scale. Unfortunately, LNG islikely to depend on foreign sources that are controlled by members of the OPEC cartelor suppliers with market power. It also does not have environmental or security advantages.LNG will expand its role because of the cost of domestic resources, but because it offers littleunique improvement, it does not deserve special policy attention.
Traditional Sources: With efficiency and these non-traditional domestic sourcesenhanced, production from the traditional domestic resource base, conventional andunconventional on-shore and offshore, would have to remain at roughly the currentlevels to fill the remaining gap. Undiscovered resources represent a very large potential, but,by the industry accounts, they are one source of the current problem, since they have provedless predictable and more costly than anticipated.
We rank drilling in sensitive areas lowest in priority because it represents, at best, beconsidered to address the mid-term term transition to other sources that may have potentiallylarge environmental costs. Resources in environmentally sensitive areas are probably muchmore certain and lower in cost, but there are no guarantees they will restrain price increasesbecause the same companies that control reserves today will do so in these areas.
1
I. NATURAL GAS DEMANDS IMMEDIATE POLICY ATTENTION
THE IMPORTANCE OF NATURAL GAS FOR RESIDENTIAL CONSUMERS
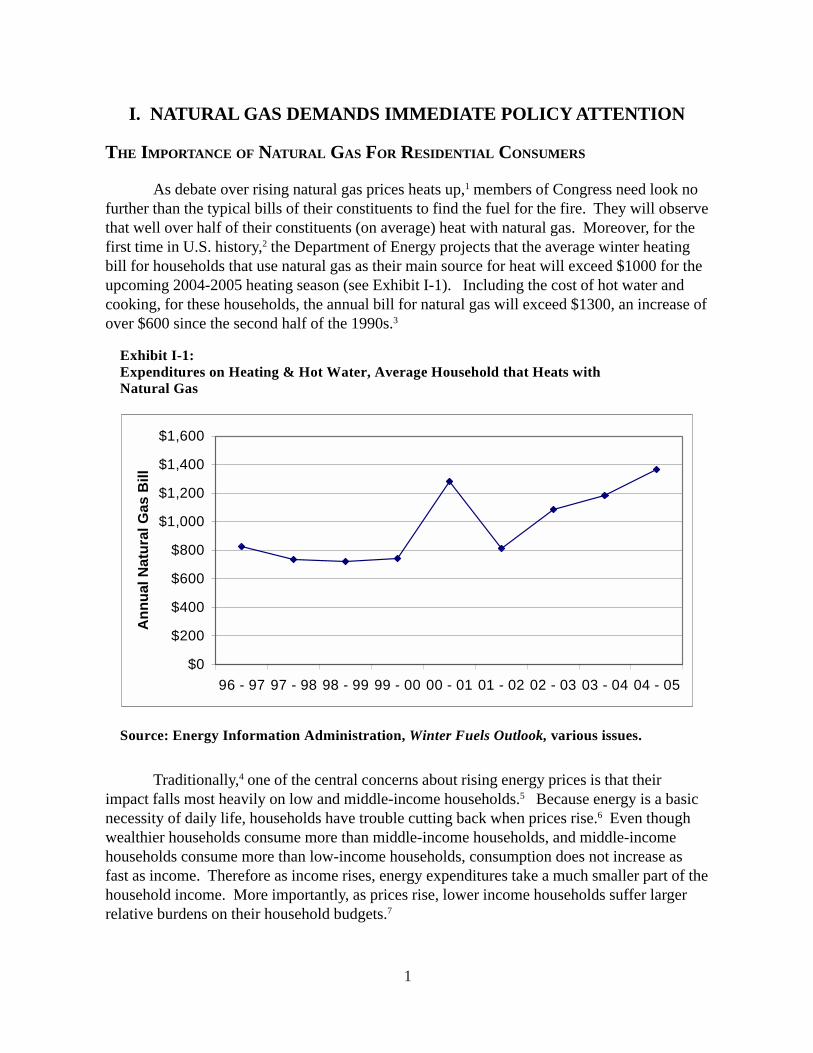
As debate over rising natural gas prices heats up,1 members of Congress need look nofurther than the typical bills of their constituents to find the fuel for the fire. They will observethat well over half of their constituents (on average) heat with natural gas. Moreover, for thefirst time in U.S. history,2 the Department of Energy projects that the average winter heatingbill for households that use natural gas as their main source for heat will exceed $1000 for theupcoming 2004-2005 heating season (see Exhibit I-1). Including the cost of hot water andcooking, for these households, the annual bill for natural gas will exceed $1300, an increase ofover $600 since the second half of the 1990s.3
Traditionally,4 one of the central concerns about rising energy prices is that theirimpact falls most heavily on low and middle-income households.5 Because energy is a basicnecessity of daily life, households have trouble cutting back when prices rise.6 Even thoughwealthier households consume more than middle-income households, and middle-incomehouseholds consume more than low-income households, consumption does not increase asfast as income. Therefore as income rises, energy expenditures take a much smaller part of thehousehold income. More importantly, as prices rise, lower income households suffer largerrelative burdens on their household budgets.7
Exhibit I-1: Expenditures on Heating & Hot Water, Average Household that Heats with Natural Gas Source: Energy Information Administration, Winter Fuels Outlook, various issues.
$0
$200
$400
$600
$800
$1,000
$1,200
$1,400
$1,600
96 - 97 97 - 98 98 - 99 99 - 00 00 - 01 01 - 02 02 - 03 03 - 04 04 - 05
Ann
ual N
atur
al G
as B
ill
2
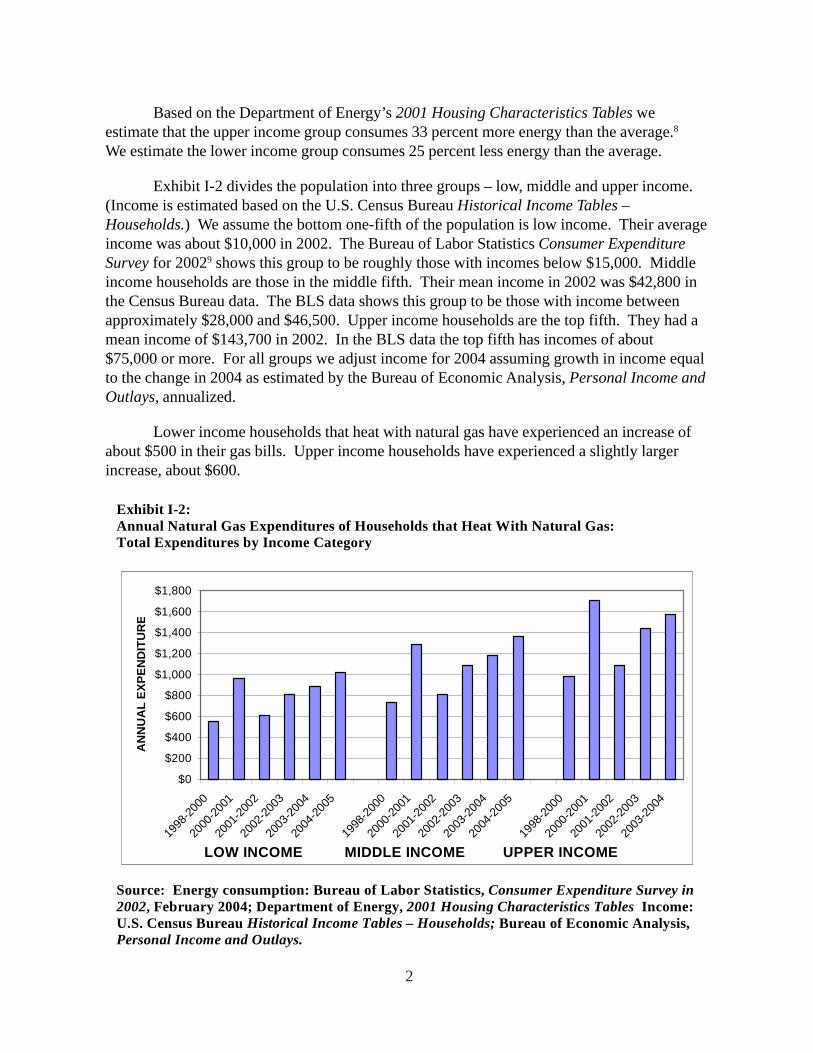
Based on the Department of Energy’s 2001 Housing Characteristics Tables weestimate that the upper income group consumes 33 percent more energy than the average.8
We estimate the lower income group consumes 25 percent less energy than the average.
Exhibit I-2 divides the population into three groups – low, middle and upper income.(Income is estimated based on the U.S. Census Bureau Historical Income Tables –Households.) We assume the bottom one-fifth of the population is low income. Their averageincome was about $10,000 in 2002. The Bureau of Labor Statistics Consumer ExpenditureSurvey for 20029 shows this group to be roughly those with incomes below $15,000. Middleincome households are those in the middle fifth. Their mean income in 2002 was $42,800 inthe Census Bureau data. The BLS data shows this group to be those with income betweenapproximately $28,000 and $46,500. Upper income households are the top fifth. They had amean income of $143,700 in 2002. In the BLS data the top fifth has incomes of about$75,000 or more. For all groups we adjust income for 2004 assuming growth in income equalto the change in 2004 as estimated by the Bureau of Economic Analysis, Personal Income andOutlays, annualized.
Lower income households that heat with natural gas have experienced an increase ofabout $500 in their gas bills. Upper income households have experienced a slightly largerincrease, about $600.
Exhibit I-2: Annual Natural Gas Expenditures of Households that Heat With Natural Gas: Total Expenditures by Income Category Source: Energy consumption: Bureau of Labor Statistics, Consumer Expenditure Survey in 2002, February 2004; Department of Energy, 2001 Housing Characteristics Tables Income: U.S. Census Bureau Historical Income Tables – Households; Bureau of Economic Analysis, Personal Income and Outlays.
$0
$200
$400
$600
$800
$1,000
$1,200
$1,400
$1,600
$1,800
1998
-2000
2000
-2001
2001
-2002
2002
-2003
2003
-2004
2004
-2005
1998
-2000
2000
-2001
2001
-2002
2002
-2003
2003
-2004
2004
-2005
1998
-2000
2000
-2001
2001
-2002
2002
-2003
2003
-2004
LOW INCOME MIDDLE INCOME UPPER INCOME
AN
NU
AL
EXPE
ND
ITU
RE
3
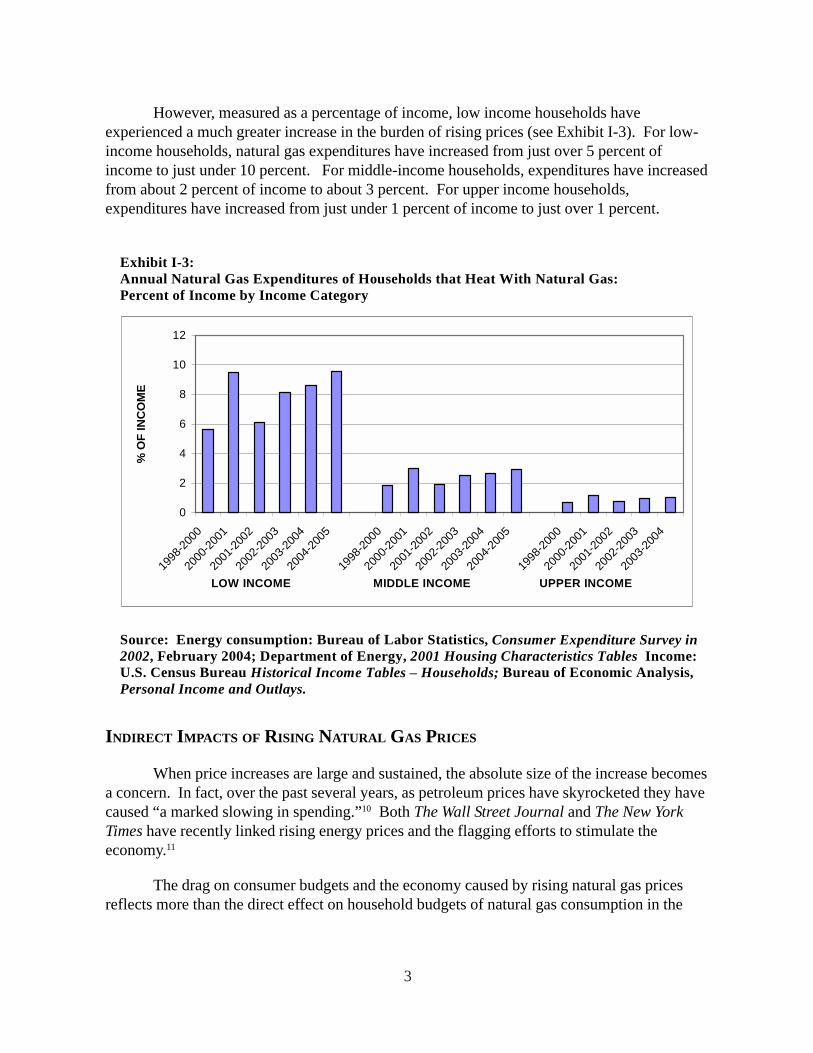
However, measured as a percentage of income, low income households haveexperienced a much greater increase in the burden of rising prices (see Exhibit I-3). For low-income households, natural gas expenditures have increased from just over 5 percent ofincome to just under 10 percent. For middle-income households, expenditures have increasedfrom about 2 percent of income to about 3 percent. For upper income households,expenditures have increased from just under 1 percent of income to just over 1 percent.
INDIRECT IMPACTS OF RISING NATURAL GAS PRICES
When price increases are large and sustained, the absolute size of the increase becomesa concern. In fact, over the past several years, as petroleum prices have skyrocketed they havecaused “a marked slowing in spending.”10 Both The Wall Street Journal and The New YorkTimes have recently linked rising energy prices and the flagging efforts to stimulate theeconomy.11
The drag on consumer budgets and the economy caused by rising natural gas pricesreflects more than the direct effect on household budgets of natural gas consumption in the
Exhibit I-3: Annual Natural Gas Expenditures of Households that Heat With Natural Gas: Percent of Income by Income Category Source: Energy consumption: Bureau of Labor Statistics, Consumer Expenditure Survey in 2002, February 2004; Department of Energy, 2001 Housing Characteristics Tables Income: U.S. Census Bureau Historical Income Tables – Households; Bureau of Economic Analysis, Personal Income and Outlays.
0
2
4
6
8
10
12
1998
-2000
2000
-2001
2001
-2002
2002
-2003
2003
-2004
2004
-2005
1998
-2000
2000
-2001
2001
-2002
2002
-2003
2003
-2004
2004
-2005
1998
-2000
2000
-2001
2001
-2002
2002
-2003
2003
-2004
LOW INCOME MIDDLE INCOME UPPER INCOME
% O
F IN
CO
ME
4
home. In fact, residential consumers account for slightly less than one-quarter of total naturalgas consumption.
When the cost of natural gas rises, the cost of other goods and services that consumerspurchase also rises. The extent to which the price increases are passed through to consumersdepends on the specific industry and sector. In some cases costs are likely to be passedthrough, particularly where all suppliers have experienced similar increases. Thus, sectors thatare not subject to international competition are likely to pass through the cost increases.Where there is international competition, particularly from places where natural gas priceshave not increased, the ability to pass cost increases through may be more limited.12
One sector where consumers are likely to feel the pinch of natural gas price increasesis the electricity sector. In this sector, gas costs are directly passed through in fuel adjustmentclauses. In fact, in states where the electricity industry has been restructured and generationlargely deregulated, rising natural gas prices may affect the cost of generation from othersources because natural gas sets the market price.
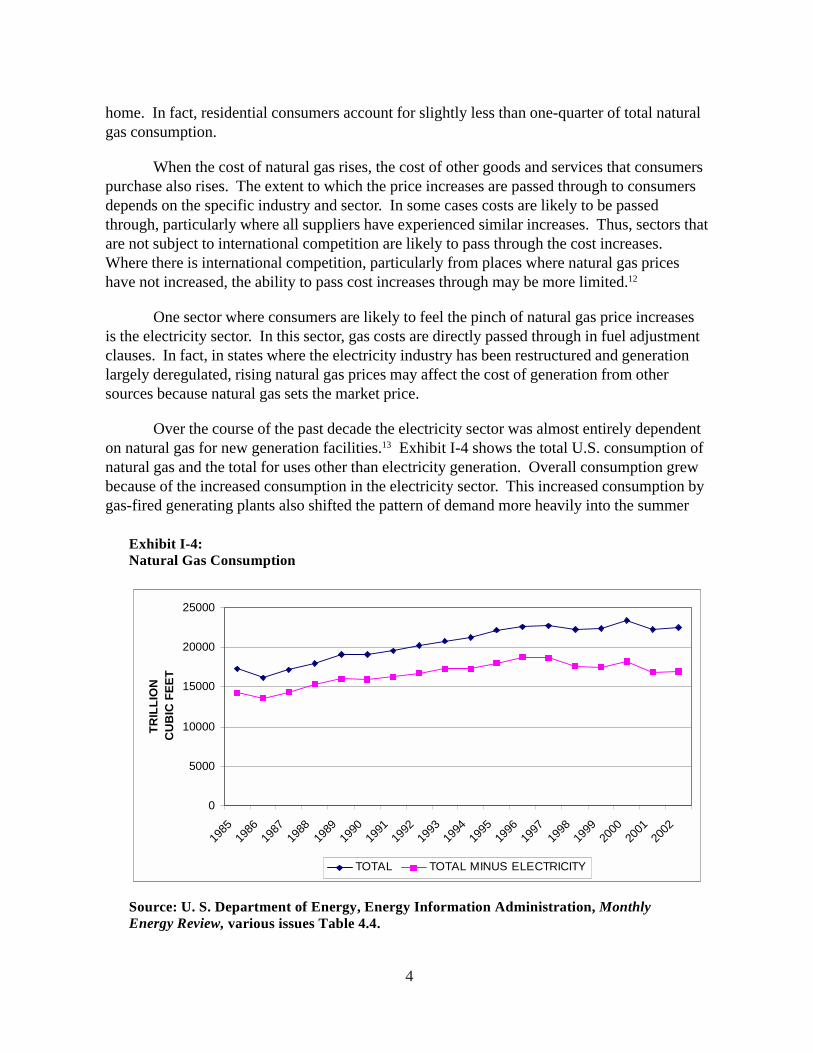
Over the course of the past decade the electricity sector was almost entirely dependenton natural gas for new generation facilities.13 Exhibit I-4 shows the total U.S. consumption ofnatural gas and the total for uses other than electricity generation. Overall consumption grewbecause of the increased consumption in the electricity sector. This increased consumption bygas-fired generating plants also shifted the pattern of demand more heavily into the summer
0
5000
10000
15000
20000
25000
1985
1986
1987
1988
1989
1990
1991
1992
1993
1994
1995
1996
1997
1998
1999
2000
2001
2002
TRIL
LIO
N
CU
BIC
FEE
T
TOTAL TOTAL MINUS ELECTRICITY
Exhibit I-4: Natural Gas Consumption Source: U. S. Department of Energy, Energy Information Administration, Monthly Energy Review, various issues Table 4.4.
5
months since gas is especially used for peak load generation. As a result, it has become moredifficult to put gas in storage in preparation for the winter heating season. The increase innatural gas consumption in the electricity sector is equal to about ten percent of total U.S.consumption.14 Taken together, the residential and electricity sectors account for just underhalf of all natural gas consumed in the U.S.
Cost increases in the commercial sector are likely to be passed through to consumerssince the services they provide are essentially local. The commercial sector accounts for 15percent of total natural gas consumption. The residential, electricity and commercial sectorsaccount for over 60 percent of all natural gas consumption in the U.S.
The U.S. has the highest price of natural gas in the world, at over $5 per thousandcubic feet (mcf).15 While other advanced industrial nations are close, with prices about 10percent lower, very low natural gas prices in Russia and throughout the Middle East and NorthAfrica are putting severe pressure on U.S. manufacturing industries in which natural gas playsa significant role. Prices for domestic products rise, while output and jobs shift overseas. Asa recent Congressional report put it:
Because domestically produced natural gas is so vital to our nation’s energybalance, rising prices make our nation less competitive. When prices rise,factories close. Good, high paying jobs are exported overseas. Today’s highnatural gas prices are doing just that. We are losing manufacturing jobs in thechemicals, plastics, steel, automotive, glass, fertilizer, fabrication, textile,pharmaceutical, agribusiness and high tech industries.16
THE PRICE SHOCK
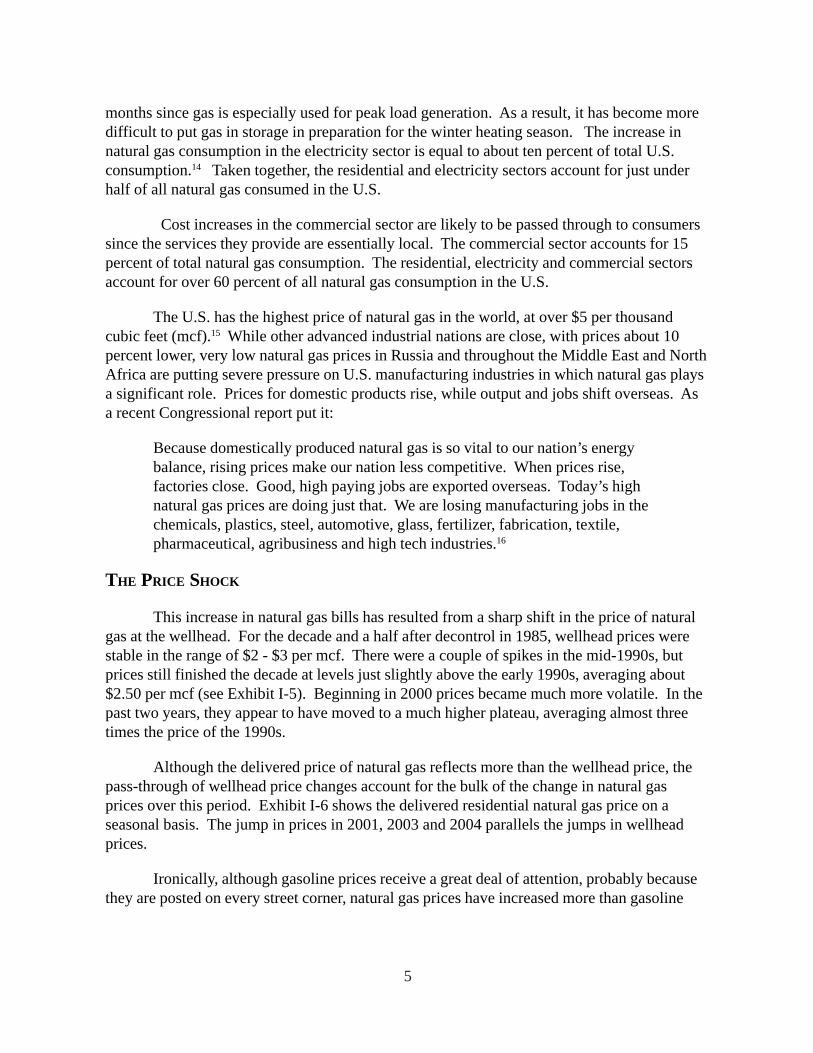
This increase in natural gas bills has resulted from a sharp shift in the price of naturalgas at the wellhead. For the decade and a half after decontrol in 1985, wellhead prices werestable in the range of $2 - $3 per mcf. There were a couple of spikes in the mid-1990s, butprices still finished the decade at levels just slightly above the early 1990s, averaging about$2.50 per mcf (see Exhibit I-5). Beginning in 2000 prices became much more volatile. In thepast two years, they appear to have moved to a much higher plateau, averaging almost threetimes the price of the 1990s.
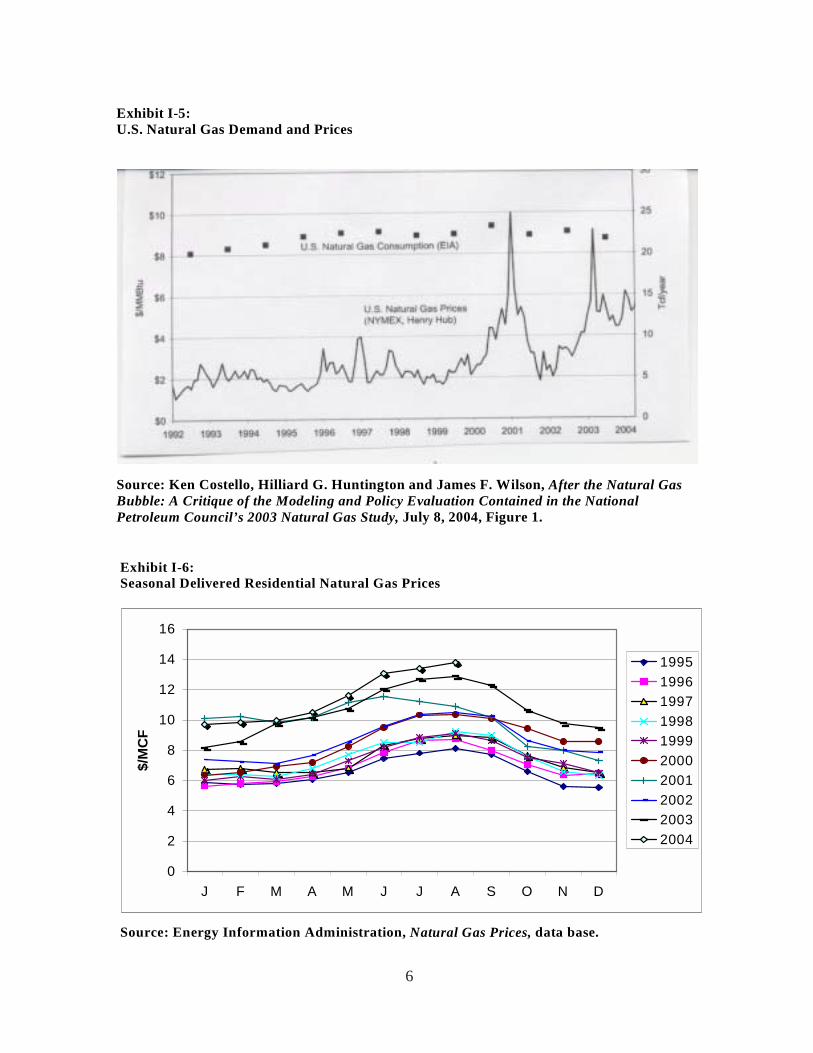
Although the delivered price of natural gas reflects more than the wellhead price, thepass-through of wellhead price changes account for the bulk of the change in natural gasprices over this period. Exhibit I-6 shows the delivered residential natural gas price on aseasonal basis. The jump in prices in 2001, 2003 and 2004 parallels the jumps in wellheadprices.
Ironically, although gasoline prices receive a great deal of attention, probably becausethey are posted on every street corner, natural gas prices have increased more than gasoline
6
Exhibit I-5: U.S. Natural Gas Demand and Prices Source: Ken Costello, Hilliard G. Huntington and James F. Wilson, After the Natural Gas Bubble: A Critique of the Modeling and Policy Evaluation Contained in the National Petroleum Council’s 2003 Natural Gas Study, July 8, 2004, Figure 1.
Exhibit I-6: Seasonal Delivered Residential Natural Gas Prices Source: Energy Information Administration, Natural Gas Prices, data base.
0
2
4
6
8
10
12
14
16
J F M A M J J A S O N D
$/M
CF
1995199619971998199920002001200220032004
7
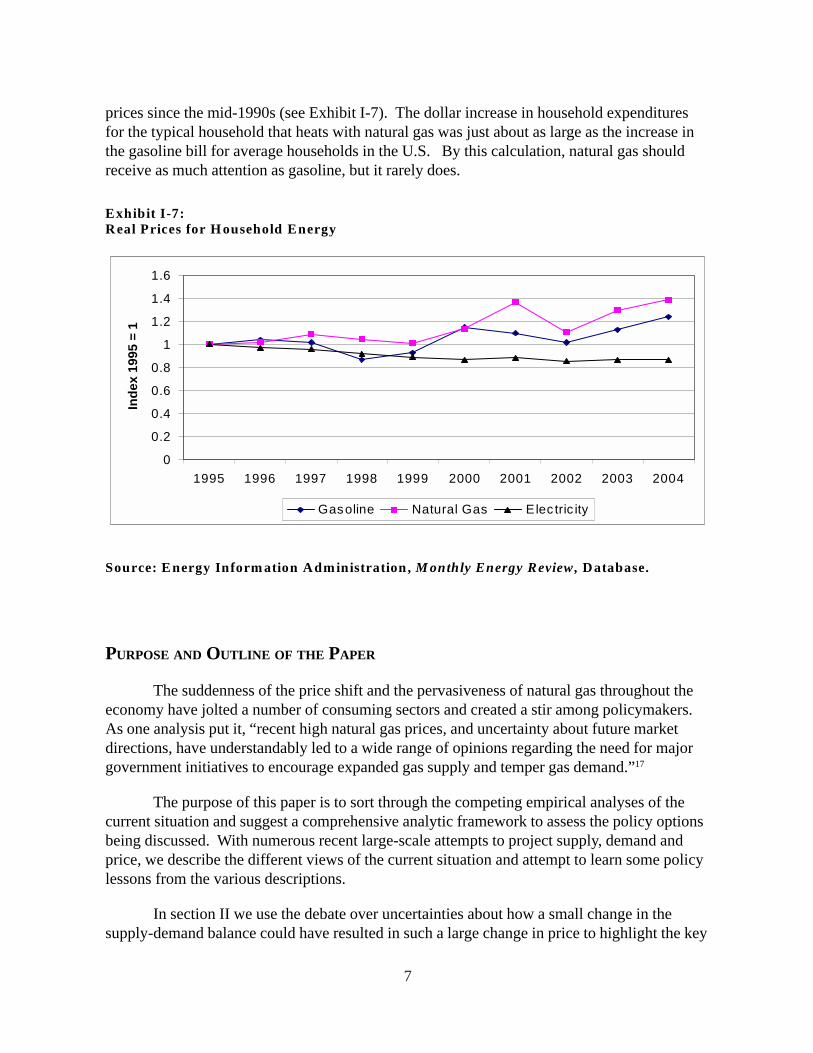
prices since the mid-1990s (see Exhibit I-7). The dollar increase in household expendituresfor the typical household that heats with natural gas was just about as large as the increase inthe gasoline bill for average households in the U.S. By this calculation, natural gas shouldreceive as much attention as gasoline, but it rarely does.
PURPOSE AND OUTLINE OF THE PAPER
The suddenness of the price shift and the pervasiveness of natural gas throughout theeconomy have jolted a number of consuming sectors and created a stir among policymakers.As one analysis put it, “recent high natural gas prices, and uncertainty about future marketdirections, have understandably led to a wide range of opinions regarding the need for majorgovernment initiatives to encourage expanded gas supply and temper gas demand.”17
The purpose of this paper is to sort through the competing empirical analyses of thecurrent situation and suggest a comprehensive analytic framework to assess the policy optionsbeing discussed. With numerous recent large-scale attempts to project supply, demand andprice, we describe the different views of the current situation and attempt to learn some policylessons from the various descriptions.
In section II we use the debate over uncertainties about how a small change in thesupply-demand balance could have resulted in such a large change in price to highlight the key
Exhibit I-7: Real Prices for H ousehold Energy
0
0.2
0.4
0.6
0.8
1
1.2
1.4
1.6
1995 1996 1997 1998 1999 2000 2001 2002 2003 2004
Inde
x 19
95 =
1
Gasoline Natural Gas Elec tric ity
Source: E nergy Inform ation Adm inistration, M onthly Energy Review, Database.
8
assumptions, risks and uncertainties that consumers face. Some believe that pricing abuseplayed a role in the recent run-up. We believe there is some validity in this argument. Mostanalysts believe that meeting projected demand increases would put upward pressures onprices and see a challenging period ahead. We believe there is validity in this view as well.
In Section III we examine demand and likely sources of supply. We conclude thatvigorous policy is needed, beyond efforts to eliminate any abusive pricing, to ensure thatnatural gas is affordable. A business-as-usual policy is unacceptable because the risks in thecurrent situation and a “do-nothing” approach are severe. Dramatic, short-term shifts indomestic natural gas prices have created disequilibrium in the price of gas for households andindustries that consume natural gas. The dash to gas in the electric utility industry has createddisequilibrium in supply. Alternatives that would smooth the transition to a new regime innatural gas are not available. Simply waiting for the market to solve the problem will notwork without imposing severe disruptions and burdens on consumers.
In section IV we define a framework for assessing the policy alternatives. We identifythe time frame (short-term, mid-term, long-term) and the aspect of the market that policiesaddress (supply, demand, structure, conduct). We establish economic, environmental andsecurity criteria by which to evaluate policies and then apply these criteria to seven broadcategories of policies. Because the domestic market has become unstable and shockedconsumers with rising prices and disappointing performance, we approach the analysis as onein which we seek to alleviate the pressures on the domestic natural gas resource base.
In Section V, we propose the first steps in the policy process. Having established aclear need and the criteria by which policies should be evaluated, we rank the broad categoriesof policies in the order in which they should be pursued. We provide the outlines of wherepolicymakers should focus, but we do not discuss the details of the policies. We believe that abroad consensus on the direction of policy is the critical first step to responding to the turmoilin the natural gas market.
9
II. UNCERTAINTIES ABOUT NATURAL GAS MARKETS
CHANGING VIEWS OF NATURAL GAS MARKET FUNDAMENTALS
The sudden shift in natural gas pricing has resulting in a dramatic reconsideration ofnatural gas market fundamentals which must be the starting point for public policy analysis.Given the vital role of natural gas in the economy, projecting supply, demand and price pathsis critical to assessing what types of policies are needed.
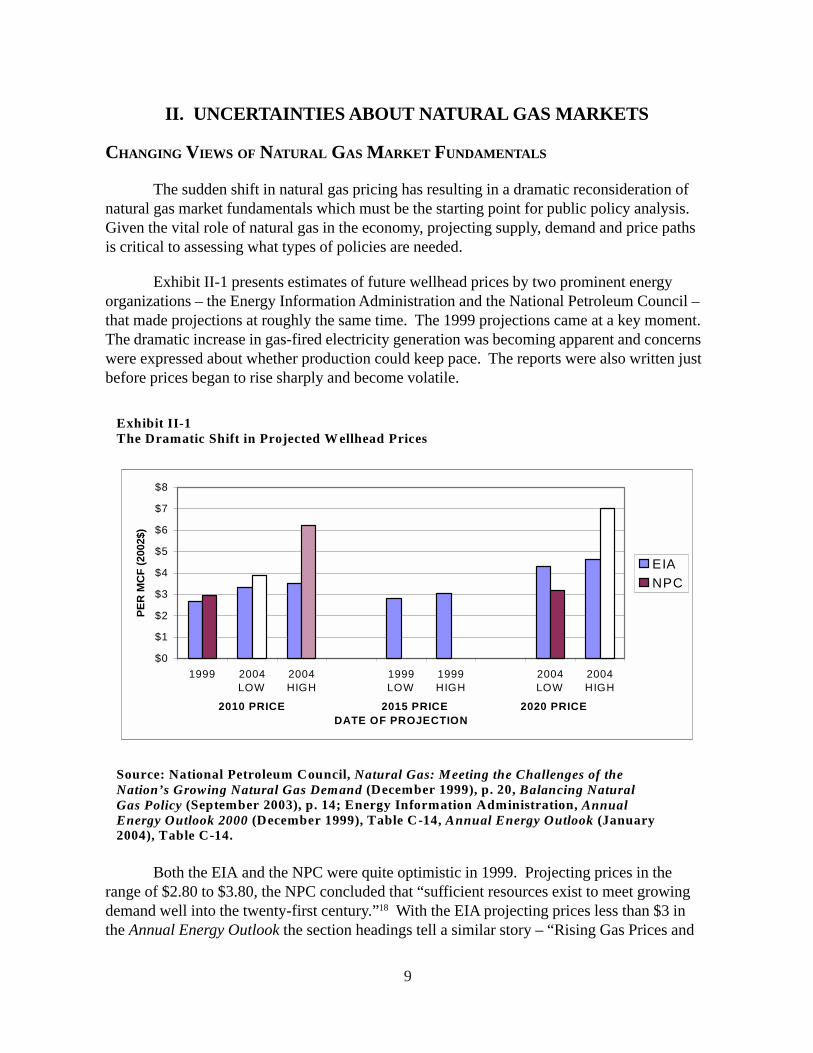
Exhibit II-1 presents estimates of future wellhead prices by two prominent energyorganizations – the Energy Information Administration and the National Petroleum Council –that made projections at roughly the same time. The 1999 projections came at a key moment.The dramatic increase in gas-fired electricity generation was becoming apparent and concernswere expressed about whether production could keep pace. The reports were also written justbefore prices began to rise sharply and become volatile.
Both the EIA and the NPC were quite optimistic in 1999. Projecting prices in therange of $2.80 to $3.80, the NPC concluded that “sufficient resources exist to meet growingdemand well into the twenty-first century.”18 With the EIA projecting prices less than $3 inthe Annual Energy Outlook the section headings tell a similar story – “Rising Gas Prices and
$0
$1
$2
$3
$4
$5
$6
$7
$8
1999 2004LOW
2004HIGH
1999LOW
1999HIGH
2004LOW
2004HIGH
2010 PRICE 2015 PRICE 2020 PRICE DATE OF PROJECTION
PER
MC
F (2
002$
)
EIANPC
Exhibit II-1 The Dramatic Shift in Projected W ellhead Prices Source: National Petroleum Council, Natural Gas: Meeting the Challenges of the Nation’s Growing Natural Gas Demand (December 1999), p. 20, Balancing Natural Gas Policy (September 2003), p. 14; Energy Information Administration, Annual Energy Outlook 2000 (December 1999), Table C-14, Annual Energy Outlook (January 2004), Table C-14.
10
Lower Drilling Costs Increase Well Completions, High Levels of Gas Reserve Additions AreProjected Through 2020, Significant New Finds Are Likely To Continue Increases in GasProduction.”19
The tone in the 2004 reports was considerably changed. The EIA added a dollar to itsprojected prices and the NPC added over two dollars. The NPC declared that “North Americais moving to a period in its history in which it will no longer be self-reliant in meeting itsgrowing natural gas needs.”20 The EIA report opens with a cautious note,
For almost 4 years, natural gas prices have remained at levels substantiallyhigher than those of the 1990s. This has led to a reevaluation of expectationsabout future trends in natural gas markets, the economics of exploration andproduction, and the size of the natural gas resources. The Annual EnergyOutlook 2004 forecast reflects such revised expectations, projecting greaterdependence on more costly alternative supplies of natural gas.21
There is also less certainty about the supply-demand balance. The NPC claims that“Current higher gas prices are the result of a fundamental shift in the supply and demandbalance…. [that] will result in undesirable impacts to consumers and the economy, if notaddressed.”22 Others correct the record, pointing out, as Exhibit I-5 above shows, that,
to be clear, however, the fundamental shift in the NPC outlooks has been insupply, not in demand…. In the 2003 NPC Report, the resource baseassessment for the Lower-48 and Canada has been reduced by 20%… The NPCforecast of U.S. gas consumption… has been reduced by over 15% comparedto the 1999 report, while prices are expected to be 40% to 70% higher thananticipated in the 1999 report.”23
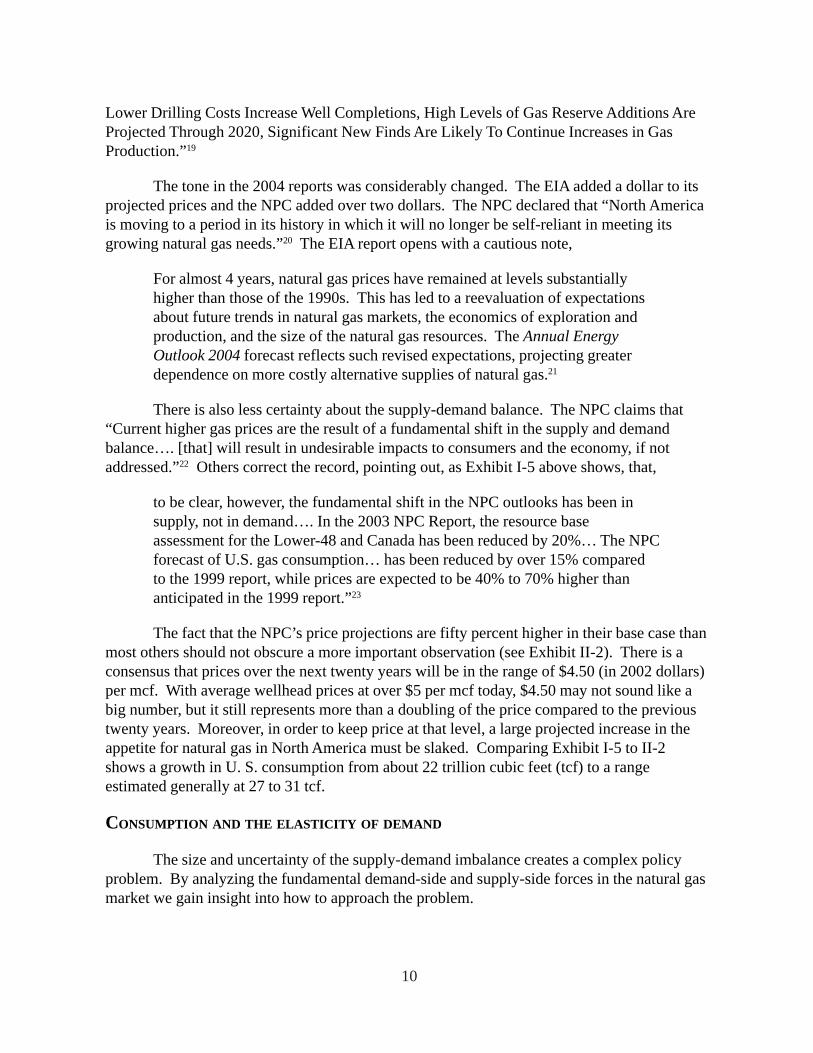
The fact that the NPC’s price projections are fifty percent higher in their base case thanmost others should not obscure a more important observation (see Exhibit II-2). There is aconsensus that prices over the next twenty years will be in the range of $4.50 (in 2002 dollars)per mcf. With average wellhead prices at over $5 per mcf today, $4.50 may not sound like abig number, but it still represents more than a doubling of the price compared to the previoustwenty years. Moreover, in order to keep price at that level, a large projected increase in theappetite for natural gas in North America must be slaked. Comparing Exhibit I-5 to II-2shows a growth in U. S. consumption from about 22 trillion cubic feet (tcf) to a rangeestimated generally at 27 to 31 tcf.
CONSUMPTION AND THE ELASTICITY OF DEMAND
The size and uncertainty of the supply-demand imbalance creates a complex policyproblem. By analyzing the fundamental demand-side and supply-side forces in the natural gasmarket we gain insight into how to approach the problem.
11
The NPC and Cambridge Energy Research Associates (CERA)24 have stronglyemphasized supply-side solutions. The NPC supports conservation, but does not study itsimpact in detail. CERA did offer a demand side hypothetical exercise that is instructive as aplace to start the analysis. CERA asked, ‘what would happen to prices if natural gasconsumption declined 8 percent at the peak?’ The conclusion was that prices would declineby $1.50 per mcf, a very substantial amount. The details were not given about the underlyingassumptions, but at the stated prices, this represents a decline of between 20 and 30 percent.
The exercise is hypothetical primarily because CERA makes no claims about whethersuch a reduction could be achieved, not because the price responsiveness is wrong. TheAmerican Council for an Energy Efficient Economy (ACEEE)25 conducted a similar exercise.It is intriguing to compare the supply elasticity implicit in the ACEEE study of the potentialfor conservation and efficiency to lower the price of gas. ACEEE contends that a 5.5 percentreduction in natural gas consumption could be achieved in five years.26 For them thehypothetical is a real possibility. Interestingly, the impact on price in the ACEEE analysis isquite similar to the CERA analysis. The 5.5% reduction in demand is projected to result in a22 percent reduction in price.27 In the longer term, ACEEE projects efficiency-driven demandreductions of over 20 percent.28
Exhibit II-2: Comparison of Natural Gas Outlooks, 2020 2020 Natural Gas Conditions, Low Supply Case Source: Ken Costello, Hilliard G. Huntington and James F. Wilson, After the Natural Gas Bubble: A critique of the Modeling and Policy Evaluation Contained in the National Petroleum council’s 2003 Natural Gas Study, July 8, 2004, Figure 3.
12
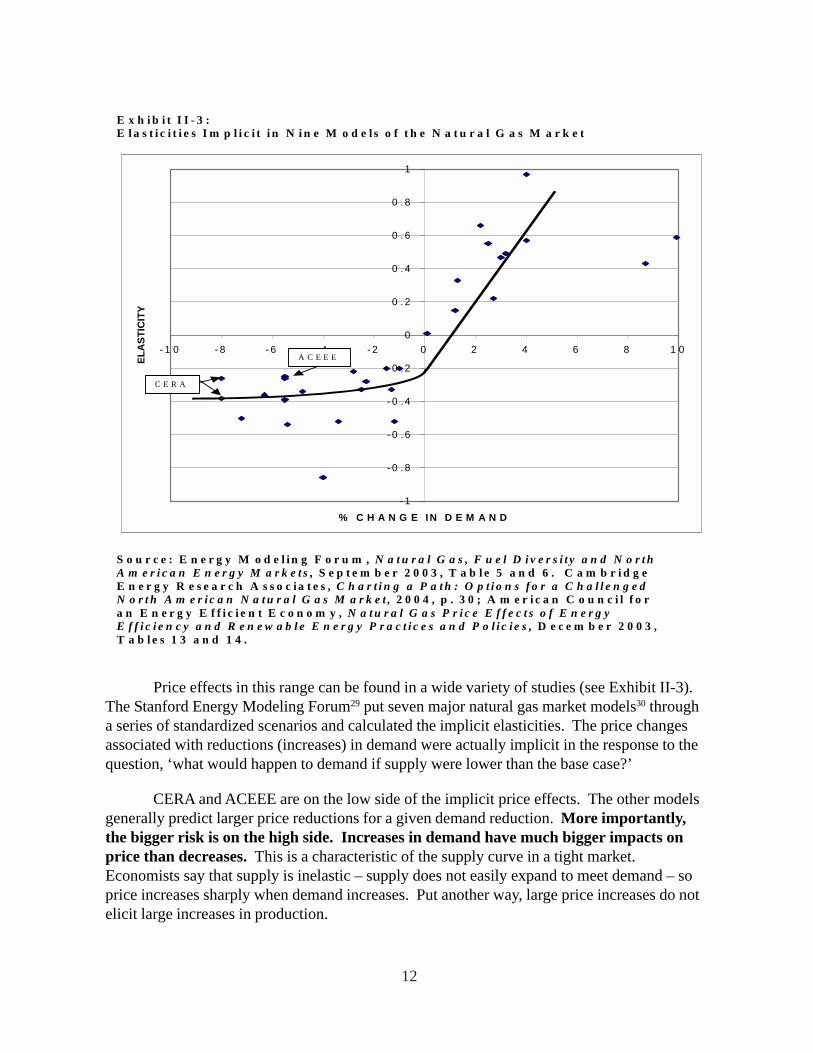
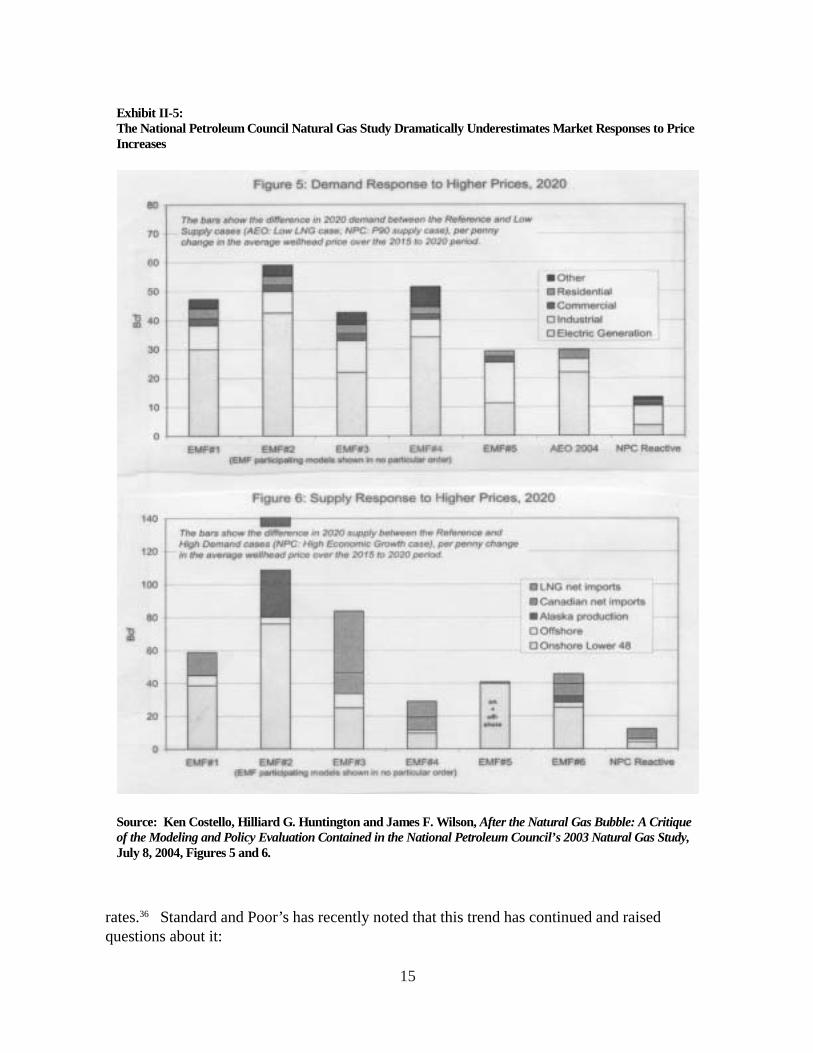
Price effects in this range can be found in a wide variety of studies (see Exhibit II-3).The Stanford Energy Modeling Forum29 put seven major natural gas market models30 througha series of standardized scenarios and calculated the implicit elasticities. The price changesassociated with reductions (increases) in demand were actually implicit in the response to thequestion, ‘what would happen to demand if supply were lower than the base case?’
CERA and ACEEE are on the low side of the implicit price effects. The other modelsgenerally predict larger price reductions for a given demand reduction. More importantly,the bigger risk is on the high side. Increases in demand have much bigger impacts onprice than decreases. This is a characteristic of the supply curve in a tight market.Economists say that supply is inelastic – supply does not easily expand to meet demand – soprice increases sharply when demand increases. Put another way, large price increases do notelicit large increases in production.
- 1
- 0 .8
- 0 .6
- 0 .4
- 0 .2
0
0 . 2
0 . 4
0 . 6
0 . 8
1
- 1 0 - 8 - 6 - 4 - 2 0 2 4 6 8 1 0
% C H A N G E IN D E M A N D
ELA
STIC
ITY
E x h i b i t I I - 3 : E l a s t i c i t i e s I m p l i c i t i n N i n e M o d e l s o f t h e N a t u r a l G a s M a r k e t S o u r c e : E n e r g y M o d e l i n g F o r u m , N a t u r a l G a s , F u e l D i v e r s i t y a n d N o r t h A m e r i c a n E n e r g y M a r k e t s , S e p t e m b e r 2 0 0 3 , T a b l e 5 a n d 6 . C a m b r i d g e E n e r g y R e s e a r c h A s s o c i a t e s , C h a r t i n g a P a t h : O p t i o n s f o r a C h a l l e n g e d N o r t h A m e r i c a n N a t u r a l G a s M a r k e t , 2 0 0 4 , p . 3 0 ; A m e r i c a n C o u n c i l f o r a n E n e r g y E f f i c i e n t E c o n o m y , N a t u r a l G a s P r i c e E f f e c t s o f E n e r g y E f f i c i e n c y a n d R e n e w a b l e E n e r g y P r a c t i c e s a n d P o l i c i e s , D e c e m b e r 2 0 0 3 , T a b l e s 1 3 a n d 1 4 .
C E R A
A C E E E
13
The implications are quite important for policy choices. If demand reduction can beimplemented quickly, conservation and efficiency can make a substantial contribution tolowering prices. This exercise serves an important purpose. It suggests that even if we arepessimistic about the supply side, we do not have to capitulate to extremely high prices.
However, we must acknowledge that demand is quite inelastic, as well. As noted inSection 1, because energy is a necessity, when prices rise people have difficulty cutting back.Energy consumption is determined by the physical and economic structure of daily life.31
People consume natural gas for heating primarily and, increasingly, indirectly for electricity.The amount they consume is dictated in large part by the kinds of buildings in which they liveand work and the energy efficiency of the appliances they use. Natural gas has become thefuel of choice in many residential uses. It has been the favorite of the electricity industry forabout a decade. Short-term elasticities are in the range of .3, long-term elasticities are in therange of .6. An occasional estimate of long-term elasticity is in the neighborhood of 1.0, quiteinelastic compared to other commodities. 32
UNCERTAINTY ABOUT SCARCITY
One of the reasons we observe differences in assumptions about the supply priceresponse is that analysts believe we are at different places on the supply curve. The change indemand or supply has a different effect on price if the resource base is exhausted and difficultto expand than if it is not as mature and easier to develop.
This difference of opinion (between the EIA and the NPC, for example) will play aprominent role in the debate over natural gas policy. An interesting aspect of the conflict overthe NPC report and the current situation is the assertion that we are suffering from a suddenrealization that the resource base is not what we thought it was. Thinking we had plentifulsupplies, we stimulated natural gas consumption particularly in the electricity sector. Butsupplies were actually tighter than we thought. The sudden discovery of scarcity in the face ofincreasing demand has led to a substantial price shock. This view provides a “scarcity”explanation of the recent price increases that has created substantial economic rents. Asdemand crept up and the resource base was depleted, the industry got a shock. Itsexpectations that it could continue to replace natural gas supplies at modestly rising priceswere wrong. Given limitations on where the industry can drill and the amount of gas to befound, it will take much higher prices to keep supplies up. Because existing supplies havebeen discovered and developed at much lower costs, they earn a very high rate of profit.
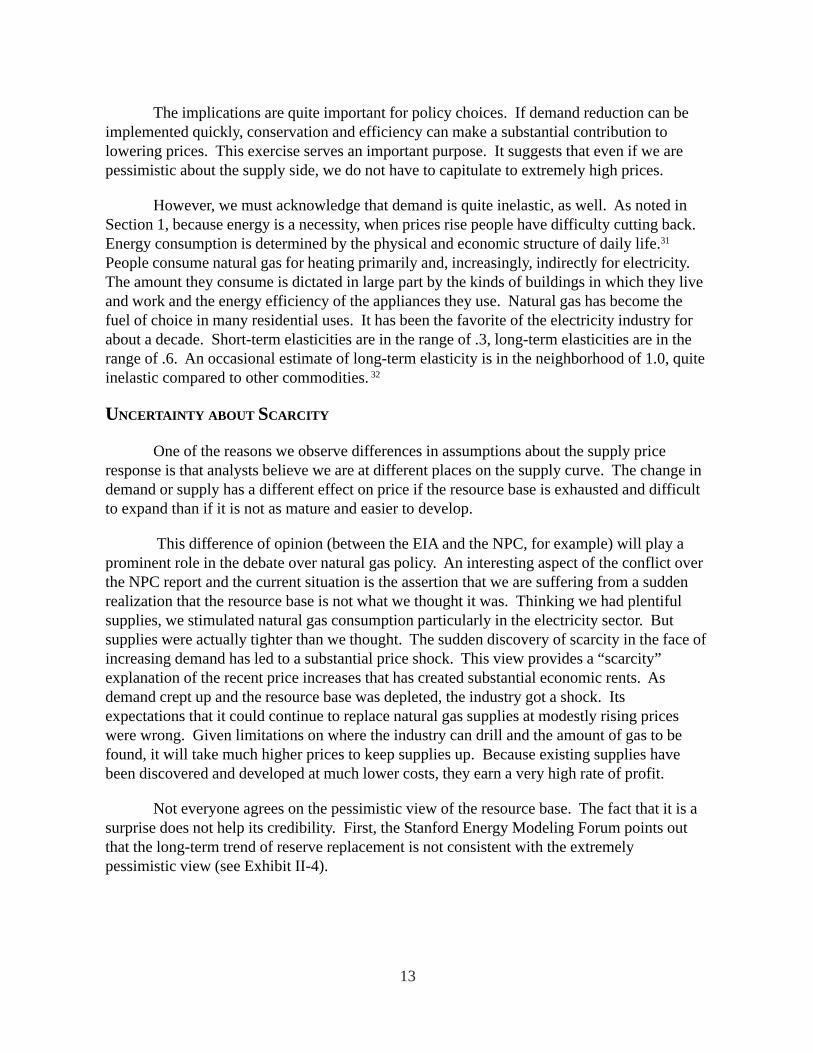
Not everyone agrees on the pessimistic view of the resource base. The fact that it is asurprise does not help its credibility. First, the Stanford Energy Modeling Forum points outthat the long-term trend of reserve replacement is not consistent with the extremelypessimistic view (see Exhibit II-4).
14
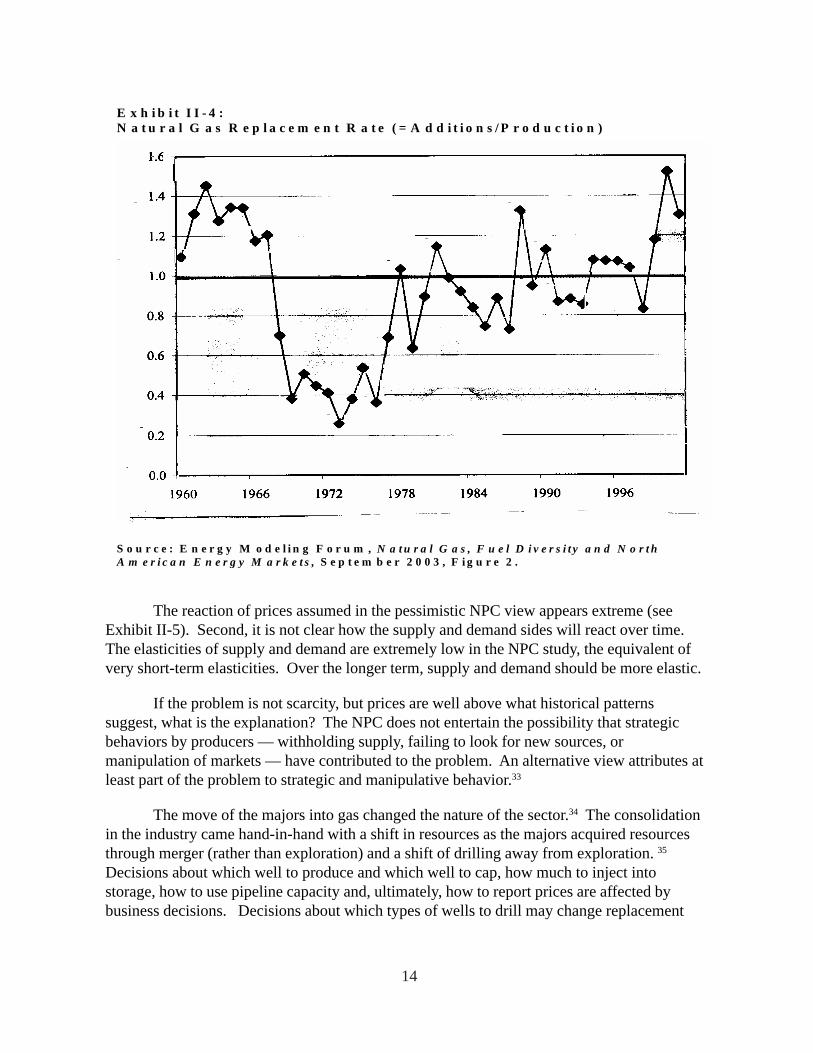
The reaction of prices assumed in the pessimistic NPC view appears extreme (seeExhibit II-5). Second, it is not clear how the supply and demand sides will react over time.The elasticities of supply and demand are extremely low in the NPC study, the equivalent ofvery short-term elasticities. Over the longer term, supply and demand should be more elastic.
If the problem is not scarcity, but prices are well above what historical patternssuggest, what is the explanation? The NPC does not entertain the possibility that strategicbehaviors by producers — withholding supply, failing to look for new sources, ormanipulation of markets — have contributed to the problem. An alternative view attributes atleast part of the problem to strategic and manipulative behavior.33
The move of the majors into gas changed the nature of the sector.34 The consolidationin the industry came hand-in-hand with a shift in resources as the majors acquired resourcesthrough merger (rather than exploration) and a shift of drilling away from exploration. 35
Decisions about which well to produce and which well to cap, how much to inject intostorage, how to use pipeline capacity and, ultimately, how to report prices are affected bybusiness decisions. Decisions about which types of wells to drill may change replacement
E x h i b i t I I - 4 : N a t u r a l G a s R e p l a c e m e n t R a t e ( = A d d i t i o n s / P r o d u c t i o n ) S o u r c e : E n e r g y M o d e l i n g F o r u m , N a t u r a l G a s , F u e l D i v e r s i t y a n d N o r t h A m e r i c a n E n e r g y M a r k e t s , S e p t e m b e r 2 0 0 3 , F i g u r e 2 .
15
rates.36 Standard and Poor’s has recently noted that this trend has continued and raisedquestions about it:
Exhibit II-5: The National Petroleum Council Natural Gas Study Dramatically Underestimates Market Responses to Price Increases Source: Ken Costello, Hilliard G. Huntington and James F. Wilson, After the Natural Gas Bubble: A Critique of the Modeling and Policy Evaluation Contained in the National Petroleum Council’s 2003 Natural Gas Study, July 8, 2004, Figures 5 and 6.
16
It is unclear that producers are investing enough to grow production materially– and this follows a year [2003] in which the domestic gas production(including acquisitions) of integrated producers appears to have declined…
[M]ajor integrated companies, which appear to be reinvesting only 30 to 40percent of their domestic cash flow in the United States, have made strategicdecisions to allow their shallow-water and onshore natural gas production todeplete to redeploy capital to international (mainly oil) projects.37
It is also important to recognize in the case of natural gas that the trading markets thatdrive the wellhead price are quite new. Most were set up in the 1990s, as part of therestructuring of the natural gas industry.38 Enron played a large role in these markets andwhen it collapsed, so too did much private trading.39 Today, the markets are “very thin” andthat raises concerns about trading,40 but the evidence is mounting that manipulation andabusive practices have long been part of these markets.41 As recently as the end of November2004, indictments were still being handed down for the misreporting of natural gas trades in2000 and 2001 and reporting of gas stocks and prices were in disarray.42
CFA’s view is that scarcity and strategic behavior have interacted. We cite the maturityof the domestic resource base as the reason public policy should not overemphasize domesticdrilling as a solution. We recognize that this has implications for scarcity, and we accept theneed to expand supply in an environmentally sound way. However, we believe that strategicbehavior played a role as well. Inadequate competition has augmented volatility andaccelerated the upward price spiral. The implication of this discussion is that we shouldput some eggs in the scarcity basket and some eggs in the strategic basket. Perhaps morestrongly, we can suggest that vigorous efforts should be made to first ensure thatstrategic behavior is not the underlying problem.
PRICE VOLATILITY AND STOCKPILES
Whatever one believes about the role of concentration and manipulation in the ongoingmarket tightness, the importance of stockpiles is widely recognized. Prices run up quickly as aresult of even slight disruptions in the supply-demand balance because short-term supply anddemand in the energy industry are extremely inelastic. Contrasting energy commodities tofinancial instruments like stocks and bonds, a recent book entitled Energy Risk identified theuniqueness of energy markets. The key elements are the supply-side difficulties of production,transportation and storage, and the demand-side challenges of providing for a continuous flowof energy to meet inflexible demand, which is subject to seasonal consumption patterns.
[T]he deliverables in money markets consist of a “piece of paper” or itselectronic equivalent, which are easily stored and transferred and areinsensitive to weather conditions. Energy markets paint a more complicatedpicture. Energies respond to the dynamic interplay between producing andusing; transferring and storing; buying and selling – and ultimately “burning”
17
actual physical products. Issues of storage, transport, weather andtechnological advances play a major role here.
In energy markets, the supply side concerns not only the storage and transfer ofthe actual commodity, but also how to get the actual commodity out of theground. The end user truly consumes the asset. Residential users need energyfor heating in the winter and cooling in the summer, and industrial users’ ownproducts continually depend on energy to keep the plants running and to avoidthe high cost of stopping and restarting them. Each of these energy participants– be they producers or end users – deals with a different set of fundamentaldrivers, which in turn affect the behavior of energy markets…
What makes energies so different is the excessive number of fundamental pricedrivers, which cause extremely complex price behavior.43
Having product in storage for quick release is crucial in determining the price andmarket behavior where supply and demand are inelastic:
Economic frictions (including transportation, storage, and search costs) whichimpede the transfer of the underlying commodity among different partiesseparated in space or time can create the conditions that the large trader canexploit in order to cause a supracompetitive price…
Although the formal analysis examines transportation costs as the source offriction, the consumption distortion results suggest that any friction that makesit costly to return a commodity to its original owners (such as storage costs orsearch costs) may facilitate manipulation.
The extent of market power depends on supply and demand conditions,seasonal factors, and transport costs. These transport cost related frictions arelikely to be important in many markets, including grains, non-precious metals,and petroleum products.
Transportation costs are an example of an economic friction that isolatesgeographically dispersed consumers. The results therefore suggest that anyform of transaction costs that impedes the transfer of a commodity amongconsumers can make manipulation possible…
All else equal, the lower the storage costs for a commodity, the more elastic itsdemand.44
Every investigation of every petroleum product price spike in the past several yearspoints to “unusually low stock” as a primary driver for all petroleum products.45 Natural gasstocks are very much influenced by the need to build stockpiles to meet the inevitable surge indemand during the winter heating season.46 One recent study found the volatility of natural
18
gas prices to be greater than oil prices because of the nature of the infrastructure required todeliver natural gas to consumers:
The dependence of natural gas on more inflexible sources of supply and thegreater role of transportation opens the window to profiteering. It appears thatvolatility in natural gas returns is more persistent than volatility in oil returns.By itself, this result suggests that there may be a ‘larger window of profitopportunity’ for investors in natural gas than in oil….
[N]atural gas return volatility responds more to unanticipated events (e.g.supply interruptions, changes in reserves and stocks, etc.), regardless of whichmarket they originate in… For example, a major event-causing shock will leadto an immediate increase in volatility in natural gas returns and culminate in a(relatively) prolonged period of volatility. If prices and thus returns rise inresponse to volatility, there may be immediate profit opportunities in naturalgas following shocks in either market.47
The long-term trend to much lower stocks relative to demand is clear in natural gas.Compared to the decade of 1985-1994, stocks were about 25 percent lower in the 1995-1999period.48 During the price spikes of the new millennium, the second half of 2000 and the firsthalf of 2001 and 2003, stocks were 40 to 50 percent lower than in the 1985-1994 period and25 percent lower than in the 1995-1999 period. These declines came during a period of asmall increase in consumption. The tightness in the market magnifies the impact ofstockpiles.
In a goof that may prompt more calls for greater natural gas markettransparency, the Energy Information Administration Thursday acknowledged amajor mistake in data issued last week on U.S. gas stockpiles… EIA said only17 billion cubic feet of gas had been withdrawn from U.S. storage facilitiesbetween November 12 and 19 – not 49 bcf, as the agency reported last week…The revelation could prove particularly sensitive because the surprisingly highnumber reported last week prompted a major and rapid run-up in gas futuresprices – based on faulty data.49
This recent storage reporting incident highlights both the importance of and concernover natural gas storage50 and the continuing concerns of price transparency andmanipulation.51
19
III. THE URGENT NEED FOR AGGRESSIVE POLICY
This debate over elasticities and the causes of recent price increases should not beallowed to obscure the underlying challenge in the natural gas market. Critical insight into thepressing need for aggressive policy can be gained by projecting demand for natural gas andthen inquiring how that demand can be met.
DEMAND
As noted, natural gas is the dominant fuel source for home heating and theoverwhelming energy choice for new electricity generation units built in the past decade, inaddition to being a preferred feedstock for chemical products. The important role that naturalgas plays on the demand side means that as the economy grows and population increases,demand will increase as well. Exhibit II-2, above, shows that the energy/economy modelsgenerally project U.S. demand to be in the range of 25 to 30 trillion cubic feet (tcf) per year in2025. This represents a modest rate of growth from the current level of consumption of about22 tcf.
The points plotted in Exhibit II-2 reflect only U.S. consumption, but most studiesrecognize that future supply and demand analyses should include Canada and Mexico as well.The North American market is integrated by pipelines, and pipeline imports for North Americaplay an important role in all scenarios, accounting for between five and twenty percent of totalU.S. consumption. All else equal, annual North American demand is likely to grow from justover 25 tcf today to over 35 tcf in twenty years. Over the next twenty years, North America islikely to consume approximately 600 trillion cubic feet of natural gas (in the base casescenarios).
Exhibit III-1 presents an accounting of the need and potential sources of natural gasover the next two decades drawn from the recent round of reports.
SUPPLY
The primary source of supply will be already discovered gas reserves in the U.S.,Canada and Mexico that are currently proved, about 270 tcf. Additional supplies will comefrom reserves that are likely to be proved, which fall in the range of 300 tcf. This totals about600 tcf. However, because the resource base recently “surprised” the market and revisions toreserve estimates have recently been downward, by as much as 20 percent, we should becautious about projected reserves and use a range of estimates of the unproven part of theresource base, perhaps 270 to 330 tcf.
In order to keep the gas industry operating on a continuous basis, companies strive toreplace the gas they produce. For example, note that today North America has about 270 tcfof discovered proved reserves, with consumption of about 27 tcf. Thus, the reserve-to-production ratio is about 10 to 1. Since base case consumption will be about 35 tcf in twenty
20
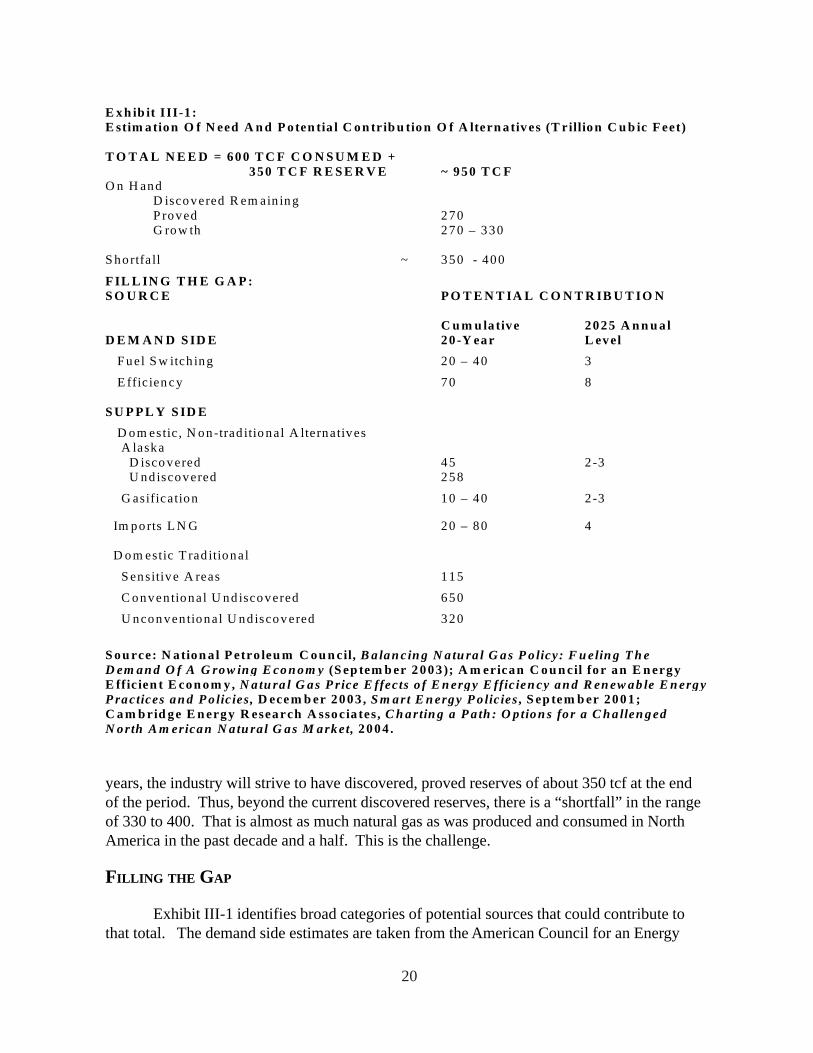
years, the industry will strive to have discovered, proved reserves of about 350 tcf at the endof the period. Thus, beyond the current discovered reserves, there is a “shortfall” in the rangeof 330 to 400. That is almost as much natural gas as was produced and consumed in NorthAmerica in the past decade and a half. This is the challenge.
FILLING THE GAP
Exhibit III-1 identifies broad categories of potential sources that could contribute tothat total. The demand side estimates are taken from the American Council for an Energy
E xh ib it III-1 : E stim ation O f N eed A n d P oten tia l C on trib u tio n O f A ltern ativ es (T rillion C u b ic F eet) T O T A L N E E D = 600 T C F C O N S U M E D + 350 T C F R E S E R V E ~ 950 T C F O n H and D iscovered R em ain in g
P roved 270 G row th 270 – 330 S hortfa ll ~ 350 - 400
F IL L IN G T H E G A P : S O U R C E P O T E N T IA L C O N T R IB U T IO N C u m u la tive 2025 A n n u a l D E M A N D S ID E 20 -Y ear L evel F uel S w itch ing 20 – 40 3
E ffic ien c y 70 8 S U P P L Y S ID E D om estic , N on-trad itio nal A lternatives A laska D isco vered 45 2 -3 U nd iscovered 258
G asifica tion 10 – 40 2 -3
Im ports L N G 20 – 80 4 D om estic T rad itional
S ensitive A reas 115
C onven tional U nd iscovered 650
U ncon ven tional U nd iscov ered 320
S ou rce: N ation a l P etro leu m C ou n cil, B alan c in g N a tu ra l G as P o licy: F u elin g T h e D em an d O f A G row in g E co n om y (S ep tem b er 2 003); A m erican C ou n cil for an E n ergy E ffic ien t E con om y, N atu ra l G as P rice E ffects o f E n ergy E ffic ien cy an d R en ew ab le E n ergy P ractices an d P o lic ies , D ece m b er 2003 , S m art E n ergy P o lic ies , S ep tem b er 2001; C a m b rid ge E n ergy R esearch A ssocia tes, C h artin g a P a th : O p tion s fo r a C h a llen g ed N orth A m erican N a tu ral G as M arket, 2004 .
21
Efficient Economy.52 The projected reduction in demand with aggressive efficiency policiesare just under 25 percent, which is well within the range of what is technologically andeconomically feasible, especially when the full range of options for holding down the use ofgas in the electricity sector are taken into account.53
Fuel switching is based on estimates from CERA.54 Fuel switching potential is nottechnologically constrained, having been higher in the past. Rather, environmental constraintsand sunk investment in capital equipment set the limits. If public policy were to promote fuelswitching (i.e. relax environmental constraints), over time dual fuel capacity would expand ascapital equipment were replaced. The choices of which fuel to burn would then be set byrelative prices. In this respect, a reserve of fuel switching capacity could act as a break onfuture price increases. These observations apply to fuel for heat, not as feedstock.
In this analysis, the supply side domestic resources are based on the recent NPC studyprimarily because it allows us to identify and differentiate specific sources that are policyrelevant. The Department of Energy’s Annual Energy Outlook projects resources about 15percent higher than the NPC. This reflects a difference of opinion about the resource base.
The NPC identified sources of supply in the lower 48 states that it considers to beconstrained by environmental restrictions. We term these sensitive areas. Given their locationand the detailed knowledge of neighboring areas, we assume they would otherwise fall in thecategory of conventional undiscovered resources. Because they are the subject of intensepolicy debate, we treat them separately and therefore have subtracted them from the estimateof conventional undiscovered.
We can also separate out Alaska, which is another critical policy alternative.55 Both theNPC and the DOE assume Alaskan gas becomes available in about a decade. In other words,they assume that an Alaska Natural Gas pipeline will be built.
Two other sources are less conventional but could play an important role. Theworldwide trade in liquefied natural gas is growing rapidly, although it plays a small role inthe U.S. at present.56 Gasification of coal is another possibility.57 The initial facilities will bebuilt to generate electricity, which has been driving increases in natural gas consumption forthe past decade. However, over time, and depending on the price of gas, coal gasificationcould provide gas for other uses. As with Alaskan gas, both LNG and coal gasification are notlikely to make substantial contributions in the near term.
CONCLUSION
This discussion makes it clear that the policy problem is not one of an absoluteshortage, but the choice of sources. Stimulating most of the potential sources would requiresignificant changes in policy to reach their full potential. Moreover, the recent run up in price,and the claims of industry about rising costs and increasing difficulty of finding natural gas,suggest that just relying on discovery of conventional and unconventional sources may be very

22
expensive. In other words, it would appear that policies should be implemented to ensure notonly that our natural gas needs are met, but at affordable prices.
On the other hand, the existence of a range of alternatives and uncertainty about eachsupports the recommendation that detailed consideration of the costs and benefits of thealternatives be considered carefully before policy choices are made. The impact of eachalternative varies substantially across a number of dimensions. For this, we need a policyframework.
23
IV. POLICY FRAMEWORK
COMPREHENSIVE SOLUTIONS MUST REFLECT THE COMPLEXITY OF THE PROBLEM
This brief discussion of the impacts of rising natural gas prices and the review of theuncertainty about the causes of past and the prospects for future price increases makes it clearthat energy in general, and natural gas in particular, must be seen as extremely complex. Itmust be viewed not only as a fuel directly consumed for heat and hot water but also as aninput used for the production of other goods and services. Because it is an input, substitutionor competition between uses takes on special importance. Natural gas (i.e., the methanemolecule) is special among energy raw materials because of the ways in which it is consumed(the demand side) and the way in which it is delivered to consumers (the supply side).
On the demand side, it is extremely versatile. As a fuel, it is used to produce warmthin buildings, to heat water, to cook food, and, increasingly, to generate electricity. To a lesserextent, it is used to power vehicles. As a feedstock, it is used to produce a broad range ofproducts from fertilizers to plastics.
On the supply side, natural gas is very difficult to deliver. Natural gas resources aregenerally located far from where consumption and use take place. Volatile and explosive,methane molecules can only be transported and stored in sealed systems under pressure.Almost all natural gas delivered in the U.S. is produced in North America and delivered bypipeline. Almost all imports of natural gas come from Mexico and Canada and are moved bypipeline. Most analysts believe that liquefied natural gas (LNG) will play a larger role inmeeting U.S. demand in the next several decades. The natural gas resources for LNG will befrom outside North America and require tankers, terminal facilities and pipelines to reachAmerican consumers.
Environmentally, natural gas is the cleanest burning of the fossil fuels. However,drilling poses problems, as with other fossil fuels. In some senses, the transport and deliveryof natural gas pose more severe problems than other fossil fuels because of the volatility of themethane molecules. Yet the impact of natural gas accidents, while more dangerous to humanlife, are less dangerous to the environment. Importation of liquefied natural gas also hassignificant environment impacts because of the need for terminal facilities and pipelinecapacity.
The complexity of the natural gas situation is compounded by the suddenness of therecent price increases and the uncertainty of the causes, or at least the dispute over the causes.
The objective of policy should be to ensure a reliable supply of natural gas that isdelivered in an efficient and equitable manner at affordable prices. Balance is critical to meetthe needs of producers and consumers of natural gas both as a fuel and industrial input; thesedecisions must be made with a watchful eye on environmental impacts.
24
On the supply side, natural gas markets do not appear to be functioning well. Thereare concerns about the price setting mechanism and the ability of price signals to elicitefficient drilling activity. And, there are large environmental and other externalities that affectthe supply side.
On the demand side, there are traditional collective action and externalities problemswith natural gas. Individual decisions by consumers do not reflect the full societal value ofnatural gas. In many cases there is a disconnect between the critical decisions that affectconsumption (building efficiency, new appliance choice) and the actual consumption of gasbecause someone other than the consumer often makes them.
Reliability/security issues are not well reflected in market transactions. The essentialcriteria by which the performance of the natural gas sector has traditionally been measured areits economic and environmental qualities, but in the current context, the issue of reliability hastaken on particular importance. To the extent that reliability was a concern in the past, itfocused on the operation of the system and accidents. Today reliability includes the security offacilities and the threat of disruption of supplies.
The recent concern over natural gas has elicited a wide range of suggested policies.Over two dozen specific policies have been suggested by a variety of groups (see Exhibit IV-1). All would improve the supply-demand balance, but there are important distinctionsbetween them.
• The policies affect different aspects of the natural gas market in different time frames.
• Some policies affect the structure of the market. Others affect the behavior ofproducers and consumers in the market.
• They possess different economic costs and distribute costs and benefits differently.
• They affect the environment and reliability/security differently.
By structural policies, we mean policies that affect or change the options faced byconsumers or producers. For example, an appliance standard that precludes an extremelyinefficient model from being produced or requires a highly efficient model changes the optionsavailable to consumers. Construction of an LNG facility or the Alaska Natural Gas Pipelinewould make a new source of gas available in the market.
By conduct policies, we mean policies that influence the decisions of consumers orproducers to select among options. For example, consumer education might seek to convinceconsumers to purchase a more efficient appliance than has been required by a standard. Aroyalty reduction or a tax break might seek to convince a producer to drill on land he mightotherwise have passed over.
25
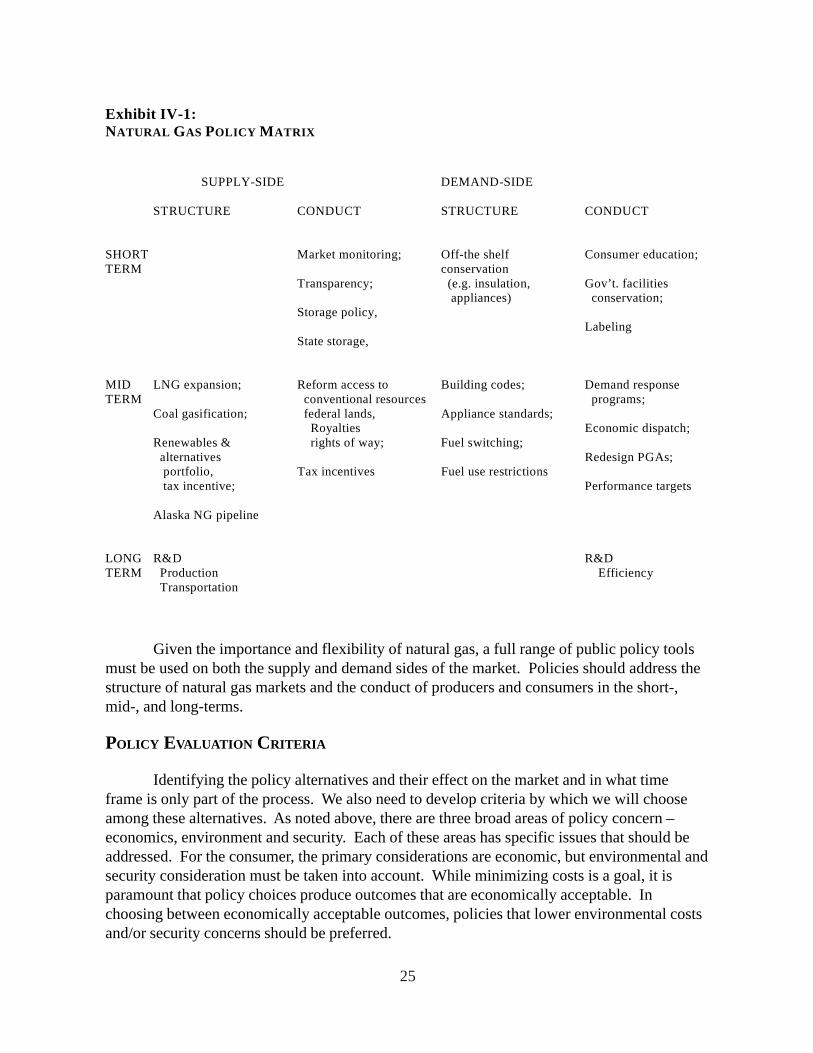
Given the importance and flexibility of natural gas, a full range of public policy toolsmust be used on both the supply and demand sides of the market. Policies should address thestructure of natural gas markets and the conduct of producers and consumers in the short-,mid-, and long-terms.
POLICY EVALUATION CRITERIA
Identifying the policy alternatives and their effect on the market and in what timeframe is only part of the process. We also need to develop criteria by which we will chooseamong these alternatives. As noted above, there are three broad areas of policy concern –economics, environment and security. Each of these areas has specific issues that should beaddressed. For the consumer, the primary considerations are economic, but environmental andsecurity consideration must be taken into account. While minimizing costs is a goal, it isparamount that policy choices produce outcomes that are economically acceptable. Inchoosing between economically acceptable outcomes, policies that lower environmental costsand/or security concerns should be preferred.
Exhibit IV-1: NATURAL GAS POLICY MATRIX SUPPLY-SIDE DEMAND-SIDE STRUCTURE CONDUCT STRUCTURE CONDUCT SHORT Market monitoring; Off-the shelf Consumer education; TERM conservation
Transparency; (e.g. insulation, Gov’t. facilities appliances) conservation;
Storage policy, Labeling
State storage, MID LNG expansion; Reform access to Building codes; Demand response TERM conventional resources programs;
Coal gasification; federal lands, Appliance standards; Royalties Economic dispatch;
Renewables & rights of way; Fuel switching; alternatives Redesign PGAs;
portfolio, Tax incentives Fuel use restrictions tax incentive; Performance targets
Alaska NG pipeline LONG R&D R&D TERM Production Efficiency Transportation
26
Economics
Cost/Benefit: An estimate of the cost to achieve each potential increase in supply ordecrease in demand can be calculated. We prefer policies that meet the need for energy at thelowest cost.
Market Structure: Policies affect the market structure differently. We prefer policiesthat increase the supply and demand elasticity and bring new players into the market topromote competition. For commodities like natural gas, where the elasticity of supply anddemand are low compared to most other goods and services, one aspect of market structurethat receives a great deal of attention is price volatility. Price volatility is disruptive,magnifying the perceived burden on consumers and making it difficult for industrialconsumers to plan their production processes and price their products in markets wherecompetitors have access to natural gas at lower or more stable prices.
Environment
Production (Facility) Footprint: Energy production, transportation and distributionhave environmental impacts. These are frequently conceptualized as external social costs.Relaxation of environmental standards to allow drilling or construction of facilities canimpose those costs on society. We should also keep in mind that supply of natural gas requiresinfrastructure to deliver. That is, if consumption grows by thirty percent, as the base casemodels project, then a substantial increase in pipeline capacity will be needed to deliver thegas to consumers. An alternative that saves on this infrastructure should be preferred.
Consumption: As noted, natural gas is one of the cleaner burning fuels. Nevertheless,the consumption of energy has environmental impacts.
Security
Reliability of operations: Operating pipelines, terminals, and drilling rigs arecomplex and difficult activities. They are subject to accidents and disruptions from weatherand other problems.
Vulnerability of the system: Under current circumstances, intentional acts of sabotageor terror to disrupt the flow of natural gas must be considered.
Dependability of Supply: Some of the policy alternatives are dependent on foreignsources of supply. They may be subject to withdrawal or manipulation. Some sources ofsupply may be uncertain for other reasons such as weather or human behavior.
27
V. FIRST STEPS IN A CONSUMER FRIENDLY APPROACH TONATURAL GAS
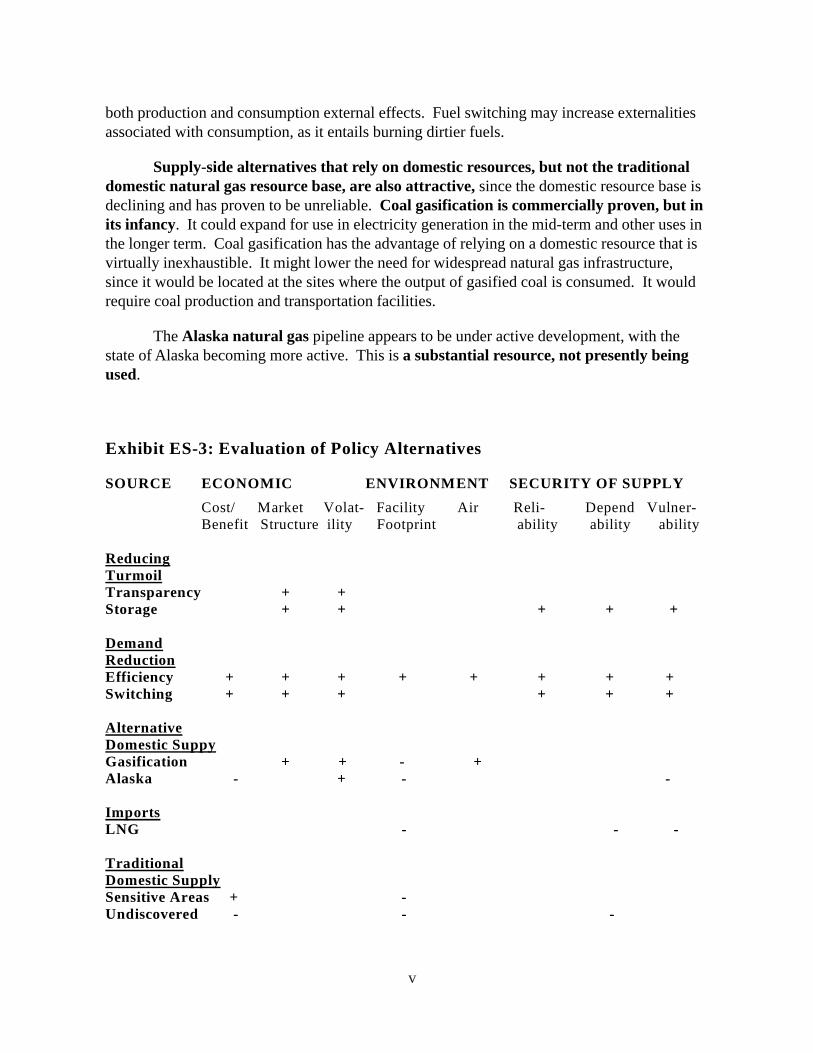
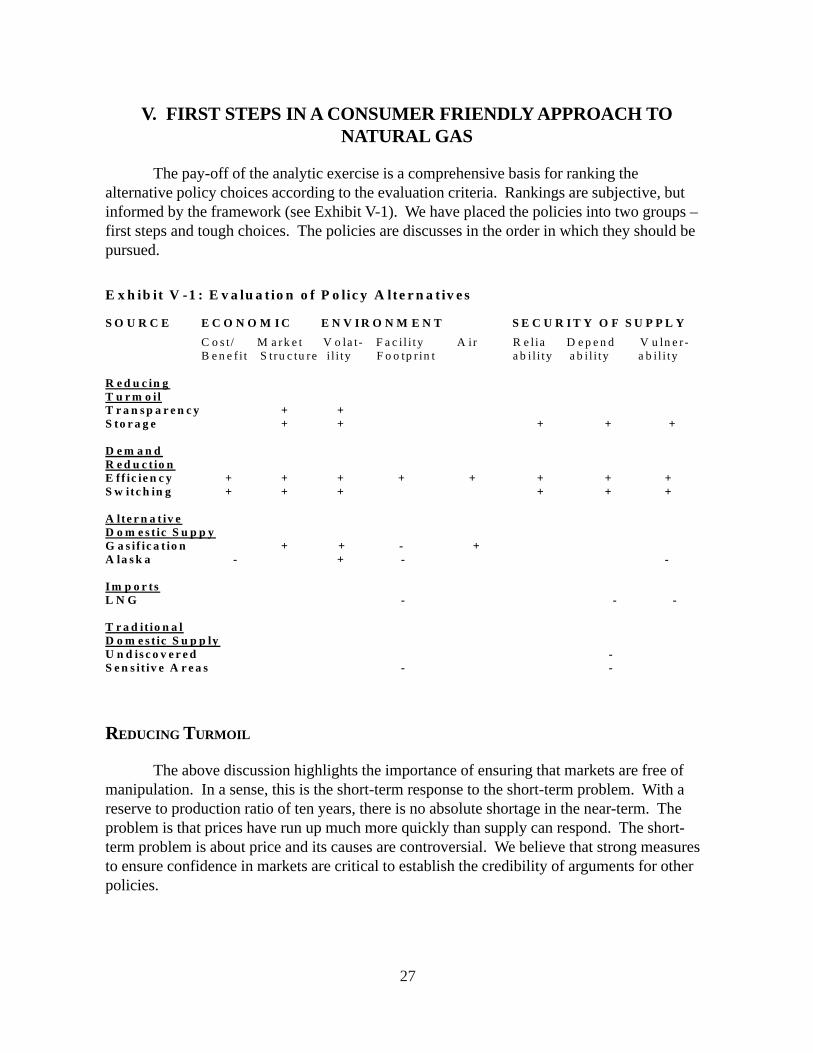
The pay-off of the analytic exercise is a comprehensive basis for ranking thealternative policy choices according to the evaluation criteria. Rankings are subjective, butinformed by the framework (see Exhibit V-1). We have placed the policies into two groups –first steps and tough choices. The policies are discusses in the order in which they should bepursued.
REDUCING TURMOIL
The above discussion highlights the importance of ensuring that markets are free ofmanipulation. In a sense, this is the short-term response to the short-term problem. With areserve to production ratio of ten years, there is no absolute shortage in the near-term. Theproblem is that prices have run up much more quickly than supply can respond. The short-term problem is about price and its causes are controversial. We believe that strong measuresto ensure confidence in markets are critical to establish the credibility of arguments for otherpolicies.
E x h ib it V -1 : E v a lu a t io n o f P o lic y A lte r n a t iv e s S O U R C E E C O N O M I C E N V I R O N M E N T S E C U R I T Y O F S U P P L Y C o s t / M a r k e t V o la t- F a c i l i ty A ir R e l ia D e p e n d V u ln e r - B e n e f i t S t ru c tu re i l i ty F o o tp r in t a b i l i ty a b i l i ty a b i l i ty R e d u c in g T u r m o il T r a n s p a r e n c y + + S to r a g e + + + + + D e m a n d R e d u c t io n E f f ic ie n c y + + + + + + + + S w itc h in g + + + + + + A lte r n a t iv e D o m e s t ic S u p p y G a s if ic a t io n + + - + A la s k a - + - - I m p o r ts L N G - - - T r a d it io n a l D o m e s t ic S u p p ly U n d is c o v e r e d - S e n s it iv e A r e a s - -
28
Two policies that affect market structure and volatility but do not alter the supplydemand balance in the long term are transparency and storage. These policies will notincrease supply or reduce demand, but they could lower prices. They would also establish aprerequisite necessary for other policies – confidence that there is a “hard” problem in theimbalance of supply and demand.
Transparency
From the consumer point of view, market structure and price volatility demand publicpolicy attention in the short term. Since the supply side of the market is uncertain andconcerns about strategic behavior are substantial, policies to ensure transparency of marketsupply and to prevent manipulation of prices should be implemented. The Federal EnergyRegulatory Commission has yet to implement procedures to accomplish this. Reporting oftransactions is still spotty.
Storage
Lack of stockpiles has played a key role in both oil and gas price increases. TheFederal Energy Regulatory Commission has even considered ordering the construction ofpublic storage facilities. Public utility commissions have investigated and could order utilitiesto have stockpile on hand as the peak season approaches.
DEMAND REDUCTION
Efficiency
The most obvious conclusion of the previous discussion is that vigorous efforts toimprove efficiency should be the first, but not the only, policies pursued. Efficiency has apositive impact on almost every one of the evaluation criteria. Its potential to lower prices hasbeen noted. Efficiency has obvious environmental benefits by reducing the need for facilitiesand the consumption of fossil fuels. To the extent that it reduces the need for resources, itimproves security. It could have market structural benefits, if demand is reduced sufficientlyto shift the market equilibrium to a more elastic region of the supply curve, but that is notlikely.
Reducing demand for natural gas by about one quarter of the base level projectioncould be achieved with the implementations of three broad categories of policies – buildingcodes,58 appliance standards,59 and industrial use60 – that essentially accelerate the adoption ofcurrently available best practices or readily achievable savings with off-the-shelf technologies.The potential savings over a longer period are higher. The key challenge is to move higherefficiency products and practices into widespread use. Standards, incentives and educationprograms are the vehicles to do so.61 These discussions do not include the impact of arenewable portfolio standard, which could have a large effect on the electric utility sector.62
Although several states have recently adopted significant renewable standards, 10 to 20percent, the federal government has not.
29
Fuel Switching
The ability to burn alternative fuels was once much more prevalent than it is today. Ithas a cost and reliability profile similar to conservation, with the added benefit that it mayhelp to dampen price volatility. However, to the extent that the alternative fuel is a fossil fuel,it is likely to have a negative environmental impact in terms of air pollution.
These two demand side alternatives could fill about a third of the gap. Since these twosets of policies reduce the level of demand, they also lower the need for reserves to maintainthe reserve to production ratio. Instead of proved reserves of 350 tcf, the industry would needonly 250, roughly the current level.
Nevertheless, several supply-side policies would have to be pursued to fill the gap.
ALTERNATIVE SOURCES OF SUPPLY
Three alternative sources of supply of natural gas – LNG, coal gasification, andAlaskan gas – have received considerable attention. There are two obvious reasons. First, thefact that supplies are tight raises concerns about whether there will be gas available. Second,the dramatic increase in natural gas prices makes these alternatives attractive. Engineering/economic analyses indicate that these alternatives all are economically competitive in therange of $4 to $5 per thousand cubic feet, although each has unique risks or uncertainties.LNG is on the low side,63 and both coal gasification64 and Alaskan gas on the high side.65
Thus, the dramatic rise in prices in the past two years has catapulted the alternatives into thecenter of the debate over sources of supply.
Given the nature of these alternatives, all must be considered mid-term prospects atbest. Permitting and construction lead times mean substantial contributions are likely to takeat least half a decade for LNG and probably a decade for gasification and Alaskan gas.
Coal Gasification
Based on a virtually inexhaustible domestic resource that would bring new suppliersinto the market, coal gasification could be a stabilizing force. The U.S. has been called theSaudi Arabia of coal, with 25 percent of the world’s coal reserves, compared to two or threepercent of its oil reserves. The reserve to production ratio at current levels of consumption isover 250 years, compared to 10 for natural gas. Coal also has the advantage of not havingmany competitive uses – it is largely used for electricity generation, and not a feedstock forindustrial products. As a large facility, gasification plants have negative footprintcharacteristics. However, it has a modestly favorable environmental air quality profile.
Although coal gasification presently is 10 to 20 percent more costly than traditionalcoal, there are two factors that might improve its cost profile.66 Although there are over 100plants around the world,67 it is seen as an unproven technology in America and bears a risk
30
premium. If public policy requires reduction of carbon dioxide emissions, or other majorpollutants, it would have a cost advantage.
Alaskan Gas
Bringing gas to North American markets has a price disadvantage associated with thehigh cost of the pipeline. It also has a large environmental impact because of the facility. Thecost drawback of Alaskan gas lies in the very large capital outlay and long lead time inbuilding the pipeline. Yet it could bring substantial sources of supply to market.
Pursuing the four alternative sources of supply discussed above that are domestic, butnon-traditional, would fill just under half the “shortfall.” They would take a tremendousamount of pressure off of the traditional resource base. The conservation and fuel switchingeffects would alleviate upward pressures on prices, as would the steps to create transparencyand storage capacity.
Imports of Liquefied Natural Gas
Another source of natural gas that does not rely on the traditional resource base is LNGimports. Liquefied natural gas currently accounts for about two percent of consumption, but itis much more widely used on a global scale. Unfortunately, LNG is likely to depend onforeign sources that are controlled by members of the OPEC cartel or suppliers with marketpower. It also does not have environmental or security advantages. The role of LNG willexpand because of the cost of domestic resources, but because it offers little uniqueadvantages, it does not deserve special policy attention.
TRADITIONAL SOURCES OF GAS
Under a policy scenario that pursues the above first steps aggressively, productionfrom the traditional domestic resource base, conventional and unconventional on-shore andoffshore, would have to remain at roughly the current levels to fill the remaining gap.Nevertheless, they still present tough choices. This still leaves a substantial challenge for thesupply side. Looking at domestic production, we find a mix of plusses and minuses.
Undiscovered Resources
Undiscovered resources represent a very large potential, but, by industry accounts, theyare one source of the problem, since they have proved less predictable and more costly thananticipated. Given the recent downward revisions in reserve estimates, we considerundiscovered resources (conventional and unconventional) to pose a dependability problem.Given the projections of the NPC, the unconventional sources appear to be more costly thanthe alternatives. Current prices should elicit sufficient effort to exploit these resources.
31
Sensitive Areas
Drilling in sensitive areas may have a high environmental cost, although we wouldexpect it to be low cost to produce. Whether it would have an effect on price is uncertainbecause of the market structure issues. The same players who dominate the market todaywould be the most likely to develop these resources. We rank drilling in sensitive areas lowestin priority because it represents, at best, be considered to address the mid-term transition toother sources.68
32
ENDNOTES1Concerns about natural gas prices have been expressed for over a year. For residential customers see
“Heating Costs Going Through Roof,” CBS Evening News, Jan. 20, 2004, www.cbsnews.com; Mayer, CarolineE., “The Cost of Keeping Warm: Weather Threatens to Push Heating Bills to New Heights,” The WashingtonPost, January 17, 2004, p. E-1. “Low Temperatures, High Prices,” York Daily Record, January 19, 2004;Hopper, Michael, “Heating Costs Pinch Pockets,” Topeka Capital-Journal, January 18, 2004; Power, Meg,Energy Bills of Low-Income Consumers in FY 2005 (Washington: Economic Opportunity Studies, November23, 2004). For industrial customers,the Industrial Energy Consumers of America raised the issue in December2003 (see 41 Month Natural Gas Crisis Has Cost U.S. Consumers $111 Billion, Washington, December 3,2003) and December 2004 (Consumers Ask FERC to Expedite Daily Natural Gas Storage Reporting –November 24 EIA Report Cost Consumers as much as $1.0 Billion, December 2004). Ironically, the data thatled to the price spike was incorrectly reported (see Beattie, Jeff, “EIA Gas Data Goof Triggers MarketMisfire,” Energy Daily, December 3, 2004).
2 Energy Information Administration, Winter Fuels Outlook: 2004-2005 (Washington: Department ofEnergy, October 2004)
3 Energy Information Administration, Natural Gas, Data Base; Winter Energy Outlook, various issues.4 Cooper, Mark, Susan Punnett, and Theodore Sullivan, Equity and Energy: Rising Energy Prices and
the Living Standards of Low Income Americans (Boulder: Westview Press, 1982).5 Even The Wall Street Journal recently discovered the regressive nature of energy price increases in a
column with the headline “To Have and Have Not,” (Lahart, Justin, September 23, 2004, C-1).Beltway types can argue all they like over what the divide between rich and poor is doing. But thereis little doubt that the gulf between the retailers that sell to America’s hoity-toity and those that sell tothe hoi polloi is growing…So why is Joe Six-Pack in so much less of a spending mood than Joe Millionaire?A big reason is that high fuel costs affect middle-income and low-income families more than theyhurt the upper echelons. For 2001, the Transportation Department found that households earning$30,000 to $39,999 went through 1054 gallons of gasoline. At $1.33 a gallon, say, that would beabout $1,402. Households earning more than $100,000 went through 1558 gallons. That is moregasoline, but it represented a far small portion of their income – less than 2% compared with about4%.
6 A discussion on the difficulty of cutting back on energy consumption in the short term is provided byHunt, Lester and Neil Manning, “Energy Price and Income Elasticities of Demand: Some Estimates for the UKUsing the Cointegration Procedure,” Scottish Journal of Political Economy, May 1989, pp. 189-190.
Our results suggest the long-run income-elasticity of energy demand is around .4 and .5, whereas theshort-run (impact) income elasticity is around .6 to .8. The affect of a change in income on energydemand is, therefore, greater in the short-run than in the long run. This may follow from theinflexibility of firms’ and households’ energy-using capital and appliance stocks in the short-run; anincrease in income will, therefore bring about an immediate decrease in the derived demand forenergy in the short-term, but this derived demand is reduced in the longer term as more energyefficient machines are installed.The long-run price elasticity of energy demand estimate is approximately -.3 and the short-run(impact) elasticity approximately -.1. Therefore, the effect of a change in the real price of energy isless in the short-run than in the long-run which is in contrast to the above case for income changes.This may also reflect the fixed nature of the machine and appliance stocks in that a rise in the realprice of energy produces a modest fall in energy consumption in the short-term. Energy consumptionfalls further in the longer-term, however, as the price increase induces the installation of more energyefficient domestic appliances and capital goods.
7 Taylor, Lester, Telecommunications Demand: A Survey and Critique (Cambridge, MA: MIT Press,1980), p. 82), describes another necessity, telephone service, as follows:
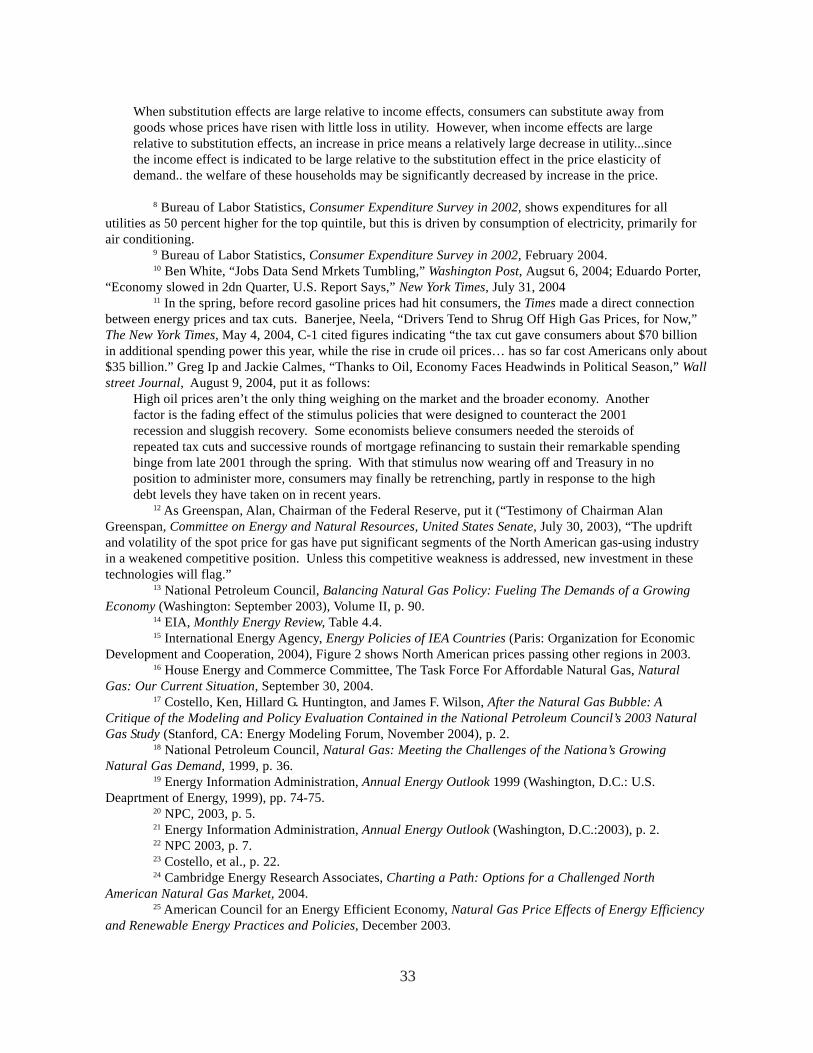
33
When substitution effects are large relative to income effects, consumers can substitute away fromgoods whose prices have risen with little loss in utility. However, when income effects are largerelative to substitution effects, an increase in price means a relatively large decrease in utility...sincethe income effect is indicated to be large relative to the substitution effect in the price elasticity ofdemand.. the welfare of these households may be significantly decreased by increase in the price.
8 Bureau of Labor Statistics, Consumer Expenditure Survey in 2002, shows expenditures for allutilities as 50 percent higher for the top quintile, but this is driven by consumption of electricity, primarily forair conditioning.
9 Bureau of Labor Statistics, Consumer Expenditure Survey in 2002, February 2004.10 Ben White, “Jobs Data Send Mrkets Tumbling,” Washington Post, Augsut 6, 2004; Eduardo Porter,
“Economy slowed in 2dn Quarter, U.S. Report Says,” New York Times, July 31, 200411 In the spring, before record gasoline prices had hit consumers, the Times made a direct connection
between energy prices and tax cuts. Banerjee, Neela, “Drivers Tend to Shrug Off High Gas Prices, for Now,”The New York Times, May 4, 2004, C-1 cited figures indicating “the tax cut gave consumers about $70 billionin additional spending power this year, while the rise in crude oil prices… has so far cost Americans only about$35 billion.” Greg Ip and Jackie Calmes, “Thanks to Oil, Economy Faces Headwinds in Political Season,” Wallstreet Journal, August 9, 2004, put it as follows:
High oil prices aren’t the only thing weighing on the market and the broader economy. Anotherfactor is the fading effect of the stimulus policies that were designed to counteract the 2001recession and sluggish recovery. Some economists believe consumers needed the steroids ofrepeated tax cuts and successive rounds of mortgage refinancing to sustain their remarkable spendingbinge from late 2001 through the spring. With that stimulus now wearing off and Treasury in noposition to administer more, consumers may finally be retrenching, partly in response to the highdebt levels they have taken on in recent years.
12 As Greenspan, Alan, Chairman of the Federal Reserve, put it (“Testimony of Chairman AlanGreenspan, Committee on Energy and Natural Resources, United States Senate, July 30, 2003), “The updriftand volatility of the spot price for gas have put significant segments of the North American gas-using industryin a weakened competitive position. Unless this competitive weakness is addressed, new investment in thesetechnologies will flag.”
13 National Petroleum Council, Balancing Natural Gas Policy: Fueling The Demands of a GrowingEconomy (Washington: September 2003), Volume II, p. 90.
14 EIA, Monthly Energy Review, Table 4.4.15 International Energy Agency, Energy Policies of IEA Countries (Paris: Organization for Economic
Development and Cooperation, 2004), Figure 2 shows North American prices passing other regions in 2003.16 House Energy and Commerce Committee, The Task Force For Affordable Natural Gas, Natural
Gas: Our Current Situation, September 30, 2004.17 Costello, Ken, Hillard G. Huntington, and James F. Wilson, After the Natural Gas Bubble: A
Critique of the Modeling and Policy Evaluation Contained in the National Petroleum Council’s 2003 NaturalGas Study (Stanford, CA: Energy Modeling Forum, November 2004), p. 2.
18 National Petroleum Council, Natural Gas: Meeting the Challenges of the Nationa’s GrowingNatural Gas Demand, 1999, p. 36.
19 Energy Information Administration, Annual Energy Outlook 1999 (Washington, D.C.: U.S.Deaprtment of Energy, 1999), pp. 74-75.
20 NPC, 2003, p. 5.21 Energy Information Administration, Annual Energy Outlook (Washington, D.C.:2003), p. 2.22 NPC 2003, p. 7.23 Costello, et al., p. 22.24 Cambridge Energy Research Associates, Charting a Path: Options for a Challenged North
American Natural Gas Market, 2004.25 American Council for an Energy Efficient Economy, Natural Gas Price Effects of Energy Efficiency
and Renewable Energy Practices and Policies, December 2003.
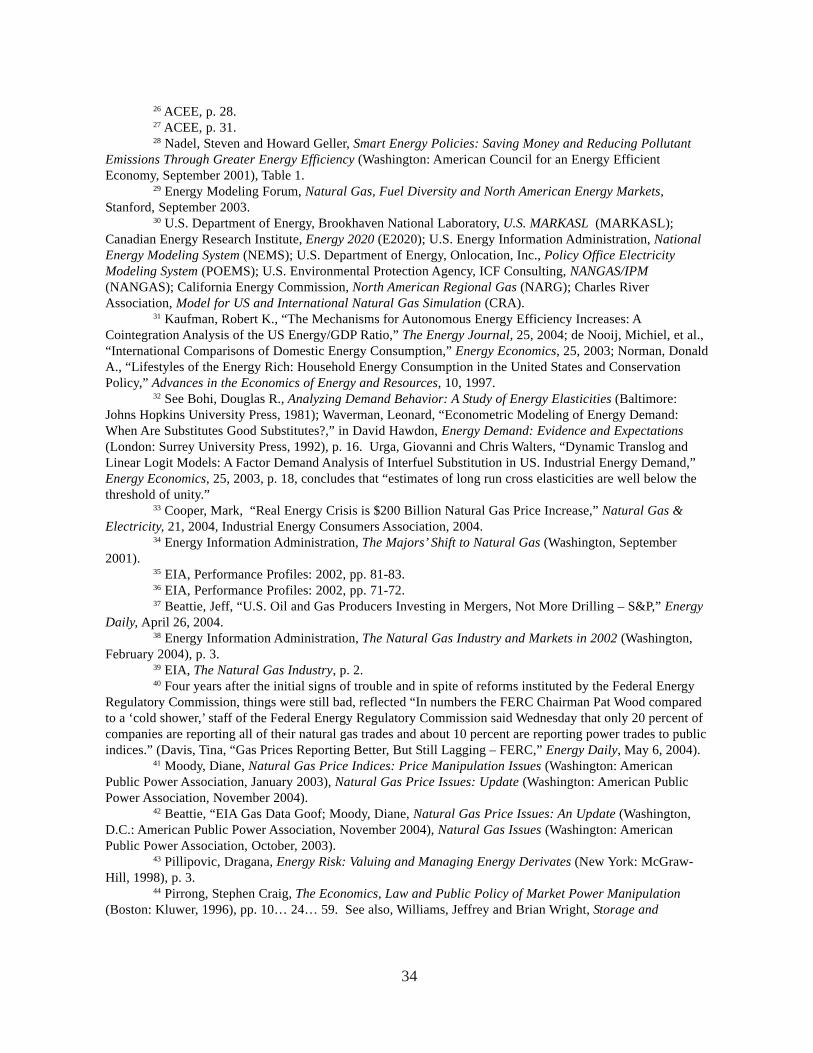
34
26 ACEE, p. 28.27 ACEE, p. 31.28 Nadel, Steven and Howard Geller, Smart Energy Policies: Saving Money and Reducing Pollutant
Emissions Through Greater Energy Efficiency (Washington: American Council for an Energy EfficientEconomy, September 2001), Table 1.
29 Energy Modeling Forum, Natural Gas, Fuel Diversity and North American Energy Markets,Stanford, September 2003.
30 U.S. Department of Energy, Brookhaven National Laboratory, U.S. MARKASL (MARKASL);Canadian Energy Research Institute, Energy 2020 (E2020); U.S. Energy Information Administration, NationalEnergy Modeling System (NEMS); U.S. Department of Energy, Onlocation, Inc., Policy Office ElectricityModeling System (POEMS); U.S. Environmental Protection Agency, ICF Consulting, NANGAS/IPM(NANGAS); California Energy Commission, North American Regional Gas (NARG); Charles RiverAssociation, Model for US and International Natural Gas Simulation (CRA).
31 Kaufman, Robert K., “The Mechanisms for Autonomous Energy Efficiency Increases: ACointegration Analysis of the US Energy/GDP Ratio,” The Energy Journal, 25, 2004; de Nooij, Michiel, et al.,“International Comparisons of Domestic Energy Consumption,” Energy Economics, 25, 2003; Norman, DonaldA., “Lifestyles of the Energy Rich: Household Energy Consumption in the United States and ConservationPolicy,” Advances in the Economics of Energy and Resources, 10, 1997.
32 See Bohi, Douglas R., Analyzing Demand Behavior: A Study of Energy Elasticities (Baltimore:Johns Hopkins University Press, 1981); Waverman, Leonard, “Econometric Modeling of Energy Demand:When Are Substitutes Good Substitutes?,” in David Hawdon, Energy Demand: Evidence and Expectations(London: Surrey University Press, 1992), p. 16. Urga, Giovanni and Chris Walters, “Dynamic Translog andLinear Logit Models: A Factor Demand Analysis of Interfuel Substitution in US. Industrial Energy Demand,”Energy Economics, 25, 2003, p. 18, concludes that “estimates of long run cross elasticities are well below thethreshold of unity.”
33 Cooper, Mark, “Real Energy Crisis is $200 Billion Natural Gas Price Increase,” Natural Gas &Electricity, 21, 2004, Industrial Energy Consumers Association, 2004.
34 Energy Information Administration, The Majors’ Shift to Natural Gas (Washington, September2001).
35 EIA, Performance Profiles: 2002, pp. 81-83.36 EIA, Performance Profiles: 2002, pp. 71-72.37 Beattie, Jeff, “U.S. Oil and Gas Producers Investing in Mergers, Not More Drilling – S&P,” Energy
Daily, April 26, 2004.38 Energy Information Administration, The Natural Gas Industry and Markets in 2002 (Washington,
February 2004), p. 3.39 EIA, The Natural Gas Industry, p. 2.40 Four years after the initial signs of trouble and in spite of reforms instituted by the Federal Energy
Regulatory Commission, things were still bad, reflected “In numbers the FERC Chairman Pat Wood comparedto a ‘cold shower,’ staff of the Federal Energy Regulatory Commission said Wednesday that only 20 percent ofcompanies are reporting all of their natural gas trades and about 10 percent are reporting power trades to publicindices.” (Davis, Tina, “Gas Prices Reporting Better, But Still Lagging – FERC,” Energy Daily, May 6, 2004).
41 Moody, Diane, Natural Gas Price Indices: Price Manipulation Issues (Washington: AmericanPublic Power Association, January 2003), Natural Gas Price Issues: Update (Washington: American PublicPower Association, November 2004).
42 Beattie, “EIA Gas Data Goof; Moody, Diane, Natural Gas Price Issues: An Update (Washington,D.C.: American Public Power Association, November 2004), Natural Gas Issues (Washington: AmericanPublic Power Association, October, 2003).
43 Pillipovic, Dragana, Energy Risk: Valuing and Managing Energy Derivates (New York: McGraw-Hill, 1998), p. 3.
44 Pirrong, Stephen Craig, The Economics, Law and Public Policy of Market Power Manipulation(Boston: Kluwer, 1996), pp. 10… 24… 59. See also, Williams, Jeffrey and Brian Wright, Storage and
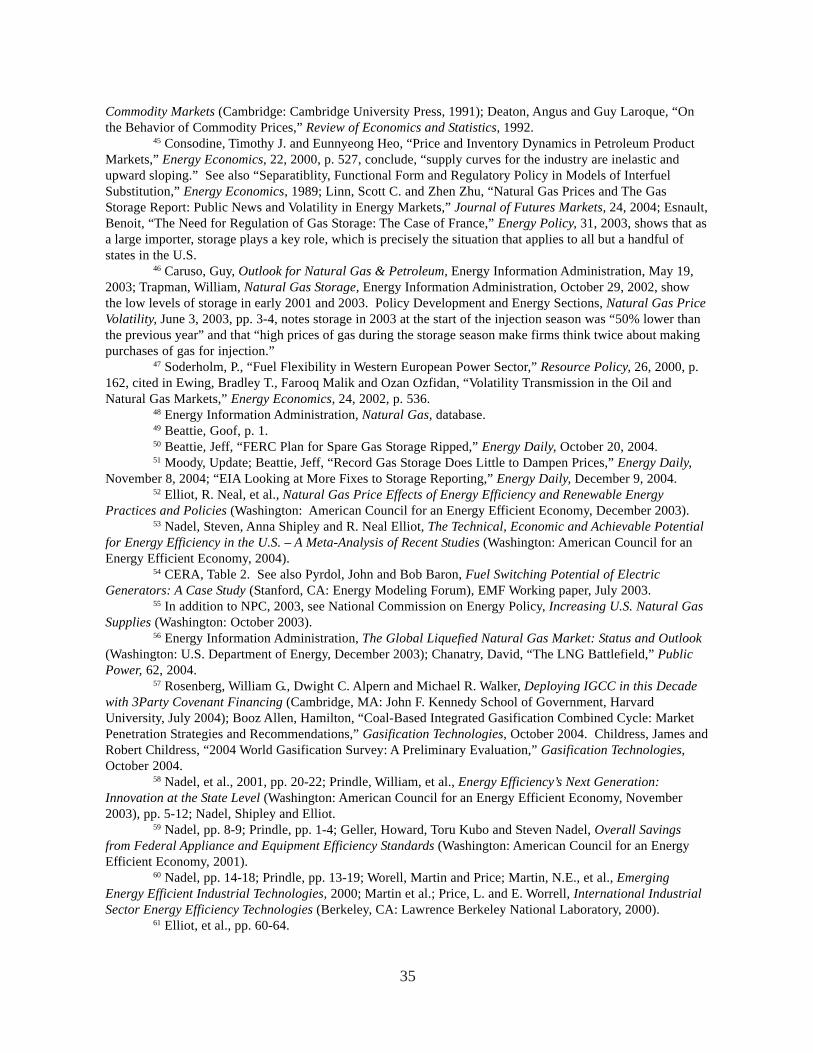
35
Commodity Markets (Cambridge: Cambridge University Press, 1991); Deaton, Angus and Guy Laroque, “Onthe Behavior of Commodity Prices,” Review of Economics and Statistics, 1992.
45 Consodine, Timothy J. and Eunnyeong Heo, “Price and Inventory Dynamics in Petroleum ProductMarkets,” Energy Economics, 22, 2000, p. 527, conclude, “supply curves for the industry are inelastic andupward sloping.” See also “Separatiblity, Functional Form and Regulatory Policy in Models of InterfuelSubstitution,” Energy Economics, 1989; Linn, Scott C. and Zhen Zhu, “Natural Gas Prices and The GasStorage Report: Public News and Volatility in Energy Markets,” Journal of Futures Markets, 24, 2004; Esnault,Benoit, “The Need for Regulation of Gas Storage: The Case of France,” Energy Policy, 31, 2003, shows that asa large importer, storage plays a key role, which is precisely the situation that applies to all but a handful ofstates in the U.S.
46 Caruso, Guy, Outlook for Natural Gas & Petroleum, Energy Information Administration, May 19,2003; Trapman, William, Natural Gas Storage, Energy Information Administration, October 29, 2002, showthe low levels of storage in early 2001 and 2003. Policy Development and Energy Sections, Natural Gas PriceVolatility, June 3, 2003, pp. 3-4, notes storage in 2003 at the start of the injection season was “50% lower thanthe previous year” and that “high prices of gas during the storage season make firms think twice about makingpurchases of gas for injection.”
47 Soderholm, P., “Fuel Flexibility in Western European Power Sector,” Resource Policy, 26, 2000, p.162, cited in Ewing, Bradley T., Farooq Malik and Ozan Ozfidan, “Volatility Transmission in the Oil andNatural Gas Markets,” Energy Economics, 24, 2002, p. 536.
48 Energy Information Administration, Natural Gas, database.49 Beattie, Goof, p. 1.50 Beattie, Jeff, “FERC Plan for Spare Gas Storage Ripped,” Energy Daily, October 20, 2004.51 Moody, Update; Beattie, Jeff, “Record Gas Storage Does Little to Dampen Prices,” Energy Daily,
November 8, 2004; “EIA Looking at More Fixes to Storage Reporting,” Energy Daily, December 9, 2004.52 Elliot, R. Neal, et al., Natural Gas Price Effects of Energy Efficiency and Renewable Energy
Practices and Policies (Washington: American Council for an Energy Efficient Economy, December 2003).53 Nadel, Steven, Anna Shipley and R. Neal Elliot, The Technical, Economic and Achievable Potential
for Energy Efficiency in the U.S. – A Meta-Analysis of Recent Studies (Washington: American Council for anEnergy Efficient Economy, 2004).
54 CERA, Table 2. See also Pyrdol, John and Bob Baron, Fuel Switching Potential of ElectricGenerators: A Case Study (Stanford, CA: Energy Modeling Forum), EMF Working paper, July 2003.
55 In addition to NPC, 2003, see National Commission on Energy Policy, Increasing U.S. Natural GasSupplies (Washington: October 2003).
56 Energy Information Administration, The Global Liquefied Natural Gas Market: Status and Outlook(Washington: U.S. Department of Energy, December 2003); Chanatry, David, “The LNG Battlefield,” PublicPower, 62, 2004.
57 Rosenberg, William G., Dwight C. Alpern and Michael R. Walker, Deploying IGCC in this Decadewith 3Party Covenant Financing (Cambridge, MA: John F. Kennedy School of Government, HarvardUniversity, July 2004); Booz Allen, Hamilton, “Coal-Based Integrated Gasification Combined Cycle: MarketPenetration Strategies and Recommendations,” Gasification Technologies, October 2004. Childress, James andRobert Childress, “2004 World Gasification Survey: A Preliminary Evaluation,” Gasification Technologies,October 2004.
58 Nadel, et al., 2001, pp. 20-22; Prindle, William, et al., Energy Efficiency’s Next Generation:Innovation at the State Level (Washington: American Council for an Energy Efficient Economy, November2003), pp. 5-12; Nadel, Shipley and Elliot.
59 Nadel, pp. 8-9; Prindle, pp. 1-4; Geller, Howard, Toru Kubo and Steven Nadel, Overall Savingsfrom Federal Appliance and Equipment Efficiency Standards (Washington: American Council for an EnergyEfficient Economy, 2001).
60 Nadel, pp. 14-18; Prindle, pp. 13-19; Worell, Martin and Price; Martin, N.E., et al., EmergingEnergy Efficient Industrial Technologies, 2000; Martin et al.; Price, L. and E. Worrell, International IndustrialSector Energy Efficiency Technologies (Berkeley, CA: Lawrence Berkeley National Laboratory, 2000).
61 Elliot, et al., pp. 60-64.

36
62 Elliot, et al., pp. 49-60, Nogge, Alan, et al., Powerful Solutions: 7 Ways to Switch America toRenewable Electricity (Cambridge, MA: Union of Concerned Scientists, 1999).
63 CERA, Charting, p. 20, suggests a minimum price of $3.50 to make LNG competitive, but EIA,Global, pp. 42-48, suggests a somewhat higher price.
64 Rosenberg, et al. p. 3.65 National Commission on Energy Policy, pp. 6-7.66 Rosenberg; p. 3.67 Childress and Childress.68 Environmental Working Group, Big Access, Little Energy – The Oil and Gas Industry’s Hold on
Western Lands, August 2004, questions whether lifting environmental restrictions will have a substantialimpact on reserves and production.
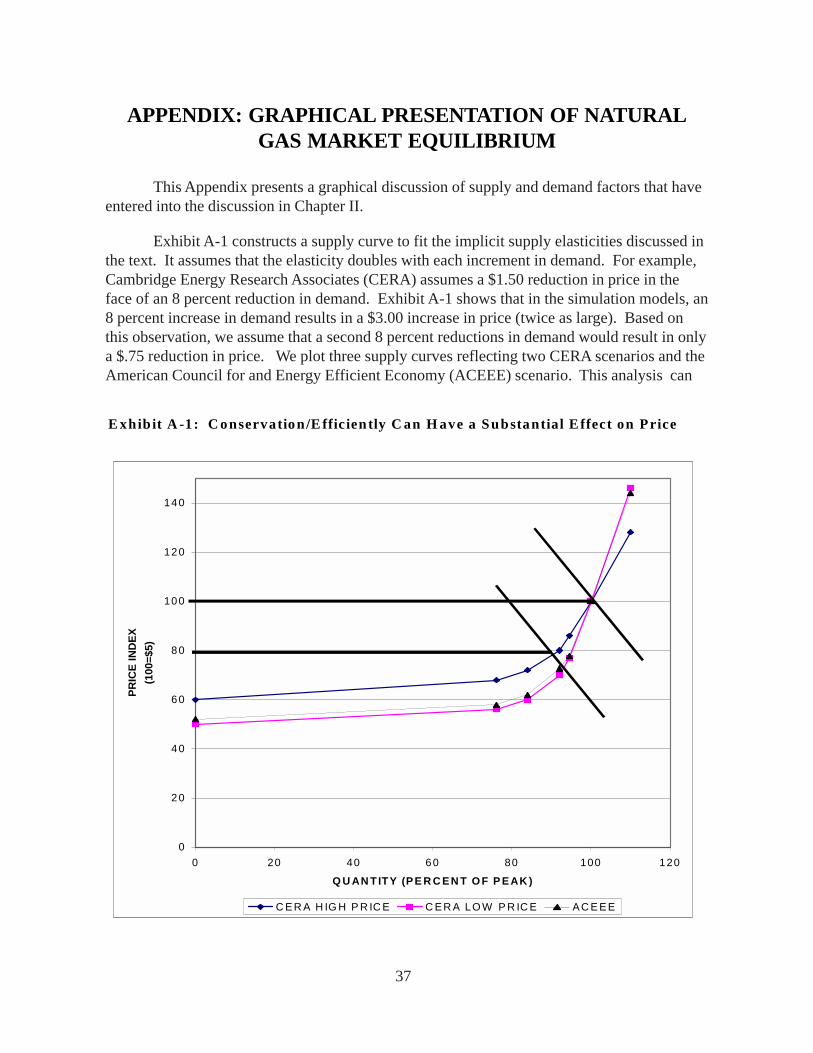
37
APPENDIX: GRAPHICAL PRESENTATION OF NATURALGAS MARKET EQUILIBRIUM
This Appendix presents a graphical discussion of supply and demand factors that haveentered into the discussion in Chapter II.
Exhibit A-1 constructs a supply curve to fit the implicit supply elasticities discussed inthe text. It assumes that the elasticity doubles with each increment in demand. For example,Cambridge Energy Research Associates (CERA) assumes a $1.50 reduction in price in theface of an 8 percent reduction in demand. Exhibit A-1 shows that in the simulation models, an8 percent increase in demand results in a $3.00 increase in price (twice as large). Based onthis observation, we assume that a second 8 percent reductions in demand would result in onlya $.75 reduction in price. We plot three supply curves reflecting two CERA scenarios and theAmerican Council for and Energy Efficient Economy (ACEEE) scenario. This analysis can
E xhib it A -1 : C onservation/E fficiently C an H ave a Substantial E ffect on Price
0
20
40
60
80
100
120
140
0 20 40 60 80 100 120
Q U AN TITY (P E R C E N T O F P E AK )
PRIC
E IN
DEX
(100
=$5)
C E R A H IG H P R IC E C E R A LO W P R IC E A C E E E
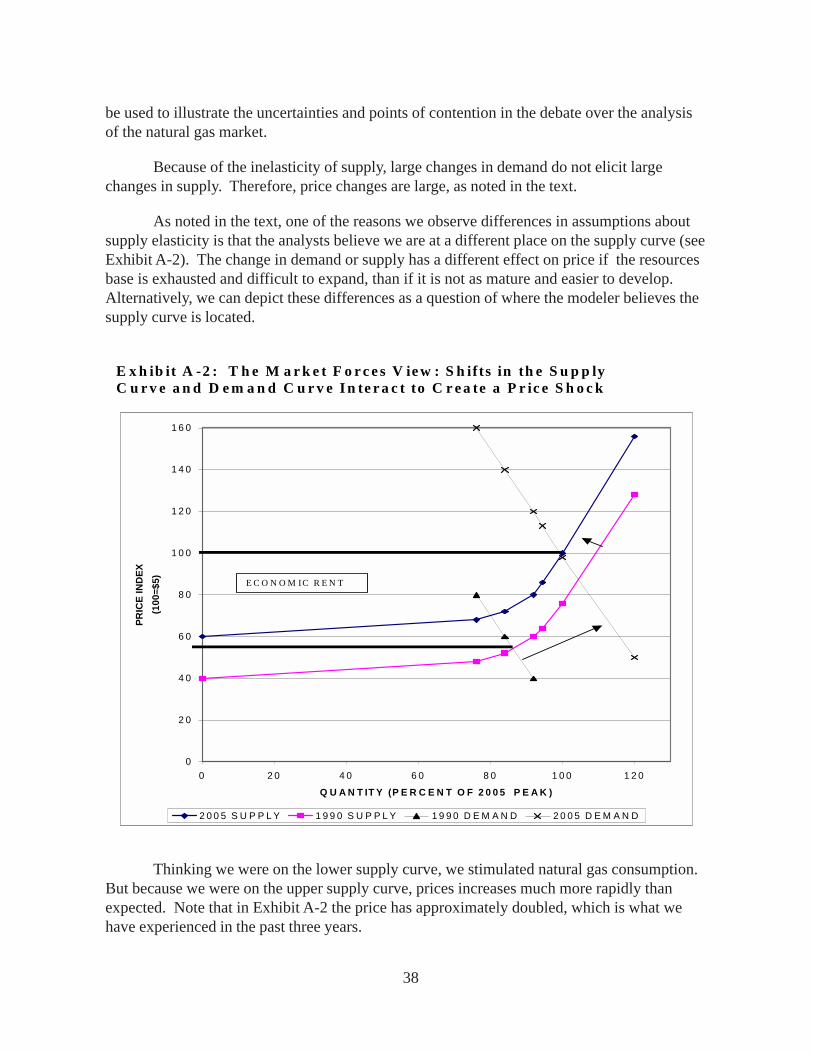
38
E x h ib it A -2 : T h e M a r k e t F o r c e s V ie w : S h if ts in th e S u p p ly C u r v e a n d D e m a n d C u r v e I n te r a c t to C r e a te a P r ic e S h o c k
0
2 0
4 0
6 0
8 0
1 0 0
1 2 0
1 4 0
1 6 0
0 2 0 4 0 6 0 8 0 1 0 0 1 2 0
Q U A N T IT Y (P E R C E N T O F 2 0 0 5 P E A K )
PRIC
E IN
DEX
(100
=$5)
2 0 0 5 S U P P L Y 1 9 9 0 S U P P L Y 1 9 9 0 D E M A N D 2 0 0 5 D E M A N D
E C O N O M IC R E N T
be used to illustrate the uncertainties and points of contention in the debate over the analysisof the natural gas market.
Because of the inelasticity of supply, large changes in demand do not elicit largechanges in supply. Therefore, price changes are large, as noted in the text.
As noted in the text, one of the reasons we observe differences in assumptions aboutsupply elasticity is that the analysts believe we are at a different place on the supply curve (seeExhibit A-2). The change in demand or supply has a different effect on price if the resourcesbase is exhausted and difficult to expand, than if it is not as mature and easier to develop.Alternatively, we can depict these differences as a question of where the modeler believes thesupply curve is located.
Thinking we were on the lower supply curve, we stimulated natural gas consumption.But because we were on the upper supply curve, prices increases much more rapidly thanexpected. Note that in Exhibit A-2 the price has approximately doubled, which is what wehave experienced in the past three years.
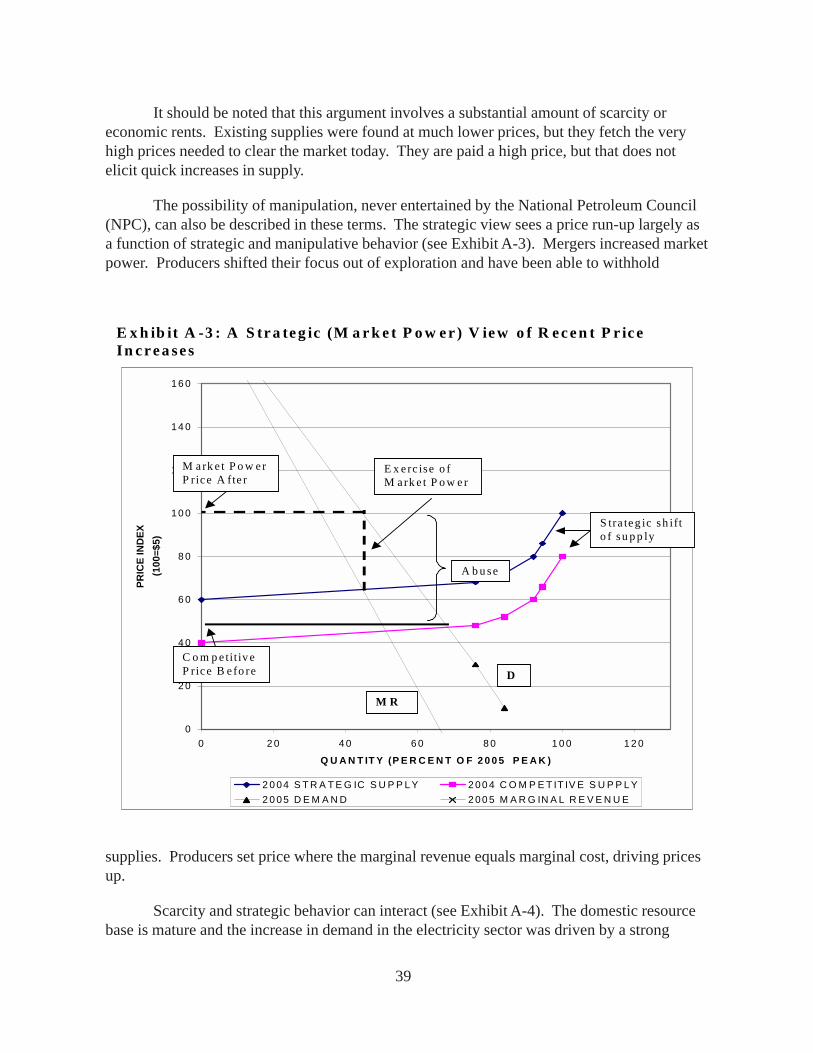
39
E x h ib it A -3 : A S tr a te g ic (M a r k e t P o w e r ) V ie w o f R e c e n t P r ic e In c r e a se s
0
2 0
4 0
6 0
8 0
10 0
12 0
14 0
16 0
0 2 0 4 0 6 0 8 0 1 0 0 1 2 0
Q U A N T IT Y (P E R C E N T O F 2 0 0 5 P E A K )
PRIC
E IN
DEX
(1
00=$
5)
2 0 04 S T R A T E G IC S U P P L Y 2 00 4 C O M P E T IT IV E S U P P L Y2 0 05 D E M A N D 2 00 5 M A R G IN A L R E V E N U E
C o m p e tit iv e P rice B e fo re
M ark e t P o w er P rice A fte r
S tra teg ic sh ift o f su p p ly
E x e rc ise o f M ark e t P o w e r
A b u se
D
M R
It should be noted that this argument involves a substantial amount of scarcity oreconomic rents. Existing supplies were found at much lower prices, but they fetch the veryhigh prices needed to clear the market today. They are paid a high price, but that does notelicit quick increases in supply.
The possibility of manipulation, never entertained by the National Petroleum Council(NPC), can also be described in these terms. The strategic view sees a price run-up largely asa function of strategic and manipulative behavior (see Exhibit A-3). Mergers increased marketpower. Producers shifted their focus out of exploration and have been able to withhold
supplies. Producers set price where the marginal revenue equals marginal cost, driving pricesup.
Scarcity and strategic behavior can interact (see Exhibit A-4). The domestic resourcebase is mature and the increase in demand in the electricity sector was driven by a strong
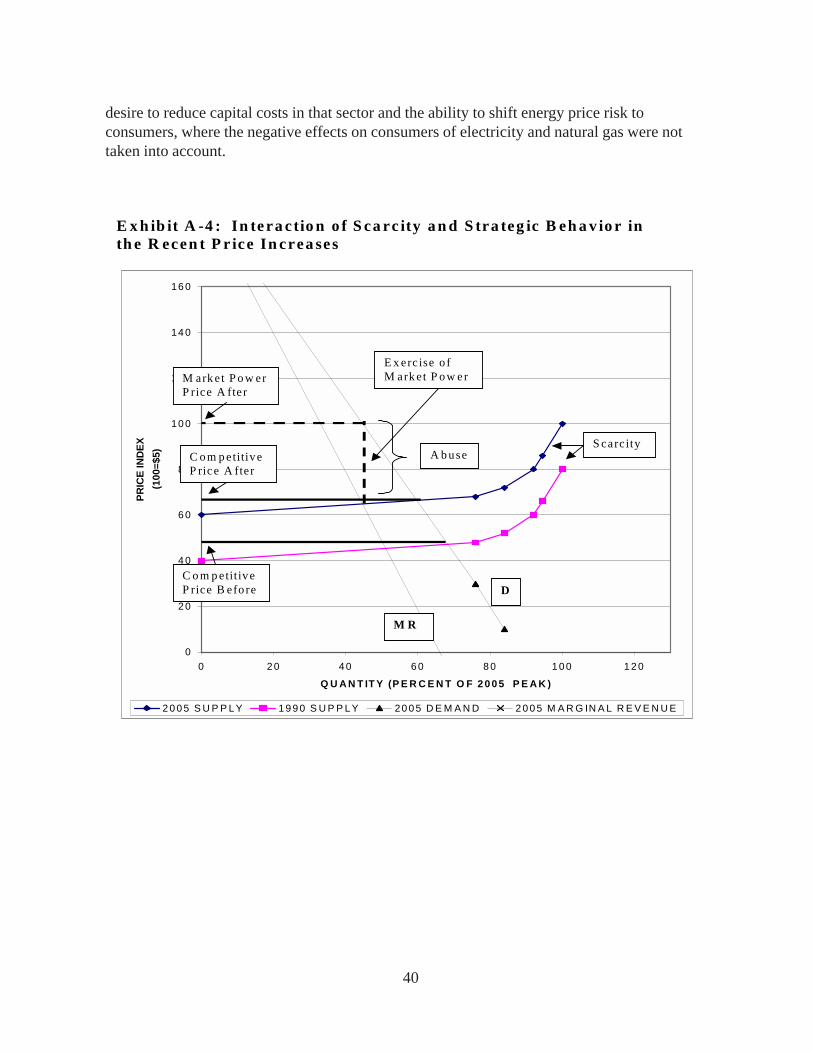
40
E x h ib it A -4 : In te ra ctio n o f S ca rc ity a n d S tra teg ic B eh a v io r in th e R ecen t P r ice In crea se s
0
2 0
4 0
6 0
8 0
10 0
12 0
14 0
16 0
0 2 0 4 0 6 0 8 0 1 0 0 1 2 0
Q U A N T IT Y (P E R C E N T O F 2 0 0 5 P E A K )
PRIC
E IN
DEX
(100
=$5)
2 0 0 5 S U P P L Y 1 9 9 0 S U P P L Y 20 0 5 D E M A N D 2 0 0 5 M A R G IN A L R E V E N U E
C o m p etitive P rice B efo re
M ark e t P o w er P rice A fte r
C om p etitive P rice A fte r
S carc ity A b use
E x erc ise o f M ark e t P ow er
D
M R
desire to reduce capital costs in that sector and the ability to shift energy price risk toconsumers, where the negative effects on consumers of electricity and natural gas were nottaken into account.