Embed Size (px)
Citation preview
Response Action Objectives Associated Information: Attachment 1A, 1B
RAP Worksheet 1.0 WS1.0 - Page 1 of 44
ID No.: SWR No. 31235 Report Date: August 2016
Use this worksheet to describe the objectives for the response action in each media. Response Action Objectives List the environmental media to which this applies Soil, Groundwater, Surface Water and
Stormwater Repeat this section for each medium that has a different response action objective. State the property-specific response objectives for the protective concentration level exceedence (PCLE) zone in each media in the context of the response objectives set forth in §350.32 or §350.33 as applicable. Explain how the response action is appropriate based on the hydrogeologic characteristics, Chemicals of concern (COCs) characteristics, and potential unprotective conditions that could continue or result during the remedial period.
Remedial Objectives
The overall response objectives are to achieve a Remedy Standard B closure for each of the affected media at the Site. Site soil and groundwater have been affected by metals, principally arsenic, cadmium, chromium, copper, lead, mercury, selenium, and zinc, from either disposal of site-related process material and slag or aerial deposition of metals to surface soil from stack emissions and/or fugitive dusts from slag crushing operations associated with operations of the Site for over 100 years. To achieve closure, the Response Action Plan (RAP) addresses the following:
1. Prevention of direct exposure to soil and groundwater with COC concentrations above their respective TotSoilComb and GWGWIng PCLs through a combination of removals (soil excavations and groundwater extraction), treatment alternatives [permeable reactive barriers (PRBs) and monitored natural attenuation (MNA)], physical controls (caps), and institutional controls (restrictions on land and groundwater use, cap maintenance, etc.).
2. Construction of a lined landfill cell (Cell 4) for placement of Category I material. Cell 4 will be considered a waste control unit (WCU).
3. Control of sources of contamination to groundwater through excavation and placement of identified Category I material into the Cell 4 WCU, capping soil and lining drainages where Category II materials are present [Category II Material Storage Area, plant site arroyos, Fines Pile, Boneyard, Ephemeral Pond, and lower Parker Brothers Arroyo (PBA) channel], and modification of the groundwater gradient (through extraction of clean groundwater from a location upgradient of affected on-site soil and groundwater.)
4. Control of discharge of COCs to the Rio Grande by modification of the hydraulic gradient through the placement of a variety of low permeability covers at locations throughout the plant site Assessment Areas (AAs) and through extraction of groundwater from a location upgradient of the PBA.
5. Prevention of future discharge of sediment entrained in stormwater by detaining stormwater runoff on site in retention ponds; removing slag from the PBA channel and installing a liner and stabilization system; and constructing gabion structures in the East Mountain AA and stormwater best management practices (BMPs) in the upper portion of the PBA AA to control sediment entrainment in stormwater runoff.
Due to its complexity, a description of the Site is provided below, prior to the description of the
G:\ENV\ENV\PROJ\1200\1209 - MP - El Paso Smelter\Response Action Plan\RAP August 2016\RAPr1 Worksheet 1.doc
Response Action Objectives Associated Information: Attachment 1A, 1B
RAP Worksheet 1.0 WS1.0 - Page 2 of 44
ID No.: SWR No. 31235 Report Date: August 2016
PCLE zones in each media and the associated response actions. Additionally, a detailed description of the site operational history, regulatory history, and affected property (including identification of the 10 AAs at the Site) is presented in the Site Background section of the Executive Summary.
Site Description
The Site is located in El Paso, Texas, on the north side of downtown adjacent to the Rio Grande as illustrated on Figure 1. The Affected Property Area is shown on Figure 1 in Attachment 1A. The Site has ten AAs that are largely defined by the arroyo drainages that dictate both surface water and groundwater flow across the Site (Figure 1). The Site is divided by I-10 with two AAs to the east (East Mountain AA and East Property AA) and eight AAs to the west (Plant Entrance Arroyo AA, South Terrace Arroyo AA, Pond 1 Arroyo AA, Pond 5/6 Arroyo AA, Acid Plant Arroyo AA, a portion of the PBA AA, La Calavera (LC) AA, and Floodplain AA. The area referred to as the plant site is located between I-10 and Paisano Drive and is composed of six AAs: Plant Entrance Arroyo AA, South Terrace Arroyo AA, Pond 1 Arroyo AA, Pond 5/6 Arroyo AA, Acid Plant Arroyo AA, and a portion of PBA AA. The site includes three other areas: two slivers of land along Paisano Drive, referred to as West Sliver, Paisano and East Sliver, Paisano; and the Texas Custodial Trust (TCT) Pile 1 property adjacent to the Union Pacific Railroad (UPRR) property in the northwestern portion of the lower PBA. Figure 1 illustrates the site layout and the AAs.
Climate and topography
The climate in the El Paso area is arid, characterized by very low precipitation and relative humidity. Winters are cool; summers are hot and dry. Temperatures range from above 100 degrees Fahrenheit (°F) in the summer months to below freezing temperatures in the winter. Precipitation averages about 8 inches annually, with most of the precipitation occurring between April and September, usually in the form of intense storms. The Site is located within the Rio Grande Valley floodplain between the Franklin Mountains to the northeast and the Cerro De Cristo Rey to the southwest in Mexico. The center of the Site is located at an elevation of approximately 3,700 feet above mean sea level (amsl) near the river. Elevations on the Site increase from west to east, with the highest elevation of 4,140 feet amsl in the southeastern portion of the property in the exposed bedrock outcropping of the East Mountain AA.
Soil
The site soils are characterized by nearly level to steep soils that are: 1) shallow or very shallow, overlying caliche; or 2) deep and gravelly throughout (USDA, 1971). The surface soils consist of fill and a mix of sediments generated from erosion of the Campus Andesite and the Franklin Mountains and fluvial sediments from the Rio Grande, with areas of extensive man-placed fill, principally on the plant site. Fill material has been found to include slag, native soil, and other anthropogenic materials such as concrete and asphalt.
Groundwater
Groundwater at the Site occurs within an unconfined alluvial aquifer with a saturated thickness ranging from approximately 8 to 60 feet underlain by a series of regional, less-permeable
G:\ENV\ENV\PROJ\1200\1209 - MP - El Paso Smelter\Response Action Plan\RAP August 2016\RAPr1 Worksheet 1.doc
Response Action Objectives Associated Information: Attachment 1A, 1B
RAP Worksheet 1.0 WS1.0 - Page 3 of 44
ID No.: SWR No. 31235 Report Date: August 2016
bedrock units. Groundwater in the alluvial aquifer flows west and southwest, ultimately discharging to the Rio Grande and sections of the American Canal via the Floodplain AA.
Surface Water
The PBA provides most of the drainage for both surface water and groundwater at the Site. Stormwater runoff from the northern portion of the East Mountain AA and from the East Property AA is directed to the PBA via the North and South Arroyos. Runoff from the plant site is directed to the PBA via the onsite Stormwater Collection and Reuse System (SWCRS), which is operated as a zero discharge facility. Stormwater captured by this network normally evaporates. If discharge is required, testing is performed to ensure that the water quality limits set by the Site Texas Pollutant Discharge Elimination System (TPDES) Multi-Sector General Permit No. TXR050000 (Permit No. TXR05Y986) are met. Treatment is performed to meet these limits if needed, and discharge is through the PBA outfall, SW-5.
East Mountain and East Property AAs
The East Mountain AA is a bedrock outcropping that does not have any groundwater and has steep rocky slopes that are not amendable to future development. The East Property AA is an alluvial basin located north of the East Mountain AA with two arroyo drainages (North Arroyo and South Arroyo) that provide flow to the upper PBA on the west side of I-10. The East Property AA includes localized areas where slag and waste material were placed during historical operations of the ASARCO plant including Area 4, the Category I and II Material Disposal Area, and the Category II Material Storage Area as illustrated on Figure 1. Aerial deposition of slag crushing activities and stack emissions had limited impact on the remaining portions of the East Property.
Plant Site AAs
The plant site is characterized as an extensively disturbed industrial property that has been leveled by filling in the plant-site arroyos with slag, soil, and demolition debris. Some of the materials used to fill the arroyos are sources of COCs to groundwater. All structures associated with the former smelter site have been demolished and removed from the plant site including the two stacks. The future land use for the plant site will be restricted to Commercial/Industrial (C/I). The presence of subsurface sources of COCs results in the soil-to-groundwater migration pathway influencing risk management decisions for the plant site. Groundwater within the plant site generally originates on-site.
PBA AA
The PBA is divided by the UPRR track into upper and lower reaches as illustrated on Figures 1 and 3. The PBA has several potential source areas for COCs including the PBA channel; the Ephemeral Pond; the Fines Pile; the Boneyard; and portions of the plant site where the former wastewater treatment plant, former cadmium plant, and former acid storage tanks were located. The Ephemeral Pond is located within the upper channel, while the Fines Pile is located adjacent to the upper channel. The TCT Pile 1 is located in the northwestern portion of the lower reach of the PBA AA, between the UPRR tracks.
G:\ENV\ENV\PROJ\1200\1209 - MP - El Paso Smelter\Response Action Plan\RAP August 2016\RAPr1 Worksheet 1.doc
Response Action Objectives Associated Information: Attachment 1A, 1B
RAP Worksheet 1.0 WS1.0 - Page 4 of 44
ID No.: SWR No. 31235 Report Date: August 2016
LC AA
LC AA comprises an open area adjacent to the PBA as illustrated on Figure 1. The LC AA was historically impacted by aerial deposition of dust from the stacks and slag crushing operations resulting in concentrations of arsenic and lead in surface soil above C/I PCLs; however, COCs have not migrated vertically and do not pose a threat to groundwater. Groundwater within the LC AA is within an arroyo separated from on-site groundwater and sources for potential groundwater impacts.
Floodplain AA and Sliver Parcels Along Paisano Drive
The Floodplain AA is located west of the plant site and Paisano Drive, adjacent to the Rio Grande. Similar to the LC AA, the Floodplain AA was impacted by deposition of fugitive dusts from the stacks and slag crushing operations. Lead is present in surface soil of the Floodplain AA at concentrations above its C/I PCL; however, there is no evidence of migration to groundwater. Groundwater flows from the plant site and the PBA toward the Floodplain AA. As a result, groundwater in the Floodplain AA is affected by COCs originating from the plant site and PBA. The COCs in the groundwater of the Floodplain AA are available for discharge to the Rio Grande. Two sliver-shaped parcels of land along Paisano Drive are part of the Site as illustrated on Figure 1. The West Sliver, Paisano parcel is located along the west side of Paisano Drive across from the Plant Entrance AA and South Terrace AA. The East Sliver Paisano parcel is located along the east side of Paisano Drive just south of the Plant Entrance AA. Similar to the Floodplain AA, these sliver parcels have been impacted by historical deposition from stack and operations without evidence of migration to groundwater.
PCLE Zones
The PCLE zones for COCs in soil, groundwater, and surface water at the Site are discussed in the Conceptual Site Model, Pathway Evaluation, and Protective Concentration Level Report (Arcadis, 2016a). PCLE Zones are based on multiple exposure pathways represented by PCLs.
Soil
The exposure pathways for soil include:
• Direct contact (TotSoilComb) for residential at the East Property AA and C/I for the rest of the Site
• Soil-to-groundwater (GWSoilIng) for entire site except the East Mountain AA, due to lack of groundwater
• Soil-to-groundwater-to-surface water (SW-GWSoil) for AAs adjacent to the American Canal and Rio Grande (South Terrace Arroyo AA, Pond 1 Arroyo AA, Pond 5/6 Arroyo AA, Acid Plant Arroyo AA, and PBA AA)
• Ecological based soil (EcoSoil) PCL for South Arroyo of the East Property AA • Soil-to-sediment (SedSoil) for AAs with stormwater runoff discharging to American Canal
or Rio Grande
G:\ENV\ENV\PROJ\1200\1209 - MP - El Paso Smelter\Response Action Plan\RAP August 2016\RAPr1 Worksheet 1.doc
Response Action Objectives Associated Information: Attachment 1A, 1B
RAP Worksheet 1.0 WS1.0 - Page 5 of 44
ID No.: SWR No. 31235 Report Date: August 2016
The response action objectives for soil remediation at the Site will be met by:
1. Establishing institutional controls for C/I land use at the Site with the exception of the East Property AA, which will remain unrestricted for residential land use. These controls will bring 9 of the 10 AAs into compliance with C/I TotSoilComb PCLs (See Figure 8).
2. Preventing contact with soils containing concentrations of COCs greater than residential TotSoilComb PCLs in the East Property AA by soil removals as illustrated on Figure 9. Removals and placement of low permeability covers in the South Arroyo of the East Property AA will also meet EcoSoil PCLs. The locations of all soil covers are presented on Figure 10.
3. Removing soils impacted by polychlorinated biphenyls (PCBs) above C/I TotSoilComb and Soil exposure by inhalation of dust particulate (AirSoilInh-vp) PCLs at the Pond 5/6 Arroyo AA and Acid Plant Arroyo AA and disposing of the removed soil in accordance with State and Federal requirements. The locations of soil excavations are illustrated on Figure 9.
4. Removing soils sloughed onto asphalt and open areas around the former Antimony Building impacted by mercury at concentrations above its AirSoilInh-vp PCL for C/I land use as illustrated on Figure 9.
5. Removing soil with COCs above their respective C/I TotSoilComb PCLs at the Plant Entrance Arroyo AA, LC AA, and Floodplain AA as illustrated on Figure 9.
6. Constructing an agency -approved landfill (Cell 4) for the placement of Category I materials and removal/placement of identified Category I material from the Site into the Cell 4 landfill. Completing cover installation and closure requirements for the Cell 3 and Cell 4 landfills.
7. Constructing an evapotranspirative (ET) soil cover systems for Category II materials located in the Category II Material Storage Area on the East Property AA; the Fines Pile, Boneyard and Pile 1 in the PBA AA; and the plant site AA (see Figure 10). The ET cover system at the plant site will be extended to prevent exposure to COCs in soil above the C/I TotSoilComb PCL, to control potential migration of COCs in soil above their respective soil-to-groundwater-to-surface water PCLs (SW-GWSoil) and C/I TotSoilComb PCLs, and to prevent COCs in surface soil from becoming entrained in stormwater runoff and conveyed to surface water sediments (SedSoil pathway). The goal of the cover system is to prevent direct contact of people and stormwater runoff with COCs in surface soil. The ET cover also provides control of stormwater infiltration, reducing groundwater hydraulic gradients that drive COCs into groundwater of the floodplain and out into the surface water of the Rio Grande and American Canal.
8. Constructing an impermeable liner overlain with riprap with appropriate grading and drainage for the Ephemeral Pond to prevent infiltration of surface water (SW-GWSoil), and construction of a lined, stabilized channel in the upper and lower PBA to control potential entrainment of soil in stormwater to sediment of the Rio Grande (SedSoil). TCT will coordinate with off-site parties as appropriate to coordinate drainage interfaces on their property.
9. Controlling the discharge of COCs in Site soil to the sediment of the American Canal (SedSoil pathway) through installation, maintenance, and monitoring of gabion structures in the East Mountain AA and stormwater BMPs in the upper portion of the PBA AA, as illustrated on Figure 11. Controlling stormwater runoff from the Floodplain AA through a settling pond and installing best management practice (BMP) features, as illustrated on Figure 11.
10. Establishing a Plume Management Zone (PMZ) over the aquifer within the Site
G:\ENV\ENV\PROJ\1200\1209 - MP - El Paso Smelter\Response Action Plan\RAP August 2016\RAPr1 Worksheet 1.doc
Response Action Objectives Associated Information: Attachment 1A, 1B
RAP Worksheet 1.0 WS1.0 - Page 6 of 44
ID No.: SWR No. 31235 Report Date: August 2016
boundaries to remove requirement to meet the soil-to-groundwater (GWSoilIng) PCLs within the PMZ. Treatment of groundwater with PRBs installed within the PBA to achieve the SWGW PCL at down-gradient locations from PRBs.
11. Establishing WCUs at the Cell 1, Cell 2, Cell 3, and Cell 4 landfills, removing the requirement for monitoring groundwater beneath these structures.
12. Closing active waste codes and waste management units listed on the ASARCO Notice of Registration (NOR).
Groundwater
The pathways for groundwater include:
• Direct ingestion (GWGWIng) for residential or C/I land use (depending on the land use at that area of the Site)
• Groundwater-to-surface water (SWGW) for entire site, except the East Mountain AA due to lack of groundwater
The PCLE Zone has been established in groundwater for the entire Site based on the pathways identified in the Conceptual Site Model, Pathway Evaluation, and Protective Concentration Level Report (Malcolm Pirnie, 2016a). The response action objectives for groundwater at the Site will be met by:
1. Establishing institutional controls preventing the use of groundwater on-site within the PMZ (See Figure 8).
2. Reducing the mass of COCs in groundwater in the PBA via in situ treatment using zero-valent iron (ZVI) PRBs installed in the PBA (See Figure 12).
3. Controlling the discharge of groundwater with COC concentrations greater than the SWSW PCLs to the Rio Grande and the American Canal by controlling groundwater hydraulic gradients with low permeability covers on the plant site and lining of the PBA channel and Ephemeral Pond. TCT will coordinate with off-site parties as appropriate for their response actions on adjacent affected properties.
4. Controlling groundwater hydraulic gradient in the PBA with groundwater extraction via the gradient hydraulic barrier (GHB) extraction well located up-gradient from the upper PBA (see Figure 12).
5. Controlling the source of COCs in groundwater by removing Category I and II materials in the PBA.
6. Establishing a PMZ over the groundwater PCLE Zone, thereby removing the requirement for meeting GWSoilIng PCLs within the PMZ.
7. Monitoring surface water quality with respect to implementation of the groundwater response action strategy, to confirm that PCLs will be met on schedule at the alternate points of exposure (alternate POEs).
Explain how the COCs will be handled, treated, disposed, or transferred to another media and document that the response action will not result in any additional potential exposure conditions due to response action activities.
The handling, treatment, disposal or transfer of COCs from one medium to another will be addressed for individual AAs and media type, as discussed below.
G:\ENV\ENV\PROJ\1200\1209 - MP - El Paso Smelter\Response Action Plan\RAP August 2016\RAPr1 Worksheet 1.doc
Response Action Objectives Associated Information: Attachment 1A, 1B
RAP Worksheet 1.0 WS1.0 - Page 7 of 44
ID No.: SWR No. 31235 Report Date: August 2016
East Mountain AA
Soil
Soil in the East Mountain AA has been affected by metals associated with historical aerial deposition from stack emissions and/or dust from site operations or slag processing. Metal COCs include arsenic, cadmium, copper, lead, mercury, selenium, and zinc. Stormwater runoff from the East Mountain AA flows down eroded ravines on the mountain’s face along I-10, then is conveyed, along with stormwater runoff from the freeway and railroad, to Outfall SW-1 on the American Canal. The SedSoil pathway is complete for COCs in soil of the East Mountain AA, requiring the implementation of stormwater control BMPs. The steep, rough terrain and inaccessibility of the ravines in the East Mountain AA limit the BMP selection for controlling stormwater runoff in this area. Gabions made from rock baskets covered by filter fabric make the ideal BMP to promote ponding of stormwater runoff, allowing for entrained soil particles to settle out as sediment. The locations of the structures are illustrated on Figure 11, and the design of the gabions is discussed in Worksheet 2.0. The gabion structures have effectively controlled stormwater discharges since installation in 2012, with only one measurable event occurring during September 2014 when 4.23 inches of precipitation was reported (NOAA, 2015). Maintenance of gabions will include inspection and replacement of fabric as needed and removal of sediment. Sediments accumulated on fabrics at the gabions will contain elevated levels of COCs; therefore, these sediments will be removed and disposed in the Cell 4 WCU. Sediments will be removed from remote gabion structures by vacuum truck using temporary vacuum piping to access remote gabion locations. Relatively small volumes of sediment (10 to 15 cubic yards) will be generated per removal event, with limited availability for exposure to off-site receptors between removal events.
Groundwater
Significant amounts of groundwater are not present in the East Mountain AA; therefore, no treatment, transfer or disposal of COCs in groundwater is considered for this area.
East Property AA
Soil
Response actions for soil of the East Property AA will principally involve excavation of affected soil and on-site disposal as either Category I material or Category II material. Limits of excavation and target PCLs are discussed in Worksheet 2. Category I material was excavated from the East Property AA at Area 4 and the Category I Material Storage Area, identified on Figure 1. The Category I material was excavated and disposed of in the Cell 4 landfill, which has been designed, approved, and constructed for this purpose (Malcom Pirnie, 2013). The containment of the Category I material in the lined landfill will prevent future discharge of COCs to groundwater and surface water through design and construction of approved liner and cover systems (Texas Commission on Environmental Quality [TCEQ], 2014). Category II material is defined as material that can be left in place on-site as long as it is properly managed. These materials were excavated as illustrated on Figure 9, and placed in the Category II Material
G:\ENV\ENV\PROJ\1200\1209 - MP - El Paso Smelter\Response Action Plan\RAP August 2016\RAPr1 Worksheet 1.doc
Response Action Objectives Associated Information: Attachment 1A, 1B
RAP Worksheet 1.0 WS1.0 - Page 8 of 44
ID No.: SWR No. 31235 Report Date: August 2016
Storage Area on the East Property AA illustrated on Figure 10. These placed materials are managed in-place by covering with an appropriately designed soil cover to prevent direct contact with COCs and migration to groundwater. Potential exposures to COCs in soil at the East Property due to response action activities are principally through dust generation and stormwater runoff. The airborne dust pathway has been continually monitored over the entire site from 2011 through the present. Site-wide Dust Monitoring Summary Reports for 2012, 2013, and 2014 are presented in Appendix 3.1. These reports are for the month of December for each year, and they provide summaries of dust monitoring data collected over that calendar year. Air monitoring stations around the East Property Category I and Category II removal areas reported ambient airborne dust concentrations on a daily basis during removal activities in spring and summer 2014. Attachment D of the December 2014 report presents graphic dust monitoring data with three monitoring points for the East Property AA including East Borrow Source North, East Borrow Source South, and East Borrow Source East. Minimal numbers of events occurred with dust concentrations above the site-specific reference level of 43 micrograms of dust per cubic meter of air (µg/m3). Based on the data presented in the Site-wide Dust Monitoring Summary Reports, the dust generation pathway for COCs in soil during response action activities in the East Property has not resulted in a significant exposure. The second pathway for COC migration and potential exposure to receptors during response action activities is by adsorption to soil particles entrained in stormwater runoff. The culvert discharge across I-10 from the South Arroyo was temporarily dammed prior to removal actions. Stormwater runoff has been contained in the South Arroyo channel during soil/slag removals, liner construction, and stabilization activities in the lower PBA channel, preventing the potential discharge of affected soil entrained in stormwater from the East Property. The dam will remain on the South Arroyo until vegetative stabilization has taken hold in the restored excavation area of the South Arroyo and channel improvements are completed downstream.
Groundwater
Groundwater from the East Property AA discharges to the PBA from the North and South Arroyos. Additionally, groundwater in the East Property AA has been impacted by COCs near the location where the South Arroyo meets the Category I Material Storage Area. Background concentrations of COCs were characterized at EP-95, which is located upgradient of impacts from the affected property. To control the hydraulic gradient and limit discharge of groundwater from the East Property to the PBA, clean up-gradient groundwater from the North Arroyo is extracted at EP-163 (also known as the GHB extraction well), removing groundwater from the aquifer prior to its coming into contact with affected media in the subsurface of the PBA. The extracted groundwater is not affected by on-site contamination and is discharged to the Rio Grande. Groundwater quality will be monitored during the response action, and water quality is anticipated to be similar to that reported for EP-95. Appendix 3.2 includes surface water and groundwater quality reports including data from EP-95, the background well. Recent concentrations of arsenic in groundwater samples ranged from 0.00751 milligrams per liter
G:\ENV\ENV\PROJ\1200\1209 - MP - El Paso Smelter\Response Action Plan\RAP August 2016\RAPr1 Worksheet 1.doc
Response Action Objectives Associated Information: Attachment 1A, 1B
RAP Worksheet 1.0 WS1.0 - Page 9 of 44
ID No.: SWR No. 31235 Report Date: August 2016
(mg/L) in February 2014 to 0.028 mg/L in October 2014. Groundwater in other portions of the Mesilla Boson has naturally occurring levels of arsenic above its maximum contaminant level (MCL) of 0.01 mg/L (Malcolm Pirnie 2014a). The background concentration for arsenic in groundwater calculated at the Site is 0.02 mg/L (Arcadis, 2016a). Although all groundwater from the East Property AA is not captured by the extraction well, any groundwater flow into the PBA is treated by the PRBs.
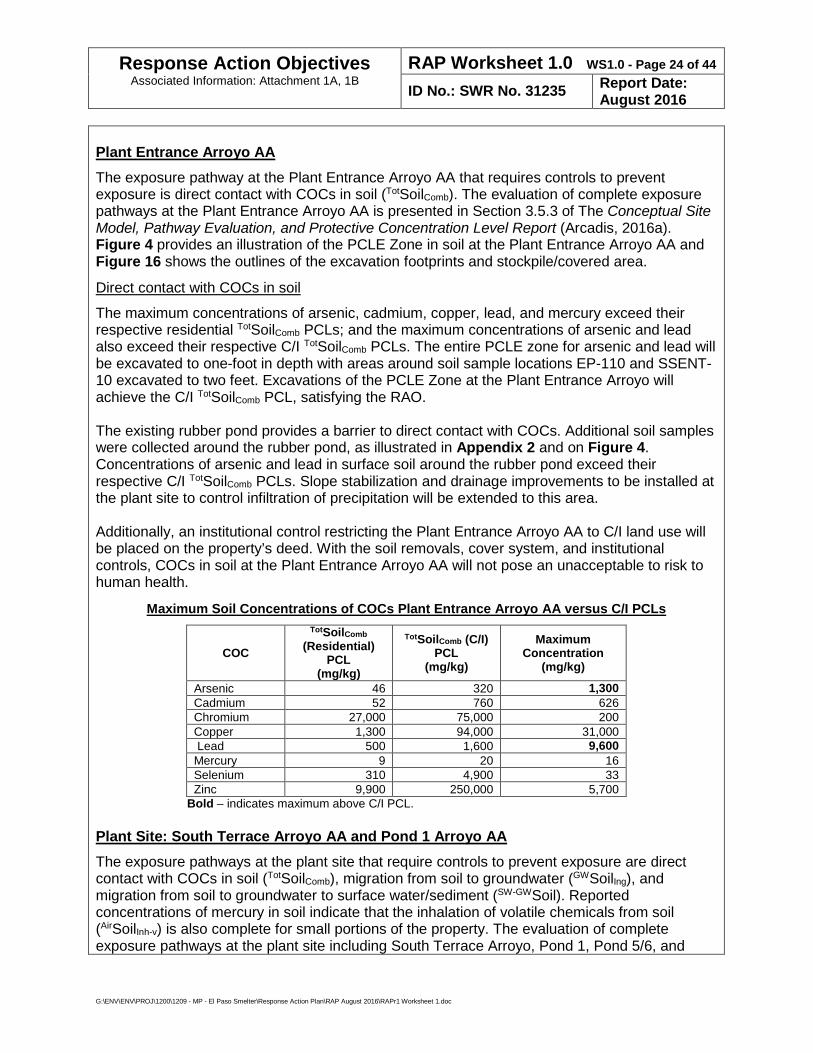
Plant Entrance Arroyo AA
Soil
As illustrated on Figure 4, the Plant Entrance Arroyo AA has a PCLE Zone around the paved, low-lying truck entrance at the south entrance to the plant site. The PCLE Zone is based on concentrations of arsenic and lead above C/I TotSoilComb PCLs in the upper two feet of soil. Surface soil will be scraped in this area, removing elevated hot spot concentrations principally of arsenic and lead along the truck access roadway. The removed soil material will be disposed of as Category II material, beneath the plant site evapotranspiration (ET) cover. Most of the plant entrance area will then be covered with either asphalt or low permeable covers. Similar to the East Property AA, potential exposures to COCs as a result of response action activities are based on potential dust generation and entrainment in stormwater runoff. Daily air monitoring results for the South Monitoring Location are presented in the Site-wide Dust Monitoring Summary Reports (see Appendix 3.1). The excavations in the Plant Entrance Arroyo AA will be monitored at the South Monitoring Location, as illustrated on Figure 1 in Attachment A of the December 2014 Site-wide Dust Monitoring Report Summary. Stormwater runoff will be controlled using construction BMPs to prevent the migration of soil in stormwater runoff to the American Canal.
Groundwater
Groundwater in the Plant Entrance AA has concentrations of COCs below their respective Tier 1 PCLs. Remediation of groundwater at the Plant Entrance AA is not required, so there will be no handling, treatment, or transfer of COCs from this medium.
Plant Site AAs
Soil
The plant site includes four entire AAs (South Terrace Arroyo AA, Pond 1 Arroyo AA, Pond 5/6 Arroyo AA, Acid Plant Arroyo AA), and a portion of the PBA AA including the Boneyard, as illustrated on Figure 1. The response action for the plant site includes localized excavations to meet chemical-specific PCLs for inhalation (mercury/PCBs), regulatory requirements (Toxic Substance Control Act [TSCA]), and site drainage requirements, as illustrated on Figure 9. The plant site is proposed to be covered with either Category II material asphalt cover, asphalt drive/parking area, flexible membrane liner (FML) cover, ET soil cover, and low permeability cover as illustrated on Figure 10. Limited hot spot excavations and slope stabilization of the western plant site slopes will be completed to control direct contact risk and potential migration of impacted soil in stormwater runoff.
G:\ENV\ENV\PROJ\1200\1209 - MP - El Paso Smelter\Response Action Plan\RAP August 2016\RAPr1 Worksheet 1.doc
Response Action Objectives Associated Information: Attachment 1A, 1B
RAP Worksheet 1.0 WS1.0 - Page 10 of 44
ID No.: SWR No. 31235 Report Date: August 2016
PCB Excavations. Excavations of PCB-containing soils were performed at two areas within the plant site footprint. The first area includes three sample locations (AE-5, PCB-02, and PCB-03 located northwest of the former converter building), which were characterized for excavation as illustrated in the excavation summary document presented in Appendix 3.3 of this document. The second area was on the southeast corner of the former powerhouse, at sample location AE-11. All characterizations and excavations were performed in accordance with TSCA requirements. Soils excavated from locations with >50 milligrams per kilogram (mg/kg) total PCBs were segregated and disposed of off-site in a TSCA-regulated disposal facility. Soils excavated from areas with less than 50 mg/kg PCBs were disposed of on site in the Cell 4 WCU. A summary of the distribution of PCBs in soil, excavation limits, and final disposition of soil for disposal is presented in Appendix 3.3. Excavated soils were stored in covered roll-off bins prior to disposal, eliminating potential erosion by wind and stormwater runoff. Mercury Excavations. Mercury-containing soils were identified at concentrations above the soil-to-air PCL (AirSoilInh) of 22 mg/kg in material sloughed off onto asphalt surfaces and the surrounding open area in the vicinity of the former Antimony Processing Building as illustrated on Figure 9. Because concentrations of mercury were above the AirSoilInh PCL, covering this portion of the Site would not completely address the potential inhalation exposure pathway. This area will be excavated to the SW-GWSoil PCL, as illustrated on Figure 9. Excavated soils with concentrations of mercury above the 22 mg/kg AirSoilInh-v PCL will be disposed of in the Cell 4 WCU. All other excavated soil will be placed within the Category II plant site area as subgrade for the soil ET cover. Site Drainage Excavation. An additional excavation was performed in the Acid Plant Arroyo AA, where high concentrations of arsenic in Site surface soil were reported (see Figure 9). This excavation was performed to remove outcroppings of soil to meet Site drainage requirements for installation of the cover system. Excavated soil was disposed of in the Cell 4 WCU. Potential Soil Exposure During Response Action Activities. Similar to the activities previously described for the East Property and Plant Entrance Arroyo AAs, wind-blown dust and stormwater runoff represent the most likely pathways for COC migration from the plant site. Air monitoring stations are located on the north, south, east, and west portions of the plant site. Daily dust monitoring data for the plant site monitoring stations are presented in the annual summary reports for calendar years 2012 through 2014 in Appendix 3.1 of this RAP. Dust monitoring is performed as previously described. Six monitoring locations were evaluated as earth moving activities were conducted: South Monitoring Location, East Monitoring Location, West Monitoring Location, North Monitoring Location, Northeast Monitoring Location, and Northwest Monitoring Location. These historical dust monitoring data show that the plant site has been the principal source of dust generation, even in the absence of remedial activities, most notably at the East Monitoring Location. However, even at the East Monitoring Location, reported concentrations of dust rarely exceeded the site-specific threshold value of 43 µg/m3. Dust generation will continue to be closely monitored to ensure that remedial activities do not increase the potential for migration of COCs in fugitive dust. Once covered, soil impacted by COCs will not be available at the surface and the exposure pathway will become incomplete.
G:\ENV\ENV\PROJ\1200\1209 - MP - El Paso Smelter\Response Action Plan\RAP August 2016\RAPr1 Worksheet 1.doc
Response Action Objectives Associated Information: Attachment 1A, 1B
RAP Worksheet 1.0 WS1.0 - Page 11 of 44
ID No.: SWR No. 31235 Report Date: August 2016
Therefore, after the first foot of clean soil is placed over the area, air monitoring will be discontinued. The second major migration pathway for COCs in soil at the plant site during response action activities is through entrainment in stormwater runoff. Currently, the plant site is a “zero stormwater discharge” facility due to the installation and operation of the SWCRS. All stormwater from the plant site is collected at low-lying areas and pumped back to one of three lined ponds as illustrated on Figure 11. Stormwater runoff directed to the retention ponds is potentially in contact with surface soil having concentrations of COCs above their respective C/I TotSoilComb PCLs. As a result, sediment within the ponds can have concentrations of COCs above protective levels for sediment in the Rio Grande. Stormwater detained in the on-site storage ponds is sampled and analyzed for total and dissolved metals. If the concentrations of the COCs are below their respective permit levels, water is discharged to the Rio Grande through Outfall SW-5. This approach has minimized the historic impact of COCs in stormwater from the plant site, since installation of the SWCRS in 2005. Once covered, soil impacted by COCs will not be available at the surface and the exposure pathway will become incomplete. Shortly after installation of the plant site caps, the existing stormwater retention ponds will be cleaned of sediment. This one-time cleanout will include collection and disposal of sediments in Cell 4, as noted in Worksheet 3.0 – Performance Measures. Monitoring discharge from the retention ponds will be discontinued once the installation of cover and one-time clean out of retention ponds is complete. The discharge of COCs in stormwater released from the SWCRS is documented in the Discharge Monitoring Reports (DMR) for the plant site and PBA presented in Appendix 3.4. Regarding the West Plant Site Slopes, characterization samples were collected in July 2015 (Appendix 2.1). Reported concentrations of arsenic, lead, and mercury exceeded their respective PCLs for C/I soils, direct contact (TotSoilComb). In comparison, reported concentrations of antimony, arsenic, cadmium, cobalt, copper, iron, lead, mercury, selenium, and silver in surface soil samples exceeded the respective soil PCLs for constituents leaching from soil to groundwater then discharging to surface water (SW-GWSoil PCLs). Therefore, a response action is necessary on the West Plant Slope. As described in Worksheet 2.0, entrainment of soil as sediment in stormwater runoff from the West Plant Site Slopes will be controlled by placement of stabilization media over slopes following limited spot removal of surface soil, where practical. Relatively steep grades along the western plant site slopes will cause precipitation to runoff rather than infiltrate. The critical PCL in this area, therefore, is based on discharge of COCs in stormwater.
Groundwater
Groundwater from the plant site accounts for between 15 and 20 percent of the total groundwater flow from the entire Site. The response action approach for the plant site is to install a low permeability cover system to reduce stormwater infiltration, thereby removing the groundwater migration pathway. No handling, treatment or transfer of COCs in groundwater will occur related to these activities.
G:\ENV\ENV\PROJ\1200\1209 - MP - El Paso Smelter\Response Action Plan\RAP August 2016\RAPr1 Worksheet 1.doc
Response Action Objectives Associated Information: Attachment 1A, 1B
RAP Worksheet 1.0 WS1.0 - Page 12 of 44
ID No.: SWR No. 31235 Report Date: August 2016
PBA AA
Soil
The PBA AA is divided into the upper PBA and the lower PBA by the UPRR tracks as illustrated on Figure 3. Response actions in the PBA include excavation and removal of slag in the PBA channel and from the footprint of the Cell 4 WCU and TCT’s portion of Pile 1 (see Figure 9); construction of Cell 4 for final disposal placement of Category I materials; placement of impermeable liners and channel stabilization (articulated concrete block, rip-rap, closure turf and hydro-turf) over the both upper and lower PBA channels including the Ephemeral Pond; placement of an ET soil cover or closure turf over the and Fines Pile; placement of an ET soil cover over the Boneyard and TCT Pile 1 areas; and stabilization of the northern plant site slope. The excavation of the Cell 4 WCU required that material be temporarily stockpiled on the plant site as, illustrated in the Stormwater Pollution Prevention Plan (SWPPP) for Cell 4 in Appendix 3.4. Category I material was segregated and ultimately disposed of in the completed Cell 4 WCU. Category II material and other soils were placed on-site as a base course for the Category II ET soil cover on the plant site. Similar to the Cell 4 excavation, excavation of the lower PBA channel included removal of slag and waste material that was then stockpiled on the plant site and segregated as Category I material for final disposal in the Cell 4 WCU or as Category II/III material for use as a base course for the ET soil cover over the plant site. The extent of excavation of the slag material from the lower PBA channel was determined by visual inspection of the material within the channel during removal activities. Samples of the soil were taken to document the conditions after soil removal was completed. Once slag removal was complete, clean backfill was placed to bring the channel to grade, a low-permeability liner was installed within the lower channel, and the channel was stabilized with stone riprap, gabion drop structure, and articulated concrete block (ACB). The northern plant slope surface will be stabilized to prevent future entrainment of soil in stormwater runoff. The Cell 4 lining system was completed in July 2013. TCEQ approved Cell 4 for disposal of Category I material on August 7, 2013. Cell 4 has since been filled with approximately 150,000 cubic yards (CY) of Category I material. The outer slopes of Cell 4 have been covered with an approved 3-foot thick ET soil cover. Approximately 35,000 CY of disposal capacity remains in Cell 4. It is anticipated that during the O&M period, additional volumes of Category I material will require disposal in Cell 4. To facilitate this disposal, the top deck of Cell 4 will be covered with one foot of clean silty sand material from the East Borrow Source. When Category I material is identified for disposal, an area in Cell 4 will be stripped of the one foot of clean soil, the Category I material will be disposed, and the area will be re-covered with one foot of clean soil. The permanent soil cover will be constructed once the remaining Cell 4 capacity is depleted or it is determined that Cell 4 is only needed for small volumes of material (e.g., <50 CY) generated each year. In the permanent soil cover, a small area will be made available for disposal of small volumes of waste material to meet long-term needs.
G:\ENV\ENV\PROJ\1200\1209 - MP - El Paso Smelter\Response Action Plan\RAP August 2016\RAPr1 Worksheet 1.doc
Response Action Objectives Associated Information: Attachment 1A, 1B
RAP Worksheet 1.0 WS1.0 - Page 13 of 44
ID No.: SWR No. 31235 Report Date: August 2016
Potential exposure to COCs in soil at the PBA due to remediation activities are principally through dust generation and storm water runoff. The Site-wide Dust Monitoring Reports for December for 2012, 2013, and 2014 encompass the timeframe for removals and channel construction projects. Air monitoring stations around the PBA reported ambient airborne dust concentrations on a daily basis during removal activities. Graphs in Attachment D of the December reports present dust monitoring data with Northwest, North, Northeast, Arroyo South, Arroyo West, and Arroyo North. Minimal numbers of events occurred with dust concentrations above the site-specific reference level of 43 micrograms of dust per cubic meter of air (µg/m3). Based on the data presented in the Site-wide Dust Monitoring Summary Reports, the dust generation pathway for COCs in soil during remediation activities in the PBA has not resulted in a significant exposure. The other pathway for COCs migration during response action activities is by adsorption to soil particles entrained in stormwater runoff. The culvert discharge across Paisano Drive from the PBA was dammed prior to removal actions. Stormwater runoff has been contained in the PBA channel during soil/slag removals, liner construction, and stabilization activities in the lower PBA channel, preventing the potential discharge of impacted soil entrained in stormwater discharges from the East Property. The dam will remain on the PBA channel until installation of the channel stabilization materials is complete.
Groundwater
Groundwater in the PBA has been impacted by COCs coming from the Ephemeral Pond, Boneyard, and from up-gradient groundwater in the South Arroyo. Groundwater remediation in the PBA AA is based on hydraulic gradient control provided by the extraction well (EP-163, also known as the GHB Extraction Well) on the East Property AA and treatment at PRBs at narrow points in the subsurface under the PBA channel. Groundwater from the East Property and the PBA flow through both PRBs, shown on Figure 12. When treated by the PRBs, metallic COCs are removed from groundwater without transfer medium.
LC AA
Soil
The LC AA has several small surficial soil PCLE Zones around the cemetery site, with concentrations of arsenic, lead, and mercury above C/I TotSoilComb PCLs. Surface soil was scraped, removing elevated concentrations principally of arsenic and lead from areas identified on Figure 9. Category II material was placed beneath the plant site ET cover, and Category I material was placed in the Cell 4 landfill. Similar to the other AAs, potential exposures to COCs as result of remedial activities are based on potential dust generation and entrainment of stormwater runoff. Daily air monitoring results of the South Monitoring Location are presented in the Site-wide Dust Monitoring Summary Reports (see Appendix 3.1). The excavations at the LC AA were monitored at four locations including Fines Pile NE, Fines Pile NW, Arroyo North, and LC AA, as illustrated on Figure 1 in Attachment A of the December 2014 Site-wide Dust Monitoring Report Summary. Stormwater runoff was controlled from discharging to Paisano Drive using construction BMPs.
G:\ENV\ENV\PROJ\1200\1209 - MP - El Paso Smelter\Response Action Plan\RAP August 2016\RAPr1 Worksheet 1.doc
Response Action Objectives Associated Information: Attachment 1A, 1B
RAP Worksheet 1.0 WS1.0 - Page 14 of 44
ID No.: SWR No. 31235 Report Date: August 2016
Groundwater
Groundwater at the LC AA has concentrations of COCs below their respective Tier 1 PCLs. Remediation of groundwater at the LC AA is not required, so there will be no handling, treatment, or transfer of COCs from this medium.
Floodplain AA and Areas Along Paisano Drive
Soil
The Floodplain AA has multiple small surficial soil PCLE Zones with concentrations of lead above its C/I TotSoilComb PCL (see Appendix 2.2). As described in Appendix 2.2, surface soil scrapes are being implemented at areas identified on Figure 9, with placement of scraped material as Category II material beneath the plant site ET soil cover. Similar to the other AAs, potential exposures to COCs as result of response action activities are based on potential dust generation and entrainment in stormwater runoff. Daily air monitoring data are presented in the Site-wide Dust Monitoring Summary Reports (see Appendix 3.1). The excavations at the Floodplain AA will be monitored at the West Monitoring Location as illustrated on Figure 1 in Attachment A of the December 2014 Site-wide Dust Monitoring Report Summary. The other pathway for COC migration during response action activities is by adsorption to soil particles entrained in stormwater runoff. Stormwater runoff from the Floodplain AA discharges to the Rio Grande at two points on Outfall 5, and to the American Canal at one central point. Stormwater discharges from the Floodplain AA will be controlled by the construction of settling pond at the central location discharging to the American Canal and using BMPs to allow for sedimentation of entrained soils prior to discharge at Outfall SW-5. Similar to the Floodplain AA, the West and East Sliver, Paisano parcels have COCs in soil as described in the summary documents presented in Appendices 2.3 and 2.4, respectively. As described in further detail in Attachment 2A.20, the West Sliver, Paisano parcel has concentrations of COCs below their respective residential TotSoilComb PCLs. No corrective action is required for soil in this parcel. The East Sliver, Paisano parcel, however, has exceedances of the C/I TotSoilComb for lead in the 0 to 0.5-foot depth interval at two sampling locations (Appendix 2.4). A limited surface scrape of soil will be required at these locations in the East Sliver, Paisano parcel.
Groundwater
Groundwater at the Floodplain AA has concentrations of COCs above their respective Tier 1 PCLs due to groundwater discharge from affected areas of the PBA and plant site. Discharge of COCs to groundwater from the PBA will be controlled by treatment through the PRBs, while the plant site will be covered to reduce the infiltration and ultimate migration of COCs to groundwater from these locations. No transfer of COCs from groundwater as a result of a treatment process (e.g., ion exchange) will occur in the floodplain. The Floodplain AA is within the boundaries of the PMZ for the Site. Groundwater use will be restricted within the Floodplain AA.
G:\ENV\ENV\PROJ\1200\1209 - MP - El Paso Smelter\Response Action Plan\RAP August 2016\RAPr1 Worksheet 1.doc
Response Action Objectives Associated Information: Attachment 1A, 1B
RAP Worksheet 1.0 WS1.0 - Page 15 of 44
ID No.: SWR No. 31235 Report Date: August 2016
The northern portion of West Sliver, Paisano parcel also falls within the boundaries of the PMZ. As a result, the PMZ notification and groundwater use restriction under TRRP must extend to the West Sliver, Paisano parcel. The East Sliver, Paisano parcel is located outside the delineated Groundwater PCLE Zone. The East Sliver, Paisano parcel, therefore, doesn’t require any notification or restriction of groundwater use under TRRP. State the proposed “reasonable time frame” and provide the justification for that time frame in the context of any potential for unprotective exposures to exist or develop, COC characteristics, hydrogeologic and affected property characteristics. If the reasonable time frame is different for the different affected media or for particular tracts of land, be sure to discuss that. Provide how the proposed response action will meet the objectives in a reasonable timeframe. The remediation of the Site is being conducted in stages. The first stage of activities involved demolition of the former smelter structures, subgrade utilities and vaults, and removal of waste management units listed on the NOR for the facility. The second stage includes the response action to control sources of COCs in soil and groundwater for direct contact and off-site migration. Direct contact with COCs in soil is controlled by soil removals, construction of a combination of covers for soil with residual concentrations above critical PCLs, and institutional controls restricting residential development. Off-site migration of COCs from soil is controlled by covers over soils with COC concentrations greater than the soil-to-groundwater-surface water (SW-GWSoil) PCLs, lining and stabilization of the upper and lower PBA channel, stabilization of slopes, and stormwater controls in the East Mountain AA, upper portion of the PBA AA, and Floodplain AA. Direct contact with groundwater on-site and in the Floodplain AA is eliminated by an institutional control prohibiting groundwater use. Off-site migration of COCs in groundwater at concentrations above the PCLs will be controlled with groundwater hydraulic gradient control (GHB extraction well EP-163 and covers on plant site) and in-situ treatment groundwater facilities (PRBs). The third stage of the response action at the Site is hydraulic gradient source control followed by MNA of groundwater in the Floodplain AA. Figure 13 provides a timeline for the remediation and compliance of the Site.
Plant Site Decommissioning and Demolition Asset recovery and structure demolition occurred at the Site from summer 2010 through fall 2012. Demolition of the two stacks was completed in April 2013. Sub-surface utilities including water and electric vaults along with manholes and sewers were abandoned in-place in 2015. Finally, the NOR for the former ASARCO Smelter in El Paso has never been closed. Thirty-five active or inactive waste units are present in the NOR with 21 units having hazardous waste codes associated with them as illustrated on Figure 14. Waste units will be closed as part of the response action for the Site. Appendix 3.5 provides a closure report for the NOR units. All but eight of the waste units are within the footprint of the soil cover system for the plant site. Completion of closure of waste units will coincide with completion of the response action. Waste units outside the soil cover system footprint will be characterized with respect of potential COC impacts to soil at each of the following units: 012, 017, 019, 021, 022, 024, 028, and 032. The final closure documentation for the NOR units will be submitted with the Response Action Completion Report (RACR) for soil, or Soil RACR, in fourth quarter of 2016. Once the approval letter for closure of the NOR units is received from the TCEQ, the NOR will be updated to show all the units as closed and the waste streams as inactive.
G:\ENV\ENV\PROJ\1200\1209 - MP - El Paso Smelter\Response Action Plan\RAP August 2016\RAPr1 Worksheet 1.doc
Response Action Objectives Associated Information: Attachment 1A, 1B
RAP Worksheet 1.0 WS1.0 - Page 16 of 44
ID No.: SWR No. 31235 Report Date: August 2016
Response Actions at Source Areas Source area remediation work began in the lower PBA AA with the excavation of the Cell 4 WCU, removal of slag from the PBA channel, and installation of the PRBs. These activities occurred in 2012 and 2013. Only Category II materials were identified for removal from the PBA. Category II materials were transported and stockpiled at the plant site. Lining of the Cell 4 WCU, covering of the Cell 3 WCU, excavation of PCB-containing soil, and excavations of the Category I and Category II materials from the East Property AA occurred in 2013 and 2014. Excavations of impacted soil at the LC AA also occurred in 2014. Partial construction of the ET cover for the Cell 4 WCU and the lining and stabilization of the Lower PBA channel occurred in early 2015. Installation of the East Property extraction well (EP-163, GHB extraction well) was performed in 2014 and startup of groundwater gradient control began in 2015 with operational startup of the extraction well. Additional excavations will occur in the Plant Entrance Arroyo AA, other plant site soils, Floodplain AA, and East Sliver, Paisano in 2016. Covers for the plant site, East Category II Material Storage Area1, Fines Pile, and Boneyard1 will be constructed late in 2016. Stormwater controls will be completed in the East Mountain AA (gabions) and Floodplain AA (BMP feature) in 2016. Improvements along the Burlington Northern Santa Fe (BNSF) railway tracks will be coordinated with BNSF for implementation in 2017 to minimize surface infiltration of stormwater following precipitation events. Institutional controls for the Site are summarized on Figure 8 and will be implemented following approval of the Soil RACR. Institutional controls will include:
1. Site-wide groundwater use restriction. 2. C/I land use restriction for the entire Site, except a portion of the East Property AA north
of the South Arroyo that will be residential. 3. Documentation of the PMZ over the East Property AA, PBA, and plant site to the eastern
bank of the Rio Grande. 4. Establishment of 4 WCUs at Cell 1, Cell 2, Cell 3, and Cell 4 landfills. 5. Construction restrictions for areas with soil covers. 6. Construction restrictions for drainage plans that include on-site retention/detention or
unintentional ponding of stormwater runoff. 7. Requirements to allow operations and maintenance (O&M) of the response action.
The goals for response action in soil at the Site are to eliminate direct exposure to COCs in soil at concentrations above TotSoilComb PCLs and to prevent migration of COCs from soil to groundwater and from soil to surface water via stormwater runoff. A Soil RACR for response actions in source areas will be submitted for partial site closure following completion of the response actions in soil at the end of 2016. The ultimate receptors for COCs in groundwater at the Site are the Rio Grande and the American Canal2. The groundwater response action will require additional time to achieve the objective of protecting surface water from groundwater discharge at the Rio Grande and American Canal2. A one-dimensional groundwater transport model has been developed to
1 A 1-foot thick soil layer will be placed in 2016 for the Soil RACR. Additional soils will be placed in 2017. 2IBWC was awarded $22,000,000 to re-line the American Canal. It is anticipated that the new lining will create a barrier to seepage of groundwater into the canal.
G:\ENV\ENV\PROJ\1200\1209 - MP - El Paso Smelter\Response Action Plan\RAP August 2016\RAPr1 Worksheet 1.doc
Response Action Objectives Associated Information: Attachment 1A, 1B
RAP Worksheet 1.0 WS1.0 - Page 17 of 44
ID No.: SWR No. 31235 Report Date: August 2016
evaluate the down-gradient attainment of groundwater response objectives from treatment by the PRBs. A summary of the groundwater model and estimated cleanup times is presented in Appendix 3.6. The one-dimensional flow model applied to groundwater of the floodplain for the Rio Grande indicates that with MNA, groundwater-to-surface water (SWGW) PCLs are achievable in groundwater alternate POEs located along the eastern bank of the Rio Grande in approximately 30 years. Historic discharges of groundwater to the Rio Grande and American Canal did not typically result in exceedances of surface water PCLs due to the relative high surface water flow rates compared to groundwater discharge rates. Since 2012, operations of the Elephant Butte Reservoir by International Boundary and Water Commission (IBWC) have drastically reduced the flow of surface water in the Rio Grande and American Canal. Groundwater discharges to surface water have resulted in higher concentration of COCs; however, these elevated concentrations are associated with zero flow in the river indicating intermittent stream conditions. Concentrations of COCs in surface water are historically documented to be below surface water criteria under flowing conditions (See Appendix 3.2 for surface water monitoring reports). Under non-flowing conditions, human health receptor pathways are incomplete and ecological criteria are related to requirements for intermittent streams. Based on these observations, MNA of COCs in groundwater at the floodplain is appropriate following implementation of the remedy for groundwater at the PBA AA and Plant Site AAs. Response Action Effectiveness Reports (RAERs) monitoring the progress of the groundwater remedy will be completed every three years for a total of 9 RAERs to be submitted through 2045. Following attainment of the response action goal in the groundwater unit, a Groundwater RACR will be submitted.
Post Response Action Monitoring Post Response Action Care Reports (PRACRs) are prepared for response actions that include a long-term O&M and monitoring requirement. PRACR reports will be completed for the Site over the 10-year period from 2046 to 2056, at a one-year frequency interval, to evaluate the effectiveness of the site remedy on concentrations of COCs in the floodplain. Soil Response Action Objectives When using removal and/or decontamination with controls or controls only, demonstrate how that physical control or combination of measures will reliably contain COCs within and/or derived from the surface soil and subsurface soil PCLE zone materials over time. The response action objectives (RAOs) for Site soil are to prevent human exposure to COCs at concentrations above PCLs, based on multiple pathways of exposure. The Conceptual Site Model, Pathway Evaluation, and Protective Concentration Level Report (Malcolm Pirnie 2016a) identified complete exposure pathways (Section 3.0) and corresponding PCLs (Section 4.0) to identify PCLE Zones for each of the ten AAs. The RAOs are presented and discussed by individual AA below.
G:\ENV\ENV\PROJ\1200\1209 - MP - El Paso Smelter\Response Action Plan\RAP August 2016\RAPr1 Worksheet 1.doc
Response Action Objectives Associated Information: Attachment 1A, 1B
RAP Worksheet 1.0 WS1.0 - Page 18 of 44
ID No.: SWR No. 31235 Report Date: August 2016
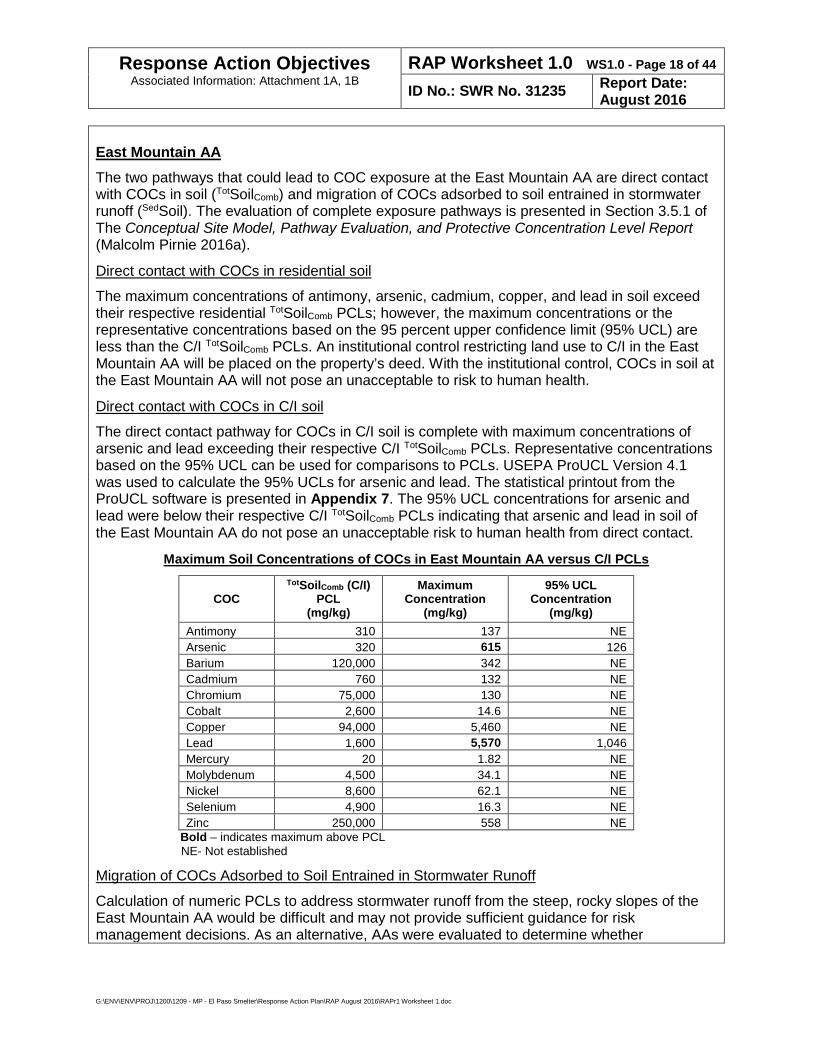
East Mountain AA The two pathways that could lead to COC exposure at the East Mountain AA are direct contact with COCs in soil (TotSoilComb) and migration of COCs adsorbed to soil entrained in stormwater runoff (SedSoil). The evaluation of complete exposure pathways is presented in Section 3.5.1 of The Conceptual Site Model, Pathway Evaluation, and Protective Concentration Level Report (Malcolm Pirnie 2016a).
Direct contact with COCs in residential soil
The maximum concentrations of antimony, arsenic, cadmium, copper, and lead in soil exceed their respective residential TotSoilComb PCLs; however, the maximum concentrations or the representative concentrations based on the 95 percent upper confidence limit (95% UCL) are less than the C/I TotSoilComb PCLs. An institutional control restricting land use to C/I in the East Mountain AA will be placed on the property’s deed. With the institutional control, COCs in soil at the East Mountain AA will not pose an unacceptable to risk to human health.
Direct contact with COCs in C/I soil
The direct contact pathway for COCs in C/I soil is complete with maximum concentrations of arsenic and lead exceeding their respective C/I TotSoilComb PCLs. Representative concentrations based on the 95% UCL can be used for comparisons to PCLs. USEPA ProUCL Version 4.1 was used to calculate the 95% UCLs for arsenic and lead. The statistical printout from the ProUCL software is presented in Appendix 7. The 95% UCL concentrations for arsenic and lead were below their respective C/I TotSoilComb PCLs indicating that arsenic and lead in soil of the East Mountain AA do not pose an unacceptable risk to human health from direct contact.
Maximum Soil Concentrations of COCs in East Mountain AA versus C/I PCLs
COC TotSoilComb (C/I)
PCL (mg/kg)
Maximum Concentration
(mg/kg)
95% UCL Concentration
(mg/kg) Antimony 310 137 NE Arsenic 320 615 126 Barium 120,000 342 NE Cadmium 760 132 NE Chromium 75,000 130 NE Cobalt 2,600 14.6 NE Copper 94,000 5,460 NE Lead 1,600 5,570 1,046 Mercury 20 1.82 NE Molybdenum 4,500 34.1 NE Nickel 8,600 62.1 NE Selenium 4,900 16.3 NE Zinc 250,000 558 NE
Bold – indicates maximum above PCL NE- Not established
Migration of COCs Adsorbed to Soil Entrained in Stormwater Runoff
Calculation of numeric PCLs to address stormwater runoff from the steep, rocky slopes of the East Mountain AA would be difficult and may not provide sufficient guidance for risk management decisions. As an alternative, AAs were evaluated to determine whether
G:\ENV\ENV\PROJ\1200\1209 - MP - El Paso Smelter\Response Action Plan\RAP August 2016\RAPr1 Worksheet 1.doc
Response Action Objectives Associated Information: Attachment 1A, 1B
RAP Worksheet 1.0 WS1.0 - Page 19 of 44
ID No.: SWR No. 31235 Report Date: August 2016
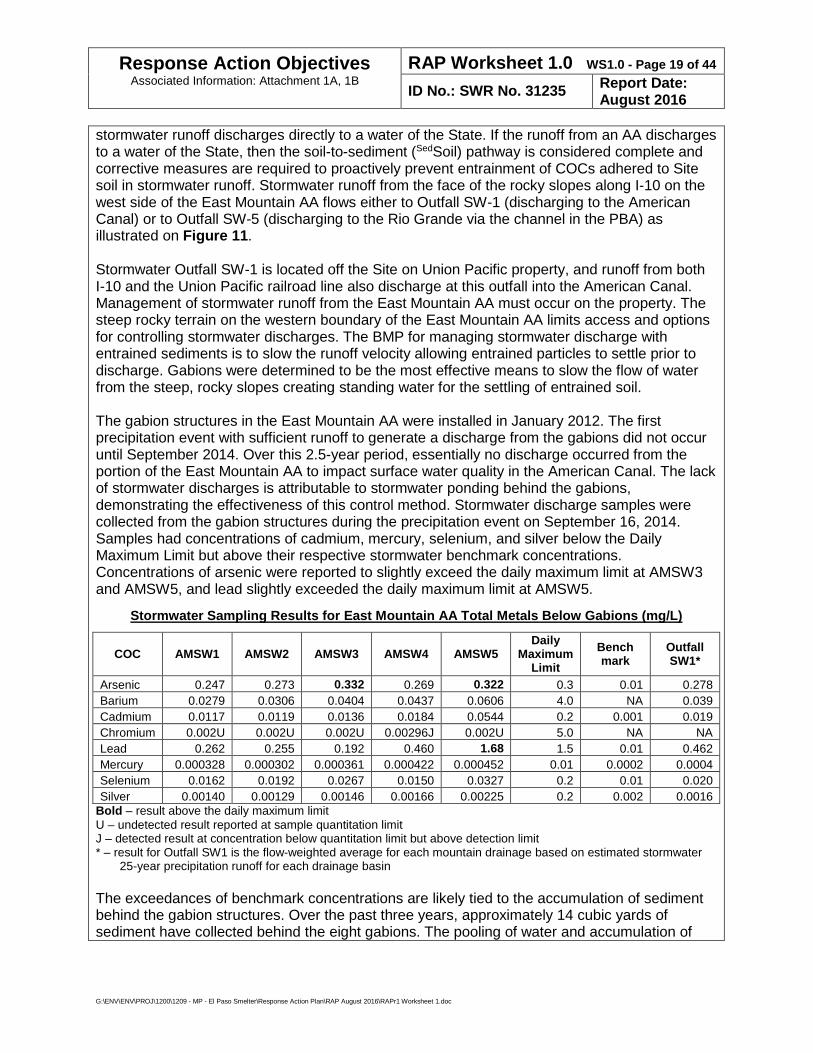
stormwater runoff discharges directly to a water of the State. If the runoff from an AA discharges to a water of the State, then the soil-to-sediment (SedSoil) pathway is considered complete and corrective measures are required to proactively prevent entrainment of COCs adhered to Site soil in stormwater runoff. Stormwater runoff from the face of the rocky slopes along I-10 on the west side of the East Mountain AA flows either to Outfall SW-1 (discharging to the American Canal) or to Outfall SW-5 (discharging to the Rio Grande via the channel in the PBA) as illustrated on Figure 11. Stormwater Outfall SW-1 is located off the Site on Union Pacific property, and runoff from both I-10 and the Union Pacific railroad line also discharge at this outfall into the American Canal. Management of stormwater runoff from the East Mountain AA must occur on the property. The steep rocky terrain on the western boundary of the East Mountain AA limits access and options for controlling stormwater discharges. The BMP for managing stormwater discharge with entrained sediments is to slow the runoff velocity allowing entrained particles to settle prior to discharge. Gabions were determined to be the most effective means to slow the flow of water from the steep, rocky slopes creating standing water for the settling of entrained soil. The gabion structures in the East Mountain AA were installed in January 2012. The first precipitation event with sufficient runoff to generate a discharge from the gabions did not occur until September 2014. Over this 2.5-year period, essentially no discharge occurred from the portion of the East Mountain AA to impact surface water quality in the American Canal. The lack of stormwater discharges is attributable to stormwater ponding behind the gabions, demonstrating the effectiveness of this control method. Stormwater discharge samples were collected from the gabion structures during the precipitation event on September 16, 2014. Samples had concentrations of cadmium, mercury, selenium, and silver below the Daily Maximum Limit but above their respective stormwater benchmark concentrations. Concentrations of arsenic were reported to slightly exceed the daily maximum limit at AMSW3 and AMSW5, and lead slightly exceeded the daily maximum limit at AMSW5.
Stormwater Sampling Results for East Mountain AA Total Metals Below Gabions (mg/L)
COC AMSW1 AMSW2 AMSW3 AMSW4 AMSW5 Daily
Maximum Limit
Bench mark
Outfall SW1*
Arsenic 0.247 0.273 0.332 0.269 0.322 0.3 0.01 0.278 Barium 0.0279 0.0306 0.0404 0.0437 0.0606 4.0 NA 0.039 Cadmium 0.0117 0.0119 0.0136 0.0184 0.0544 0.2 0.001 0.019 Chromium 0.002U 0.002U 0.002U 0.00296J 0.002U 5.0 NA NA Lead 0.262 0.255 0.192 0.460 1.68 1.5 0.01 0.462 Mercury 0.000328 0.000302 0.000361 0.000422 0.000452 0.01 0.0002 0.0004 Selenium 0.0162 0.0192 0.0267 0.0150 0.0327 0.2 0.01 0.020 Silver 0.00140 0.00129 0.00146 0.00166 0.00225 0.2 0.002 0.0016
Bold – result above the daily maximum limit U – undetected result reported at sample quantitation limit J – detected result at concentration below quantitation limit but above detection limit * – result for Outfall SW1 is the flow-weighted average for each mountain drainage based on estimated stormwater
25-year precipitation runoff for each drainage basin The exceedances of benchmark concentrations are likely tied to the accumulation of sediment behind the gabion structures. Over the past three years, approximately 14 cubic yards of sediment have collected behind the eight gabions. The pooling of water and accumulation of
G:\ENV\ENV\PROJ\1200\1209 - MP - El Paso Smelter\Response Action Plan\RAP August 2016\RAPr1 Worksheet 1.doc
Response Action Objectives Associated Information: Attachment 1A, 1B
RAP Worksheet 1.0 WS1.0 - Page 20 of 44
ID No.: SWR No. 31235 Report Date: August 2016
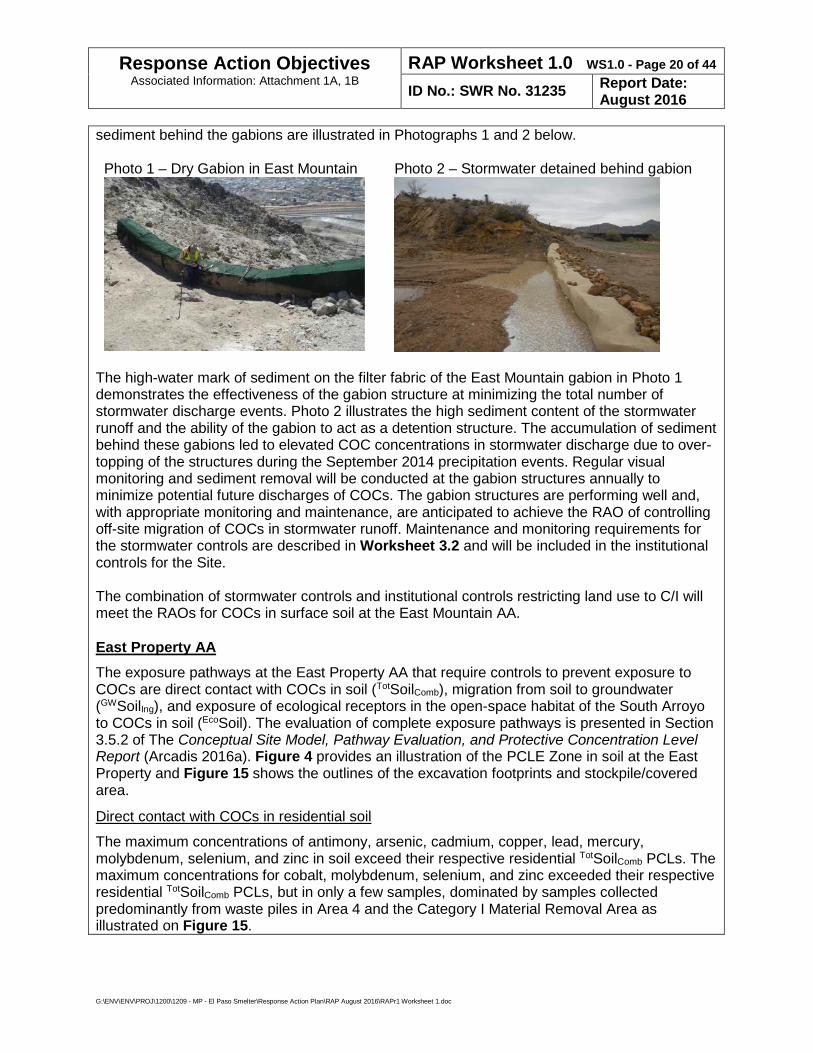
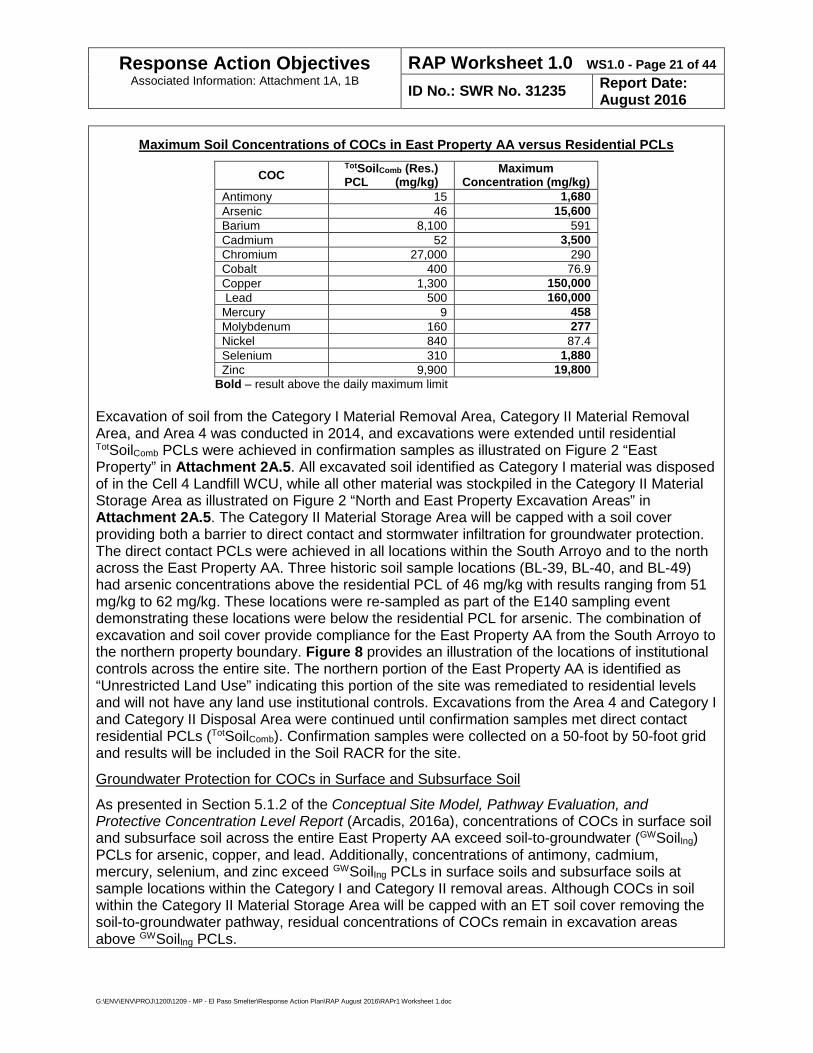
sediment behind the gabions are illustrated in Photographs 1 and 2 below. Photo 1 – Dry Gabion in East Mountain Photo 2 – Stormwater detained behind gabion
The high-water mark of sediment on the filter fabric of the East Mountain gabion in Photo 1 demonstrates the effectiveness of the gabion structure at minimizing the total number of stormwater discharge events. Photo 2 illustrates the high sediment content of the stormwater runoff and the ability of the gabion to act as a detention structure. The accumulation of sediment behind these gabions led to elevated COC concentrations in stormwater discharge due to over-topping of the structures during the September 2014 precipitation events. Regular visual monitoring and sediment removal will be conducted at the gabion structures annually to minimize potential future discharges of COCs. The gabion structures are performing well and, with appropriate monitoring and maintenance, are anticipated to achieve the RAO of controlling off-site migration of COCs in stormwater runoff. Maintenance and monitoring requirements for the stormwater controls are described in Worksheet 3.2 and will be included in the institutional controls for the Site. The combination of stormwater controls and institutional controls restricting land use to C/I will meet the RAOs for COCs in surface soil at the East Mountain AA.
East Property AA The exposure pathways at the East Property AA that require controls to prevent exposure to COCs are direct contact with COCs in soil (TotSoilComb), migration from soil to groundwater (GWSoilIng), and exposure of ecological receptors in the open-space habitat of the South Arroyo to COCs in soil (EcoSoil). The evaluation of complete exposure pathways is presented in Section 3.5.2 of The Conceptual Site Model, Pathway Evaluation, and Protective Concentration Level Report (Arcadis 2016a). Figure 4 provides an illustration of the PCLE Zone in soil at the East Property and Figure 15 shows the outlines of the excavation footprints and stockpile/covered area.
Direct contact with COCs in residential soil
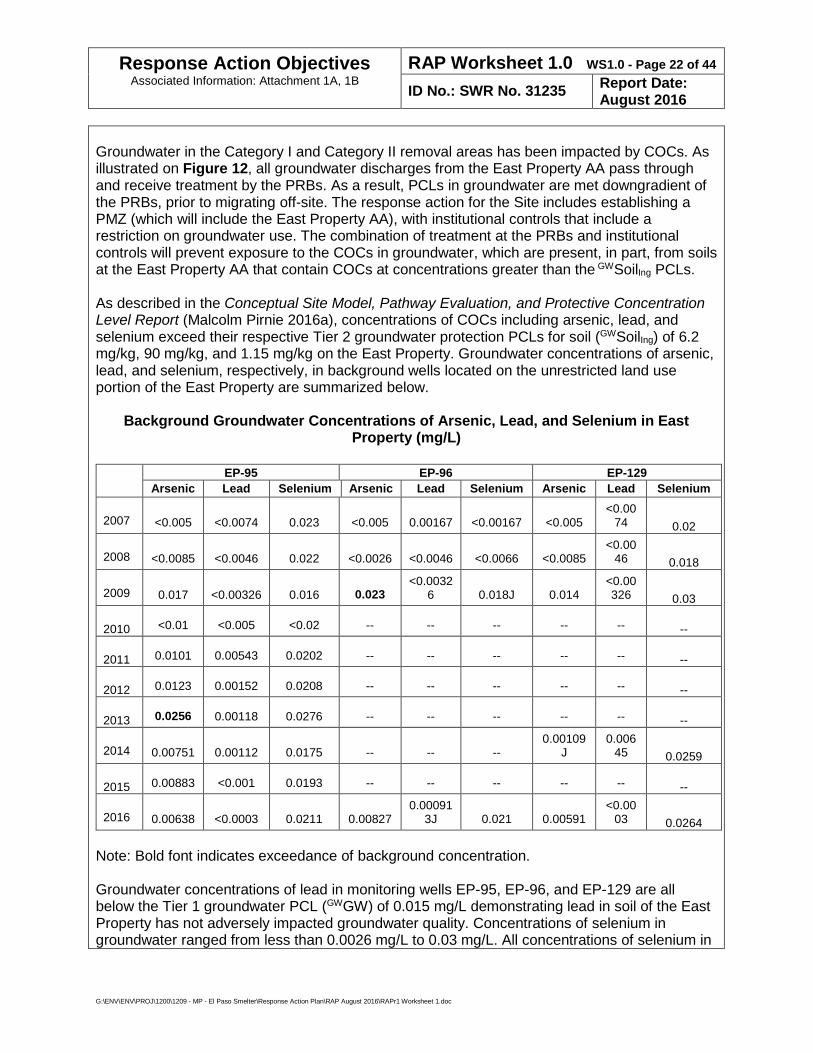
The maximum concentrations of antimony, arsenic, cadmium, copper, lead, mercury, molybdenum, selenium, and zinc in soil exceed their respective residential TotSoilComb PCLs. The maximum concentrations for cobalt, molybdenum, selenium, and zinc exceeded their respective residential TotSoilComb PCLs, but in only a few samples, dominated by samples collected predominantly from waste piles in Area 4 and the Category I Material Removal Area as illustrated on Figure 15.
G:\ENV\ENV\PROJ\1200\1209 - MP - El Paso Smelter\Response Action Plan\RAP August 2016\RAPr1 Worksheet 1.doc
Response Action Objectives Associated Information: Attachment 1A, 1B
RAP Worksheet 1.0 WS1.0 - Page 21 of 44
ID No.: SWR No. 31235 Report Date: August 2016
Maximum Soil Concentrations of COCs in East Property AA versus Residential PCLs
COC TotSoilComb (Res.) PCL (mg/kg)
Maximum Concentration (mg/kg)
Antimony 15 1,680 Arsenic 46 15,600 Barium 8,100 591 Cadmium 52 3,500 Chromium 27,000 290 Cobalt 400 76.9 Copper 1,300 150,000 Lead 500 160,000 Mercury 9 458 Molybdenum 160 277 Nickel 840 87.4 Selenium 310 1,880 Zinc 9,900 19,800
Bold – result above the daily maximum limit Excavation of soil from the Category I Material Removal Area, Category II Material Removal Area, and Area 4 was conducted in 2014, and excavations were extended until residential TotSoilComb PCLs were achieved in confirmation samples as illustrated on Figure 2 “East Property” in Attachment 2A.5. All excavated soil identified as Category I material was disposed of in the Cell 4 Landfill WCU, while all other material was stockpiled in the Category II Material Storage Area as illustrated on Figure 2 “North and East Property Excavation Areas” in Attachment 2A.5. The Category II Material Storage Area will be capped with a soil cover providing both a barrier to direct contact and stormwater infiltration for groundwater protection. The direct contact PCLs were achieved in all locations within the South Arroyo and to the north across the East Property AA. Three historic soil sample locations (BL-39, BL-40, and BL-49) had arsenic concentrations above the residential PCL of 46 mg/kg with results ranging from 51 mg/kg to 62 mg/kg. These locations were re-sampled as part of the E140 sampling event demonstrating these locations were below the residential PCL for arsenic. The combination of excavation and soil cover provide compliance for the East Property AA from the South Arroyo to the northern property boundary. Figure 8 provides an illustration of the locations of institutional controls across the entire site. The northern portion of the East Property AA is identified as “Unrestricted Land Use” indicating this portion of the site was remediated to residential levels and will not have any land use institutional controls. Excavations from the Area 4 and Category I and Category II Disposal Area were continued until confirmation samples met direct contact residential PCLs (TotSoilComb). Confirmation samples were collected on a 50-foot by 50-foot grid and results will be included in the Soil RACR for the site.
Groundwater Protection for COCs in Surface and Subsurface Soil
As presented in Section 5.1.2 of the Conceptual Site Model, Pathway Evaluation, and Protective Concentration Level Report (Arcadis, 2016a), concentrations of COCs in surface soil and subsurface soil across the entire East Property AA exceed soil-to-groundwater (GWSoilIng) PCLs for arsenic, copper, and lead. Additionally, concentrations of antimony, cadmium, mercury, selenium, and zinc exceed GWSoilIng PCLs in surface soils and subsurface soils at sample locations within the Category I and Category II removal areas. Although COCs in soil within the Category II Material Storage Area will be capped with an ET soil cover removing the soil-to-groundwater pathway, residual concentrations of COCs remain in excavation areas above GWSoilIng PCLs.
G:\ENV\ENV\PROJ\1200\1209 - MP - El Paso Smelter\Response Action Plan\RAP August 2016\RAPr1 Worksheet 1.doc
Response Action Objectives Associated Information: Attachment 1A, 1B
RAP Worksheet 1.0 WS1.0 - Page 22 of 44
ID No.: SWR No. 31235 Report Date: August 2016
Groundwater in the Category I and Category II removal areas has been impacted by COCs. As illustrated on Figure 12, all groundwater discharges from the East Property AA pass through and receive treatment by the PRBs. As a result, PCLs in groundwater are met downgradient of the PRBs, prior to migrating off-site. The response action for the Site includes establishing a PMZ (which will include the East Property AA), with institutional controls that include a restriction on groundwater use. The combination of treatment at the PRBs and institutional controls will prevent exposure to the COCs in groundwater, which are present, in part, from soils at the East Property AA that contain COCs at concentrations greater than the GWSoilIng PCLs. As described in the Conceptual Site Model, Pathway Evaluation, and Protective Concentration Level Report (Malcolm Pirnie 2016a), concentrations of COCs including arsenic, lead, and selenium exceed their respective Tier 2 groundwater protection PCLs for soil (GWSoilIng) of 6.2 mg/kg, 90 mg/kg, and 1.15 mg/kg on the East Property. Groundwater concentrations of arsenic, lead, and selenium, respectively, in background wells located on the unrestricted land use portion of the East Property are summarized below.
Background Groundwater Concentrations of Arsenic, Lead, and Selenium in East Property (mg/L)
EP-95 EP-96 EP-129
Arsenic Lead Selenium Arsenic Lead Selenium Arsenic Lead Selenium
2007 <0.005 <0.0074 0.023 <0.005 0.00167 <0.00167 <0.005 <0.00
74 0.02
2008 <0.0085 <0.0046 0.022 <0.0026 <0.0046 <0.0066 <0.0085 <0.00
46 0.018
2009 0.017 <0.00326 0.016 0.023 <0.0032
6 0.018J 0.014 <0.00326 0.03
2010 <0.01 <0.005 <0.02 -- -- -- -- -- --
2011 0.0101 0.00543 0.0202 -- -- -- -- -- --
2012 0.0123 0.00152 0.0208 -- -- -- -- -- --
2013 0.0256 0.00118 0.0276 -- -- -- -- -- --
2014 0.00751 0.00112 0.0175 -- -- -- 0.00109
J 0.006
45 0.0259
2015 0.00883 <0.001 0.0193 -- -- -- -- -- --
2016 0.00638 <0.0003 0.0211 0.00827 0.00091
3J 0.021 0.00591 <0.00
03 0.0264 Note: Bold font indicates exceedance of background concentration. Groundwater concentrations of lead in monitoring wells EP-95, EP-96, and EP-129 are all below the Tier 1 groundwater PCL (GWGW) of 0.015 mg/L demonstrating lead in soil of the East Property has not adversely impacted groundwater quality. Concentrations of selenium in groundwater ranged from less than 0.0026 mg/L to 0.03 mg/L. All concentrations of selenium in
G:\ENV\ENV\PROJ\1200\1209 - MP - El Paso Smelter\Response Action Plan\RAP August 2016\RAPr1 Worksheet 1.doc
Response Action Objectives Associated Information: Attachment 1A, 1B
RAP Worksheet 1.0 WS1.0 - Page 23 of 44
ID No.: SWR No. 31235 Report Date: August 2016
groundwater samples are below its Tier 1 GWGW PCL of 0.05 mg/L and background concentration of 0.035 mg/L. Finally, arsenic concentrations in groundwater samples from these background wells range from less than 0.003 mg/L to 0.0256 mg/L, often exceeding the 0.01 mg/L Tier 1 PCL and exceeding the background concentration of 0.02 mg/L in one sample collected from EP-95 in 2013 and one sample collected from EP-96 in 2009. In samples collected during the most recent groundwater monitoring event, concentrations of arsenic reported in all groundwater samples from background wells were below the Tier 1 PCL for arsenic and ranged from 0.00591 mg/L in the sample from EP-129 to 0.00827 mg/L in the sample from EP-96. These data demonstrate that residual concentrations of arsenic, lead, and selenium in soil of the unrestricted land use portion of the East Property above their respective GWSoilIng PCLs do not adversely impact groundwater quality.
Protection of Ecological Receptors in Open Space of South Arroyo
The future land use of the Site will include maintenance of the South Arroyo as an open space providing habitat for ecological receptors within the East Property AA. Figure 2 “East Property” in Attachment 2A.5 provides an illustration of the exceedances of ecological PCLs in the South Arroyo relative to excavations for the Category I and Category II Removal Areas.
Soil Concentrations of COCs in South Arroyo versus Residential and Ecological PCLs
COC TotSoilComb (Res.) PCL
(mg/kg) EcoSoil PCL
(mg/kg) 95% UCL Confirmation
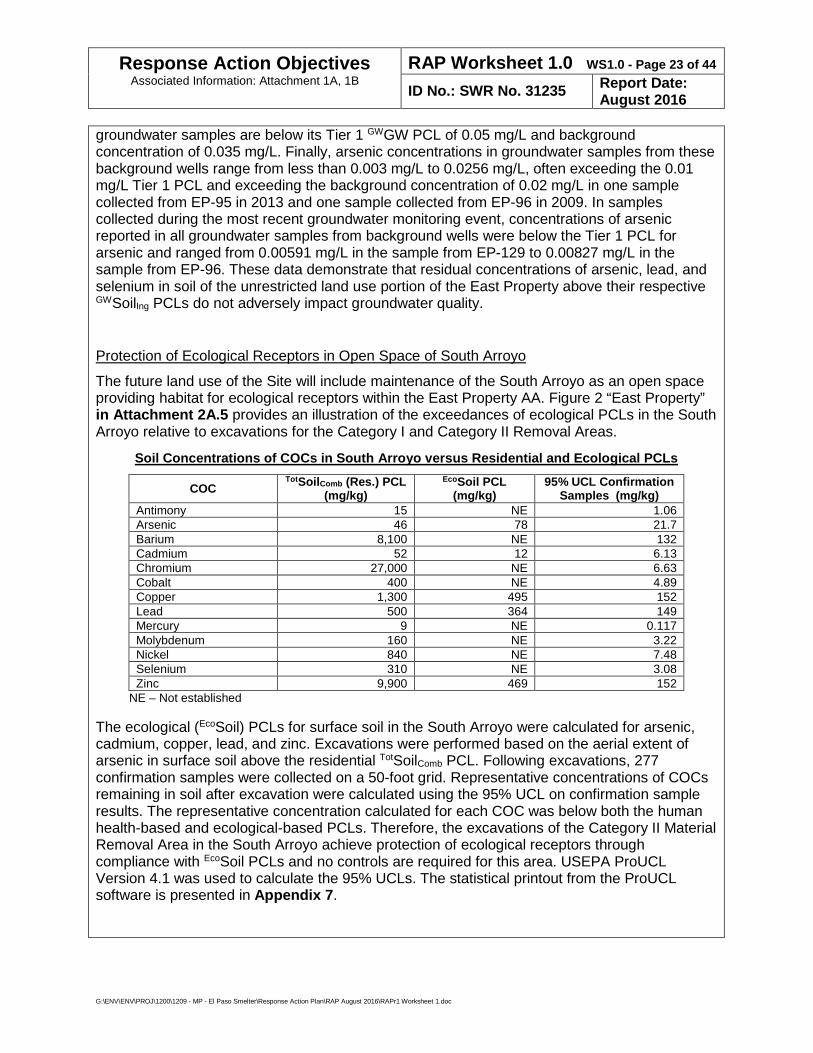
Samples (mg/kg) Antimony 15 NE 1.06 Arsenic 46 78 21.7 Barium 8,100 NE 132 Cadmium 52 12 6.13 Chromium 27,000 NE 6.63 Cobalt 400 NE 4.89 Copper 1,300 495 152 Lead 500 364 149 Mercury 9 NE 0.117 Molybdenum 160 NE 3.22 Nickel 840 NE 7.48 Selenium 310 NE 3.08 Zinc 9,900 469 152
NE – Not established The ecological (EcoSoil) PCLs for surface soil in the South Arroyo were calculated for arsenic, cadmium, copper, lead, and zinc. Excavations were performed based on the aerial extent of arsenic in surface soil above the residential TotSoilComb PCL. Following excavations, 277 confirmation samples were collected on a 50-foot grid. Representative concentrations of COCs remaining in soil after excavation were calculated using the 95% UCL on confirmation sample results. The representative concentration calculated for each COC was below both the human health-based and ecological-based PCLs. Therefore, the excavations of the Category II Material Removal Area in the South Arroyo achieve protection of ecological receptors through compliance with EcoSoil PCLs and no controls are required for this area. USEPA ProUCL Version 4.1 was used to calculate the 95% UCLs. The statistical printout from the ProUCL software is presented in Appendix 7.
G:\ENV\ENV\PROJ\1200\1209 - MP - El Paso Smelter\Response Action Plan\RAP August 2016\RAPr1 Worksheet 1.doc
Response Action Objectives Associated Information: Attachment 1A, 1B
RAP Worksheet 1.0 WS1.0 - Page 24 of 44
ID No.: SWR No. 31235 Report Date: August 2016
Plant Entrance Arroyo AA The exposure pathway at the Plant Entrance Arroyo AA that requires controls to prevent exposure is direct contact with COCs in soil (TotSoilComb). The evaluation of complete exposure pathways at the Plant Entrance Arroyo AA is presented in Section 3.5.3 of The Conceptual Site Model, Pathway Evaluation, and Protective Concentration Level Report (Arcadis, 2016a). Figure 4 provides an illustration of the PCLE Zone in soil at the Plant Entrance Arroyo AA and Figure 16 shows the outlines of the excavation footprints and stockpile/covered area.
Direct contact with COCs in soil
The maximum concentrations of arsenic, cadmium, copper, lead, and mercury exceed their respective residential TotSoilComb PCLs; and the maximum concentrations of arsenic and lead also exceed their respective C/I TotSoilComb PCLs. The entire PCLE zone for arsenic and lead will be excavated to one-foot in depth with areas around soil sample locations EP-110 and SSENT-10 excavated to two feet. Excavations of the PCLE Zone at the Plant Entrance Arroyo will achieve the C/I TotSoilComb PCL, satisfying the RAO. The existing rubber pond provides a barrier to direct contact with COCs. Additional soil samples were collected around the rubber pond, as illustrated in Appendix 2 and on Figure 4. Concentrations of arsenic and lead in surface soil around the rubber pond exceed their respective C/I TotSoilComb PCLs. Slope stabilization and drainage improvements to be installed at the plant site to control infiltration of precipitation will be extended to this area. Additionally, an institutional control restricting the Plant Entrance Arroyo AA to C/I land use will be placed on the property’s deed. With the soil removals, cover system, and institutional controls, COCs in soil at the Plant Entrance Arroyo AA will not pose an unacceptable to risk to human health.
Maximum Soil Concentrations of COCs Plant Entrance Arroyo AA versus C/I PCLs
COC
TotSoilComb (Residential)
PCL (mg/kg)
TotSoilComb (C/I) PCL
(mg/kg)
Maximum Concentration
(mg/kg)
Arsenic 46 320 1,300 Cadmium 52 760 626 Chromium 27,000 75,000 200 Copper 1,300 94,000 31,000 Lead 500 1,600 9,600 Mercury 9 20 16 Selenium 310 4,900 33 Zinc 9,900 250,000 5,700
Bold – indicates maximum above C/I PCL.
Plant Site: South Terrace Arroyo AA and Pond 1 Arroyo AA The exposure pathways at the plant site that require controls to prevent exposure are direct contact with COCs in soil (TotSoilComb), migration from soil to groundwater (GWSoilIng), and migration from soil to groundwater to surface water/sediment (SW-GWSoil). Reported concentrations of mercury in soil indicate that the inhalation of volatile chemicals from soil (AirSoilInh-v) is also complete for small portions of the property. The evaluation of complete exposure pathways at the plant site including South Terrace Arroyo, Pond 1, Pond 5/6, and
G:\ENV\ENV\PROJ\1200\1209 - MP - El Paso Smelter\Response Action Plan\RAP August 2016\RAPr1 Worksheet 1.doc
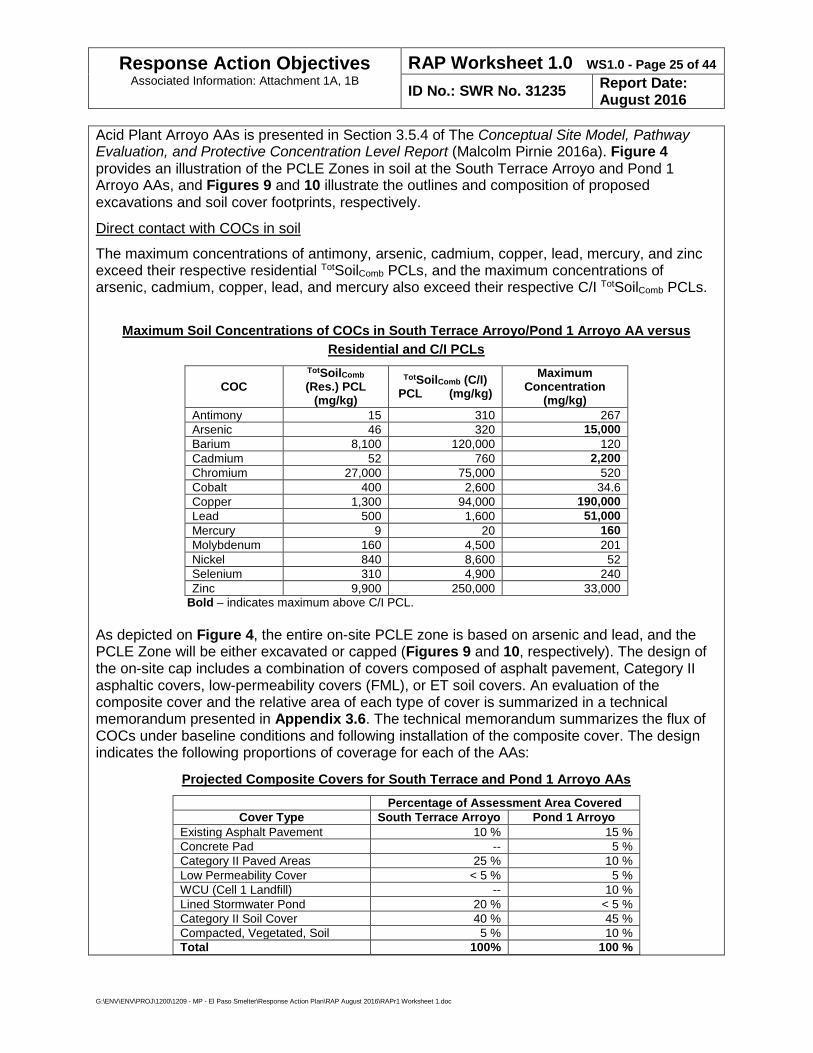
Response Action Objectives Associated Information: Attachment 1A, 1B
RAP Worksheet 1.0 WS1.0 - Page 25 of 44
ID No.: SWR No. 31235 Report Date: August 2016
Acid Plant Arroyo AAs is presented in Section 3.5.4 of The Conceptual Site Model, Pathway Evaluation, and Protective Concentration Level Report (Malcolm Pirnie 2016a). Figure 4 provides an illustration of the PCLE Zones in soil at the South Terrace Arroyo and Pond 1 Arroyo AAs, and Figures 9 and 10 illustrate the outlines and composition of proposed excavations and soil cover footprints, respectively.
Direct contact with COCs in soil
The maximum concentrations of antimony, arsenic, cadmium, copper, lead, mercury, and zinc exceed their respective residential TotSoilComb PCLs, and the maximum concentrations of arsenic, cadmium, copper, lead, and mercury also exceed their respective C/I TotSoilComb PCLs.
Maximum Soil Concentrations of COCs in South Terrace Arroyo/Pond 1 Arroyo AA versus Residential and C/I PCLs
COC TotSoilComb (Res.) PCL
(mg/kg)
TotSoilComb (C/I) PCL (mg/kg)
Maximum Concentration
(mg/kg) Antimony 15 310 267 Arsenic 46 320 15,000 Barium 8,100 120,000 120 Cadmium 52 760 2,200 Chromium 27,000 75,000 520 Cobalt 400 2,600 34.6 Copper 1,300 94,000 190,000 Lead 500 1,600 51,000 Mercury 9 20 160 Molybdenum 160 4,500 201 Nickel 840 8,600 52 Selenium 310 4,900 240 Zinc 9,900 250,000 33,000
Bold – indicates maximum above C/I PCL. As depicted on Figure 4, the entire on-site PCLE zone is based on arsenic and lead, and the PCLE Zone will be either excavated or capped (Figures 9 and 10, respectively). The design of the on-site cap includes a combination of covers composed of asphalt pavement, Category II asphaltic covers, low-permeability covers (FML), or ET soil covers. An evaluation of the composite cover and the relative area of each type of cover is summarized in a technical memorandum presented in Appendix 3.6. The technical memorandum summarizes the flux of COCs under baseline conditions and following installation of the composite cover. The design indicates the following proportions of coverage for each of the AAs:
Projected Composite Covers for South Terrace and Pond 1 Arroyo AAs Percentage of Assessment Area Covered
Cover Type South Terrace Arroyo Pond 1 Arroyo Existing Asphalt Pavement 10 % 15 % Concrete Pad -- 5 % Category II Paved Areas 25 % 10 % Low Permeability Cover < 5 % 5 % WCU (Cell 1 Landfill) -- 10 % Lined Stormwater Pond 20 % < 5 % Category II Soil Cover 40 % 45 % Compacted, Vegetated, Soil 5 % 10 % Total 100% 100 %
G:\ENV\ENV\PROJ\1200\1209 - MP - El Paso Smelter\Response Action Plan\RAP August 2016\RAPr1 Worksheet 1.doc
Response Action Objectives Associated Information: Attachment 1A, 1B
RAP Worksheet 1.0 WS1.0 - Page 26 of 44
ID No.: SWR No. 31235 Report Date: August 2016
The compacted, vegetated soil areas are associated with areas identified for excavation due to the presence of mercury above inhalation-based PCLs. Following excavation, native soils will be used to grade the site, compacted to reduce infiltration, and vegetated to provide additional infiltration management. The covers, in conjunction with institutional controls to restrict activities that would compromise the barriers, will prevent exposure of human receptors to COCs in soils of the South Terrace Arroyo and Pond 1 Arroyo AAs. “Soil Sample Results, Rubber Pond and Storage Yard” in Appendix 2.5 defines the extent of impacts to surface soil, principally from antimony, arsenic, lead, and mercury, in the eastern portion of the South Terrace and Pond 1 Arroyo AAs in the vicinity of the former Antimony Processing Building. Excavation has been chosen for remediation in this area due to the presence of potentially volatile forms of mercury. While performing the mercury removal, excavations in the eastern portion of these two AAs will also achieve the lower of the C/I TotSoilComb or SW-GWSoil PCLs for COCs in surface soil achieving the RAO of protecting human health from direct contact with COCs above their respective TotSoilComb PCLs. Human exposure to soil COCs concentrations above the PCL in this area will be eliminated following excavation. An institutional control protecting the integrity of the cover system at the South Terrace Arroyo and Pond 1 Arroyo AAs will be placed on the property’s deed to provide long-term assurance against future exposure. Additionally, an institutional control restricting the land use at these AAs to C/I will be placed on the property’s deed. With the soil removals, cover system, and institutional controls, COCs in soil at the South Terrace Arroyo and Pond 1 Arroyo AAs will not pose an unacceptable to risk to human health.
Groundwater Protection for COCs in Surface and Subsurface Soil
As presented in Sections 5.1.3.2 and 5.1.3.3 of the Conceptual Site Model, Pathway Evaluation, and Protective Concentration Level Report (Arcadis, 2016a), concentrations of COCs in surface soil (0 to 5 feet below ground surface [bgs]) of the South Terrace Arroyo and Pond 1 Arroyo AAs exceed soil-to-groundwater (GWSoilIng) PCLs for arsenic, copper, and lead, while only arsenic concentrations typically exceed its GWSoilIng PCL in subsurface soil (>5 feet bgs). Concentrations of antimony, cadmium, mercury, and zinc also exceed their respective GWSoilIng PCLs in surface soils at individual sample locations within these areas. Selenium results for soil samples had reporting limits typically ranging from 10 to 20 mg/kg, which is above its 1.15 mg/kg GWSoilIng PCL. Arsenic, however, has the greatest distribution in surface and subsurface soil above its GWSoilIng PCL and dictates the extents of excavations, soil covers, and institutional controls required to meet the RAOs for the GWSoilIng pathway. The plant site will have institutional controls restricting the use of groundwater (see Figure 8) in conjunction with a PMZ established as part of the response action, removing the exposure pathway to COCs in groundwater. Additionally, the plant site will be almost completely covered to reduce infiltration. The combination of the groundwater use restriction, the PMZ, and the covers, remove the pathway for the GWSoilIng PCLs.
G:\ENV\ENV\PROJ\1200\1209 - MP - El Paso Smelter\Response Action Plan\RAP August 2016\RAPr1 Worksheet 1.doc
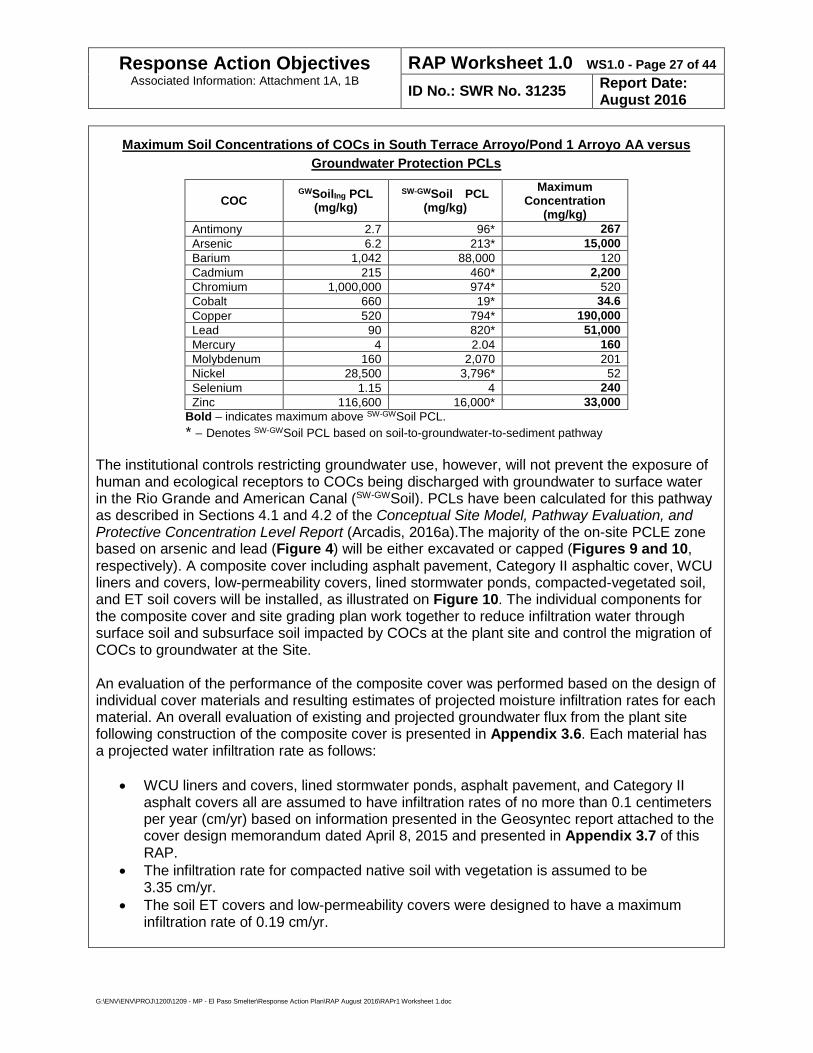
Response Action Objectives Associated Information: Attachment 1A, 1B
RAP Worksheet 1.0 WS1.0 - Page 27 of 44
ID No.: SWR No. 31235 Report Date: August 2016
Maximum Soil Concentrations of COCs in South Terrace Arroyo/Pond 1 Arroyo AA versus Groundwater Protection PCLs
COC GWSoilIng PCL
(mg/kg) SW-GWSoil PCL
(mg/kg) Maximum
Concentration (mg/kg)
Antimony 2.7 96* 267 Arsenic 6.2 213* 15,000 Barium 1,042 88,000 120 Cadmium 215 460* 2,200 Chromium 1,000,000 974* 520 Cobalt 660 19* 34.6 Copper 520 794* 190,000 Lead 90 820* 51,000 Mercury 4 2.04 160 Molybdenum 160 2,070 201 Nickel 28,500 3,796* 52 Selenium 1.15 4 240 Zinc 116,600 16,000* 33,000
Bold – indicates maximum above SW-GWSoil PCL. * – Denotes SW-GWSoil PCL based on soil-to-groundwater-to-sediment pathway The institutional controls restricting groundwater use, however, will not prevent the exposure of human and ecological receptors to COCs being discharged with groundwater to surface water in the Rio Grande and American Canal (SW-GWSoil). PCLs have been calculated for this pathway as described in Sections 4.1 and 4.2 of the Conceptual Site Model, Pathway Evaluation, and Protective Concentration Level Report (Arcadis, 2016a).The majority of the on-site PCLE zone based on arsenic and lead (Figure 4) will be either excavated or capped (Figures 9 and 10, respectively). A composite cover including asphalt pavement, Category II asphaltic cover, WCU liners and covers, low-permeability covers, lined stormwater ponds, compacted-vegetated soil, and ET soil covers will be installed, as illustrated on Figure 10. The individual components for the composite cover and site grading plan work together to reduce infiltration water through surface soil and subsurface soil impacted by COCs at the plant site and control the migration of COCs to groundwater at the Site. An evaluation of the performance of the composite cover was performed based on the design of individual cover materials and resulting estimates of projected moisture infiltration rates for each material. An overall evaluation of existing and projected groundwater flux from the plant site following construction of the composite cover is presented in Appendix 3.6. Each material has a projected water infiltration rate as follows:
• WCU liners and covers, lined stormwater ponds, asphalt pavement, and Category II asphalt covers all are assumed to have infiltration rates of no more than 0.1 centimeters per year (cm/yr) based on information presented in the Geosyntec report attached to the cover design memorandum dated April 8, 2015 and presented in Appendix 3.7 of this RAP.
• The infiltration rate for compacted native soil with vegetation is assumed to be 3.35 cm/yr.
• The soil ET covers and low-permeability covers were designed to have a maximum infiltration rate of 0.19 cm/yr.
G:\ENV\ENV\PROJ\1200\1209 - MP - El Paso Smelter\Response Action Plan\RAP August 2016\RAPr1 Worksheet 1.doc
Response Action Objectives Associated Information: Attachment 1A, 1B
RAP Worksheet 1.0 WS1.0 - Page 28 of 44
ID No.: SWR No. 31235 Report Date: August 2016
The installation of the covers, as described in the cover modeling report (Appendix 3.7), results in an overall decrease of the site-wide infiltration rate by 86 percent. Subsequent groundwater flux modeling (Appendix 3.6) indicated that individually, the estimated decrease for the South Terrace Arroyo AA is projected to be approximately 78 percent, while the projected decrease for the Pond 1 Arroyo AA is projected to be approximately 62 percent. The lower reduction in infiltration at these two AAs is related to the compacted, vegetated soil around the former Antimony Building. This area will be excavated to SW-GWSoil PCLs, and then native material will be compacted and vegetated. The purpose of the native material compaction and vegetation is to reduce surface infiltration and contribute to the overall goal of reducing the groundwater hydraulic gradient from the plant site. As described in the report Arroyo Groundwater Arsenic Discharge Concentration Predictions and Estimation of Flushing Timeframes (Appendix 3.9), although the mass of arsenic discharged to the floodplain of the Rio Grande from the South Terrace and Pond 1 Arroyo AAs accounts for only 2 percent of the total arsenic discharged in groundwater from the Site (in comparison, the mass of arsenic discharged from the PBA accounts for 63 percent), the projected decrease in infiltration rates calculated for the South Terrace and Pond 1 Arroyos will be sufficient to achieve the overall hydraulic control and prevent discharges from these AAs that result in exceedances of the SW PCLs in the Rio Grande and American Canal. Inhalation of Emissions of Volatile COCs Soil sample collection around the former Antimony Building conducted in the spring of 2015 indicated the presence of mercury in soil slough on paved areas following building demolition at levels above the site-specific PCL for inhalation of volatile chemicals from soil (AirSoilInh-v). Mercury is the only COC from the South Terrace Arroyo and Pond 1 Arroyo AAs that is classified as volatile and must be addressed for this exposure pathway. Soil covers used to prevent direct contact with COCs in soil are not effective at preventing exposure to vapors that can migrate through them. Delineation of COCs in soil from the Antimony Building is presented in “Soil Sample Results, Rubber Pond and Storage Yard” in Appendix 2.5 of this RAP. The site-specific AirSoilInh-v PCL for mercury is 22 mg/kg. Much of the material in the vicinity of the Former Antimony Building is slough on asphalt pavement from previous demolition of structures. These areas will have soil removed and disposed of in the Cell 4 WCU. Other areas where mercury contamination is in exposed soil will be excavated as illustrated on Figure 9. Soil from areas with mercury concentrations above the 22 mg/kg AirSoilInh-v PCL will be disposed of in the Cell 4 Landfill WCU. Remaining soil with concentrations above SW-GWSoil PCLs will be excavated and placed as fill beneath the soil ET cover. The excavation will remove all soil with mercury levels above the AirSoilInh-v PCL, providing protection of human health by the inhalation pathway. Stormwater Control and Slope Stabilization The construction and operation of the SWCRS has been documented in the Conceptual Site Model, Pathway Evaluation, and Protective Concentration Level Report (Arcadis 2016a). The cover design for the plant site includes grading and drainage plans that direct on-site stormwater runoff to the lined stormwater retention ponds of the SWCRS. No stormwater runoff will be directed to the slope on the west side of the South Terrace Arroyo or Pond 1 Arroyo AA, effectively controlling potential erosion. Slope stabilization will be used to reduce the potential for erosion of the slopes adjacent to the South Terrace and Pond 1 Arroyo AAs. The stabilization of these slopes will protect the site from off-site migration based on entrainment of soil particles with elevated concentrations of COCs.
G:\ENV\ENV\PROJ\1200\1209 - MP - El Paso Smelter\Response Action Plan\RAP August 2016\RAPr1 Worksheet 1.doc
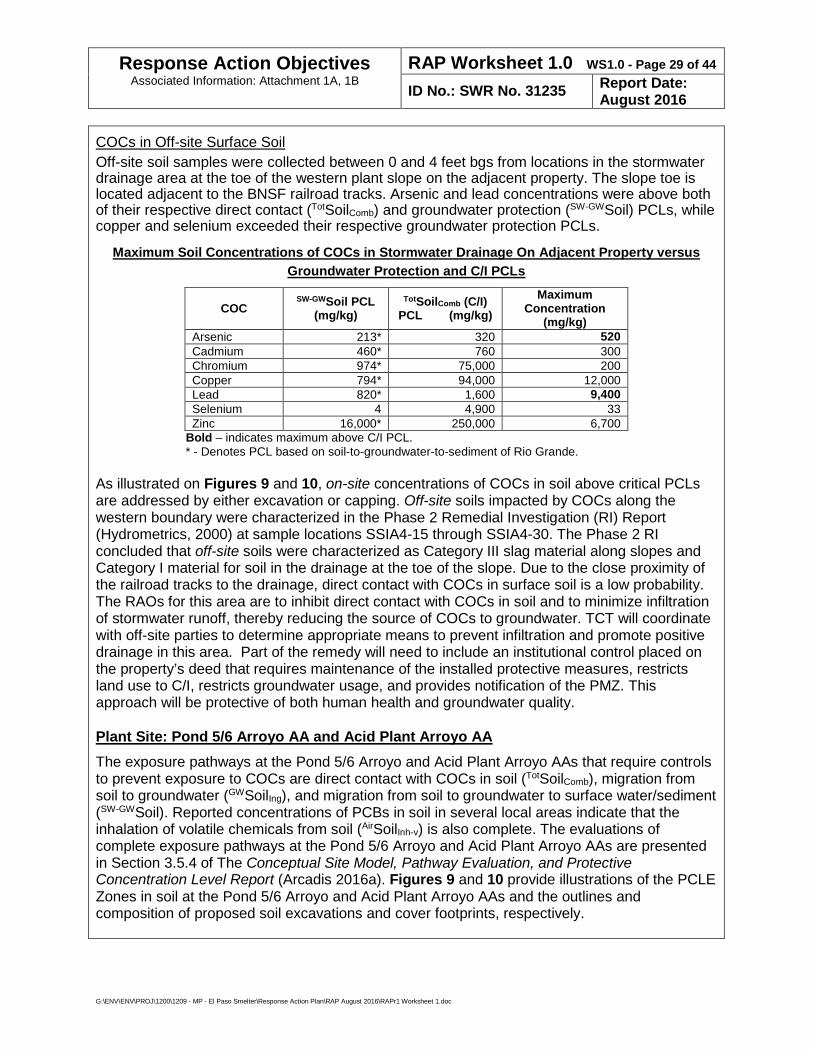
Response Action Objectives Associated Information: Attachment 1A, 1B
RAP Worksheet 1.0 WS1.0 - Page 29 of 44
ID No.: SWR No. 31235 Report Date: August 2016
COCs in Off-site Surface Soil Off-site soil samples were collected between 0 and 4 feet bgs from locations in the stormwater drainage area at the toe of the western plant slope on the adjacent property. The slope toe is located adjacent to the BNSF railroad tracks. Arsenic and lead concentrations were above both of their respective direct contact (TotSoilComb) and groundwater protection (SW-GWSoil) PCLs, while copper and selenium exceeded their respective groundwater protection PCLs.
Maximum Soil Concentrations of COCs in Stormwater Drainage On Adjacent Property versus Groundwater Protection and C/I PCLs
COC SW-GWSoil PCL
(mg/kg) TotSoilComb (C/I)
PCL (mg/kg) Maximum
Concentration (mg/kg)
Arsenic 213* 320 520 Cadmium 460* 760 300 Chromium 974* 75,000 200 Copper 794* 94,000 12,000 Lead 820* 1,600 9,400 Selenium 4 4,900 33 Zinc 16,000* 250,000 6,700
Bold – indicates maximum above C/I PCL. * - Denotes PCL based on soil-to-groundwater-to-sediment of Rio Grande.
As illustrated on Figures 9 and 10, on-site concentrations of COCs in soil above critical PCLs are addressed by either excavation or capping. Off-site soils impacted by COCs along the western boundary were characterized in the Phase 2 Remedial Investigation (RI) Report (Hydrometrics, 2000) at sample locations SSIA4-15 through SSIA4-30. The Phase 2 RI concluded that off-site soils were characterized as Category III slag material along slopes and Category I material for soil in the drainage at the toe of the slope. Due to the close proximity of the railroad tracks to the drainage, direct contact with COCs in surface soil is a low probability. The RAOs for this area are to inhibit direct contact with COCs in soil and to minimize infiltration of stormwater runoff, thereby reducing the source of COCs to groundwater. TCT will coordinate with off-site parties to determine appropriate means to prevent infiltration and promote positive drainage in this area. Part of the remedy will need to include an institutional control placed on the property’s deed that requires maintenance of the installed protective measures, restricts land use to C/I, restricts groundwater usage, and provides notification of the PMZ. This approach will be protective of both human health and groundwater quality.
Plant Site: Pond 5/6 Arroyo AA and Acid Plant Arroyo AA The exposure pathways at the Pond 5/6 Arroyo and Acid Plant Arroyo AAs that require controls to prevent exposure to COCs are direct contact with COCs in soil (TotSoilComb), migration from soil to groundwater (GWSoilIng), and migration from soil to groundwater to surface water/sediment (SW-GWSoil). Reported concentrations of PCBs in soil in several local areas indicate that the inhalation of volatile chemicals from soil (AirSoilInh-v) is also complete. The evaluations of complete exposure pathways at the Pond 5/6 Arroyo and Acid Plant Arroyo AAs are presented in Section 3.5.4 of The Conceptual Site Model, Pathway Evaluation, and Protective Concentration Level Report (Arcadis 2016a). Figures 9 and 10 provide illustrations of the PCLE Zones in soil at the Pond 5/6 Arroyo and Acid Plant Arroyo AAs and the outlines and composition of proposed soil excavations and cover footprints, respectively.
G:\ENV\ENV\PROJ\1200\1209 - MP - El Paso Smelter\Response Action Plan\RAP August 2016\RAPr1 Worksheet 1.doc
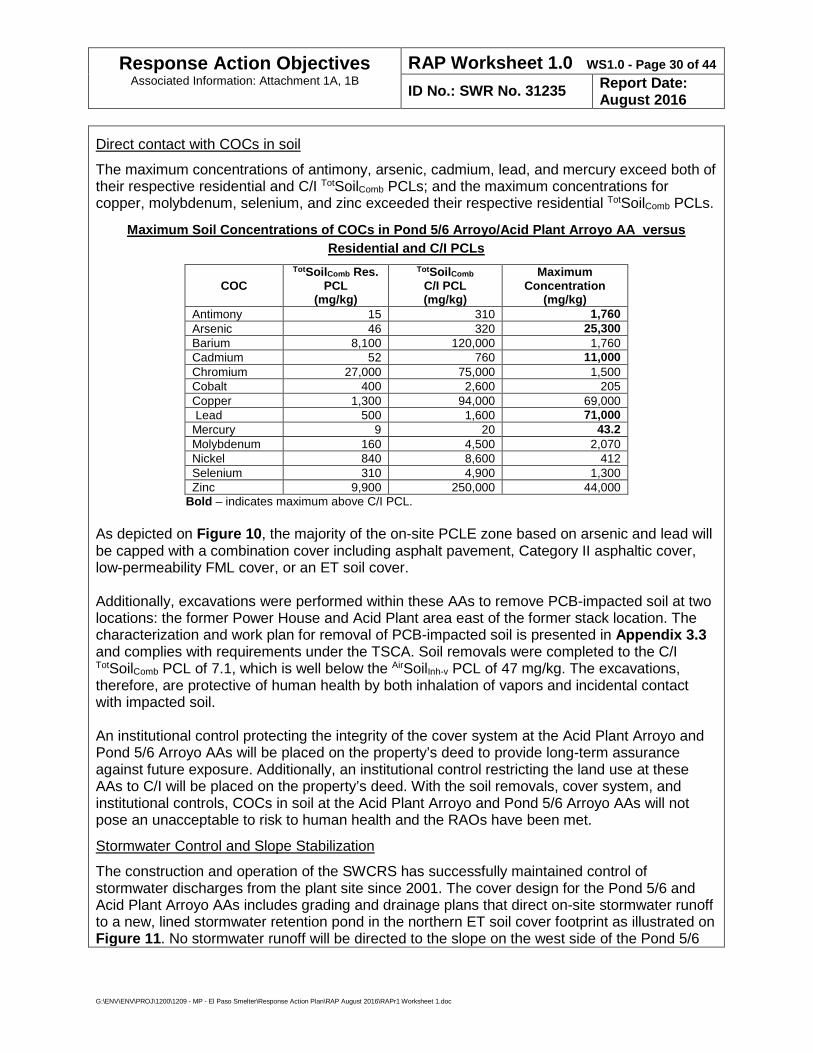
Response Action Objectives Associated Information: Attachment 1A, 1B
RAP Worksheet 1.0 WS1.0 - Page 30 of 44
ID No.: SWR No. 31235 Report Date: August 2016
Direct contact with COCs in soil
The maximum concentrations of antimony, arsenic, cadmium, lead, and mercury exceed both of their respective residential and C/I TotSoilComb PCLs; and the maximum concentrations for copper, molybdenum, selenium, and zinc exceeded their respective residential TotSoilComb PCLs.
Maximum Soil Concentrations of COCs in Pond 5/6 Arroyo/Acid Plant Arroyo AA versus Residential and C/I PCLs
COC TotSoilComb Res.
PCL (mg/kg)
TotSoilComb C/I PCL (mg/kg)
Maximum Concentration
(mg/kg) Antimony 15 310 1,760 Arsenic 46 320 25,300 Barium 8,100 120,000 1,760 Cadmium 52 760 11,000 Chromium 27,000 75,000 1,500 Cobalt 400 2,600 205 Copper 1,300 94,000 69,000 Lead 500 1,600 71,000 Mercury 9 20 43.2 Molybdenum 160 4,500 2,070 Nickel 840 8,600 412 Selenium 310 4,900 1,300 Zinc 9,900 250,000 44,000
Bold – indicates maximum above C/I PCL. As depicted on Figure 10, the majority of the on-site PCLE zone based on arsenic and lead will be capped with a combination cover including asphalt pavement, Category II asphaltic cover, low-permeability FML cover, or an ET soil cover. Additionally, excavations were performed within these AAs to remove PCB-impacted soil at two locations: the former Power House and Acid Plant area east of the former stack location. The characterization and work plan for removal of PCB-impacted soil is presented in Appendix 3.3 and complies with requirements under the TSCA. Soil removals were completed to the C/I TotSoilComb PCL of 7.1, which is well below the AirSoilInh-v PCL of 47 mg/kg. The excavations, therefore, are protective of human health by both inhalation of vapors and incidental contact with impacted soil. An institutional control protecting the integrity of the cover system at the Acid Plant Arroyo and Pond 5/6 Arroyo AAs will be placed on the property’s deed to provide long-term assurance against future exposure. Additionally, an institutional control restricting the land use at these AAs to C/I will be placed on the property’s deed. With the soil removals, cover system, and institutional controls, COCs in soil at the Acid Plant Arroyo and Pond 5/6 Arroyo AAs will not pose an unacceptable to risk to human health and the RAOs have been met.
Stormwater Control and Slope Stabilization
The construction and operation of the SWCRS has successfully maintained control of stormwater discharges from the plant site since 2001. The cover design for the Pond 5/6 and Acid Plant Arroyo AAs includes grading and drainage plans that direct on-site stormwater runoff to a new, lined stormwater retention pond in the northern ET soil cover footprint as illustrated on Figure 11. No stormwater runoff will be directed to the slope on the west side of the Pond 5/6
G:\ENV\ENV\PROJ\1200\1209 - MP - El Paso Smelter\Response Action Plan\RAP August 2016\RAPr1 Worksheet 1.doc
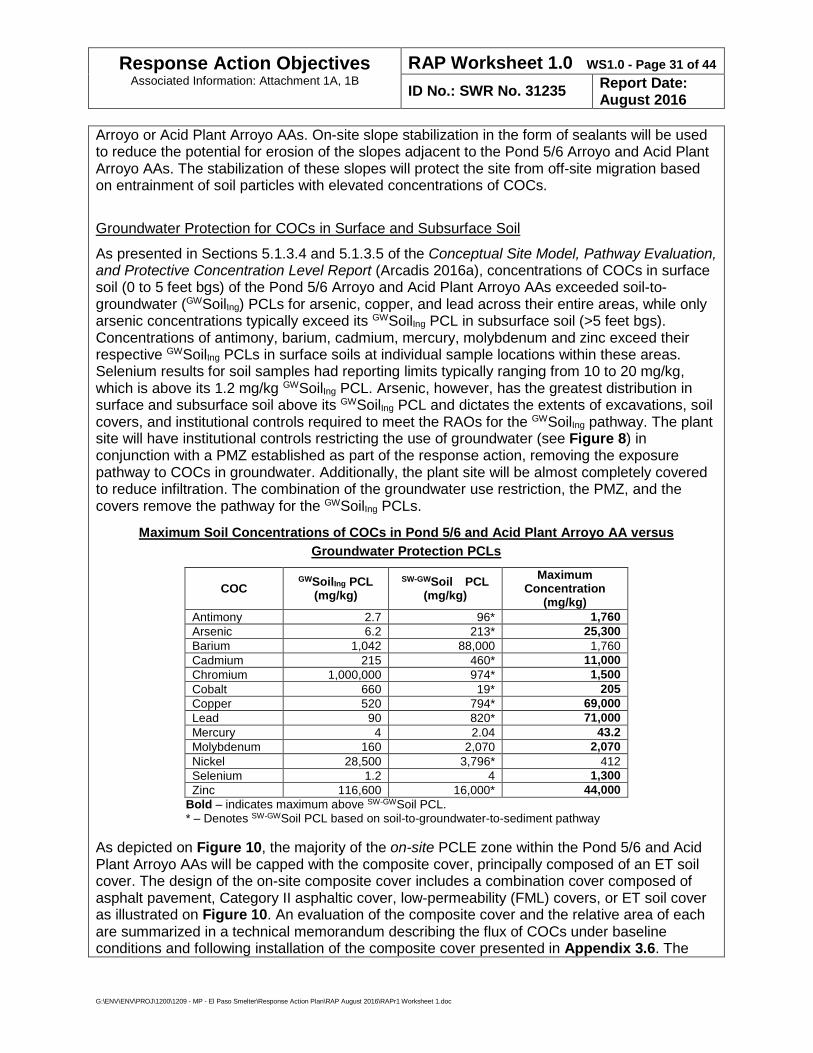
Response Action Objectives Associated Information: Attachment 1A, 1B
RAP Worksheet 1.0 WS1.0 - Page 31 of 44
ID No.: SWR No. 31235 Report Date: August 2016
Arroyo or Acid Plant Arroyo AAs. On-site slope stabilization in the form of sealants will be used to reduce the potential for erosion of the slopes adjacent to the Pond 5/6 Arroyo and Acid Plant Arroyo AAs. The stabilization of these slopes will protect the site from off-site migration based on entrainment of soil particles with elevated concentrations of COCs.
Groundwater Protection for COCs in Surface and Subsurface Soil
As presented in Sections 5.1.3.4 and 5.1.3.5 of the Conceptual Site Model, Pathway Evaluation, and Protective Concentration Level Report (Arcadis 2016a), concentrations of COCs in surface soil (0 to 5 feet bgs) of the Pond 5/6 Arroyo and Acid Plant Arroyo AAs exceeded soil-to-groundwater (GWSoilIng) PCLs for arsenic, copper, and lead across their entire areas, while only arsenic concentrations typically exceed its GWSoilIng PCL in subsurface soil (>5 feet bgs). Concentrations of antimony, barium, cadmium, mercury, molybdenum and zinc exceed their respective GWSoilIng PCLs in surface soils at individual sample locations within these areas. Selenium results for soil samples had reporting limits typically ranging from 10 to 20 mg/kg, which is above its 1.2 mg/kg GWSoilIng PCL. Arsenic, however, has the greatest distribution in surface and subsurface soil above its GWSoilIng PCL and dictates the extents of excavations, soil covers, and institutional controls required to meet the RAOs for the GWSoilIng pathway. The plant site will have institutional controls restricting the use of groundwater (see Figure 8) in conjunction with a PMZ established as part of the response action, removing the exposure pathway to COCs in groundwater. Additionally, the plant site will be almost completely covered to reduce infiltration. The combination of the groundwater use restriction, the PMZ, and the covers remove the pathway for the GWSoilIng PCLs.
Maximum Soil Concentrations of COCs in Pond 5/6 and Acid Plant Arroyo AA versus Groundwater Protection PCLs
COC GWSoilIng PCL
(mg/kg) SW-GWSoil PCL
(mg/kg) Maximum
Concentration (mg/kg)
Antimony 2.7 96* 1,760 Arsenic 6.2 213* 25,300 Barium 1,042 88,000 1,760 Cadmium 215 460* 11,000 Chromium 1,000,000 974* 1,500 Cobalt 660 19* 205 Copper 520 794* 69,000 Lead 90 820* 71,000 Mercury 4 2.04 43.2 Molybdenum 160 2,070 2,070 Nickel 28,500 3,796* 412 Selenium 1.2 4 1,300 Zinc 116,600 16,000* 44,000
Bold – indicates maximum above SW-GWSoil PCL. * – Denotes SW-GWSoil PCL based on soil-to-groundwater-to-sediment pathway As depicted on Figure 10, the majority of the on-site PCLE zone within the Pond 5/6 and Acid Plant Arroyo AAs will be capped with the composite cover, principally composed of an ET soil cover. The design of the on-site composite cover includes a combination cover composed of asphalt pavement, Category II asphaltic cover, low-permeability (FML) covers, or ET soil cover as illustrated on Figure 10. An evaluation of the composite cover and the relative area of each are summarized in a technical memorandum describing the flux of COCs under baseline conditions and following installation of the composite cover presented in Appendix 3.6. The
G:\ENV\ENV\PROJ\1200\1209 - MP - El Paso Smelter\Response Action Plan\RAP August 2016\RAPr1 Worksheet 1.doc
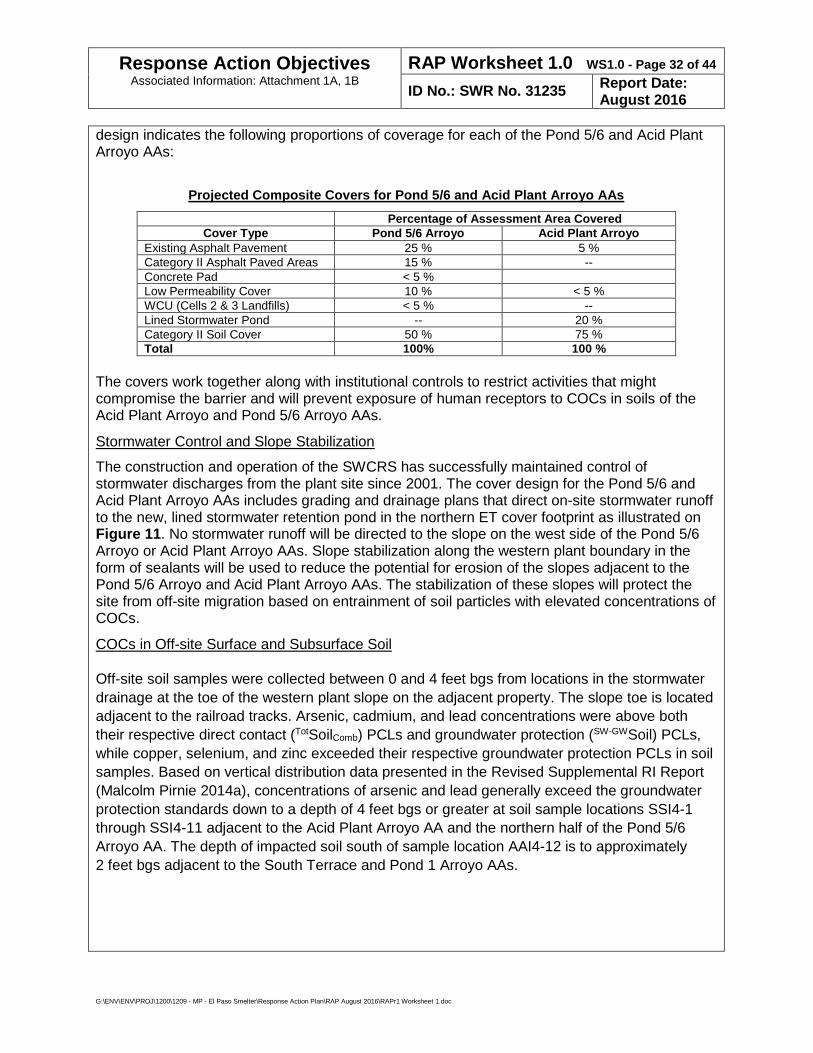
Response Action Objectives Associated Information: Attachment 1A, 1B
RAP Worksheet 1.0 WS1.0 - Page 32 of 44
ID No.: SWR No. 31235 Report Date: August 2016
design indicates the following proportions of coverage for each of the Pond 5/6 and Acid Plant Arroyo AAs:
Projected Composite Covers for Pond 5/6 and Acid Plant Arroyo AAs Percentage of Assessment Area Covered
Cover Type Pond 5/6 Arroyo Acid Plant Arroyo Existing Asphalt Pavement 25 % 5 % Category II Asphalt Paved Areas 15 % -- Concrete Pad < 5 % Low Permeability Cover 10 % < 5 % WCU (Cells 2 & 3 Landfills) < 5 % -- Lined Stormwater Pond -- 20 % Category II Soil Cover 50 % 75 % Total 100% 100 %
The covers work together along with institutional controls to restrict activities that might compromise the barrier and will prevent exposure of human receptors to COCs in soils of the Acid Plant Arroyo and Pond 5/6 Arroyo AAs.
Stormwater Control and Slope Stabilization
The construction and operation of the SWCRS has successfully maintained control of stormwater discharges from the plant site since 2001. The cover design for the Pond 5/6 and Acid Plant Arroyo AAs includes grading and drainage plans that direct on-site stormwater runoff to the new, lined stormwater retention pond in the northern ET cover footprint as illustrated on Figure 11. No stormwater runoff will be directed to the slope on the west side of the Pond 5/6 Arroyo or Acid Plant Arroyo AAs. Slope stabilization along the western plant boundary in the form of sealants will be used to reduce the potential for erosion of the slopes adjacent to the Pond 5/6 Arroyo and Acid Plant Arroyo AAs. The stabilization of these slopes will protect the site from off-site migration based on entrainment of soil particles with elevated concentrations of COCs.
COCs in Off-site Surface and Subsurface Soil
Off-site soil samples were collected between 0 and 4 feet bgs from locations in the stormwater drainage at the toe of the western plant slope on the adjacent property. The slope toe is located adjacent to the railroad tracks. Arsenic, cadmium, and lead concentrations were above both their respective direct contact (TotSoilComb) PCLs and groundwater protection (SW-GWSoil) PCLs, while copper, selenium, and zinc exceeded their respective groundwater protection PCLs in soil samples. Based on vertical distribution data presented in the Revised Supplemental RI Report (Malcolm Pirnie 2014a), concentrations of arsenic and lead generally exceed the groundwater protection standards down to a depth of 4 feet bgs or greater at soil sample locations SSI4-1 through SSI4-11 adjacent to the Acid Plant Arroyo AA and the northern half of the Pond 5/6 Arroyo AA. The depth of impacted soil south of sample location AAI4-12 is to approximately 2 feet bgs adjacent to the South Terrace and Pond 1 Arroyo AAs.
G:\ENV\ENV\PROJ\1200\1209 - MP - El Paso Smelter\Response Action Plan\RAP August 2016\RAPr1 Worksheet 1.doc
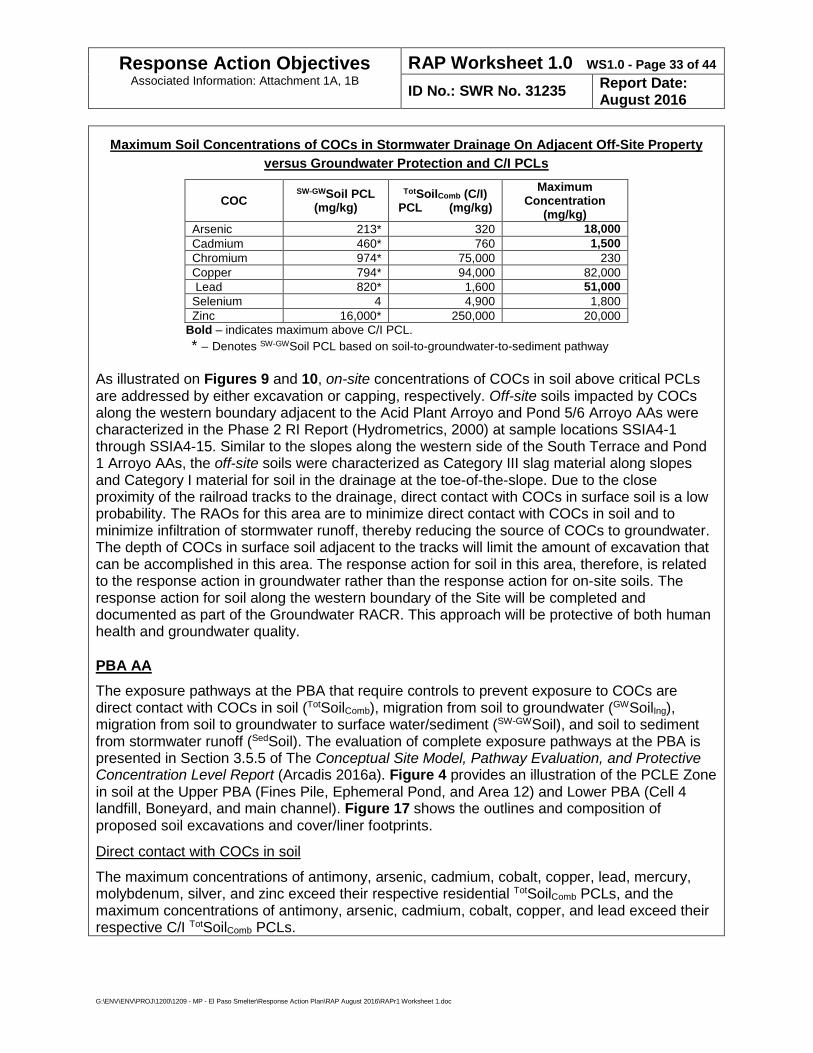
Response Action Objectives Associated Information: Attachment 1A, 1B
RAP Worksheet 1.0 WS1.0 - Page 33 of 44
ID No.: SWR No. 31235 Report Date: August 2016
Maximum Soil Concentrations of COCs in Stormwater Drainage On Adjacent Off-Site Property versus Groundwater Protection and C/I PCLs
COC SW-GWSoil PCL
(mg/kg) TotSoilComb (C/I)
PCL (mg/kg) Maximum
Concentration (mg/kg)
Arsenic 213* 320 18,000 Cadmium 460* 760 1,500 Chromium 974* 75,000 230 Copper 794* 94,000 82,000 Lead 820* 1,600 51,000 Selenium 4 4,900 1,800 Zinc 16,000* 250,000 20,000
Bold – indicates maximum above C/I PCL. * – Denotes SW-GWSoil PCL based on soil-to-groundwater-to-sediment pathway
As illustrated on Figures 9 and 10, on-site concentrations of COCs in soil above critical PCLs are addressed by either excavation or capping, respectively. Off-site soils impacted by COCs along the western boundary adjacent to the Acid Plant Arroyo and Pond 5/6 Arroyo AAs were characterized in the Phase 2 RI Report (Hydrometrics, 2000) at sample locations SSIA4-1 through SSIA4-15. Similar to the slopes along the western side of the South Terrace and Pond 1 Arroyo AAs, the off-site soils were characterized as Category III slag material along slopes and Category I material for soil in the drainage at the toe-of-the-slope. Due to the close proximity of the railroad tracks to the drainage, direct contact with COCs in surface soil is a low probability. The RAOs for this area are to minimize direct contact with COCs in soil and to minimize infiltration of stormwater runoff, thereby reducing the source of COCs to groundwater. The depth of COCs in surface soil adjacent to the tracks will limit the amount of excavation that can be accomplished in this area. The response action for soil in this area, therefore, is related to the response action in groundwater rather than the response action for on-site soils. The response action for soil along the western boundary of the Site will be completed and documented as part of the Groundwater RACR. This approach will be protective of both human health and groundwater quality.
PBA AA The exposure pathways at the PBA that require controls to prevent exposure to COCs are direct contact with COCs in soil (TotSoilComb), migration from soil to groundwater (GWSoilIng), migration from soil to groundwater to surface water/sediment (SW-GWSoil), and soil to sediment from stormwater runoff (SedSoil). The evaluation of complete exposure pathways at the PBA is presented in Section 3.5.5 of The Conceptual Site Model, Pathway Evaluation, and Protective Concentration Level Report (Arcadis 2016a). Figure 4 provides an illustration of the PCLE Zone in soil at the Upper PBA (Fines Pile, Ephemeral Pond, and Area 12) and Lower PBA (Cell 4 landfill, Boneyard, and main channel). Figure 17 shows the outlines and composition of proposed soil excavations and cover/liner footprints.
Direct contact with COCs in soil
The maximum concentrations of antimony, arsenic, cadmium, cobalt, copper, lead, mercury, molybdenum, silver, and zinc exceed their respective residential TotSoilComb PCLs, and the maximum concentrations of antimony, arsenic, cadmium, cobalt, copper, and lead exceed their respective C/I TotSoilComb PCLs.
G:\ENV\ENV\PROJ\1200\1209 - MP - El Paso Smelter\Response Action Plan\RAP August 2016\RAPr1 Worksheet 1.doc
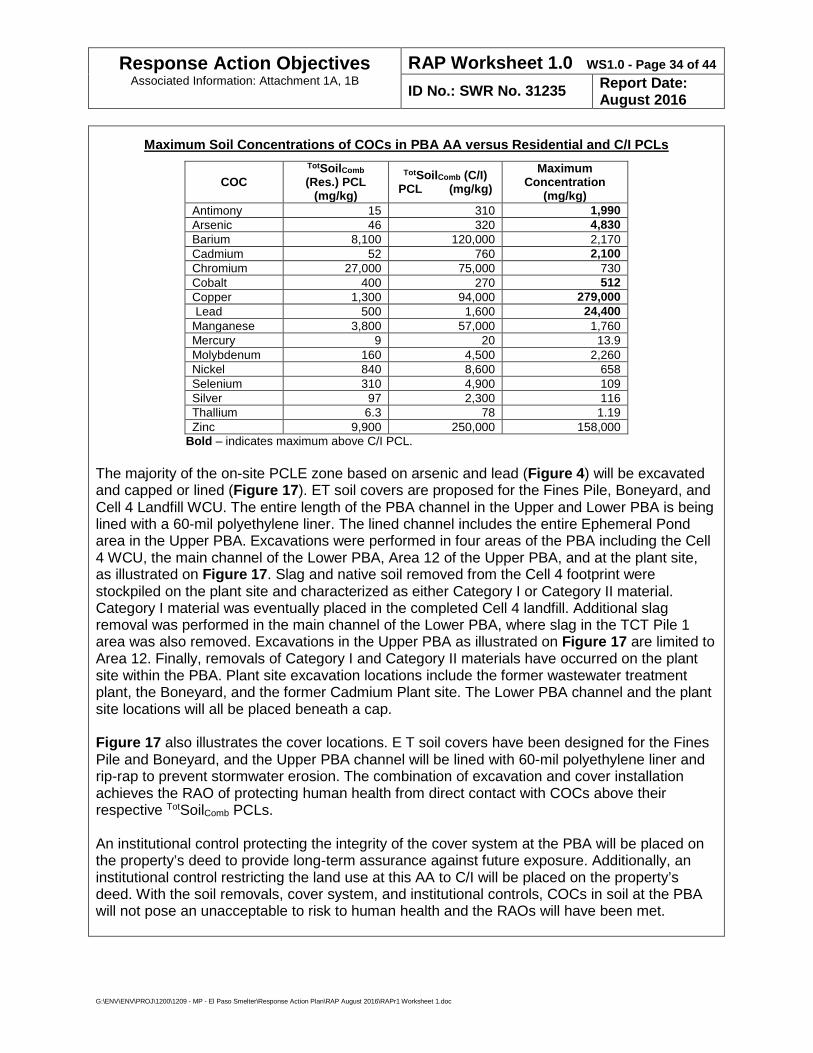
Response Action Objectives Associated Information: Attachment 1A, 1B
RAP Worksheet 1.0 WS1.0 - Page 34 of 44
ID No.: SWR No. 31235 Report Date: August 2016
Maximum Soil Concentrations of COCs in PBA AA versus Residential and C/I PCLs
COC TotSoilComb (Res.) PCL
(mg/kg)
TotSoilComb (C/I) PCL (mg/kg)
Maximum Concentration
(mg/kg) Antimony 15 310 1,990 Arsenic 46 320 4,830 Barium 8,100 120,000 2,170 Cadmium 52 760 2,100 Chromium 27,000 75,000 730 Cobalt 400 270 512 Copper 1,300 94,000 279,000 Lead 500 1,600 24,400 Manganese 3,800 57,000 1,760 Mercury 9 20 13.9 Molybdenum 160 4,500 2,260 Nickel 840 8,600 658 Selenium 310 4,900 109 Silver 97 2,300 116 Thallium 6.3 78 1.19 Zinc 9,900 250,000 158,000
Bold – indicates maximum above C/I PCL. The majority of the on-site PCLE zone based on arsenic and lead (Figure 4) will be excavated and capped or lined (Figure 17). ET soil covers are proposed for the Fines Pile, Boneyard, and Cell 4 Landfill WCU. The entire length of the PBA channel in the Upper and Lower PBA is being lined with a 60-mil polyethylene liner. The lined channel includes the entire Ephemeral Pond area in the Upper PBA. Excavations were performed in four areas of the PBA including the Cell 4 WCU, the main channel of the Lower PBA, Area 12 of the Upper PBA, and at the plant site, as illustrated on Figure 17. Slag and native soil removed from the Cell 4 footprint were stockpiled on the plant site and characterized as either Category I or Category II material. Category I material was eventually placed in the completed Cell 4 landfill. Additional slag removal was performed in the main channel of the Lower PBA, where slag in the TCT Pile 1 area was also removed. Excavations in the Upper PBA as illustrated on Figure 17 are limited to Area 12. Finally, removals of Category I and Category II materials have occurred on the plant site within the PBA. Plant site excavation locations include the former wastewater treatment plant, the Boneyard, and the former Cadmium Plant site. The Lower PBA channel and the plant site locations will all be placed beneath a cap. Figure 17 also illustrates the cover locations. E T soil covers have been designed for the Fines Pile and Boneyard, and the Upper PBA channel will be lined with 60-mil polyethylene liner and rip-rap to prevent stormwater erosion. The combination of excavation and cover installation achieves the RAO of protecting human health from direct contact with COCs above their respective TotSoilComb PCLs. An institutional control protecting the integrity of the cover system at the PBA will be placed on the property’s deed to provide long-term assurance against future exposure. Additionally, an institutional control restricting the land use at this AA to C/I will be placed on the property’s deed. With the soil removals, cover system, and institutional controls, COCs in soil at the PBA will not pose an unacceptable to risk to human health and the RAOs will have been met.
G:\ENV\ENV\PROJ\1200\1209 - MP - El Paso Smelter\Response Action Plan\RAP August 2016\RAPr1 Worksheet 1.doc
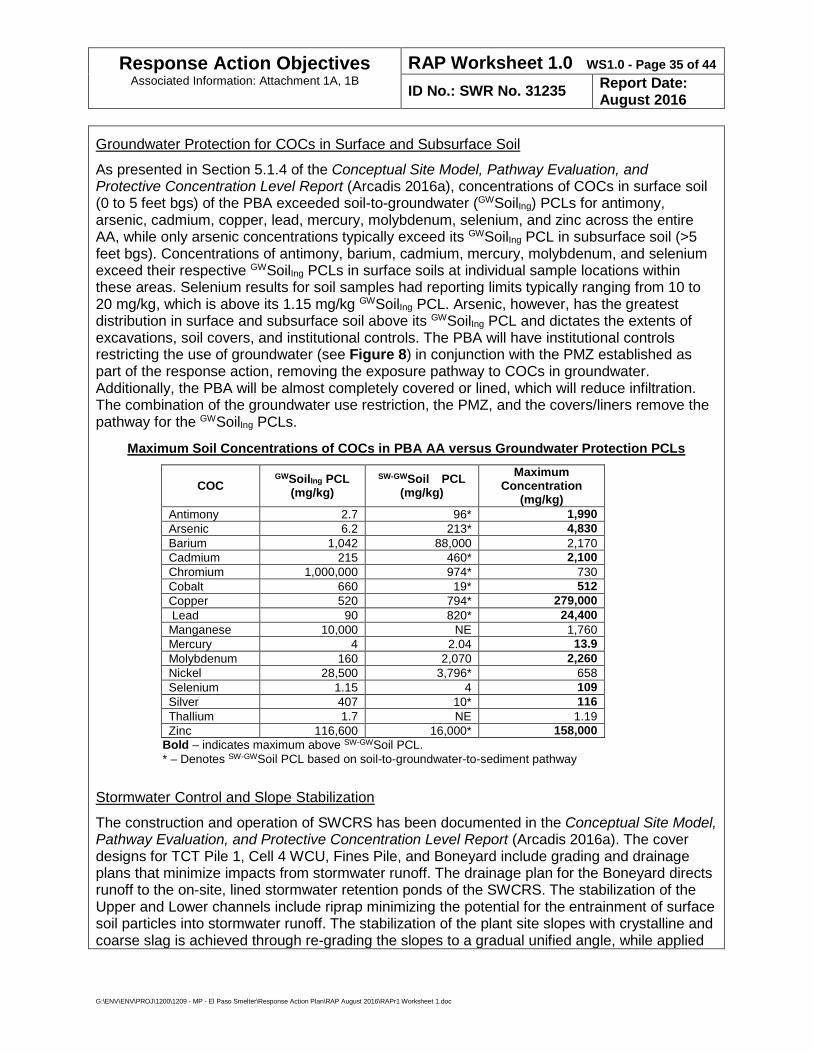
Response Action Objectives Associated Information: Attachment 1A, 1B
RAP Worksheet 1.0 WS1.0 - Page 35 of 44
ID No.: SWR No. 31235 Report Date: August 2016
Groundwater Protection for COCs in Surface and Subsurface Soil
As presented in Section 5.1.4 of the Conceptual Site Model, Pathway Evaluation, and Protective Concentration Level Report (Arcadis 2016a), concentrations of COCs in surface soil (0 to 5 feet bgs) of the PBA exceeded soil-to-groundwater (GWSoilIng) PCLs for antimony, arsenic, cadmium, copper, lead, mercury, molybdenum, selenium, and zinc across the entire AA, while only arsenic concentrations typically exceed its GWSoilIng PCL in subsurface soil (>5 feet bgs). Concentrations of antimony, barium, cadmium, mercury, molybdenum, and selenium exceed their respective GWSoilIng PCLs in surface soils at individual sample locations within these areas. Selenium results for soil samples had reporting limits typically ranging from 10 to 20 mg/kg, which is above its 1.15 mg/kg GWSoilIng PCL. Arsenic, however, has the greatest distribution in surface and subsurface soil above its GWSoilIng PCL and dictates the extents of excavations, soil covers, and institutional controls. The PBA will have institutional controls restricting the use of groundwater (see Figure 8) in conjunction with the PMZ established as part of the response action, removing the exposure pathway to COCs in groundwater. Additionally, the PBA will be almost completely covered or lined, which will reduce infiltration. The combination of the groundwater use restriction, the PMZ, and the covers/liners remove the pathway for the GWSoilIng PCLs.
Maximum Soil Concentrations of COCs in PBA AA versus Groundwater Protection PCLs
COC GWSoilIng PCL
(mg/kg) SW-GWSoil PCL
(mg/kg) Maximum
Concentration (mg/kg)
Antimony 2.7 96* 1,990 Arsenic 6.2 213* 4,830 Barium 1,042 88,000 2,170 Cadmium 215 460* 2,100 Chromium 1,000,000 974* 730 Cobalt 660 19* 512 Copper 520 794* 279,000 Lead 90 820* 24,400 Manganese 10,000 NE 1,760 Mercury 4 2.04 13.9 Molybdenum 160 2,070 2,260 Nickel 28,500 3,796* 658 Selenium 1.15 4 109 Silver 407 10* 116 Thallium 1.7 NE 1.19 Zinc 116,600 16,000* 158,000
Bold – indicates maximum above SW-GWSoil PCL. * – Denotes SW-GWSoil PCL based on soil-to-groundwater-to-sediment pathway
Stormwater Control and Slope Stabilization
The construction and operation of SWCRS has been documented in the Conceptual Site Model, Pathway Evaluation, and Protective Concentration Level Report (Arcadis 2016a). The cover designs for TCT Pile 1, Cell 4 WCU, Fines Pile, and Boneyard include grading and drainage plans that minimize impacts from stormwater runoff. The drainage plan for the Boneyard directs runoff to the on-site, lined stormwater retention ponds of the SWCRS. The stabilization of the Upper and Lower channels include riprap minimizing the potential for the entrainment of surface soil particles into stormwater runoff. The stabilization of the plant site slopes with crystalline and coarse slag is achieved through re-grading the slopes to a gradual unified angle, while applied
G:\ENV\ENV\PROJ\1200\1209 - MP - El Paso Smelter\Response Action Plan\RAP August 2016\RAPr1 Worksheet 1.doc
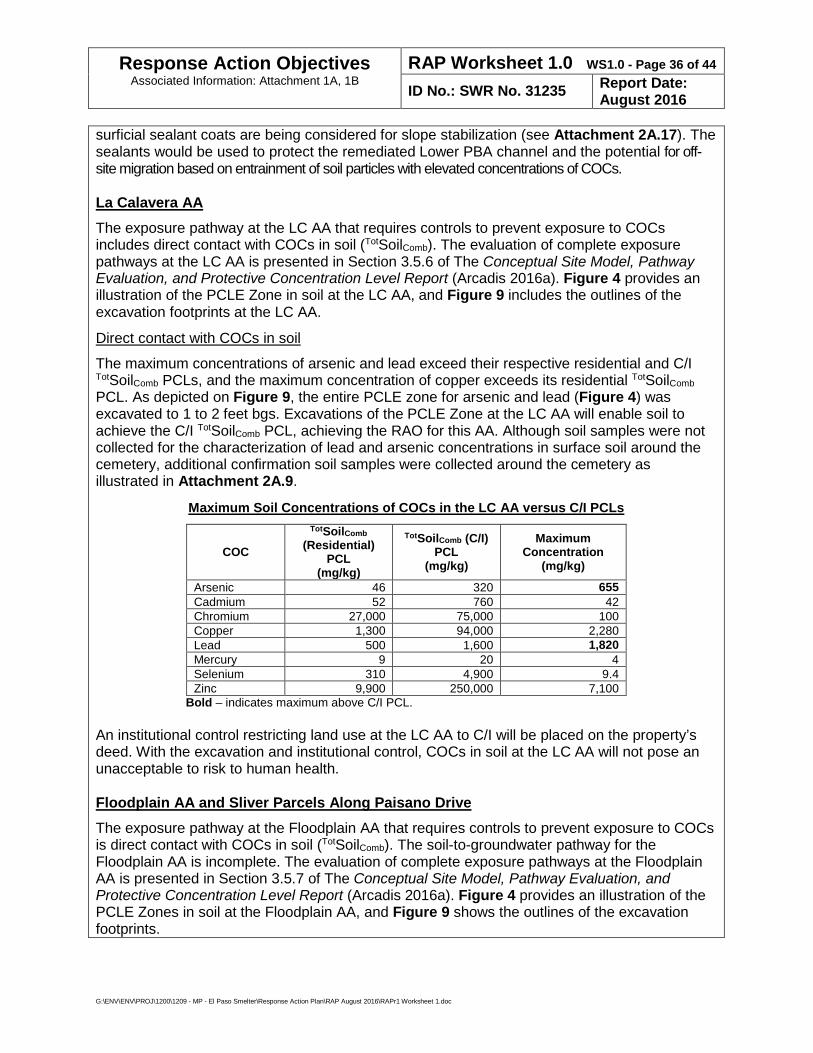
Response Action Objectives Associated Information: Attachment 1A, 1B
RAP Worksheet 1.0 WS1.0 - Page 36 of 44
ID No.: SWR No. 31235 Report Date: August 2016
surficial sealant coats are being considered for slope stabilization (see Attachment 2A.17). The sealants would be used to protect the remediated Lower PBA channel and the potential for off-site migration based on entrainment of soil particles with elevated concentrations of COCs.
La Calavera AA The exposure pathway at the LC AA that requires controls to prevent exposure to COCs includes direct contact with COCs in soil (TotSoilComb). The evaluation of complete exposure pathways at the LC AA is presented in Section 3.5.6 of The Conceptual Site Model, Pathway Evaluation, and Protective Concentration Level Report (Arcadis 2016a). Figure 4 provides an illustration of the PCLE Zone in soil at the LC AA, and Figure 9 includes the outlines of the excavation footprints at the LC AA.
Direct contact with COCs in soil
The maximum concentrations of arsenic and lead exceed their respective residential and C/I TotSoilComb PCLs, and the maximum concentration of copper exceeds its residential TotSoilComb PCL. As depicted on Figure 9, the entire PCLE zone for arsenic and lead (Figure 4) was excavated to 1 to 2 feet bgs. Excavations of the PCLE Zone at the LC AA will enable soil to achieve the C/I TotSoilComb PCL, achieving the RAO for this AA. Although soil samples were not collected for the characterization of lead and arsenic concentrations in surface soil around the cemetery, additional confirmation soil samples were collected around the cemetery as illustrated in Attachment 2A.9.
Maximum Soil Concentrations of COCs in the LC AA versus C/I PCLs
COC
TotSoilComb (Residential)
PCL (mg/kg)
TotSoilComb (C/I) PCL
(mg/kg)
Maximum Concentration
(mg/kg)
Arsenic 46 320 655 Cadmium 52 760 42 Chromium 27,000 75,000 100 Copper 1,300 94,000 2,280 Lead 500 1,600 1,820 Mercury 9 20 4 Selenium 310 4,900 9.4 Zinc 9,900 250,000 7,100
Bold – indicates maximum above C/I PCL. An institutional control restricting land use at the LC AA to C/I will be placed on the property’s deed. With the excavation and institutional control, COCs in soil at the LC AA will not pose an unacceptable to risk to human health.
Floodplain AA and Sliver Parcels Along Paisano Drive The exposure pathway at the Floodplain AA that requires controls to prevent exposure to COCs is direct contact with COCs in soil (TotSoilComb). The soil-to-groundwater pathway for the Floodplain AA is incomplete. The evaluation of complete exposure pathways at the Floodplain AA is presented in Section 3.5.7 of The Conceptual Site Model, Pathway Evaluation, and Protective Concentration Level Report (Arcadis 2016a). Figure 4 provides an illustration of the PCLE Zones in soil at the Floodplain AA, and Figure 9 shows the outlines of the excavation footprints.
G:\ENV\ENV\PROJ\1200\1209 - MP - El Paso Smelter\Response Action Plan\RAP August 2016\RAPr1 Worksheet 1.doc
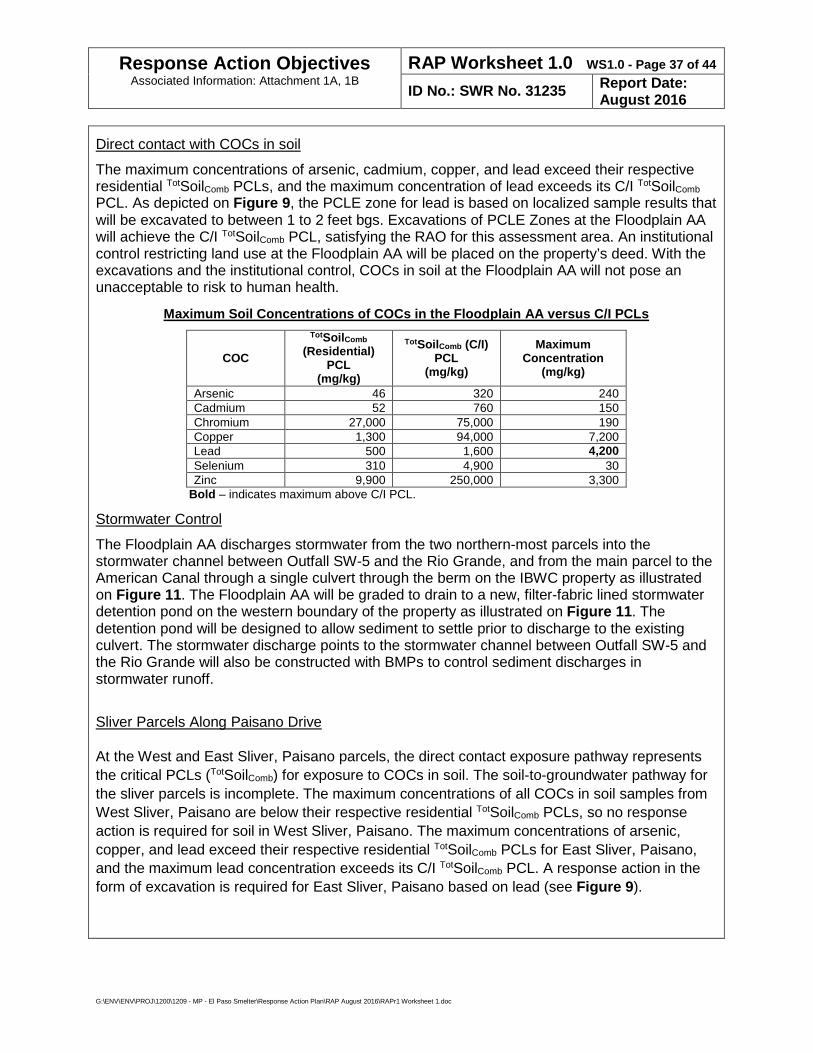
Response Action Objectives Associated Information: Attachment 1A, 1B
RAP Worksheet 1.0 WS1.0 - Page 37 of 44
ID No.: SWR No. 31235 Report Date: August 2016
Direct contact with COCs in soil
The maximum concentrations of arsenic, cadmium, copper, and lead exceed their respective residential TotSoilComb PCLs, and the maximum concentration of lead exceeds its C/I TotSoilComb PCL. As depicted on Figure 9, the PCLE zone for lead is based on localized sample results that will be excavated to between 1 to 2 feet bgs. Excavations of PCLE Zones at the Floodplain AA will achieve the C/I TotSoilComb PCL, satisfying the RAO for this assessment area. An institutional control restricting land use at the Floodplain AA will be placed on the property’s deed. With the excavations and the institutional control, COCs in soil at the Floodplain AA will not pose an unacceptable to risk to human health.
Maximum Soil Concentrations of COCs in the Floodplain AA versus C/I PCLs
COC
TotSoilComb (Residential)
PCL (mg/kg)
TotSoilComb (C/I) PCL
(mg/kg)
Maximum Concentration
(mg/kg)
Arsenic 46 320 240 Cadmium 52 760 150 Chromium 27,000 75,000 190 Copper 1,300 94,000 7,200 Lead 500 1,600 4,200 Selenium 310 4,900 30 Zinc 9,900 250,000 3,300
Bold – indicates maximum above C/I PCL.
Stormwater Control
The Floodplain AA discharges stormwater from the two northern-most parcels into the stormwater channel between Outfall SW-5 and the Rio Grande, and from the main parcel to the American Canal through a single culvert through the berm on the IBWC property as illustrated on Figure 11. The Floodplain AA will be graded to drain to a new, filter-fabric lined stormwater detention pond on the western boundary of the property as illustrated on Figure 11. The detention pond will be designed to allow sediment to settle prior to discharge to the existing culvert. The stormwater discharge points to the stormwater channel between Outfall SW-5 and the Rio Grande will also be constructed with BMPs to control sediment discharges in stormwater runoff.
Sliver Parcels Along Paisano Drive
At the West and East Sliver, Paisano parcels, the direct contact exposure pathway represents the critical PCLs (TotSoilComb) for exposure to COCs in soil. The soil-to-groundwater pathway for the sliver parcels is incomplete. The maximum concentrations of all COCs in soil samples from West Sliver, Paisano are below their respective residential TotSoilComb PCLs, so no response action is required for soil in West Sliver, Paisano. The maximum concentrations of arsenic, copper, and lead exceed their respective residential TotSoilComb PCLs for East Sliver, Paisano, and the maximum lead concentration exceeds its C/I TotSoilComb PCL. A response action in the form of excavation is required for East Sliver, Paisano based on lead (see Figure 9).
G:\ENV\ENV\PROJ\1200\1209 - MP - El Paso Smelter\Response Action Plan\RAP August 2016\RAPr1 Worksheet 1.doc
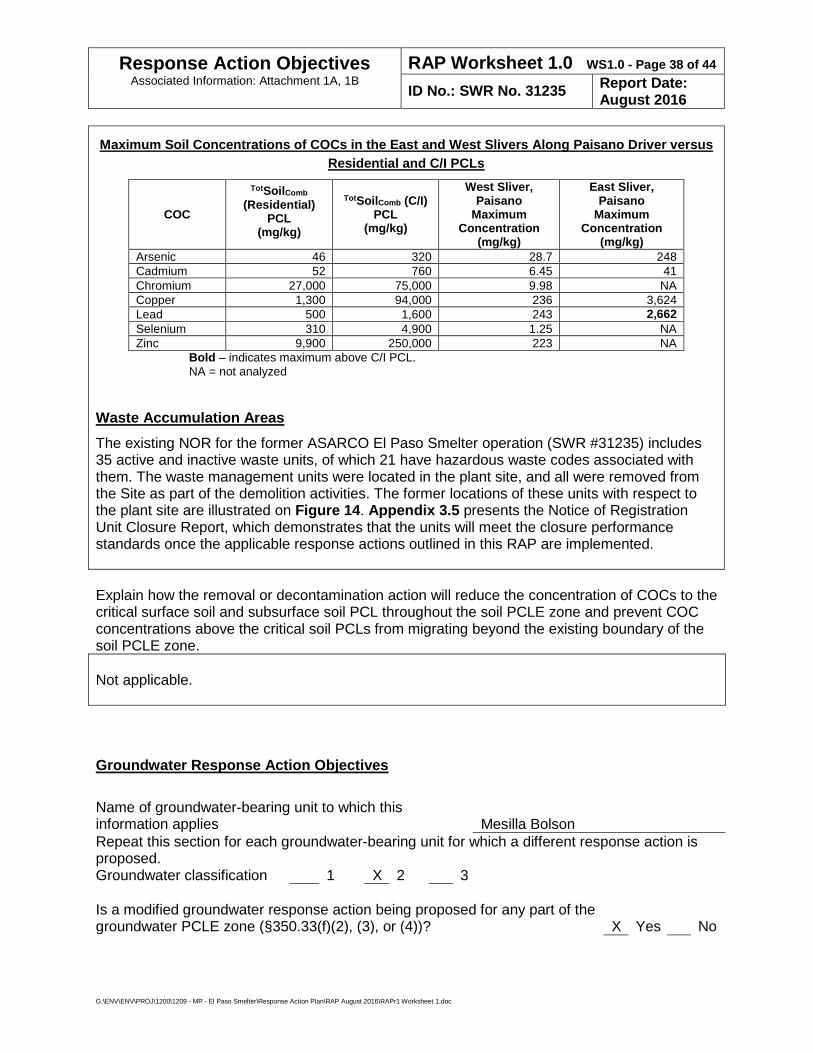
Response Action Objectives Associated Information: Attachment 1A, 1B
RAP Worksheet 1.0 WS1.0 - Page 38 of 44
ID No.: SWR No. 31235 Report Date: August 2016
Maximum Soil Concentrations of COCs in the East and West Slivers Along Paisano Driver versus Residential and C/I PCLs
COC
TotSoilComb (Residential)
PCL (mg/kg)
TotSoilComb (C/I) PCL
(mg/kg)
West Sliver, Paisano
Maximum Concentration
(mg/kg)
East Sliver, Paisano
Maximum Concentration
(mg/kg) Arsenic 46 320 28.7 248 Cadmium 52 760 6.45 41 Chromium 27,000 75,000 9.98 NA Copper 1,300 94,000 236 3,624 Lead 500 1,600 243 2,662 Selenium 310 4,900 1.25 NA Zinc 9,900 250,000 223 NA
Bold – indicates maximum above C/I PCL. NA = not analyzed
Waste Accumulation Areas The existing NOR for the former ASARCO El Paso Smelter operation (SWR #31235) includes 35 active and inactive waste units, of which 21 have hazardous waste codes associated with them. The waste management units were located in the plant site, and all were removed from the Site as part of the demolition activities. The former locations of these units with respect to the plant site are illustrated on Figure 14. Appendix 3.5 presents the Notice of Registration Unit Closure Report, which demonstrates that the units will meet the closure performance standards once the applicable response actions outlined in this RAP are implemented. Explain how the removal or decontamination action will reduce the concentration of COCs to the critical surface soil and subsurface soil PCL throughout the soil PCLE zone and prevent COC concentrations above the critical soil PCLs from migrating beyond the existing boundary of the soil PCLE zone. Not applicable.
Groundwater Response Action Objectives Name of groundwater-bearing unit to which this information applies
Mesilla Bolson
Repeat this section for each groundwater-bearing unit for which a different response action is proposed. Groundwater classification 1 X 2 3 Is a modified groundwater response action being proposed for any part of the groundwater PCLE zone (§350.33(f)(2), (3), or (4))?
X
Yes
No
G:\ENV\ENV\PROJ\1200\1209 - MP - El Paso Smelter\Response Action Plan\RAP August 2016\RAPr1 Worksheet 1.doc
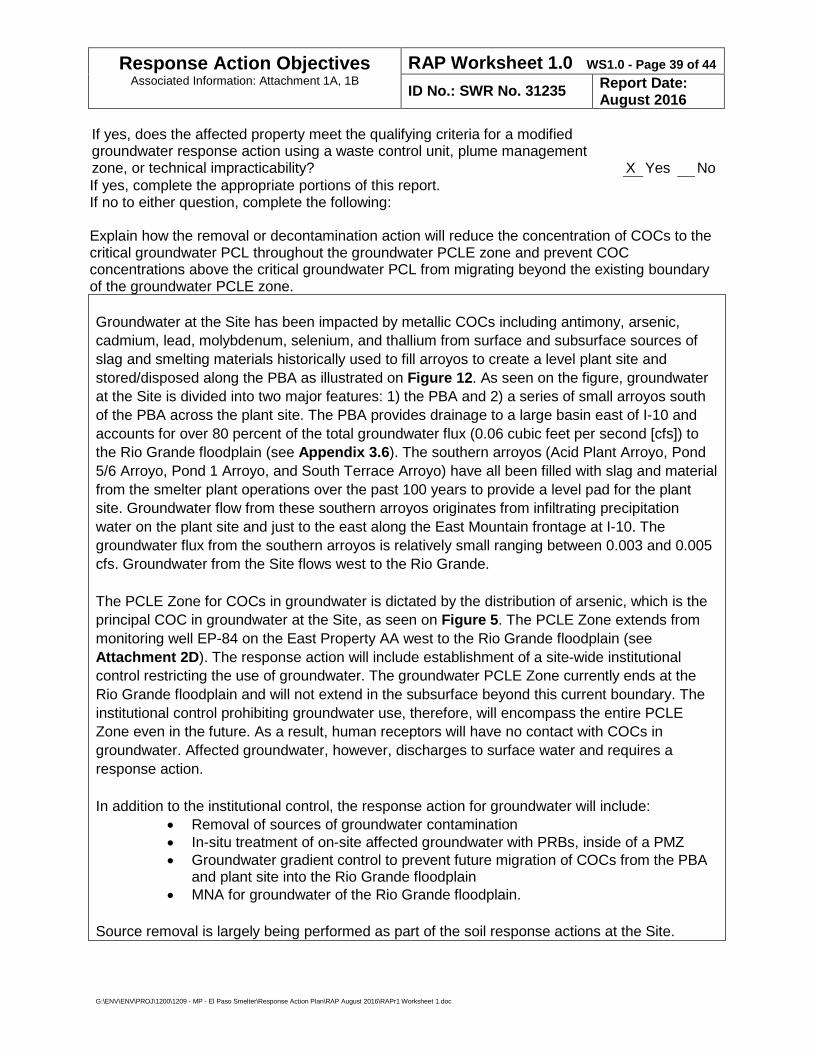
Response Action Objectives Associated Information: Attachment 1A, 1B
RAP Worksheet 1.0 WS1.0 - Page 39 of 44
ID No.: SWR No. 31235 Report Date: August 2016
If yes, does the affected property meet the qualifying criteria for a modified groundwater response action using a waste control unit, plume management zone, or technical impracticability?
X
Yes
No
If yes, complete the appropriate portions of this report. If no to either question, complete the following: Explain how the removal or decontamination action will reduce the concentration of COCs to the critical groundwater PCL throughout the groundwater PCLE zone and prevent COC concentrations above the critical groundwater PCL from migrating beyond the existing boundary of the groundwater PCLE zone. Groundwater at the Site has been impacted by metallic COCs including antimony, arsenic, cadmium, lead, molybdenum, selenium, and thallium from surface and subsurface sources of slag and smelting materials historically used to fill arroyos to create a level plant site and stored/disposed along the PBA as illustrated on Figure 12. As seen on the figure, groundwater at the Site is divided into two major features: 1) the PBA and 2) a series of small arroyos south of the PBA across the plant site. The PBA provides drainage to a large basin east of I-10 and accounts for over 80 percent of the total groundwater flux (0.06 cubic feet per second [cfs]) to the Rio Grande floodplain (see Appendix 3.6). The southern arroyos (Acid Plant Arroyo, Pond 5/6 Arroyo, Pond 1 Arroyo, and South Terrace Arroyo) have all been filled with slag and material from the smelter plant operations over the past 100 years to provide a level pad for the plant site. Groundwater flow from these southern arroyos originates from infiltrating precipitation water on the plant site and just to the east along the East Mountain frontage at I-10. The groundwater flux from the southern arroyos is relatively small ranging between 0.003 and 0.005 cfs. Groundwater from the Site flows west to the Rio Grande. The PCLE Zone for COCs in groundwater is dictated by the distribution of arsenic, which is the principal COC in groundwater at the Site, as seen on Figure 5. The PCLE Zone extends from monitoring well EP-84 on the East Property AA west to the Rio Grande floodplain (see Attachment 2D). The response action will include establishment of a site-wide institutional control restricting the use of groundwater. The groundwater PCLE Zone currently ends at the Rio Grande floodplain and will not extend in the subsurface beyond this current boundary. The institutional control prohibiting groundwater use, therefore, will encompass the entire PCLE Zone even in the future. As a result, human receptors will have no contact with COCs in groundwater. Affected groundwater, however, discharges to surface water and requires a response action. In addition to the institutional control, the response action for groundwater will include:
• Removal of sources of groundwater contamination • In-situ treatment of on-site affected groundwater with PRBs, inside of a PMZ • Groundwater gradient control to prevent future migration of COCs from the PBA
and plant site into the Rio Grande floodplain • MNA for groundwater of the Rio Grande floodplain.
Source removal is largely being performed as part of the soil response actions at the Site.
G:\ENV\ENV\PROJ\1200\1209 - MP - El Paso Smelter\Response Action Plan\RAP August 2016\RAPr1 Worksheet 1.doc
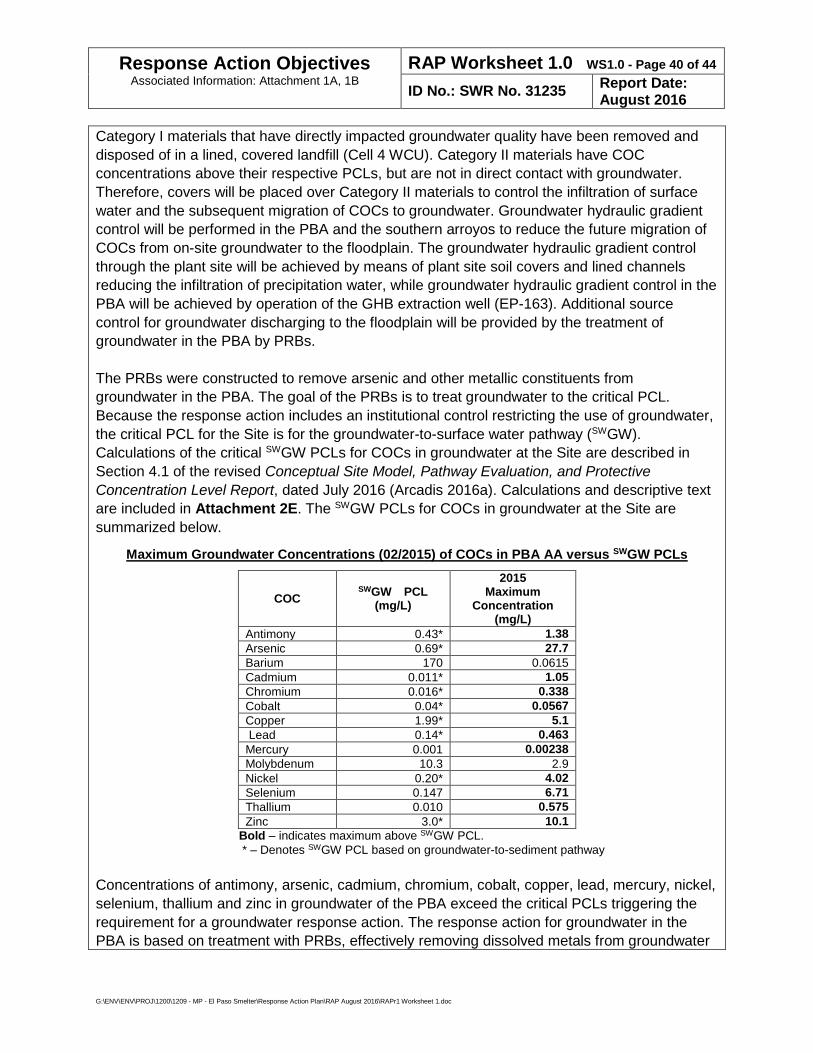
Response Action Objectives Associated Information: Attachment 1A, 1B
RAP Worksheet 1.0 WS1.0 - Page 40 of 44
ID No.: SWR No. 31235 Report Date: August 2016
Category I materials that have directly impacted groundwater quality have been removed and disposed of in a lined, covered landfill (Cell 4 WCU). Category II materials have COC concentrations above their respective PCLs, but are not in direct contact with groundwater. Therefore, covers will be placed over Category II materials to control the infiltration of surface water and the subsequent migration of COCs to groundwater. Groundwater hydraulic gradient control will be performed in the PBA and the southern arroyos to reduce the future migration of COCs from on-site groundwater to the floodplain. The groundwater hydraulic gradient control through the plant site will be achieved by means of plant site soil covers and lined channels reducing the infiltration of precipitation water, while groundwater hydraulic gradient control in the PBA will be achieved by operation of the GHB extraction well (EP-163). Additional source control for groundwater discharging to the floodplain will be provided by the treatment of groundwater in the PBA by PRBs. The PRBs were constructed to remove arsenic and other metallic constituents from groundwater in the PBA. The goal of the PRBs is to treat groundwater to the critical PCL. Because the response action includes an institutional control restricting the use of groundwater, the critical PCL for the Site is for the groundwater-to-surface water pathway (SWGW). Calculations of the critical SWGW PCLs for COCs in groundwater at the Site are described in Section 4.1 of the revised Conceptual Site Model, Pathway Evaluation, and Protective Concentration Level Report, dated July 2016 (Arcadis 2016a). Calculations and descriptive text are included in Attachment 2E. The SWGW PCLs for COCs in groundwater at the Site are summarized below.
Maximum Groundwater Concentrations (02/2015) of COCs in PBA AA versus SWGW PCLs
COC SWGW PCL
(mg/L)
2015 Maximum
Concentration (mg/L)
Antimony 0.43* 1.38 Arsenic 0.69* 27.7 Barium 170 0.0615 Cadmium 0.011* 1.05 Chromium 0.016* 0.338 Cobalt 0.04* 0.0567 Copper 1.99* 5.1 Lead 0.14* 0.463 Mercury 0.001 0.00238 Molybdenum 10.3 2.9 Nickel 0.20* 4.02 Selenium 0.147 6.71 Thallium 0.010 0.575 Zinc 3.0* 10.1
Bold – indicates maximum above SWGW PCL. * – Denotes SWGW PCL based on groundwater-to-sediment pathway Concentrations of antimony, arsenic, cadmium, chromium, cobalt, copper, lead, mercury, nickel, selenium, thallium and zinc in groundwater of the PBA exceed the critical PCLs triggering the requirement for a groundwater response action. The response action for groundwater in the PBA is based on treatment with PRBs, effectively removing dissolved metals from groundwater
G:\ENV\ENV\PROJ\1200\1209 - MP - El Paso Smelter\Response Action Plan\RAP August 2016\RAPr1 Worksheet 1.doc
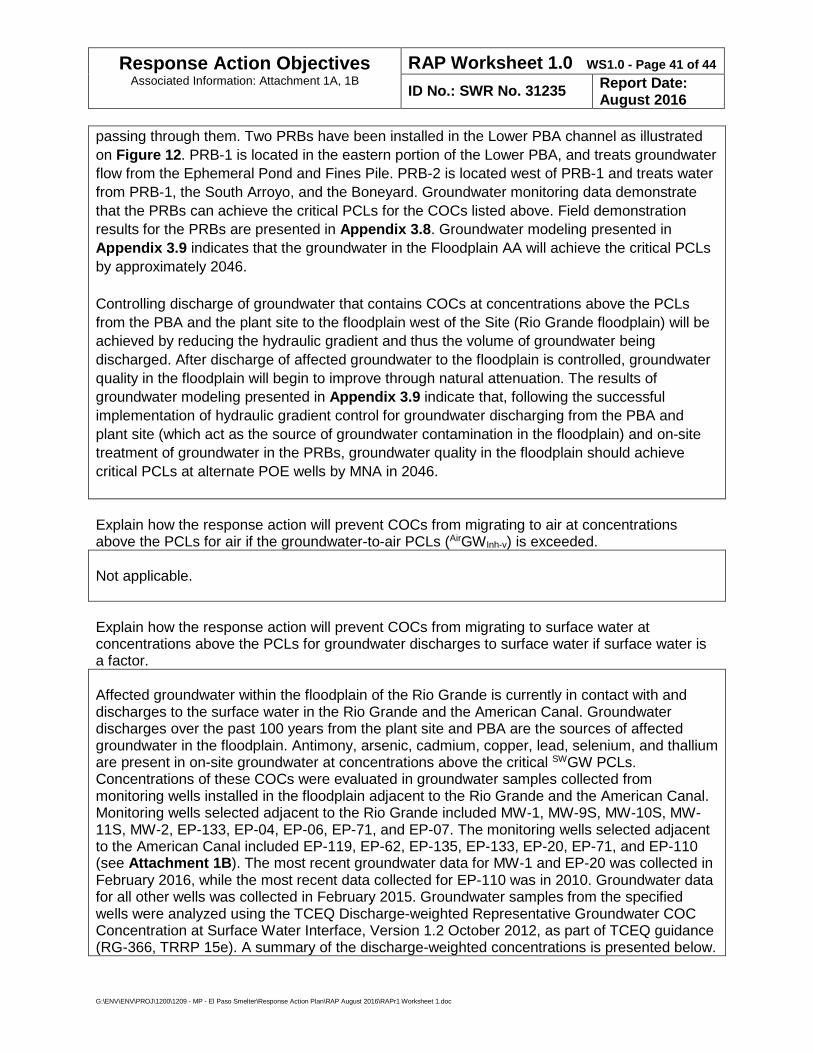
Response Action Objectives Associated Information: Attachment 1A, 1B
RAP Worksheet 1.0 WS1.0 - Page 41 of 44
ID No.: SWR No. 31235 Report Date: August 2016
passing through them. Two PRBs have been installed in the Lower PBA channel as illustrated on Figure 12. PRB-1 is located in the eastern portion of the Lower PBA, and treats groundwater flow from the Ephemeral Pond and Fines Pile. PRB-2 is located west of PRB-1 and treats water from PRB-1, the South Arroyo, and the Boneyard. Groundwater monitoring data demonstrate that the PRBs can achieve the critical PCLs for the COCs listed above. Field demonstration results for the PRBs are presented in Appendix 3.8. Groundwater modeling presented in Appendix 3.9 indicates that the groundwater in the Floodplain AA will achieve the critical PCLs by approximately 2046. Controlling discharge of groundwater that contains COCs at concentrations above the PCLs from the PBA and the plant site to the floodplain west of the Site (Rio Grande floodplain) will be achieved by reducing the hydraulic gradient and thus the volume of groundwater being discharged. After discharge of affected groundwater to the floodplain is controlled, groundwater quality in the floodplain will begin to improve through natural attenuation. The results of groundwater modeling presented in Appendix 3.9 indicate that, following the successful implementation of hydraulic gradient control for groundwater discharging from the PBA and plant site (which act as the source of groundwater contamination in the floodplain) and on-site treatment of groundwater in the PRBs, groundwater quality in the floodplain should achieve critical PCLs at alternate POE wells by MNA in 2046. Explain how the response action will prevent COCs from migrating to air at concentrations above the PCLs for air if the groundwater-to-air PCLs (AirGWInh-v) is exceeded. Not applicable. Explain how the response action will prevent COCs from migrating to surface water at concentrations above the PCLs for groundwater discharges to surface water if surface water is a factor. Affected groundwater within the floodplain of the Rio Grande is currently in contact with and discharges to the surface water in the Rio Grande and the American Canal. Groundwater discharges over the past 100 years from the plant site and PBA are the sources of affected groundwater in the floodplain. Antimony, arsenic, cadmium, copper, lead, selenium, and thallium are present in on-site groundwater at concentrations above the critical SWGW PCLs. Concentrations of these COCs were evaluated in groundwater samples collected from monitoring wells installed in the floodplain adjacent to the Rio Grande and the American Canal. Monitoring wells selected adjacent to the Rio Grande included MW-1, MW-9S, MW-10S, MW-11S, MW-2, EP-133, EP-04, EP-06, EP-71, and EP-07. The monitoring wells selected adjacent to the American Canal included EP-119, EP-62, EP-135, EP-133, EP-20, EP-71, and EP-110 (see Attachment 1B). The most recent groundwater data for MW-1 and EP-20 was collected in February 2016, while the most recent data collected for EP-110 was in 2010. Groundwater data for all other wells was collected in February 2015. Groundwater samples from the specified wells were analyzed using the TCEQ Discharge-weighted Representative Groundwater COC Concentration at Surface Water Interface, Version 1.2 October 2012, as part of TCEQ guidance (RG-366, TRRP 15e). A summary of the discharge-weighted concentrations is presented below.
G:\ENV\ENV\PROJ\1200\1209 - MP - El Paso Smelter\Response Action Plan\RAP August 2016\RAPr1 Worksheet 1.doc
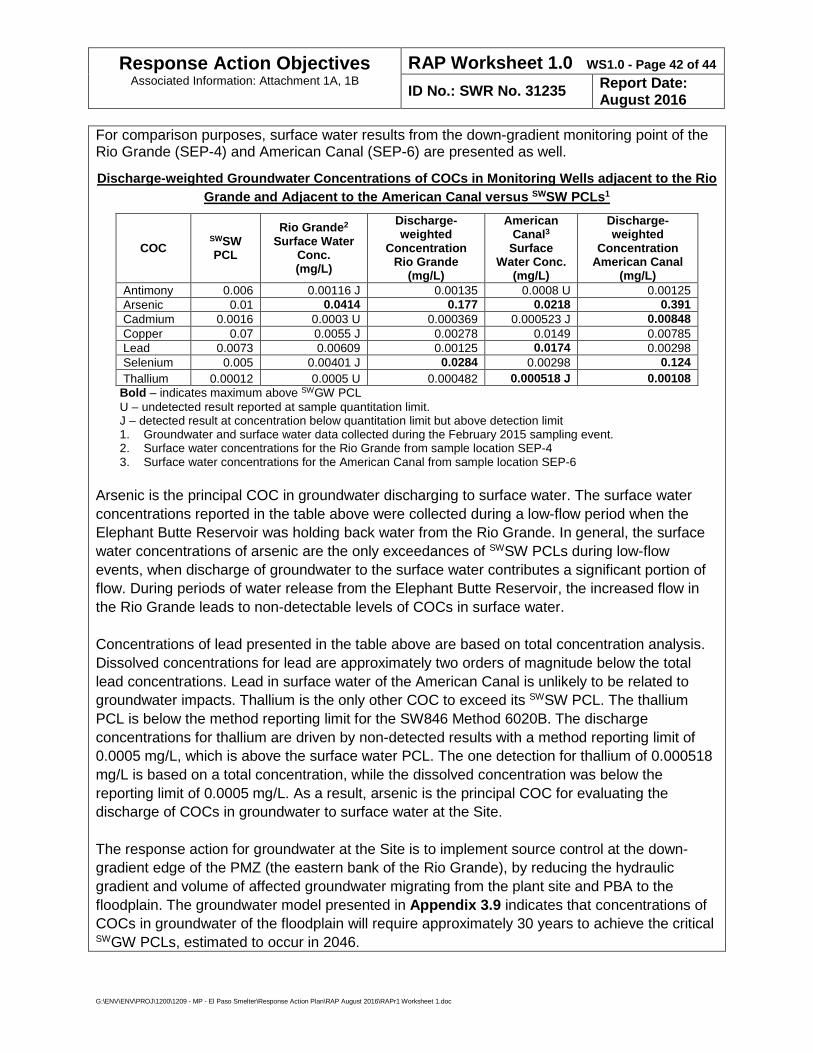
Response Action Objectives Associated Information: Attachment 1A, 1B
RAP Worksheet 1.0 WS1.0 - Page 42 of 44
ID No.: SWR No. 31235 Report Date: August 2016
For comparison purposes, surface water results from the down-gradient monitoring point of the Rio Grande (SEP-4) and American Canal (SEP-6) are presented as well.
Discharge-weighted Groundwater Concentrations of COCs in Monitoring Wells adjacent to the Rio Grande and Adjacent to the American Canal versus SWSW PCLs1
COC SWSW PCL
Rio Grande2
Surface Water Conc. (mg/L)
Discharge-weighted
Concentration Rio Grande
(mg/L)
American Canal3
Surface Water Conc.
(mg/L)
Discharge-weighted
Concentration American Canal
(mg/L) Antimony 0.006 0.00116 J 0.00135 0.0008 U 0.00125 Arsenic 0.01 0.0414 0.177 0.0218 0.391 Cadmium 0.0016 0.0003 U 0.000369 0.000523 J 0.00848 Copper 0.07 0.0055 J 0.00278 0.0149 0.00785 Lead 0.0073 0.00609 0.00125 0.0174 0.00298 Selenium 0.005 0.00401 J 0.0284 0.00298 0.124 Thallium 0.00012 0.0005 U 0.000482 0.000518 J 0.00108
Bold – indicates maximum above SWGW PCL U – undetected result reported at sample quantitation limit. J – detected result at concentration below quantitation limit but above detection limit 1. Groundwater and surface water data collected during the February 2015 sampling event. 2. Surface water concentrations for the Rio Grande from sample location SEP-4 3. Surface water concentrations for the American Canal from sample location SEP-6
Arsenic is the principal COC in groundwater discharging to surface water. The surface water concentrations reported in the table above were collected during a low-flow period when the Elephant Butte Reservoir was holding back water from the Rio Grande. In general, the surface water concentrations of arsenic are the only exceedances of SWSW PCLs during low-flow events, when discharge of groundwater to the surface water contributes a significant portion of flow. During periods of water release from the Elephant Butte Reservoir, the increased flow in the Rio Grande leads to non-detectable levels of COCs in surface water. Concentrations of lead presented in the table above are based on total concentration analysis. Dissolved concentrations for lead are approximately two orders of magnitude below the total lead concentrations. Lead in surface water of the American Canal is unlikely to be related to groundwater impacts. Thallium is the only other COC to exceed its SWSW PCL. The thallium PCL is below the method reporting limit for the SW846 Method 6020B. The discharge concentrations for thallium are driven by non-detected results with a method reporting limit of 0.0005 mg/L, which is above the surface water PCL. The one detection for thallium of 0.000518 mg/L is based on a total concentration, while the dissolved concentration was below the reporting limit of 0.0005 mg/L. As a result, arsenic is the principal COC for evaluating the discharge of COCs in groundwater to surface water at the Site. The response action for groundwater at the Site is to implement source control at the down-gradient edge of the PMZ (the eastern bank of the Rio Grande), by reducing the hydraulic gradient and volume of affected groundwater migrating from the plant site and PBA to the floodplain. The groundwater model presented in Appendix 3.9 indicates that concentrations of COCs in groundwater of the floodplain will require approximately 30 years to achieve the critical SWGW PCLs, estimated to occur in 2046.
G:\ENV\ENV\PROJ\1200\1209 - MP - El Paso Smelter\Response Action Plan\RAP August 2016\RAPr1 Worksheet 1.doc
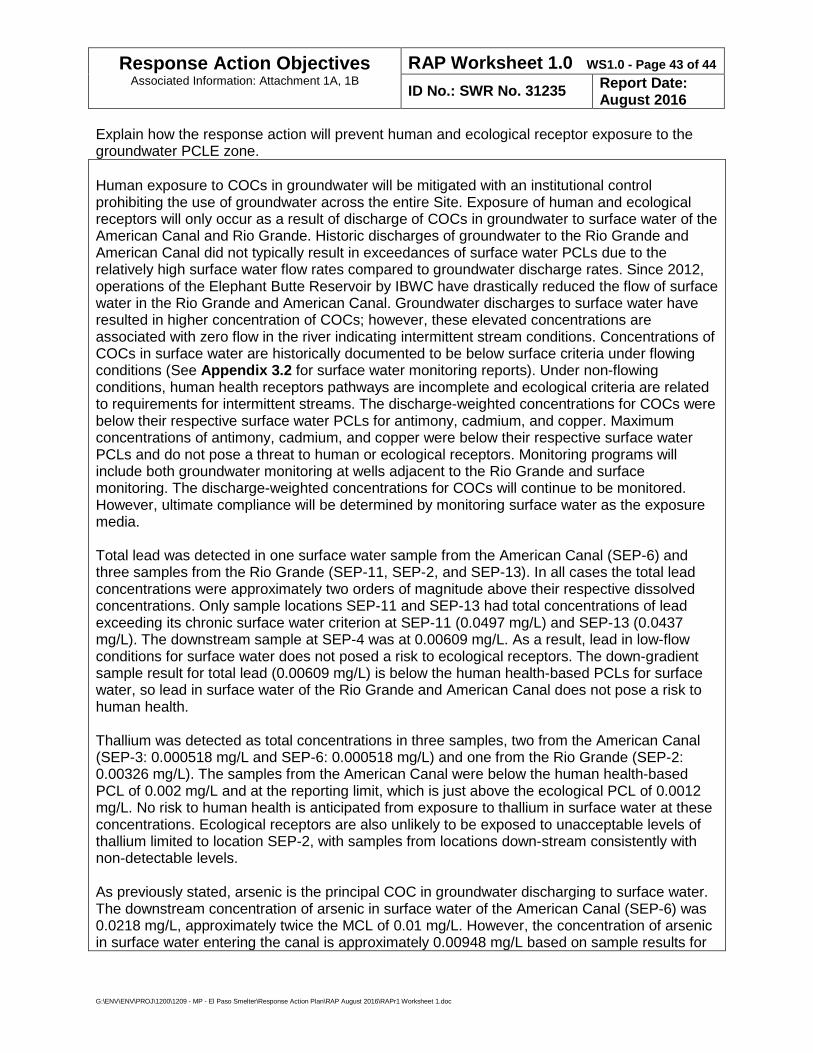
Response Action Objectives Associated Information: Attachment 1A, 1B
RAP Worksheet 1.0 WS1.0 - Page 43 of 44
ID No.: SWR No. 31235 Report Date: August 2016
Explain how the response action will prevent human and ecological receptor exposure to the groundwater PCLE zone. Human exposure to COCs in groundwater will be mitigated with an institutional control prohibiting the use of groundwater across the entire Site. Exposure of human and ecological receptors will only occur as a result of discharge of COCs in groundwater to surface water of the American Canal and Rio Grande. Historic discharges of groundwater to the Rio Grande and American Canal did not typically result in exceedances of surface water PCLs due to the relatively high surface water flow rates compared to groundwater discharge rates. Since 2012, operations of the Elephant Butte Reservoir by IBWC have drastically reduced the flow of surface water in the Rio Grande and American Canal. Groundwater discharges to surface water have resulted in higher concentration of COCs; however, these elevated concentrations are associated with zero flow in the river indicating intermittent stream conditions. Concentrations of COCs in surface water are historically documented to be below surface criteria under flowing conditions (See Appendix 3.2 for surface water monitoring reports). Under non-flowing conditions, human health receptors pathways are incomplete and ecological criteria are related to requirements for intermittent streams. The discharge-weighted concentrations for COCs were below their respective surface water PCLs for antimony, cadmium, and copper. Maximum concentrations of antimony, cadmium, and copper were below their respective surface water PCLs and do not pose a threat to human or ecological receptors. Monitoring programs will include both groundwater monitoring at wells adjacent to the Rio Grande and surface monitoring. The discharge-weighted concentrations for COCs will continue to be monitored. However, ultimate compliance will be determined by monitoring surface water as the exposure media. Total lead was detected in one surface water sample from the American Canal (SEP-6) and three samples from the Rio Grande (SEP-11, SEP-2, and SEP-13). In all cases the total lead concentrations were approximately two orders of magnitude above their respective dissolved concentrations. Only sample locations SEP-11 and SEP-13 had total concentrations of lead exceeding its chronic surface water criterion at SEP-11 (0.0497 mg/L) and SEP-13 (0.0437 mg/L). The downstream sample at SEP-4 was at 0.00609 mg/L. As a result, lead in low-flow conditions for surface water does not posed a risk to ecological receptors. The down-gradient sample result for total lead (0.00609 mg/L) is below the human health-based PCLs for surface water, so lead in surface water of the Rio Grande and American Canal does not pose a risk to human health. Thallium was detected as total concentrations in three samples, two from the American Canal (SEP-3: 0.000518 mg/L and SEP-6: 0.000518 mg/L) and one from the Rio Grande (SEP-2: 0.00326 mg/L). The samples from the American Canal were below the human health-based PCL of 0.002 mg/L and at the reporting limit, which is just above the ecological PCL of 0.0012 mg/L. No risk to human health is anticipated from exposure to thallium in surface water at these concentrations. Ecological receptors are also unlikely to be exposed to unacceptable levels of thallium limited to location SEP-2, with samples from locations down-stream consistently with non-detectable levels. As previously stated, arsenic is the principal COC in groundwater discharging to surface water. The downstream concentration of arsenic in surface water of the American Canal (SEP-6) was 0.0218 mg/L, approximately twice the MCL of 0.01 mg/L. However, the concentration of arsenic in surface water entering the canal is approximately 0.00948 mg/L based on sample results for
G:\ENV\ENV\PROJ\1200\1209 - MP - El Paso Smelter\Response Action Plan\RAP August 2016\RAPr1 Worksheet 1.doc
Response Action Objectives Associated Information: Attachment 1A, 1B
RAP Worksheet 1.0 WS1.0 - Page 44 of 44
ID No.: SWR No. 31235 Report Date: August 2016
SEP-9, which indicates arsenic contributions from other sources. This exceedance corresponds to a canal flow rate of 27 cfs compared to an average of 94 cfs over 2014 and 2015 through April. The IBWC has received a $22,000,000 settlement from ASARCO to address impacts to the American Canal.
G:\ENV\ENV\PROJ\1200\1209 - MP - El Paso Smelter\Response Action Plan\RAP August 2016\RAPr1 Worksheet 1.doc