Embed Size (px)
Citation preview
Page 1 • PLUREL Milestone Report 2.3.15 • December 2007 Page 1
Land use relationships in rural-urban regions Module No. 2 12/2007
PERI-URBAN LAND USE RELATIONSHIPS –
STRATEGIES AND SUSTAINABILITY
ASSESSMENT TOOLS FOR URBAN-RURAL
LINKAGES, INTEGRATED PROJECT,
CONTRACT NO. 036921
Milestone 2.3.15
Response Functions
for open space,
biodiversity and
recreation Ingo Zasada, Felix Müller, Klaus Müller,
Verena Tussaint, Armin Werner, Annette
Piorr, Leibnitz-Centre for Agricultural
Landscape Research ZALF
Page 2 • PLUREL Milestone Report 2.3.15 • December 2007
Contents
Contents 2
1 Introduction 3
2 Methodology 5
3 Spatial Level and Data 8
4 Land-use related Indicators for Recreation and Biodiversity 13
5 Preliminary Results on European level 18
6 Preliminary Results on Regional Level 24
7 Focus on Urban Ecology 28
Literature 31
Page 3 • PLUREL Milestone Report 2.3.15 • December 2007
1 Introduction
According to the DoW the study focuses on response functions (RF) for open space, biodiversity and recreation. It is the task of the study to establish a regression model representing the impact of changing socio-economic, bio-physical structures and activities resulting in land use changes on ecosystem services summed up to the landscape properties biodiversity and recreation as well as for the availability of open spaces (urban-non-urban as well as sealed-non-sealed distinction). For all three a set of indicators have been developed upon a basis of suitability of representation, sensitivity to land use change and availability of data on European level. Both recreational quality and biodiversity are not confined to a particular kind of land cover: Every day leisure activities like cycling take place in urban environments, while cities provide habitats for a large variety of animal and plant species. However, both amenities crucially depend on the existence, accessibility and connectivity of unsealed areas like forests, green lands, areas shaped by agriculture (much of Europe’s biodiversity today is sustained by cultural landscapes) lakes, rivers as well as the transitional zones between them. Therefore, and due to its high empirical accessibility, we chose a definition of open space as all unsealed land, no matter if it is placed in a rural, urban or peri-urban context. A more differentiated view is likely to be adopted at a later stage. As a starting point for our analysis, we take a simple distinction between built up (sealed) land and open space in the aforementioned definition. Land use changes are at this stage understood as changes of the share and the inner structure of open space, as well as the spatial pattern of “red” (built up) and “green” (open space) areas. Impacts on biodiversity and recreation are analysed from this perspective. At the broadest level land use changes (original level 3), we look at the mere share of open space and how it changes. More specifically we consider the relative share of areas, which are distinctly dedicated to biodiversity protection and recreation, respectively. The most common indicator for the earlier is the share and change of Natural and Semi-natural areas. The choice for a land use based indicator for recreational areas can depend on the regional context (urban or rural), but it most certainly includes urban green areas as well as areas for nature oriented recreation like landscape parks and biosphere reservations. Land use intensities (which we understand in a wider sense as aspects of land use; also level 3 in the level structure) with relevance for recreation and biodiversity are most appropriately measured as parameters determining the degree of disturbance: A high density of recreational activity itself causes disturbance to recreational value due to noise and pollution. A small set of parameters can, if the respective impacts of each are properly understood, serve as indicators for pressures based on land use intensity. These could include: leisure and tourism activities (visitors per sqkm and year), traffic, intensity of agriculture (pesticides), and others. As representations for biodiversity “friendliness” and recreational quality, understood as intangible public goods (level 4), we propose both indexes for land use structure effects (accessibility, interrupted/non interrupted open spaces) and aggregate quality indexes, which include aspects of landscape diversity (attractiveness for recreation), accessibility (recreation) environmental quality (biodiversity and recreation). This Paper represents the state of work. Firstly it outlines a summary about the proposed outcomes, considerations and discussions regarding the data and methodology of the study including the outline of the spatial approach on the two geographical levels: EU NUTSX and regional/local level and their relevance in the study. In the second main part the various landscape related indices and their suitability for the study regarding the availability of data and relevance are discussed on a basis of surveying theoretical and empiric literature. Until now only some of the indicators have been calculated for the whole European area, like the core indicator of land consumption and the share/change of semi-natural and natural land. With the example of the rural-urban region of Berlin again land consumption (related to the differences between the sub-regions) as well as the

Page 4 • PLUREL Milestone Report 2.3.15 • December 2007
availability and provision of urban areas with green open spaces are analysed on the regional level. This paper is closing with an introduction and brief description of the research field of urban ecology and the increasing importance of the urban realm for biodiversity and recreation. Within the next months this field is going to be looked at in depth.
Page 5 • PLUREL Milestone Report 2.3.15 • December 2007
2 Methodology
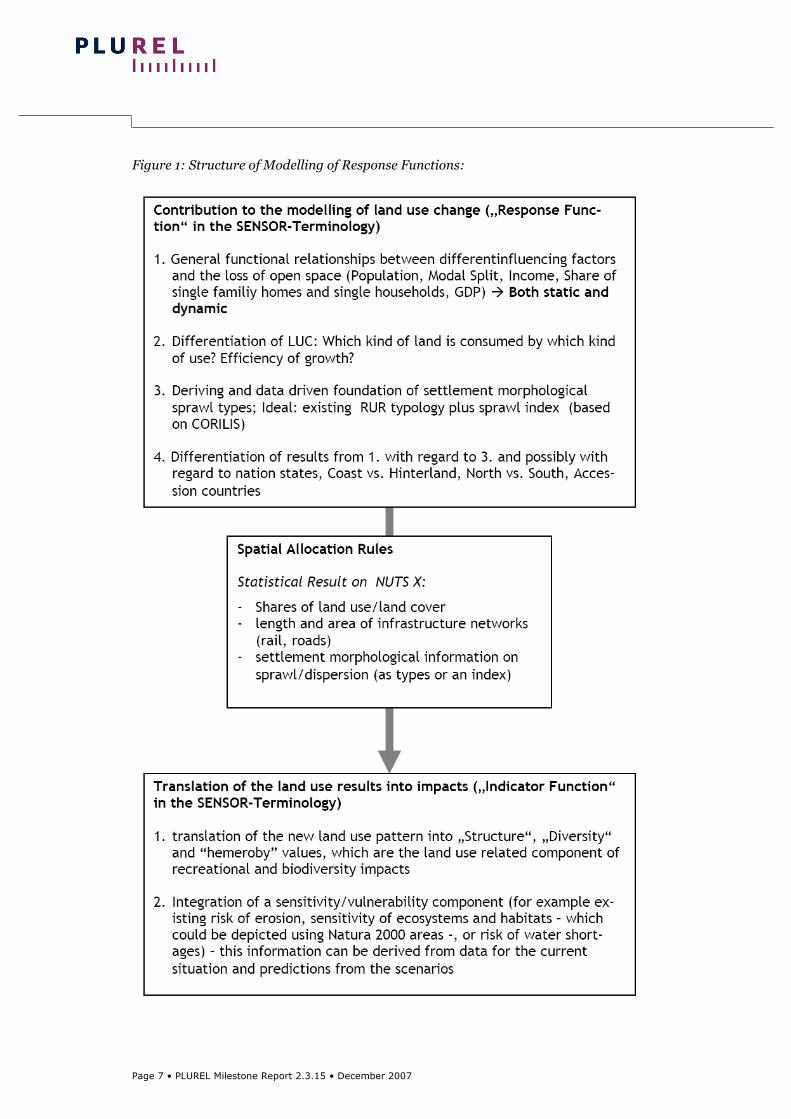
Under the assumption that the analysis of land use changes and land use impacts will be a joint effort of M1 and M2 (Figure 1), we distinguish the following two main methodological steps: 1. Development of Spatial Allocation Rules to disaggregate the outcomes of the MOLUSC land use model (which come on NUTS 2 level) and 2. The analysis of land use impacts. 2.1 Spatial Allocation Rules The question for this step is: How does European land use change manifest itself in the regions (NUTS X), specifically with regard to the aspects relevant to the WP2.3 issues? Since the MOLUSC model only distinguishes urbanised and non urbanised land, the task is to specify the process spatially and qualitatively: Which proportion of land is urbanised in each region under the conditions of demographic and economic scenarios? Which variables (like planning system, RUR type etc.) do have a mediating effect on urbanisation patterns, which are depicted by MOLUSC in a rather undifferentiated way? What kind of land is consumed by which land use? What does the resulting pattern look like (sprawl versus concentration)? As our contribution to the SAR, with regard to our deliverables 2.3.9 and 10, we look at the change of CORINE Land Cover classes between 1990 and 2000 (later possibly also 2006), especially the classes with relevance to agriculture, recreation and biodiversity. For the latter we use the definition of “natural and semi-natural land covers”. The result will be a weighting of different types of open space, specifying their probability for being consumed by urbanisation. Combined with the MOLUSC outcomes this will lead to a more profound picture of open space developments (e.g. losses in most cases) in the future. Other groups can contribute to the SAR by running tests for the influence of administrative and planning systems, specific demographic and social phenomena (like migration), settlement morphological region types (RUR), housing patterns, economic sectoral change etc. on the concrete manifestation of land use change. Thus the MOLUSC outcomes can be: a) spatially disaggregated to NUTS X, b) possibly corrected in cases where they fall short of meeting real world differences (like national planning systems) and c) semantically specified with regard to degrees of dispersal and share of land use types (urban fabric, suburban fabric, infrastructure, agriculture, natural etc.). The method used for is descriptive statistics. The testing of different typologies can be done using variance analysis, while other influences can be tested by multiple regressions. A data source for a dispersal index needs to be found. We suggest CORILIS data as a means to measure dispersal with the variance or standard deviation of pixel values around “medium grey” per region being an indicator for concentration/dispersal. Combined with CLC both land use composition and morphology can be measured and tested for influencing factors.
Page 6 • PLUREL Milestone Report 2.3.15 • December 2007
2.2 Impacts Currently we work on response functions for the indices: agricultural output and naturality of landscape (percentage of natural areas). Derived from European and national statistics, we compiled a set of independent factors, which are tested regarding it influence on land use change and depended landscape indicators:
- Land use changes (forest � urban; grassland � urban etc.) - socio-economic indicators - biophysical indicators - infrastructural indicators
The response functions will be multiple regression models that depict the expected state of the depending variables at a certain time in the future. They do not depict the timeline of the index itself, but its dependence on the independent variables, which will be made available for the time slices 2013, 2025 and 2050. Procedure steps:
� Dynamic or static? Test of multiple regression models with either dynamic inputs and outputs (changes 1990 – 2000) or absolute states at a given time. Which one has the higher R²?
� Do the RUR types respond differently to the influence of independent variables?
Variety analysis testing the influence of the typology of the indices PLUS Comparison of the pan European multiple regression model with models which are developed for all regions within a type.
� Depicting the influence of socio-economic and biophysical indicators
- Regression analysis (or variety analysis, depending on the type of data, e.g.
soil types) for individual indicators for all regions - Formation of groups with similar development trends of the particular
indicator - Time line analysis for the indicator in each group (based on mean values), so
its development can be “predicted” - Testing the sensitivity of the timeline for factors that can by given by the
scenarios - “Predicting” the indicator value for each region, each scenario and each time
slice
� Construction of function based on regression model.
Page 7 • PLUREL Milestone Report 2.3.15 • December 2007
Figure 1: Structure of Modelling of Response Functions:
Page 8 • PLUREL Milestone Report 2.3.15 • December 2007
3 Spatial Level and Data
3.1 Spatial Level European Scale The scenario-driven RF will be established on the level of the NUTS X (2/3) of entire EU 27. Representing the European spectre of regional settlement morphology the RF takes regards to the regional typology. Alongside with changed land use socio-economic (e.g. population, GDP, income, cars per inhabitant) as well as bio-physical (e.g. soil quality, relief energy) are included into an independent factor set. A spatial analysis of land-use changes within NUTS X regions allows a Europe-wide comparison of regions. The first regional typology at hand derives from different settlement morphological characteristics. From metropolitan, urban and peri-urban mono-centric and poly-centric as well as deep rural, regions without any city (Loibl et al. 2007) the degree of urbanisation is taken into consideration. Due to high aggregated scale it will not be possible to make any distinctions on a sub-regional level. But morphological criteria as basis for conducting a typology provide an opportunity to relate land-use changes to different urban-rural settings. It offers answers to the question how landscapes and open spaces in differently urbanised regions do react on structural changes. Is there a common pattern among regions of the same type? How do the various types differ? Moreover the European-wide analysis can be extended by further typologies representing other regional characteristics i.e. climate-geographical factors, planning regimes or economic performance and their influence on share and quality of open space. Regional Scale Whereas at European scale generic RF for the various region types are assembled, at regional level the intention is twofold. On the one hand following a more small scale assessment approach by looking at developments and relationships on local and regional level it provides the opportunity to validate the rather rough results on European level. The European level of spatial aggregation will allow only a rather rough assessment of land-use and open-space change due to the rather limited to a minimum assessment level (e.g. minimum size for land-use of 25 ha with CLC). Landscape indices, which are based on this assessment, will be limited in their accountability, too. As one example, how assessment on different scale matters is the distinction between the two dichotomies between urban and non-urban land at European scale as well as between sealed and non-sealed land at regional scale. With the assessment of the “fine grain” of the city, it becomes obvious that large variations of ecological conditions and potentials are at hand and need to be included into the RF establishment. Furthermore the analysis on regional scale allows integrating additional data bases to specify and validate results, like regional land use maps, topographical maps, and infra-structure or vegetation maps. So the landscape assessment on the regional level allows (a) the validation of European-wide results, (b) introduction of further indices and indicators describing the landscape properties and (c) the representation of spatial-explicit relation-ships. Results on both aggregation levels will be compared and discussed to which extend results on European level need to be adjusted regarding systematic errors. Necessary for this assessment is a sub-regional delineation of the study area as well as the basis for the delineation to be able to interpret the various results. Since it is hard to provide a statistical method to generalise the results gained on the case study level, we propose an interactive and qualitative approach to generalisation, possibly involving expert interviews and small scale scenario sessions. The aim is, to formulate a set of heuristic generalisation rules. The same applies for the problem of projecting established relationships into the future.
Page 9 • PLUREL Milestone Report 2.3.15 • December 2007
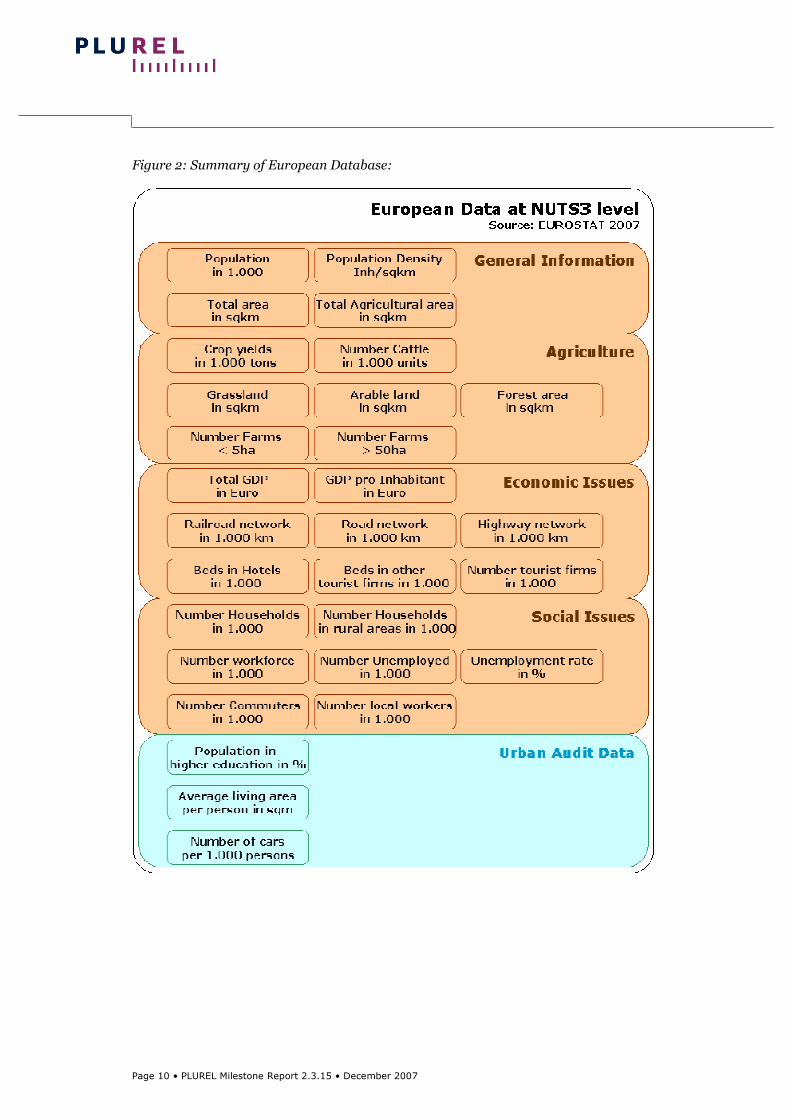
On the other hand issues of particular research interest related to urbanisation land use change are highlighted on the regional. With increasing expansion of urban areas and increasing share of population living in metropolitan areas ecological and recreational impacts as well as potentials of those spaces are of increasing scientific interest. Although urban habitats are generally smaller and more fragmented, they fulfil important ecological functions and services, due to their specific physical composition and interrelationship with the living communities. Even more open spaces within urban areas area of high importance for the human population. They gain their value in the first place from their proximity and accessibility to the urban population. Since the urban, peri-urban and rural relationships serves as the major objective within PLUREL, it is necessary to follow a regional and spatial specific approach to distinguish between those three sub-regional compartments. Therefore additional information and data-bases from case-study-regions are going to be integrated into the conduction of response functions for NUTS X regions on European level. 3.2 Data on socio-economic and bio-physical issues One general requirement for data is the availability for all administrative units included in the assessment. Dealing with questions on European level much data is limited by completeness and number of specific figures covered. As major data-sources on European level serve the various agencies of the European Union: EUROSTAT, EEA, JRC, FADN. Additionally we access data from national statistical offices. EUROSTAT delivers a lot of data but they are mostly limited by the geographic level, since most of the (complete) data is only available on NUTS1 or NUTS2-Level. The variety comprises data on population, industrial and agricultural production and land use, income, infrastructure and tourism for different time periods. Further source of local data of different urban regions is the urban audit initiative of EUROSTAT, which provide additional data such as car ownership, living area per person, education etc. These data are most relevant for research issues related to urbanisation effects, since they also distinguish between the core city and the urban region. Alongside with environmental issues, such as soil, air, water, vegetation, biotopes, designated areas, the European Environmental Agencies (EEA) is providing land use related data on a geo-informational bias. Of particular interest for the research on open space and biodiversity is especially the Digital Landscape Model for Europe as well GIS-data regarding vegetation as well as ecologic valuable, water and designated areas. Also the European Soil Data Center of the Joint Research Center (JRC) offers GIS-data with the object to soil issues. The major output is the European Soil Data Base (ESDB), raster data with information on soil typological units (STU), soil mapping units (SMU) containing figures to FAO code, material, slope, texture, water management, etc. The Farm Accountancy Data Network (FADN) supply data on agricultural production and yields on farm level. One the regional level the situation looked slightly different. Usually municipal administrations carry a large stock on highly different data on all kinds of issues. For instance the Berlin Senate Department of Urban Development is providing wide-ranging environmental data for the city area, e.g. real land utilization, soil sealing rates, quality of surface and groundwater, stock of green and open spaces, etc. collected in the Digital Environmental Atlas (Umweltatlas). It remains unclear to which extend PLUREL case study regions are able to provide similar data.
Page 10 • PLUREL Milestone Report 2.3.15 • December 2007
Figure 2: Summary of European Database:
Page 11 • PLUREL Milestone Report 2.3.15 • December 2007
3.3 Data on Land use and structure CORINE Land Cover (CLC) The satellite-based CORINE Land Cover land-use inventory provides a tool to distinguish land use respectively open space changes at macro and meso-scale. Its advantage derives from the all EU-27 area covering availability and the capability of spatial explicit analysis. So it serves as the primary data source for the European-wide assessment. CLC offers data on two different time slices 1990 and 2000 to allow statements regarding changes of land use. CLC distinguish 44 classes of land-use, which are grouped in three levels (areas, groups and types). Areas are classified into built-up, agricultural, forest/semi-natural, wetland, water areas. Doing so CLC reduces the level of complexity from the real land cover. So it allows assessment of open areas and non-open settlement areas. Moreover differences among this separation are possible, which makes the data base suitable for the task. Since minimum size of measurement for land use is 25 hectares and line-structures can only be displayed from a size of 100 meters, it only allows a rough impression (EC, 2001, Siedentop et al. 1999) so an analysis of the infrastructure network is not possible. For each plot only the dominating land-use can be mapped. Due to the fact that most land-use changes especially related to urban areas take place on a lower scale than 25 ha, only large-scale changes are displayed and therefore over represented. Results are only suitable to give evidence to overall tendencies but not precise land use changes. According to estimations of Siedentop and Meinel (2004) CLC detects only two thirds of total land consumption. Furthermore developments on “brownfields” cannot be obtained. The recognition of new development is restricted to “greenfields” (Siedentop & Meinel, 2004). Another problem is the temporal heterogeneity of data survey. For the 1990 CLC project the data derives from period of almost ten years (EC, 2001), which brings uncertainties into the comparing assessment of land use changes. Surveying recreational issues within a rural-urban perspective quantity and quality of recreational area represents a basic property. From a quantity point of view all kinds of open spaces like agricultural, forest areas, wetlands and water areas can be considered as ecological and recreational important. In contrast built-up areas of settlement, transportation infrastructure, industry, mining and waste treatment (CLC nomenclature no. 1.1.1 to 1.3.3) are considered as non-open spaces. Due to the importance of green open areas within the urban context regarding their recreation function CLC-categories urban green as well as sports and leisure facilities (1.4.1-1.4.2) are considered as open space, too. Doing so, we can distinguish between red and green, open and non-open structures. In comparison between the two time slices 1990 and 2000 the total and relative change of open areas as well as the different categories can be revealed. Further Data Sources On European level CLC remains the only data basis on land use, but nevertheless there is already further processing been done. Two examples of interesting approaches are the CORILIS concept as well as the data on Green Urban Areas in urban morphological zones (UMZ). Compiled by EEA and University of Barcelona, CORILIS represents a smoothed dataset of the CLC land use classes. Therefore CORILIS take the proximity of the land use to a particular point into consideration. Its purpose is the expression of certain area-specific intensities and potentials of the particular land use (Páramo 2006). CORILIS can also be interpreted concerning the degree of dispersion of land use, first of all urban land. As another application to CLC serve the so-called “Green Urban Areas in Urban Morphological Zones”. UMZ consist of agglomerations with more than 100.000 inhabitants related to urban area derived from CLC 1990. Here the focus only on green area (CLC 141 and 142) (EEA 2007). The database allows an assessment of the amount, the share, the structure and the location of these areas within urban agglomerations and can be interpreted as an indicator for the degree of provision with green areas providing

Page 12 • PLUREL Milestone Report 2.3.15 • December 2007
valuable ecological services.
Page 13 • PLUREL Milestone Report 2.3.15 • December 2007
4 Land-use related Indicators for
Recreation and Biodiversity Following relevant indicators for measuring the impact of land use change on ecosystem functions and services related to biodiversity and recreation are summarized. 4.1 Availability of Green Open Spaces Since open space need a certain spatial extent to evolve ecological and recreational value it is recognised that a minimum threshold size is necessary. The EC and EEA take it that green open area need to exceed a size of 5.000 m² to be accounted as a valuable green space (EEA 2002; EC 2003) whereas Bussey and Coles (1995) consider a size of minimum 2 ha for a “forest feeling” at regional scale. Regarding the aspect that urban green areas often fall below a size of 2 ha, it seems reasonable to be geared to the 5.000 m² threshold. Due to the focus on a comparison between urban and rural areas we orientate on the European Common Indicators criteria of the EC. For the reason of CLC limited resolution the size threshold is only applicable on regional scale. Indicator: Regional Share of Open Spaces The share of open space (in contrast to built-up areas) represents the most simple, but fundamental figure indicating the state of green open space. Here it needs to be distinguished between urban vs. non-urban land use as well as between sealed and non sealed area. On the macro-scale level of NUTSX non-urban areas according to CLC nomenclature are of interest, whereas on regional and local level a further differentiation of regarding quality and sealing rates are possible. Indicator: Share of Green Urban Areas within Urban Morphological Zone (UMZ) As already described before, an easily accessible indicator is the figure about Green Urban Areas within UMZ. Green open spaces play an important role within the urban environment they represent the foundation for providing urban areas with necessary ecosystem services. An advantage of this indicator is driven from the European-wide availability of the data. It allows comparisons among the various regions. It can be calculated by simple division. Based on CLC it also carries the problem of a rather rough spatial resolution of 25ha. 4.2 Proximity and Accessibility of Open Space One of the central issues when evaluating recreational quality is the accessibility of open space. For the urban life quality the accessibility of recreational green areas plays an important role as a social indicator. In a way accessibility could be seen from two different perspectives. The first approach considers the green open areas respectively, its accessibility measured by proximity of urban areas as well as the traffic infrastructure system. Such an indicator provides insides about local and regional amount and shares of accessible green open space leaving unclear how much of the urban population or which share of the residential areas are gaining from. This issue regards a second, more demand focussed approach. Hereby the green open areas are seen as a service provision so that its coverage of urban residential areas takes centre stage of the question. It could be distinguished between area or inhabitant focus indicators. Indicator: Share of Green Open Space max. 300 meters from urban area Commonly used among other by the EC (European Common Indicators) and the EEA the concept regards to a proximity of a 15 minutes walk or a walking distance of 500 m, which again means 300 m as the crow flies (EEA 2002, Meinel &Winkler 2002, EC 2003).
Page 14 • PLUREL Milestone Report 2.3.15 • December 2007
Resulting only open space areas within a 300 m buffer zone from settlement areas and transportation infrastructure is considered as accessible. Focussing on the amount of accessible open space as well as the spatial distribution, we need to apply geographic information systems (GIS) and landscape metrics (LSM). Due to the fact that a 15 minutes walk can be seen equal to a distance of 500 m, we assume that all green open areas with a proximity of less that this distance, can be considered as accessible. So buffer zones alongside the infrastructure network and the settlement area of 500 m are established. Indicator: Accessible Open Space per Inhabitant Since only reachable recreation potential could be utilized (Benthien 1997, p.63), the amount of accessibility is a important quality if not an basic requirement of recreational green open areas. Accessibility is provided by proximity to settlement areas as well as to infrastructure networks. On the one hand accessibility is here seen as a prerequisite for recreational use of open spaces whereas on the other hand it has also negative influences on the recreational and ecological value through its fragmenting nature (Schrijnen 2000). Nevertheless it allows comparisons between urban, peri-urban and rural areas over time. As a dynamic measure only indicating changes of accessibility over time the pure network density of a region expressed in km per sqkm area is sufficient. We are taking into account that all settlement areas are accessible. With an increasing degree of network density the amount of accessible green open spaces increases accordingly, without necessarily increasing green open areas. Since this survey aims at open spaces for recreational use it is stated that proximity and accessibility represent a further precondition Analysing the accessibility of this open space involves the creation of distance buffers in GIS, which help to determine the proportions of households and population who are located within a ‘reasonable’ distance from recreational open space. On the case study level a more differentiated approach is followed, e.g. threshold sizes for relevant open space areas are defined. Indicator: Percentage of Inhabitants living adjacent to Green Urban Areas Developed within the European MOLAND-Project, the percentage of inhabitants living adjacent to green urban areas represents a measure to express the availability of local green areas regarding the housing location of the urban population. Hereby the spatial structures of urban green areas (class 1.4.1), residential continuous and discontinuous (classes 1.1.1 and 1.1.2) as well the number of inhabitants disaggregated on community level are taken into consideration. Indicator: Urban Areas in Proximity to Open Space – Green Edge Index The Green Edge Index derived from the MOLAND-Project represents an indicator for proximity of the urban fabric to green open space. It indicates how much of the urban area has an edge with vegetated areas. Areas with a high value have a better access to recreational open space. Therefore all kinds of urban green areas are taken into consideration: gardens, parks, wooded areas, etc. 4.3 Landscape Diversity In landscape research diversity serves as a collective term for different perspectives onto ecosystems. The landscape ecologic view aims at the spatial assessment of the outer, horizontal diversity of ecosystems and its mosaics. The structural diversity (composition and configuration) of land use and vegetation stock plays a crucial role for the value of habitats (Bastian 1999, p.298 ff.). Landscape diversity is defined by the number and structure of different land-uses within a specific area. Landscape diversity has also an impact on recreational quality of a landscape, due to its importance for the evaluation of landscape scenery (Köhler 1995). Within the framework of impact analysis of urbanisation processes diversity represent an important issue since generally landscape
Page 15 • PLUREL Milestone Report 2.3.15 • December 2007
diversity is decreasing with expanding urban areas and infrastructure (Antrop 2004, p.24). To describe landscape diversity several geometry based landscape indices have been developed and can be processed with the GIS-based tool “FRAGSTATS” (McGarigal et al 1994). These indices depend on the scale of the input data and are all applicable with on European level with CLC, but which have the limitations, that only the dominating land-use is regarded in the analysis. A report of the European Commission gives an overview of the variety of indices (EC 2001). As the first one the index of Patch Density (PD) represents a simple structured expression about the number of patches in a certain area (e.g. number per 100 ha). Further area related indicators are Edge density (ED) measuring the length of edges (perimeter of patches) and the number of different land use classes. More complex indicators are the Shannon’s Index (SHDI) as well as Interspersion and Juxtaposition Index (IJI). Shannon’s index integrates a compositional as well as a structural component by analysing land use types (LT) and the areal distribution. It increases with the number of LT as well as with the evenness of the LT distribution. Interspersion and Juxtaposition Index takes the spatial configuration and neighbourhood of the patch types into consideration. The more patch types of an area are equally adjacent to each other and are so directly neighbouring the higher IJI (EC 2001). 4.4 Landscape Fragmentation and Connectivity Due a multitude of impacts the fragmentation of landscape and open space is a commonly used indicator (EC 2001, Penn-Bressel 2005, ESPON 2006, EEA 2001). Fragmentation can be interpreted as separation of grown ecological cohesion between spatial divided areas of landscape (Haber 1993) or mainly linear landscape structures with barrier and emission and collision effects (Grau 1998). Its importance arises from negative edge effects, the cumulative, anthropogenic impacts of noise, light and pollution of the open space (Theobald et al. 1997, Seiler 2001). Alongside with linear structures also area settlement structures account for fragmentation effects (Siedentop 1999). In general ecological and recreational impacts are negatively influenced by fragmentation. The functional capability of open spaces is reduced. There is quiet a lot of research on the issue of effects on biodiversity (Trombulak & Frissel 2000, Seiler 2001). But also the influence on recreational issues through detraction of landscape image, barrier effects and disturbance of nature-based recreational activities are seen as important (Schrijnen 2000, Dosch 2002, Antrop 2004). The Fragmentation is seen as one of the major causes of species loss in Middle-Europe (Jaeger et al 2001). As an approach of quantification Jaeger distinguishes six levels of fragmentation between two types of area (e.g. open space and non-open space): perforation, incision, dissection, dissipation, shrinkage and attrition (Jaeger 2000). Indicator: Fragmentation network density A simple approach to landscape fragmentation represents the assessment of the density of linear built structures, basically infrastructure lines. They are one main cause of disruption of open spaces and species habitats. The density is expressed by km network per sqkm area. The index can be easily applied by using European infrastructure network data provided by EUROSTAT GISCO. Due to the fact, that the index does not regard the spatial distribution of the network as well as to the intensity of the fragmentation (Clausing 2006, p.27) the indicator must be taken as limited in its relevance. Indicator: Non-interrupted low-traffic Open Space In contrast to the network density the index Non-interrupted low-traffic Open Space (Unzerschnittene verkehrsarme Räume) follows a more open space related perspective. From the background, that species biodiversity correlates with the size of the habitat without physical barriers, Lassen (1979, 1990) introduced the index of Non-interrupted low-traffic Open Space of a minimum size of 100 sqkm. Due to the possibility of hiking
Page 16 • PLUREL Milestone Report 2.3.15 • December 2007
tours without passing main roads, also recreational potentials of a landscape can be measured. In general this approach seemed to be applicable on European level, whereas in at least some RUR-Regions the study areas are probably too small to apply the index there. More suitable appears there a further development of the index, decreasing the minimum size of the open area to 10 sqkm, to allow differentiated results between various regions even in more urbanised area. In a Germany-wide survey of non-interrupted low-traffic open space Siedentop explored a rather logarithmic than linear relationship between the extent of settlement and infrastructure area and the share of non-interrupted low-traffic open space. Within areas of low shares of settlement area the elasticity of the relationship is higher, meaning that dispers, small-scale settlement structures have larger fragmentation effects on landscape (Siedentop 2003). This index seemed to have a far-reaching suitability to represent the environmental impact of physical, anthropogenic based impacts on landscape, without demanding an extensive data-base and computations. Indicator: Effective Mesh Size The index Effective Mesh Size represents a relatively new approach to the assessment of landscape fragmentation. Arisen from the critic on existing fragmentation indices Jaeger (2000) developed the index from a fauna reproduction perspective. Theoretically the indicator aims at the probability that in a certain area two points (e.g. animals) could meet without barriers, which would increase the chance of reproduction and finally biodiversity. The effective mesh size m eff is expressed in sqkm, the effective mesh density s eff is the number of meshes per 1.000 sqkm. The main advantage of the indicator is that it is derived from a biological, animal population background and integrates extent and structure of the fragmentation. Moreover it allows an inter-regional comparability over time. A shortcoming seems to be the amount of necessary computation. An exemplary study of effective mesh size on NUTS3-level in Germany between 1930 and 2002 showed differences between rural and urbanised regions having effective mesh sizes from 28-65% (rural) and 1-10% (urban). The amount of shrinkage was with 10% much lower in rural areas than ion urbanised area (25%) (Roedenbeck 2005). Indicator: Jaggedness degree of Settlement Whereas the previous indicators have been considering infrastructure networks and open spaces moves the perspective for the Jaggedness Degree to the structure of settlement area with more or less indirect information about the structure of open spaces and its fragmentation (Meinel et al. 2003). It relates to the CLC classes 1.1 and 1.2 (artifical surfaces ex. green urban areas. It is calculated as follow:
Jaggedness Degree =
∑
∑Areasxx
Perimeters
π2
High values indicate a high degree of settlement dispersion. Since there is a high correlation between degree of dispersion and fragmentation of landscape, it could also used for landscape fragmentation (Siedentop et al. 2003) 4.5 Anthropogenic Pressure Anthropogenic disturbance have a diminishing impact on landscape and landscape function. It is cause by human utilisation and pollution of land and ecosystems. So land use could be distinguished according to its degree of naturality. Kowarik (1992) offers a classification of four kinds of nature: 1. Original nature, 2. Agricultural culture landscape, 3. Symbolic gardening nature and 4. specific urban-industrial nature. So it is reasonably to approximate naturality by the current land use, either assessing the amount of natural land or to reinterpret land use into a regional degree of anthropogenic influence – hemeroby.
Page 17 • PLUREL Milestone Report 2.3.15 • December 2007
Share of Semi-natural and natural area The first approach is derived from ecologic value of semi-natural and natural area. These could be surveyed from land use cadastres like CLC. Particular land uses like pasture have high ecologic value. Land use change, the conversion of them into other forms of land use, like arable or urban land is likely to signal a significant local loss of biodiversity. Hemeroby The degree to which a landscape is ‘natural’ or shaped by human activity can be assessed using the concept of hemeroby. Hemeroby represents another index related to land use / land cover types describing the degree of anthropogenic intervention on the ecosystem. This human (or urban) pressure on landscape has far reaching impacts for the landscapes ability to fulfil it various landscape services like regulation or recreation. It represents all kinds of disturbing human intervention and transformation of the landscape – utilization, pollution, etc. Kowarik (1992) and (Steinhardt et al. 1999) offer an interpretation of different land cover types regarding naturality as the counterpart of hemeroby and hemeroby itself. (Steinhardt et al. 1999) even related the hemeroby classification to a more distinctive nomenclature of land cover types, a hemeroby index.
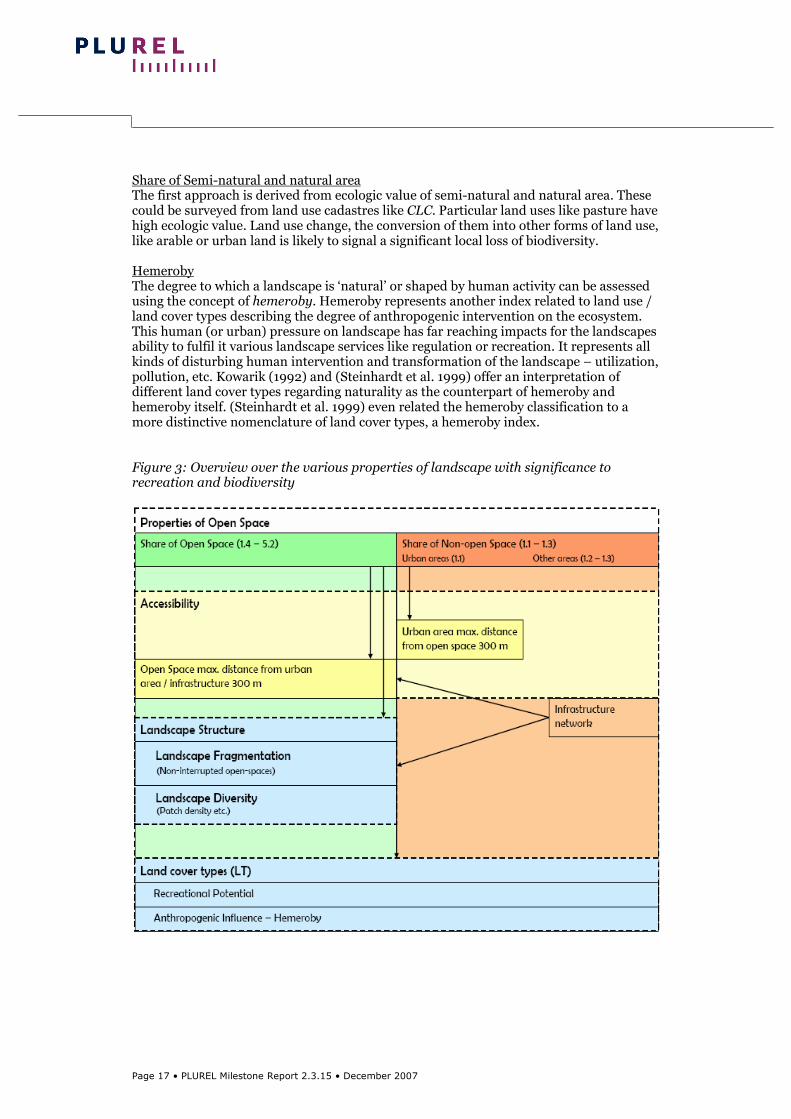
Figure 3: Overview over the various properties of landscape with significance to recreation and biodiversity
Page 18 • PLUREL Milestone Report 2.3.15 • December 2007
5 Preliminary Results on European
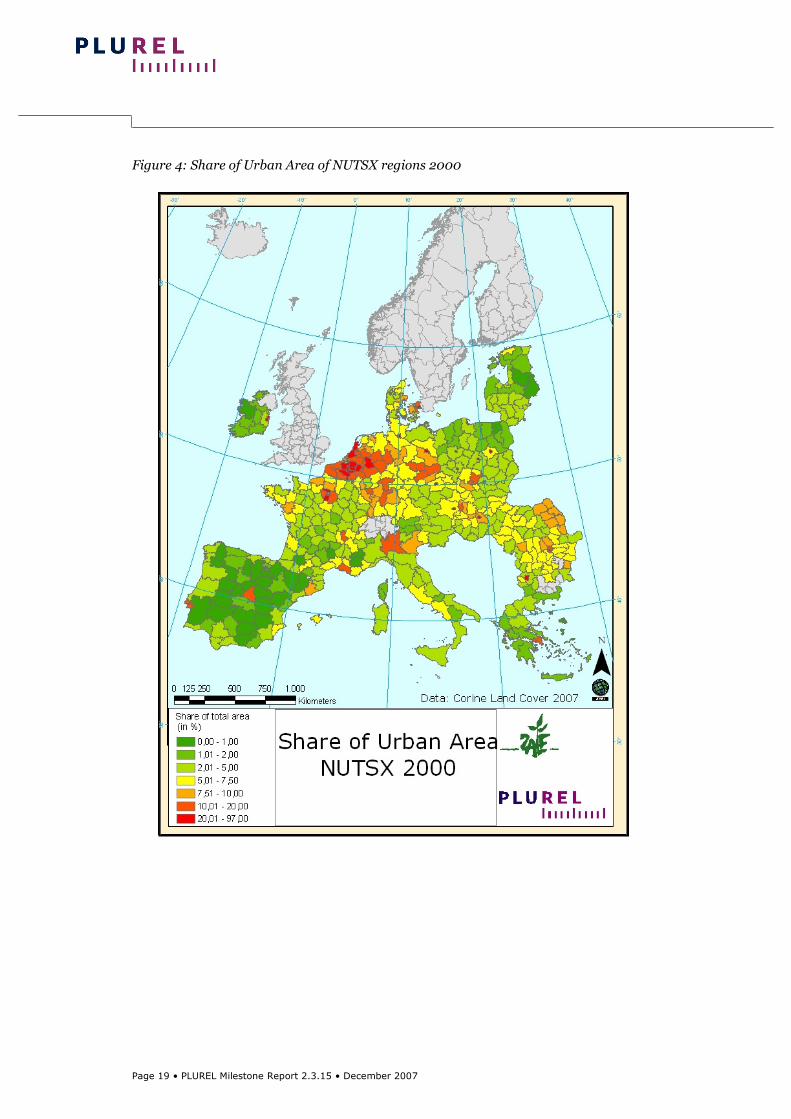
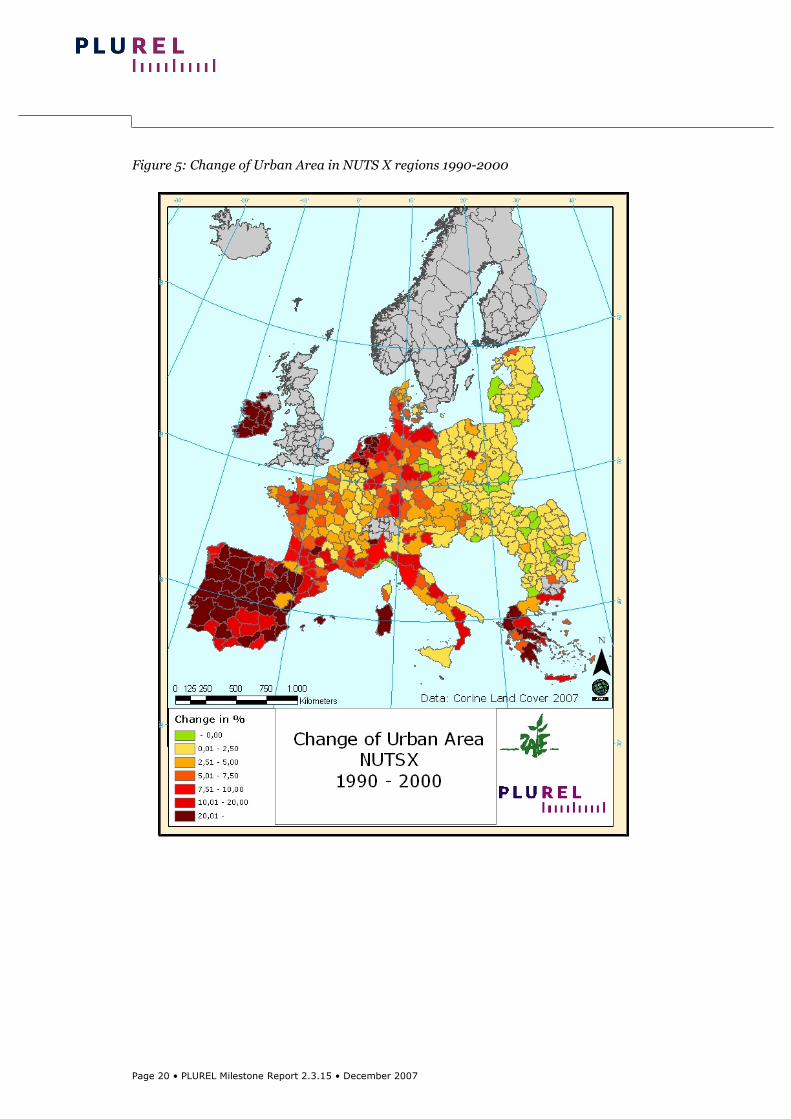
level 5.1 Share and Change of urban area (land consumption) According to calculations based on Corine Land Cover the average share of urban land use among the EU (ex. Sweden, Finland and UK) amount 4,6% in 2000. Between metropolitan, polycentric urbanised or rural region urbanisation degrees differ heavily among the NUTS X regions from 0,1% in some Spanish regions till 97,4% in the NUTS X region of Paris and 91,6% in Seine/Saint Denis. The share of urban land use is indicating the regional state of urbanisation, although it says nothing about the structures and densities, the degree of dispersion and clustering. Moreover the number is highly influenced by the total size of the administrative region. So it is not surprising, that the regions with highest share of urban land use are city regions without larger hinterland, like Paris (97,4%), Copenhagen (90,0%) or Brussels (85,7%) are among the highest numbers. Nevertheless the figures reflect somehow the actual situation. Highly urbanised are the large city and capital regions, the Benelux countries, southern Germany and northern Italy, also known as the “Blue Banana”. In contrast more a half of the regions consist of less than 5% urban area, revealing rural characteristics. (Figure 3) Between 1990 and 2000 additional 0,3% of the total area (5,1% of urban area) have been converted into urban uses, such as settlement, industry, infrastructure, mining and urban green. Subject to urbanisation have been a large variety of different regions. Alongside with already strongly urbanised areas like the Benelux countries (53,3% increase in region Flevoland, NL), mostly former rural regions in Ireland, Portugal, Spain and Greece (up to 63,3% in Soria, Spain), countries which have seen enormous economic development during that decade. What is also obvious, that especially the Mediterranean macro-region saw an expansion of urban area, due to economic and tourism development with growing numbers of living area, second homes or tourist compounds. On the other side some rural regions in Eastern Europe have less urban area in 2000 than in 1990. Reasons therefore are the closing of open coal mines and military areas. (Figure 4)
Page 19 • PLUREL Milestone Report 2.3.15 • December 2007
Figure 4: Share of Urban Area of NUTSX regions 2000
Page 20 • PLUREL Milestone Report 2.3.15 • December 2007
Figure 5: Change of Urban Area in NUTS X regions 1990-2000
Page 21 • PLUREL Milestone Report 2.3.15 • December 2007
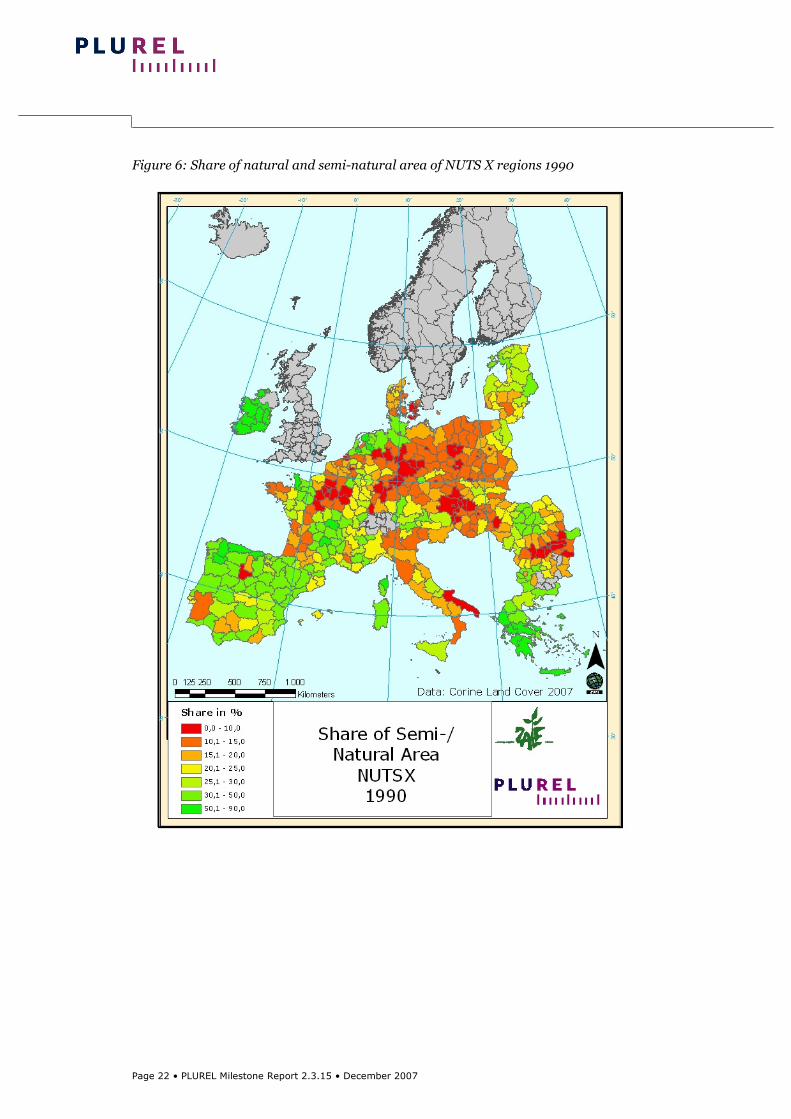
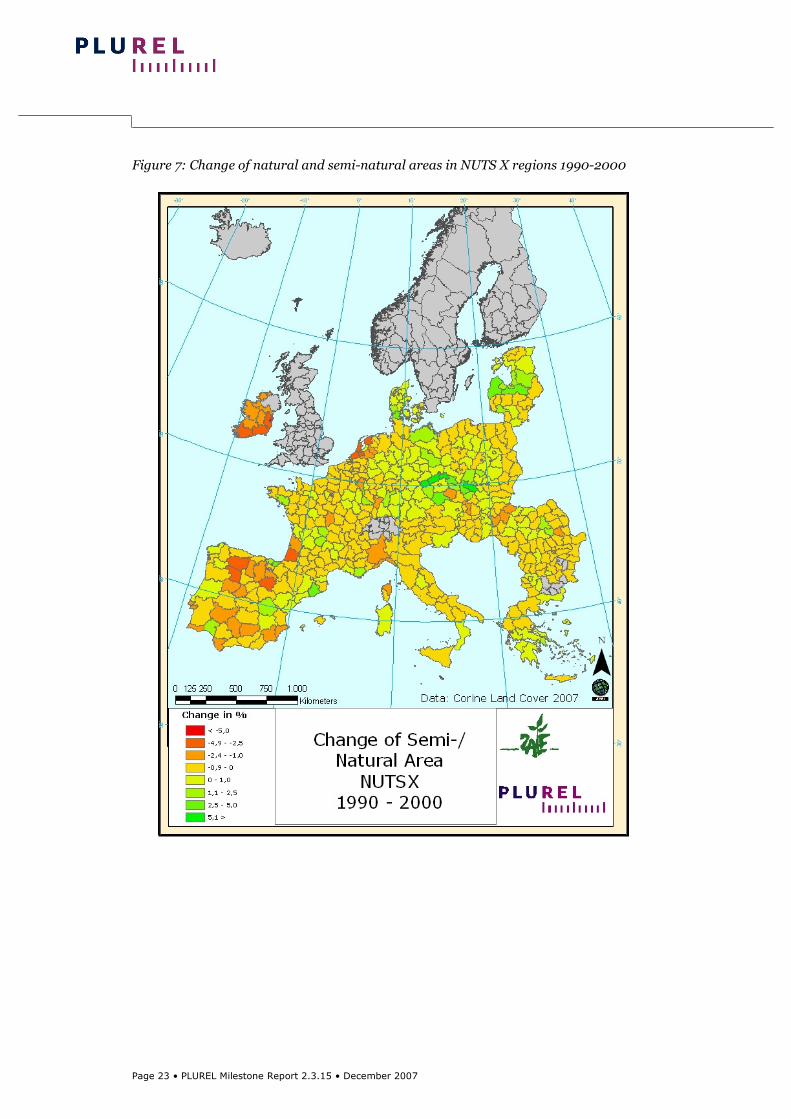
5.2 Share and Change of semi-natural and natural area Many kinds of land uses, even the open spaces are highly anthropogenic influenced and re-constructed. Among the various types of open space large differences regarding the ecological value for supporting biodiversity occur as the example of a comparison between intensive agriculture and semi-natural habitats like pastures demonstrate. In general semi-natural and natural land cover types are recognised as especially environmentally valuable. So the regional share of those LT types serve as a representative indicator of the regional state of environment especially the landscapes framework for the survival of species. To measure the share of semi-natural and natural area, based on CLC 2000 following land uses have been reclassified and aggregated on the NUTSX level:
- agricultural area with high share of semi-natural areas - Pastures, meadows, grassland - Shurubs - Wetlands
Due to the requirement of the comparison between the two time steps 1990 and 2000, the United Kingdom as well as the Scandinavian Peninsula is not included in the assessment. The similarity of socioeconomic and biophysical framework to other regions, which are part of it, we assume that the general picture for those regions will shows similarities, too. What we can see for the situation of 1990 is that the indicator is highly related to the degree of urbanisation, reaching low numbers for metropolitan regions like Paris (0,0%), Berlin (2,3%), Copenhagen (8,2%) and the Ruhr-area (>8,6%). Nevertheless even rural areas like Puglia (south-east Italy, 8,8%) or Vas (Hungary, 9,8%) could have a very low share of semi-natural and natural area, which obviously is caused by a high share of intensive agricultural land-use. In contrast many southern European regions in the Mediterranean (<76,6), Ireland (<89,1%) and the northern Germany and Dutch lowlands (<80,5%) consist of a comparably high degree of ecologically valuable land. (Figure 6) When looking at the relative changes, the results reveal a different pattern. In general the European average regional share decreased from 23,7% to 22,8%, whereas differences range from –302,2% in South-west Ireland to 109,0% in the Region Kurzeme (Latvia). Alongside with changing agricultural structures, the strong increase of semi-natural and natural in Eastern Germany (<37,6%), Czech Republic (<78,2%) and the Baltic countries (<109,0%) has much to do with the closing down of open coal mine pits and the retrieval of military and conversion and re-naturalisation of training areas. The by far largest increases realized regions, which have been economically prosperous, like Ireland (>-302,2%), northern parts of Spain (>-202,0%) as well as the large parts of the Netherlands (>-78,1%). (Figure 7) As a next step the calculated indicator figures will be statistically related to socio-economic and bio-physical factors to identify the drivers for this land-use related change.
Page 22 • PLUREL Milestone Report 2.3.15 • December 2007
Figure 6: Share of natural and semi-natural area of NUTS X regions 1990
Page 23 • PLUREL Milestone Report 2.3.15 • December 2007
Figure 7: Change of natural and semi-natural areas in NUTS X regions 1990-2000
Page 24 • PLUREL Milestone Report 2.3.15 • December 2007
6 Preliminary Results on Regional
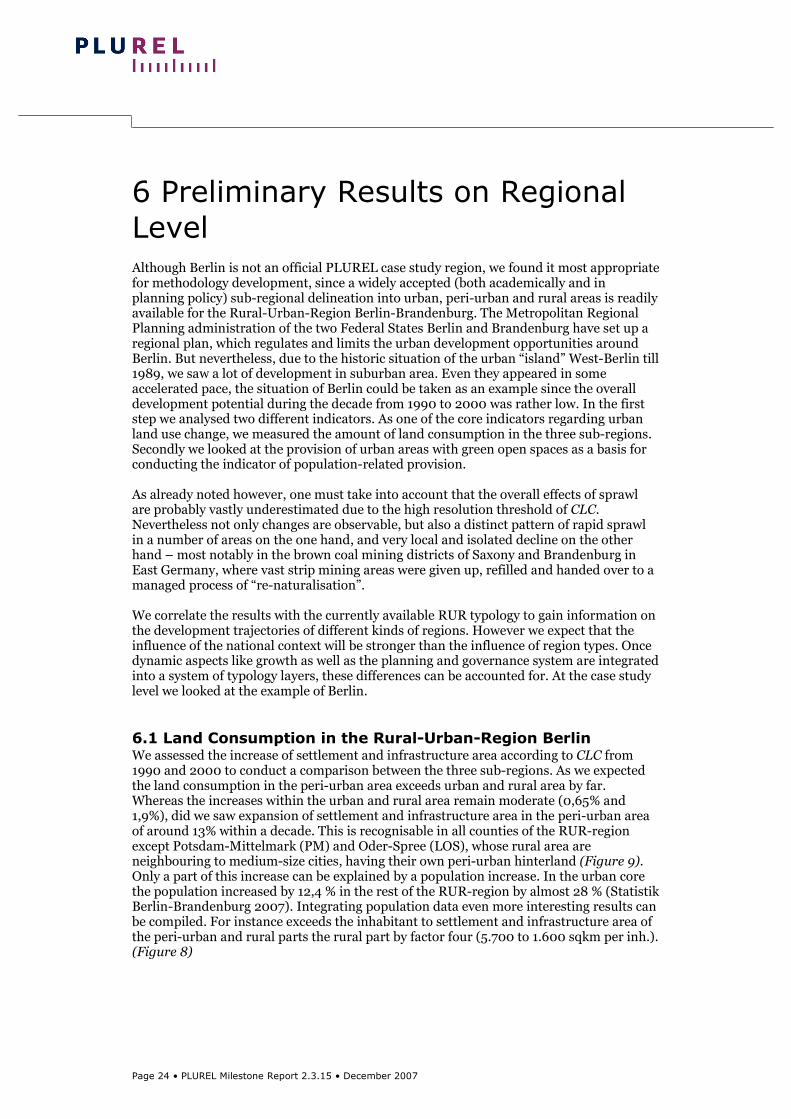
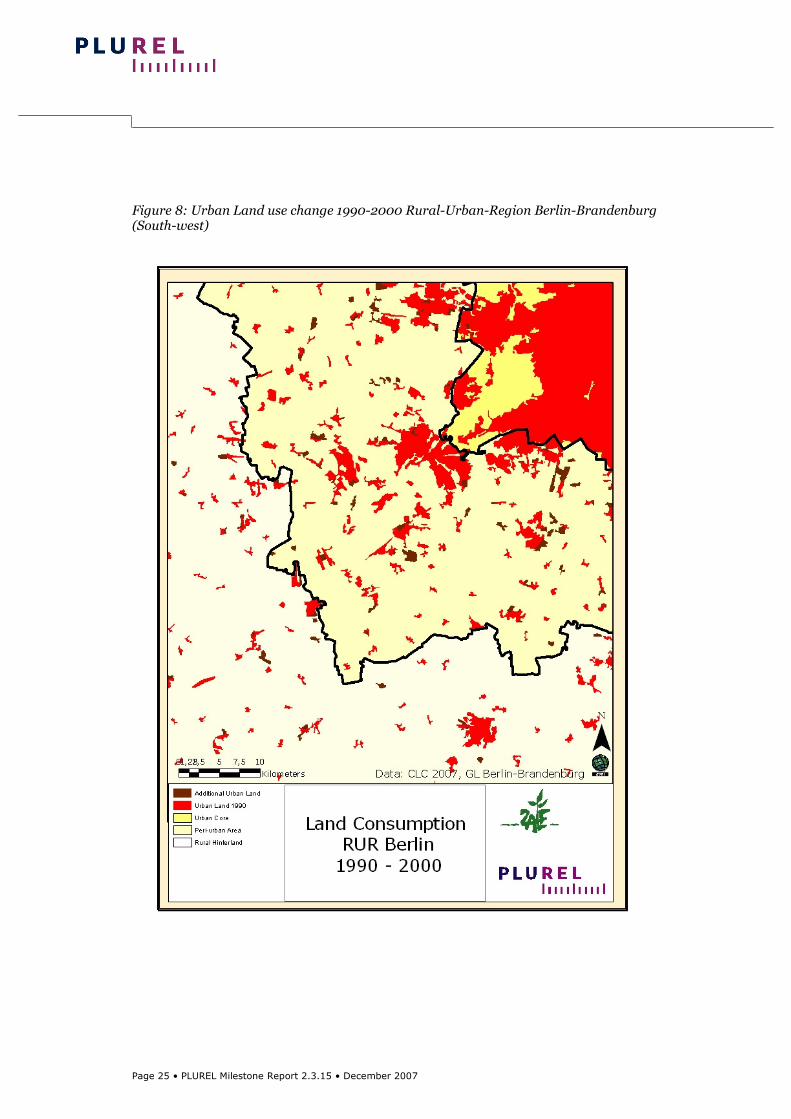
Level Although Berlin is not an official PLUREL case study region, we found it most appropriate for methodology development, since a widely accepted (both academically and in planning policy) sub-regional delineation into urban, peri-urban and rural areas is readily available for the Rural-Urban-Region Berlin-Brandenburg. The Metropolitan Regional Planning administration of the two Federal States Berlin and Brandenburg have set up a regional plan, which regulates and limits the urban development opportunities around Berlin. But nevertheless, due to the historic situation of the urban “island” West-Berlin till 1989, we saw a lot of development in suburban area. Even they appeared in some accelerated pace, the situation of Berlin could be taken as an example since the overall development potential during the decade from 1990 to 2000 was rather low. In the first step we analysed two different indicators. As one of the core indicators regarding urban land use change, we measured the amount of land consumption in the three sub-regions. Secondly we looked at the provision of urban areas with green open spaces as a basis for conducting the indicator of population-related provision. As already noted however, one must take into account that the overall effects of sprawl are probably vastly underestimated due to the high resolution threshold of CLC. Nevertheless not only changes are observable, but also a distinct pattern of rapid sprawl in a number of areas on the one hand, and very local and isolated decline on the other hand – most notably in the brown coal mining districts of Saxony and Brandenburg in East Germany, where vast strip mining areas were given up, refilled and handed over to a managed process of “re-naturalisation”. We correlate the results with the currently available RUR typology to gain information on the development trajectories of different kinds of regions. However we expect that the influence of the national context will be stronger than the influence of region types. Once dynamic aspects like growth as well as the planning and governance system are integrated into a system of typology layers, these differences can be accounted for. At the case study level we looked at the example of Berlin. 6.1 Land Consumption in the Rural-Urban-Region Berlin We assessed the increase of settlement and infrastructure area according to CLC from 1990 and 2000 to conduct a comparison between the three sub-regions. As we expected the land consumption in the peri-urban area exceeds urban and rural area by far. Whereas the increases within the urban and rural area remain moderate (0,65% and 1,9%), did we saw expansion of settlement and infrastructure area in the peri-urban area of around 13% within a decade. This is recognisable in all counties of the RUR-region except Potsdam-Mittelmark (PM) and Oder-Spree (LOS), whose rural area are neighbouring to medium-size cities, having their own peri-urban hinterland (Figure 9). Only a part of this increase can be explained by a population increase. In the urban core the population increased by 12,4 % in the rest of the RUR-region by almost 28 % (Statistik Berlin-Brandenburg 2007). Integrating population data even more interesting results can be compiled. For instance exceeds the inhabitant to settlement and infrastructure area of the peri-urban and rural parts the rural part by factor four (5.700 to 1.600 sqkm per inh.). (Figure 8)
Page 25 • PLUREL Milestone Report 2.3.15 • December 2007
Figure 8: Urban Land use change 1990-2000 Rural-Urban-Region Berlin-Brandenburg (South-west)
Page 26 • PLUREL Milestone Report 2.3.15 • December 2007
Figure 9: Change of Urban Land use in the counties of Rural-Urban-Regions Berlin 1990-2000 (separated into peri-urban and rural parts)
Change of Urban Area 1990 - 2000 in Counties of RUR Berlin
Rural Area Peri-urban Area
-30,00
-20,00
-10,00
0,00
10,00
20,00
30,00
40,00
BAR HVL OHV LOS LDS PM TF MOL total RUR
Berlin
in percent
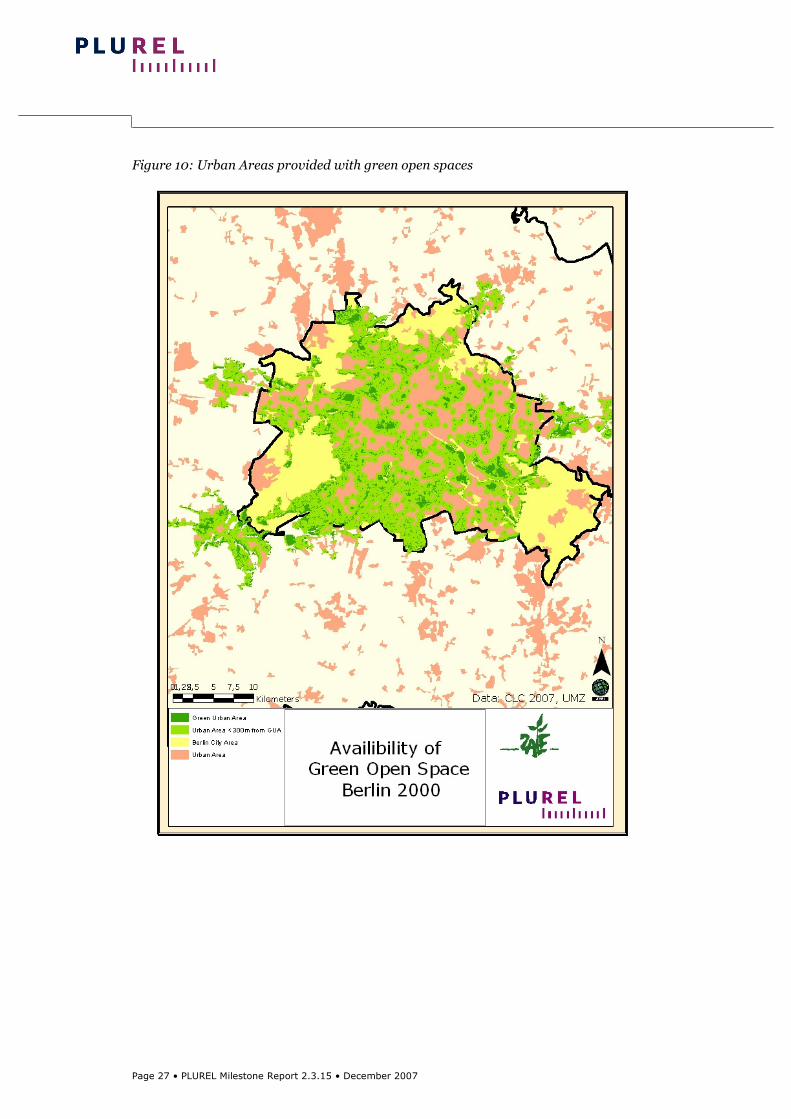
6.2 Provision of Urban Area with Green Open Spaces in Berlin As an important indicator for recreational functions we conducted exemplary an analysis of the share and the distribution of green open spaces in the city of Berlin for the reference year 2000. Basis data for the assessment have been Corine Land Cover as well as the data set for green urban areas within urban morphological zones provided by the EEA. The aim was to identify those urban areas, which are adjacent to green open spaces. Therefore we applied a distance threshold of 300 meters around green open spaces and isolated those urban areas, which are overlapping with the distance buffer. Not included in the assessment have been further non-urban areas, since their suitability to contribute to urban recreation was not clear. As a result we calculated that 42% of the urban area is provided with green open area in the neighbourhood. Adding further data on population density and distribution, the more interesting figure will be compiled, which have a much higher sensitivity to land use changes, urban structures and density.
Page 27 • PLUREL Milestone Report 2.3.15 • December 2007
Figure 10: Urban Areas provided with green open spaces
Page 28 • PLUREL Milestone Report 2.3.15 • December 2007
7 Focus on Urban Ecology In parallel to the European-wide assessment of impacts of land use change and the establishment of Response Functions on the regional level the interrelationships between the built environment and the provision of ecological services in urban areas are looked at in depth. Urban areas represent a somehow specific occurrence of landscapes, which have increasing extent and so gaining importance. For the first time in world history more than half of the population live in cities. Although the major share of this global urbanisation process takes place in developing countries, we see a comprehensive development our urban realms, too. This is first of all characterised by a low density urban expansion in city and metropolitan areas beyond former city boundaries. The tradition frontier between urban, peri-urban/semi-rural and rural spaces are blurring. Increasingly peri-urbanisation processes convert areas, which are traditionally subject to ecological regards into urban utilisation. These need a much stronger integration of the role of human acting (Forman, 1995). Alongside urban growth at the periphery of city regions in the forms of so-called sprawl, areas of low density (Duany et al., 2000) till suburban re-concentration phenomena (Duany et al., 2000; Garreau, 2001), shrinkage dynamics in urban centres plays an important in many regions worldwide (Oswalt, 2005), which leads to the establishment of much more dispers built-up urban regions. Sieverts recognises a radical alteration within the relationship between city and landscape. Both are increasingly interpenetrated, whereas the remaining but also newly available open spaces see a strong functional change. At this point Sieverts calls this relationship a city-landscape-continuum, the so-called “Stadtlandschaft”, which is characterised by hybrid, intermediate and fractal structures between the built-up city and natural landscape (Sieverts, 2000). However, increasingly attempts of overcoming of the as culturally constructed perceived dichotomy between the city as location for housing, working and provisioning functions on the one side and the rural hinterland as the place of primary production, ecological-rekreative compensation and resource supply are recognisable (Macnaghten & Urry, 1998; Schell & Ulijansze, 1999). Within the context of urban growth particularly ecological effects are of central scientific interest of urbanists, landscape researchers and ecologists (Millenium Ecosystem Assessment, 2005). In their heterogeneity as well as with their divers open spaces urban areas are increasingly recognised as ecosystems (Botkin & Beveridge, 1997; Millennium Ecosystem Assessment, 2005), while origin rural hinterlands even re-shaped or at least influenced by urban usage are also integrated into the context of a comprehensive ecological assessment of metropolitan areas (Gulinck et al., 2001; Pickett et al., 2001) or rural-urban-regions (PLUREL 2007). Doing so urban green and open spaces are integrated with their role as spatially structuring element within dispers settlement units (Sieverts, 1997) to fulfil tasks of ecological balancing and development of rekreative values (Botkin & Beveridge, 1997). 7.1 Urban Ecosystems Ecosystems represent a structural and functional systems of mutual relationships of ecologically functioning elements, which is enabled to limited self-regulation and biotic reproduction (Schubert & Wagner, 2000). It comprises a living community and its physical environment (Campbell, 2000). Focussing on rather natural “wild” spaces, strongly anthropogenic impacted urban areas with their artificial, human influenced design and cultivation of green and open spaces where long time not recognised as ecosystems in the narrow sense (Marcotullio et al., 2003). But in contrast McDonnell and Pickett argue that functional interrelationships between organisms and their physical environment are not touched by that wild-artificial delineation (McDonnell & Pickett,
Page 29 • PLUREL Milestone Report 2.3.15 • December 2007
1990) Like other ecosystems too, urban areas can be de-constructed into a set of smaller ecosystems. Especially because of the extent of the impact of urban design to ecosystem dynamics (Alberti, 2000), a separation of urban spaces into different units of urban structure with similar characteristics, such as degree of density, soil sealing, share of green open spaces, amount and extend of anthropogenic disturbance, etc. seem reasonable, since it could be assumed that those “Stadtstrukturtypen”, urban structure types show similar abilities to produce ecosystem services. From this point of view urban structure type approach provides a possibility an assessment framework for ecosystems in urban areas. In contrast to concentric urban-rural-gradient approach in ecological research, the separation of urban areas into smaller units reflects the growing disability to distinguish urban characteristics according to the proximity to the urban centre. Several classifications of those urban units are at hand: more general ones like the “Hauptnutzungsklassen” (Sukopp 1980), which similar to the CLC nomenclature distinguishes urban fabric, industrial area, infrastructure, brown fields, waste disposal and treatment, urban green. As a more detailed analysis serves the mapping of urban biotopes. It additionally characterises the built-up structure, vegetation and the degree of soil-sealing (Arbeitsgruppe “Biotopkartierung im besiedelten Bereich” 1993). Sukopp and Wittig demonstrate the dissimilarity of these units concerning the provision of ecosystem services (climate, soil and water, biodiversity) (Sukopp & Wittig 1998, p.320 f.). The reassembling of urban structure types provides and opportunity to develop an aggregation model, which takes particular characteristics of the “fine grain” of urban areas into consideration and allowing differentiated analysis and comparisons among urban regions. 7.2 Ecosystem Services in the urban-rural-context Regarding the valuation of urban ecosystems in urban-rural-regions first of all questions arise, in which form and to which extend urban spaces can contribute to the provisioning of ecological and recreational services. These are defined as direct and indirect societal benefits of ecosystem functions (Constanza et al., 1997) and are based on an emphasis of a functional oriented valuation of landscape structure (Bastian & Schreiber, 1999). At this point several sets of ecosystem functions have been developed (Bastian, 1997; Constanza et al., 1997; Millenium Ecosystem Assessment, 2005), which need to be re-assessed concerning their ability to integrate the urban realm. Commonly production, provisioning, regulating, supporting as well as socio-cultural functions and services are distinguished. These could be structured as follow: On the basis of various ecosystem services Bolund and Hunhammar have identified six groups, which are of special relevance in urban areas: air filtering, micro-climate regulation, noise reduction, storm-water discharge, sewage treatment as well as recreational and cultural heritage functions (Bolund & Hunhammar, 1999). In the context of an comprehensive urban-rural approach, this set is little on the short side, because landscape functions relevant in urban-rural regions, such as agricultural production, soil functions and biodiversity are not included. Despite multifunctional character regarding ecosystem services urban habitats unlie conflicting societal demands and trade-offs for recreation and ecological conservation. These are directly related to circumstances like population and demography dynamics of the particular urban setting. Basic research question are: Is it possible to measure the width of ecosystem services and distinguish between different urban structures and to set up rules accordingly? How will they change under the condition of urban growth and shrinkage?
Page 30 • PLUREL Milestone Report 2.3.15 • December 2007
7.3 Evaluation Approach The aim of this approach is the development of a comparing evaluation and benchmarking of ecosystem services and landscape functions in urban-rural-regions. The spatial assessment framework should integrate urban areas as well as peri-urban and rural areas within metropolitan regions. The assessment focuses on ecosystem services regarding ecological properties e.g. biodiversity, soil, groundwater recharge as well as recreational values on the spatial level of settlement structure. Due to varying urban designs, settlement-open space-compositions, utilisation intensities, ownership structures or soil sealing rates urban units such as medieval/Wilhelminean urban cores, continuous urban areas, discontinuous detached housing, large-scale housing, old industrial areas, suburban areas (residential, commercial) show different ecological and recreational values.
Page 31 • PLUREL Milestone Report 2.3.15 • December 2007
Literature Alberti, M.: Urban Form and ecosystem dynamics: empirical ecidence and practical implications. In: William, K., Burton, E., Jenks, M. (ed.): Achieving Sustainable Urban Form. London. 2000 Antrop, M.: Landscape change and the urbanization process in Europe. In: Landscape and Urban Planning 67. 2004 Arbeitsgruppe “Biotopkartierung im besiedelten Bereich”: Flächendeckende Biotopkartierung im besiedelten Bereich als Grundlage einer am Naturschutz orientierten Planung. In: Natur und Landschaft 68. 1993 Bastian, O.: Gedanken zur Bewertung von Landschaftsfunktionen - unter besonderer Berücksichtigung der Habitatfunktion. In: NNA-Berichte 3. 1997 Bastian, O.; Schreiber, K.-F.(ed.): Analyse und ökologische Bewertung der Landschaft. Heidelberg/Berlin 1999 Benthien, B.: Geographie der Erholung und des Tourismus. Gotha 1997 Bolund, P.; Hunhammar, S.: Ecosystem services in urban areas. In: Ecological economics 29/2. 1999 Botkin, D.B.;Beveridge, C.E.; Cities as environments. In: Urban Ecosystems 1/1. 1997 Bussey, S.C.; Coles, R.W.: The structure and community use of an urban forest. In: Quarterly Journal of Forestry 89/3. 1995 Campbell, N.A.: Biologie 2000 Clausing, Th.: Landschaftszerscheidung - Anwending und Vergleich verschiedener methodischer Varianten am Beispiel des Landkreises Havelland (Brandenburg). 2006 Constanza et al.: The value of the world's ecosystem services and natural capital. In: Nature 387/15. 1997 Dosch, F.: Auf dem Weg zu einer nachhaltigen Flächennutzung? In: Informationen zur Raumentwicklung 1/2. 2002 Duany, A.; Plater-Zyberk,E.; Speck,J.: Suburban Nation: The Rise of Sprawl & the Decline of the American Dream. New York 2000 European Commission: From Land cover to landscape diversity. 2001 European Commission: European Common Indicators. Towards a local sustanibility profile. 2003 European Environmental Agency: Towards an urban atlas. Assessment of spatial data on 25 European cities and urban areas. Environmental issue Report. 2002 European Environmental Agency: http://dataservice.eea.europa.eu/ access on the 2007-10-08 Forman, R.T.T.: Land Mosaics: The Ecology of Landscapes and Regions. Cambridge1995
Page 32 • PLUREL Milestone Report 2.3.15 • December 2007
Garreau, J.: Edge City. New York 2001 Grau,S.: Überblick über Arbeiten zur Landschaftszerschneidung sowie unzerschnittenen Räumen in der Bundes-, Landes- und Regionalplanung Deutschlands. In: Natur und Landschaft 73/10, 1998 Gulinck,H.; Mugica,M.; Atauri,J.; de Lucio,J.: A framework for comparative landscape analysis and evaluation based on land cover data, with an application in the Madrid region (Spain). In: Landscape and Urban Planning 55. 2001 Haber, W.: Ökologische Grundlagen des Umweltschutzes. Bonn 1993 Jaeger, J.: Landscape division, splitting index, and effective mesh size: new measures of landscape fragmentation. In: Landscape Ecology 15/2. 2000 Jaeger,J.; Esswein,H.; Schwarz-Von Raumer,H.-G.; Müller,M.: Landschaftszerschneidung in Baden-Württemberg - Ergebnisse einer landesweiten räumlich differenzierten quantitativen Zustandsanalyse. In: Naturschutz und Landschaftsplanung 10. 2001 Kowarik, I.: Besonderes städtischer Flora und Vegetation. In: Natur in der Stadt - Beitrag der Landespflege zur Stadtentwicklung. Schriftenreihe Deutscher Rat für Landespflege 61. 1992 Lassen, D.: Unzerschnittene verkehrsarme Räume in der Bundesrepublik Deutschland. In: Natur und Landschaft 62/12. 1979 Lassen, D.: Unzerschnittene verkehrsarme Räume über 100 km2 - eine Ressource für die ruhige Erholung. In: Natur und Landschaft 65/6. 1990 Loibl, W.; Köstl, M., Steinnocher,K.: Quantitative classification of the major European rural-urban regions, Draft Version, IP PLUREL, 2007 Macnaghten, P.; Urry, J.: Contested Nature. London 1998 Marcotullio,P.J.; Piracha,A.L.; King,C.: Urban Ecosystems and the Millennium Ecosystem Assessment: Towards an inclusive Framework. Working Paper. University of the United Nations. 2003 McDonnell, M.J.; Pickett, S.T.A.: Ecosystem Structure and Function Along Urban Rural Gradients - An Unexploited Opportunity for Ecology. Ecology 71/4. 1990 Meinel, G.; Winkler, M.: Spatial analysis of settlement and open land trends in urban areas on basis of RS data - studies of five European cities over a 50-year period. Geoinformation for European-wide Integration, Proceedings of the 22nd Symposium of Earsel, Praha 4.-6.5.2002 Meinel, G.; Winkler, M.: Provision of recreational areas in urban spaces – An international long-term comparison of the developments of selected European cities. Proceedings of 17th International Symposium Environmental Informatics, Cottbus 2003 Millenium Ecosystem Assessment: Ecosystem and human well-being: a framework for assessment. Report of the coceptual framework group of the Millenium Ecosystem Assessment 2005 Oswalt, P. (ed.): Schrumpfende Städte, Band 1: Internationale Untersuchung. 2005 Páramo, F.: CORILIS (Smoothing of CLC data) - Technical Procedure. 2006
Page 33 • PLUREL Milestone Report 2.3.15 • December 2007
Penn-Bressel, G.: Begrenzung der Landschaftszerschneidung bei der Planung von Verkehrswegen. GAIA - Ecological Perspectives for Science and Society 14. 2005 Pickett,S.T.A.; Cadenasso,M.L.; Grove,J.M.; Nobbs,N.T.; Pouyat,R.V.; Zipperer,W.C.; Costanza,R.: Urban Ecological Systems: Linkingterrestrial ecological, physical, and socioeconomic components of metropolitan areas. In: Annual Review of Ecology and Systematics 32. 2001 Roedenbeck, I.A.: Entwicklung der Landschaftszerschneidung in Hessen von 1930 bis 2002. 2005 Schell,L.M.; Ulijansze,S.J.: Urbanism, urbanisation, health and human biology: an introduction. In: Urbanism, health and human biology in industrialised countries. Cambridge 1999 Schrijnen, P.M.: Infrastructure networks and red-green patterns in city regions. In: Landscape and Urban Planning 48/3-4. 2000 Schubert,R.; Wagner,G.: Botanisches Wörterbuch. 2000 Seiler, A.: Ecological effects of roads - A review. 2001 Siedentop,S.; Kausch,S.; Einig,K.: Siedlungsstrukturelle Veränderungen im Umland der Agglomerationsräume. Forschungen Bundesamt für Bauwesen und Raumordnung 114. 2003 Siedentop, S. and Meinel, G.: CORINE Land Cover 2000 in Nation-wide and Regional Monitoring of Urban Land Use and Land Consumption. In: CORINE LAND COVER 2000 in Germany and Europe and its use for environmental applications. Workshop 20 - 21 January 2004 Berlin Sieverts, Th.: Zwischenstadt - zwischen Ort und Welt, Raum und Zeit, Stadt und Land. Basel 1997 Sieverts, Th.: Die verstädterte Landschaft - die verlandschaftete Stadt - Zu einem neuen Verhältnis von Stadt und Natur. In: Internationale Zeitschrift der Theorie und Wissenschaft der Architektur 4/2. 2000 Statistik Berlin-Brandenburg 2007 Steinhardt,U.; Herzog,F.; Lausch,A.; Müller,E.; Lehmann,S.: Hemeroby index for landscape monitoring and evaluation. In: Hyatt,D.E.;Lenz,R.J. (ed.): Environmental indices - system analysis approach. Oxfort 1999 Sukopp,H.; Blume,H.-P.; Elvers,H.; Horbert,M.: Beiträge zur Stadtökologie von Berlin (West). 1980 Sukopp,H.; Wittig,R. (ed.): Stadtökologie. Stuttgart 1998 Theobald,D.M.; Miller,J.R.; Hobbs,N.T.: Estimating the cumulative effects of development on wildlife habitat. In: Landscape and Urban Planning 39. 1997 Trombulak,S.C.; Frissell,C.A.: Review of ecological effects of roads on terrestrial and aquatic communities. In: Conservation Biology 14. 2000