Embed Size (px)
Citation preview
Response of Dps proteins to oxidativestress in Nostoc punctiforme ATCC 29133
Lei Chen
Degree project in applied biotechnology, Master of Science (2 years), 2010Examensarbete i tillämpad bioteknik 30 hp till masterexamen, 2010Biology Education Centre and Dept. of Photo Chemistry & Molecular Science, Uppsala UniversitySupervisor: Karin Stensjö
1
Index Abstract ........................................................................................................................................................... 2 Introduction ..................................................................................................................................................... 3
Cyanobacteria and oxidative stress ......................................................................................................... 3 Dps proteins ............................................................................................................................................ 4 Bio-hydrogen production ........................................................................................................................ 5 Aim .......................................................................................................................................................... 7
Materials and methods .................................................................................................................................... 8 Cyanobacterial Strains, Growth Conditions ............................................................................................ 8 Light induced oxidative stress ................................................................................................................. 8 Chemical induced oxidative stress .......................................................................................................... 9 Heterocysts preparation ........................................................................................................................... 9 RNA extraction ...................................................................................................................................... 10 RNA quality check ................................................................................................................................ 10 DNase treatment .................................................................................................................................... 10 Reverse Transcription ............................................................................................................................ 11 DNA contamination check .................................................................................................................... 11 Primer design ........................................................................................................................................ 11 Primer efficiency test for RTq-PCR ...................................................................................................... 12 RTq-PCR of the samples from different oxidative stress ...................................................................... 12
Results ........................................................................................................................................................... 13 Sequence alignment and primer design ................................................................................................. 13 Primer test ............................................................................................................................................. 13 Primers Efficiency test .......................................................................................................................... 14 Melting Curve Analysis ......................................................................................................................... 18 Influence of the reference gene ............................................................................................................. 18 Chemical induced oxidative treatment .................................................................................................. 22
Discussion ..................................................................................................................................................... 28 Dps protein in cyanobacteria ................................................................................................................. 28 Light & chemical induced oxidative stress ........................................................................................... 28 Variations between biological replicates ............................................................................................... 29 RNA quality .......................................................................................................................................... 30 Primer efficiency of RTq-PCR .............................................................................................................. 30 Conclusion ............................................................................................................................................. 31
Outlook .......................................................................................................................................................... 32 Acknowledgement ......................................................................................................................................... 33 Reference ....................................................................................................................................................... 34
2
Abstract
Bio-hydrogen is a promising renewable energy, clean and carbon dioxide free. In
cyanobacteria, there are nitrogenase and bidirectional hydrogenase, which are suitable for
hydrogen production. However, these two enzymes are not efficient and very sensitive to
oxygen, as reactive oxygen species, which derive from oxygen, can inhibit these two enzymes
easily. Fortunately, cells have developed anti-oxidative enzymes to reduce these harmful
chemicals, the Dps protein is one of them. In Nostoc punctiforme ATCC 29133, the role of
Dps family proteins is still unclear. Previous proteomics studies show that some Dps proteins
are specifically expressed inside heterocysts. Heterocysts are the cells where nitrogen fixation
takes place and the nitrogenase requires a more reductive environment for function. Therefore,
the heterocysts are more reductive than the filament cells. The specific expression of Dps
protein, might contribute to the reductive environment of the heterocysts. When the function
of Dps family protein is clear, the activity of hydrogen producing enzymes could be improved
by manipulating the expression level of these Dps proteins.
3
Introduction
Cyanobacteria and oxidative stress
About 3.2 and 2.4 billion years ago, oxygen began to accumulate as oxygen-producing
photosynthesis evolved with the proliferation of cyanobacteria.1 At the same time, aerobic
organisms, which use oxygen as powerful electron acceptors, had to cope with the damaging
effects of oxygen on the metabolic networks which had originally evolved in an anoxic
environment.2
-2O ⋅
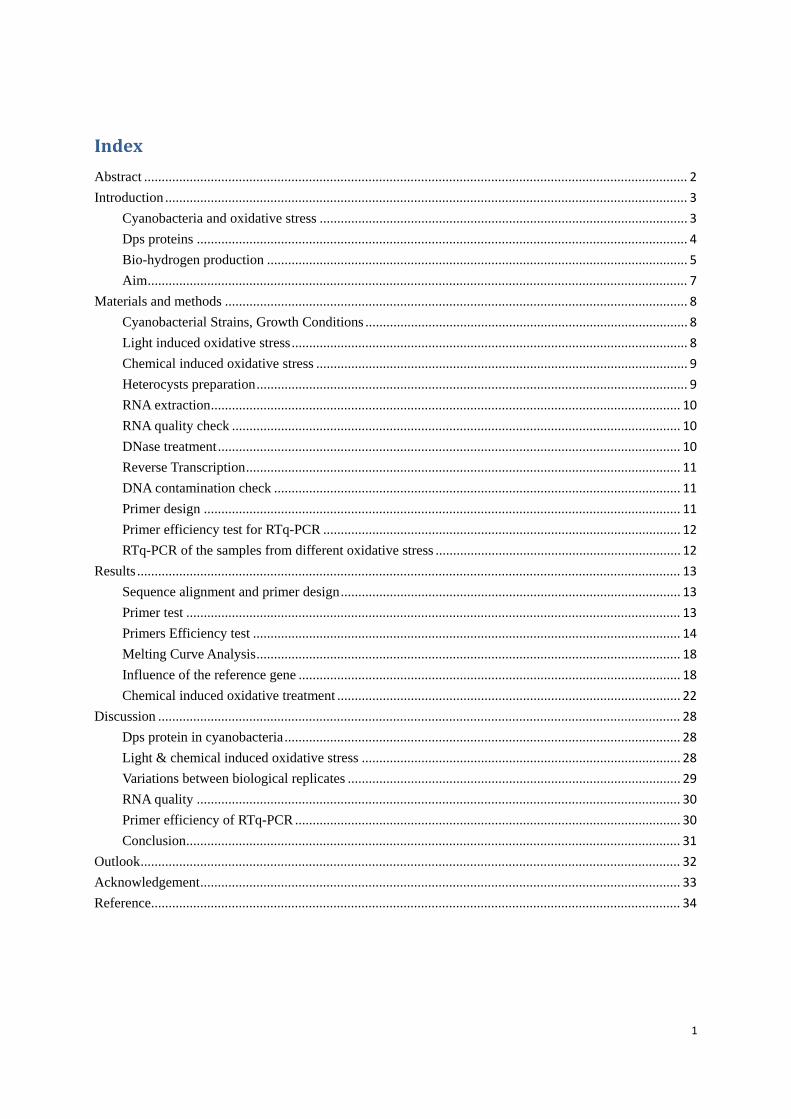
The reactive oxygen species (ROS) are inevitably produced as intermediates
of O2 reduction. The ROS family are powerful oxidizing agents, including singlet oxygen
(1O2), superoxide anion ( ), hydrogen peroxide (H2O2) and hydroxyl radical ( ⋅OH ).3
Cyanobacteria were among the first organisms to evolve effective mechanisms for protection
from oxidative stress.4,5 They developed various enzymes against ROS damage, such as
catalase, superoxide dismutase (SOD) and peroxidase.6
-2O ⋅
The superoxide dismutase (SOD)
disproportionated the superoxide anion ( ) into hydrogen peroxide (H2O2) and oxygen (O2).
Then the unfavored hydrogen peroxide (H2O2) is reduced to water by catalase and
peroxidase.7
(Figure 1)
Figure 1: ROS production and targets: The unreactive di-radical O2 lead to the formation of reactive oxygen species (ROS). In photosystem II, singlet oxygen (1O2) was produced by energy input to oxygen from photosensitized chlorophyll. In photosystem I, univalent reduction of O2 using electrons from PS II generated
superoxide anion ( -2O ⋅ ).
8 The picture is from Amel et all, FEMS Microbiol Rev. 2009 Mar;33(2):258-78.
4
Cyanobacteria are widespread and exist in different forms ranging from unicellular to
complicated filamentous organisms.9 Due to the phototrophic nature of the cyanobacteria,
they have to manage the oxidative stress from the electron transport chain at both respiration
and photosynthesis. The constant production of oxygen under illumination makes it critical
for the cyanobacteria to take care of damages caused by escaped electrons from normal
electron transfer pathways.10
-2O ⋅
In cyanobacteria, light is essential for photosynthesis, at the
same time can also be a source of oxidative stress. Singlet oxygen (1O2) is produced by the
transferring the energy from photosensitized chlorophyll to oxygen. If the light intensity is
higher than the manage capacity of electron flow, ROS other than singlet oxygen (1O2) can
also be formed such as superoxide anion ( ) and hydrogen peroxide (H2O2).
Dps proteins
DNA-binding Proteins from Starved cells (Dps) are a class of iron proteins playing dual roles
in both oxidative stress defense and iron bioavailability.11,12 Based on sequence analysis and
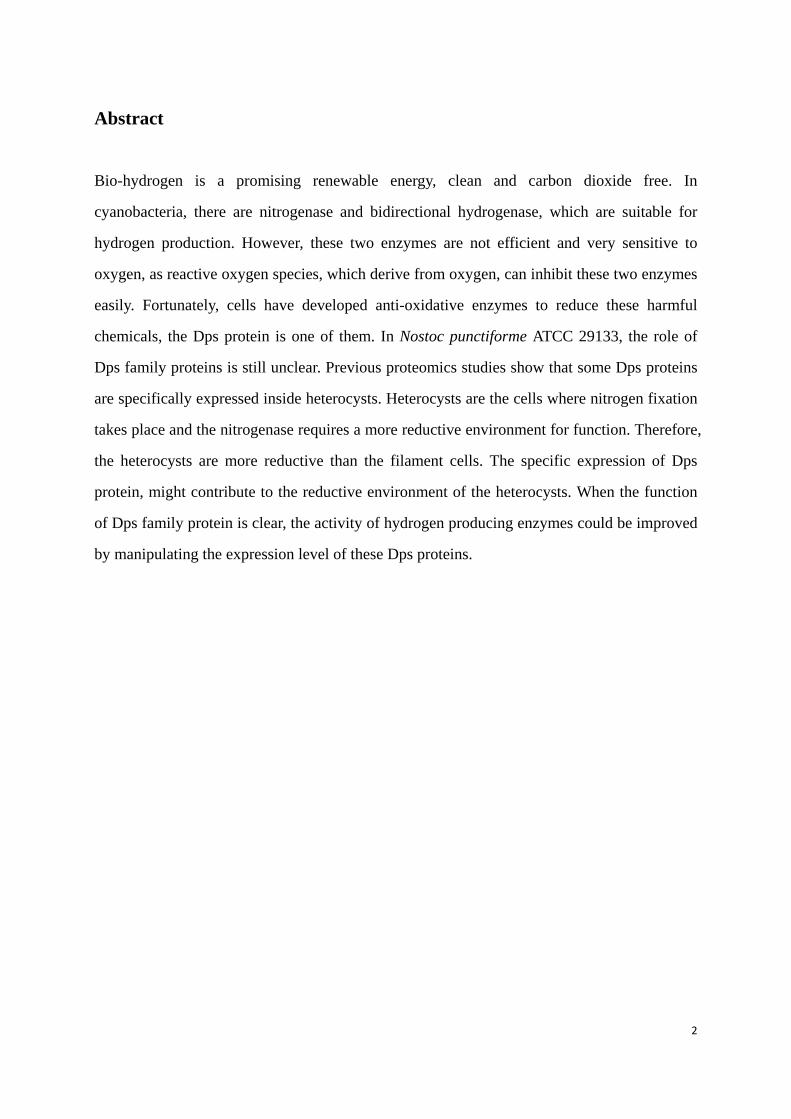
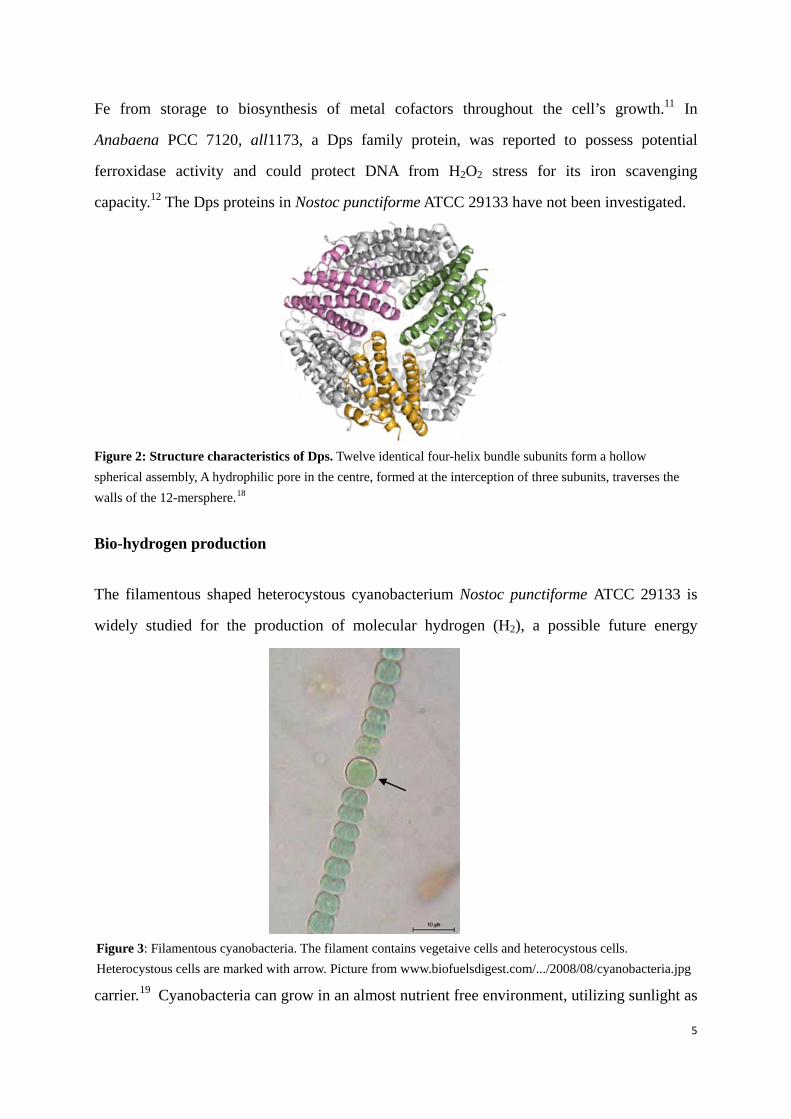
structural researches, Dps proteins (Figure 2) are a subgroup of the ferritin family which lacks
the fifth helix found in other ferritins.13 Compared to other ferritins, the function of Dps
proteins are more diverse, such as Fe storage proteins, DNA binding proteins against
oxidative stress, cold shock proteins, neutrophile activators and pili components.14 In general,
ferritins use O2 as oxidant to Fe (II) with production of H2O2, but Dps protein prefers H2O2,
which is a more efficient oxidant.15 In the presence of hydrogen peroxide, soluble Fe (II) was
oxidized into insoluble Fe (III) and stored inside the Dps proteins, guaranteeing the
homeostasis of iron level of microorganisms.16,17
++→+ HOOHIIIFeOHIIFe )(2)(2 22
The whole reaction can be summarized as
following equation2 :
Also, the Dps protein can bind to DNA without sequence specificity when the cells encounter
with external stress, e.g. iron limitation, starvation and other physiological stresses. In
cyanobacteria, Dps proteins have not been studied a lot, only a few reports indicate some
possible functions of selected Dps proteins. In the cyanobacterium Synechocystis sp.
PCC6803, mrgA, a DPS family protein, was indicated as the internal transport of intracellular
5
Fe from storage to biosynthesis of metal cofactors throughout the cell’s growth.11 In
Anabaena PCC 7120, all1173, a Dps family protein, was reported to possess potential
ferroxidase activity and could protect DNA from H2O2 stress for its iron scavenging
capacity.12 The Dps proteins in Nostoc punctiforme ATCC 29133 have not been investigated.
Figure 2: Structure characteristics of Dps. Twelve identical four-helix bundle subunits form a hollow spherical assembly, A hydrophilic pore in the centre, formed at the interception of three subunits, traverses the walls of the 12-mersphere.18
Bio-hydrogen production
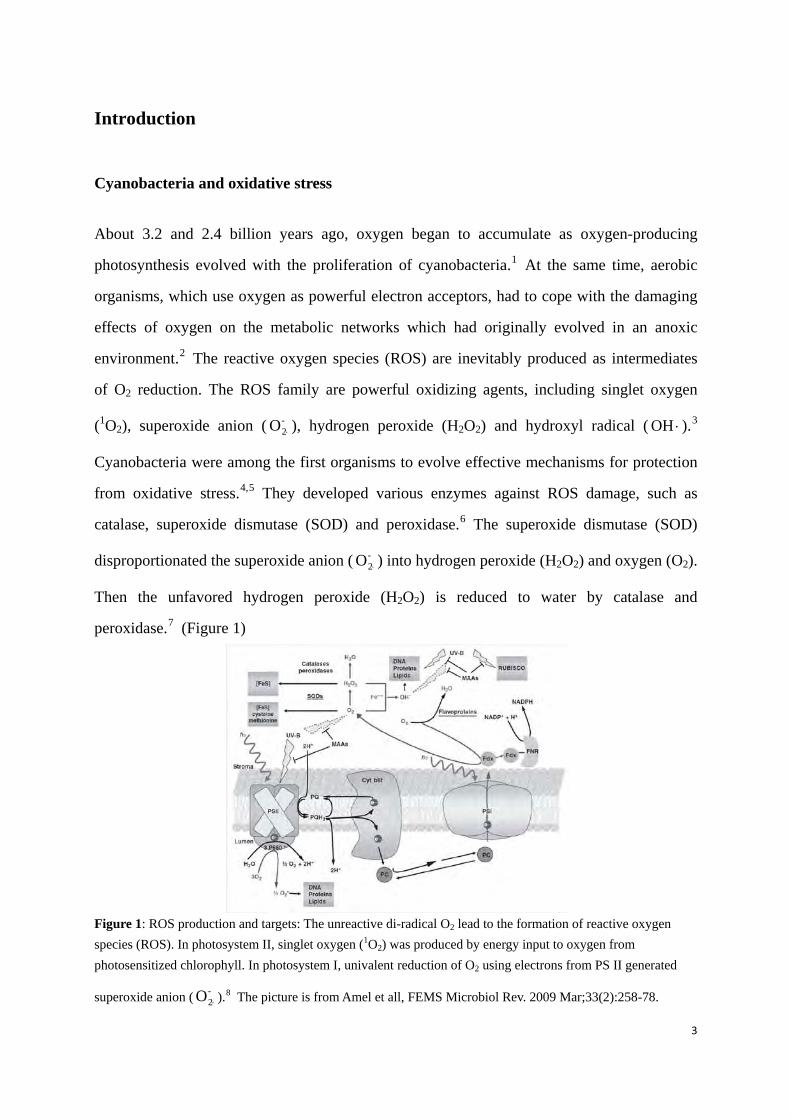
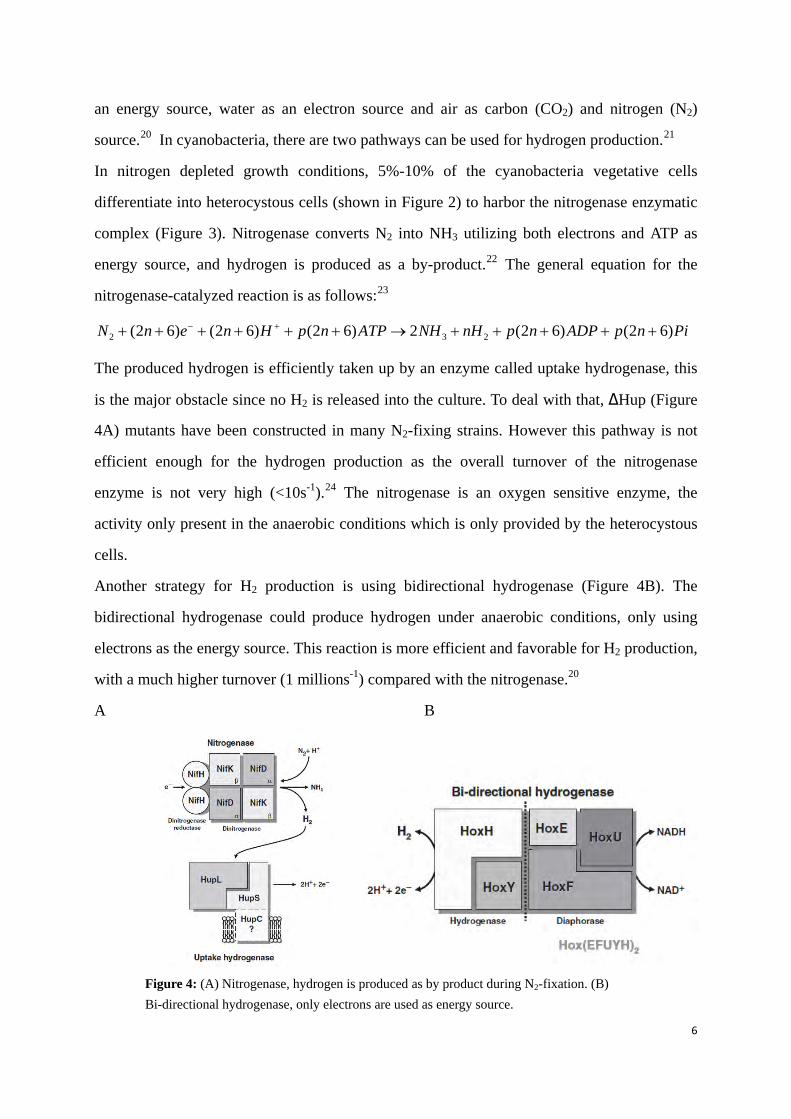
The filamentous shaped heterocystous cyanobacterium Nostoc punctiforme ATCC 29133 is
widely studied for the production of molecular hydrogen (H2), a possible future energy
carrier.19 Cyanobacteria can grow in an almost nutrient free environment, utilizing sunlight as
Figure 3: Filamentous cyanobacteria. The filament contains vegetaive cells and heterocystous cells. Heterocystous cells are marked with arrow. Picture from www.biofuelsdigest.com/.../2008/08/cyanobacteria.jpg
6
an energy source, water as an electron source and air as carbon (CO2) and nitrogen (N2)
source.20 In cyanobacteria, there are two pathways can be used for hydrogen production.21
In nitrogen depleted growth conditions, 5%-10% of the cyanobacteria vegetative cells
differentiate into heterocystous cells (shown in Figure 2) to harbor the nitrogenase enzymatic
complex (Figure 3). Nitrogenase converts N2 into NH3 utilizing both electrons and ATP as
energy source, and hydrogen is produced as a by-product.
22 The general equation for the
nitrogenase-catalyzed reaction is as follows:23
PinpADPnpnHNHATPnpHnenN )62()62(2)62()62()62( 232 +++++→++++++ +−
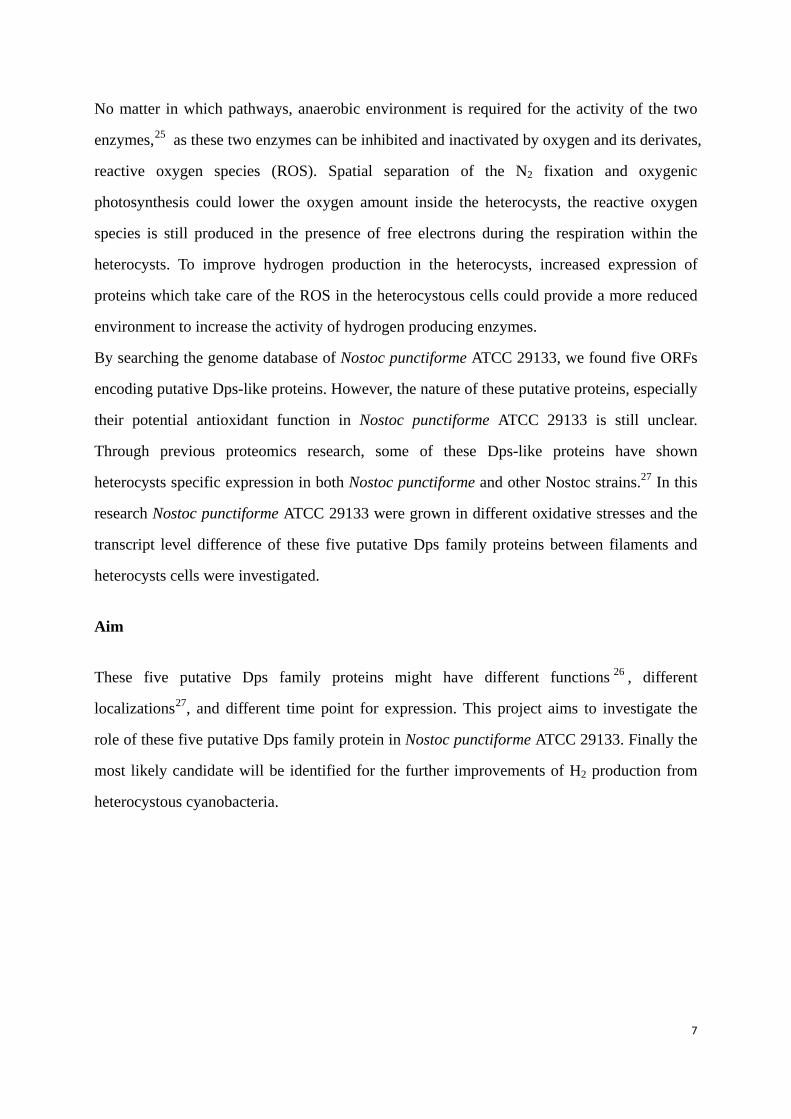
The produced hydrogen is efficiently taken up by an enzyme called uptake hydrogenase, this
is the major obstacle since no H2 is released into the culture. To deal with that, ΔHup (Figure
4A) mutants have been constructed in many N2-fixing strains. However this pathway is not
efficient enough for the hydrogen production as the overall turnover of the nitrogenase
enzyme is not very high (<10s-1).24
Another strategy for H2 production is using bidirectional hydrogenase (Figure 4B). The
bidirectional hydrogenase could produce hydrogen under anaerobic conditions, only using
electrons as the energy source. This reaction is more efficient and favorable for H2 production,
with a much higher turnover (1 millions-1) compared with the nitrogenase.20
The nitrogenase is an oxygen sensitive enzyme, the
activity only present in the anaerobic conditions which is only provided by the heterocystous
cells.
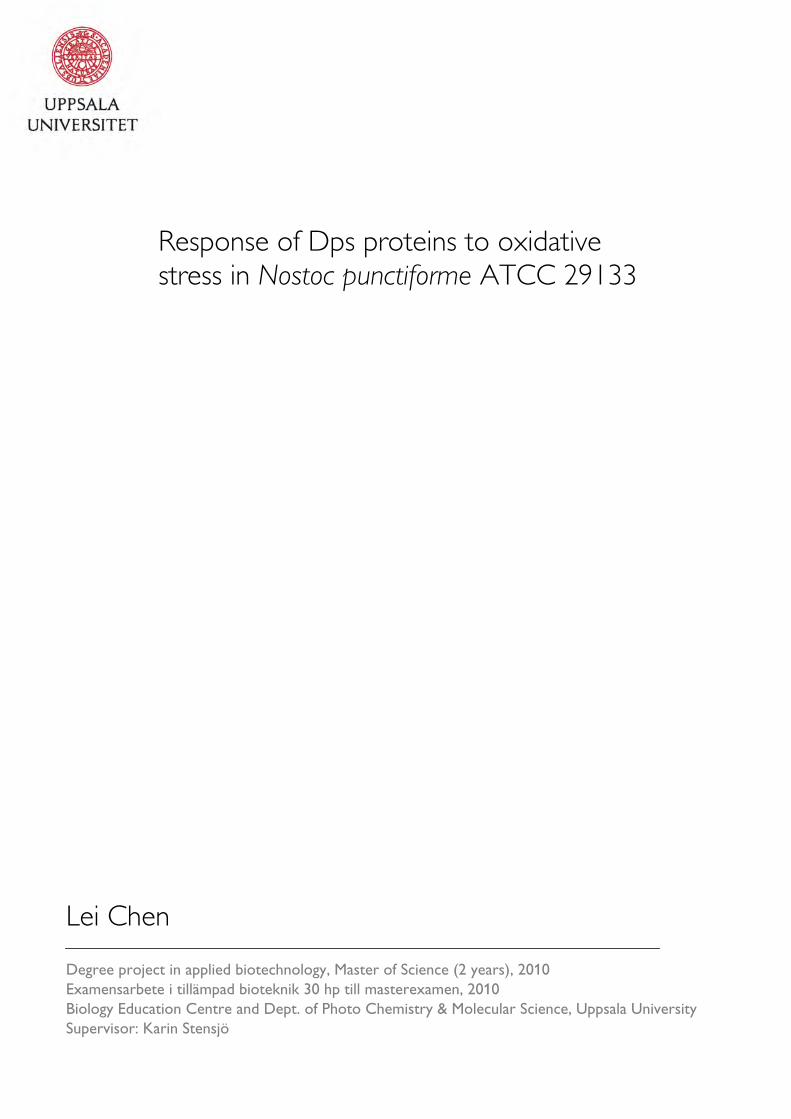
A B
Figure 4: (A) Nitrogenase, hydrogen is produced as by product during N2-fixation. (B) Bi-directional hydrogenase, only electrons are used as energy source.
7
No matter in which pathways, anaerobic environment is required for the activity of the two
enzymes,25
By searching the genome database of Nostoc punctiforme ATCC 29133, we found five ORFs
encoding putative Dps-like proteins. However, the nature of these putative proteins, especially
their potential antioxidant function in Nostoc punctiforme ATCC 29133 is still unclear.
Through previous proteomics research, some of these Dps-like proteins have shown
heterocysts specific expression in both Nostoc punctiforme and other Nostoc strains.27 In this
research Nostoc punctiforme ATCC 29133 were grown in different oxidative stresses and the
transcript level difference of these five putative Dps family proteins between filaments and
heterocysts cells were investigated.
as these two enzymes can be inhibited and inactivated by oxygen and its derivates,
reactive oxygen species (ROS). Spatial separation of the N2 fixation and oxygenic
photosynthesis could lower the oxygen amount inside the heterocysts, the reactive oxygen
species is still produced in the presence of free electrons during the respiration within the
heterocysts. To improve hydrogen production in the heterocysts, increased expression of
proteins which take care of the ROS in the heterocystous cells could provide a more reduced
environment to increase the activity of hydrogen producing enzymes.
Aim
These five putative Dps family proteins might have different functions 26 , different
localizations27
, and different time point for expression. This project aims to investigate the
role of these five putative Dps family protein in Nostoc punctiforme ATCC 29133. Finally the
most likely candidate will be identified for the further improvements of H2 production from
heterocystous cyanobacteria.
8
Materials and methods
Cyanobacterial Strains, Growth Conditions
Nostoc punctiforme ATCC 29133 were obtained from the stock culture kept by department
technician. Replicate cultures were grown photoautotrophically in 2L flask with 1.4L BG-110
medium28
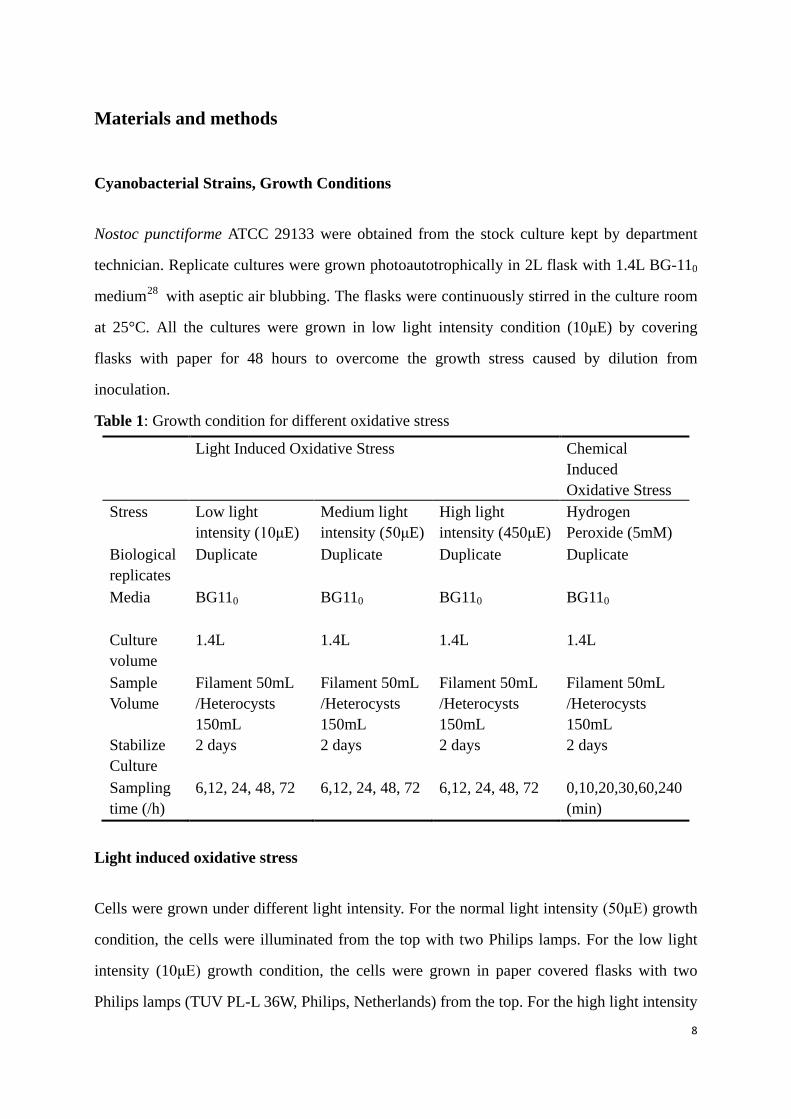
Table 1: Growth condition for different oxidative stress
with aseptic air blubbing. The flasks were continuously stirred in the culture room
at 25°C. All the cultures were grown in low light intensity condition (10μE) by covering
flasks with paper for 48 hours to overcome the growth stress caused by dilution from
inoculation.
Light Induced Oxidative Stress Chemical Induced Oxidative Stress
Stress
Low light intensity (10μE)
Medium light intensity (50μE)
High light intensity (450μE)
Hydrogen Peroxide (5mM)
Biological replicates
Duplicate Duplicate Duplicate Duplicate
Media BG110 BG110 BG110 BG110
Culture volume
1.4L 1.4L 1.4L 1.4L
Sample Volume
Filament 50mL /Heterocysts 150mL
Filament 50mL /Heterocysts 150mL
Filament 50mL /Heterocysts 150mL
Filament 50mL /Heterocysts 150mL
Stabilize Culture
2 days 2 days 2 days 2 days
Sampling time (/h)
6,12, 24, 48, 72 6,12, 24, 48, 72 6,12, 24, 48, 72 0,10,20,30,60,240 (min)
Light induced oxidative stress
Cells were grown under different light intensity. For the normal light intensity (50μE) growth
condition, the cells were illuminated from the top with two Philips lamps. For the low light
intensity (10μE) growth condition, the cells were grown in paper covered flasks with two
Philips lamps (TUV PL-L 36W, Philips, Netherlands) from the top. For the high light intensity
9
(450μE), cells were illuminated from the top with one OSRAM bulb (HQI-E 400W/D,
OSRAM, Munich, Germany). All the lamps and bulbs were situated 40 cm above from the
magnetic stirrers resulting in the desired light intensity in the culture. All the light intensity
was measured as total quantum flux density with a Quantaspectrometer SKP 200 (Skye
Instruments, UK). To avoid the overheating in the high light intensity (450μE) growth, the air
in front of the flasks was circulated by ventilation. Cells were harvested at the time points
given in Table.1.
Chemically induced oxidative stress
For the chemically induced oxidative stress, cells were cultivated in the normal light intensity
(50μE) growth condition for 72h after 48 hours stabilize culture. At time 0minute, hydrogen
peroxide was added into the culture to a final concentration of 5mM and growth was
continued under the same conditions. Cells were harvested at the times given in Table 1.
Heterocysts preparation
200mL cultures were collected at each time point and 150mL of them were used to prepare
heterocysts. The isolation of heterocysts was based on Razquin et al., with a few
modifications.29 The cells were pelleted by centrifugation at 5000xg for 10 min, and then
resuspended in extraction buffer D (pH 7.2, 0.4M sucrose, 50mM HEPES/NaOH, 10mM
NaCl, and 10mM EDTA) and incubated at 4°C for 30 min. Lysozyme was added to the cells
at an approximate concentration of 1 mg/ml and incubated at 37 °C for an hour in an orbital
shaker. After that, the samples were treated with ultrasonication in a ultrasonicator (Vibracell
VC-130, Sonics, Cincinnati, USA) at full amplitude for 30 seconds, in 3 intervals of 10 s in
ice to avoid excessive warming. Then, the homogenate was checked by microscope to make
sure there was no filament rest in the homogenate. Immediately after, five stepwise
centrifugations were followed, 1000xg, 1000xg, 750xg, 500xg, 250xg, each step last for 5
minutes. After each centrifugation, the supernatant was discarded and the pellet containing
heterocysts was resuspended in extraction buffer D. After that, samples were stored at -80 °C.
10
RNA extraction
Total RNA was extracted with TRIzol reagent (Sigma-Aldrich, Missouri, USA),
approximately 1mL of TRIzol reagent was added to each tube and mixed with 0.2g of acid
washed glass beads(e.g 0.2mm). Then the cells were disrupted by Beadbeater (Precellys®24,
Bertin Technologies, France) at the speed of 5500RPM for 30 seconds repeat 3 times, put the
cells on ice for at least 1 min in between each disruption. Immediately after, the mixture was
span down at 12,000xg for 10 min at 4°C, and the cleared homogenate solution was
transferred to a fresh Eppendorf tube. The homogenized samples were incubated at room
temperature for 5 min. After adding 0.2mL chloroform and mixed vigorously by hand for 15
seconds, the samples were incubated at room temperature for 15 min. Then the samples were
spin down at 12,000xg for 15 min at 4°C and the upper aqueous phase was transferred to a
fresh tube. After that, 0.25mL isopropanol was added to each tube following by 10 min
incubation at room temperature and spin down at 12,000xg for 10 min at 4°C. Then the
supernatant was discarded and the pellet was washed once with 1mL cold 75% ethanol.
Samples were mixed by vortexing and span at 12,000xg for 5 min at 4°C. After air-dry on ice
for 15 min, 15μl RNase-free water was added following another incubation at 55°C for 10
min to dissolve the RNA completely. Then the RNA samples were stored at -80°C.
RNA quality check
RNA quality was check by spectrophotometer (Cary 50 Bio, UV-Visible spectrophotometer,
Varian, USA) at the absorption ratio of 260nm/280nm was determined. 0.2μL of each sample
was run on the agarose gel and visualized by thiazole orange.
DNase treatment
Up to 1μg of RNA was treated with DNase I (Fermentas, Ontario, Canada) in 10X DNase I
buffer with Mn2+ for 30 minutes at 37°C, then the enzyme was inactivated with 5μl 25mM
EDTA and 10 minutes at 65°C.
11
Reverse Transcription
Reverse Transcription (RT) was carried out with iScriptTM cDNA synthesis kit (Bio-Rad,
California, USA) following the standard protocol provided by the manufacturer. The cDNA
product was stored at -20°C. The efficiency of the RT reactions was checked by concentration
determination in a spectrophotometer.
DNA contamination check
DNA contamination check was done by normal Reverse Transcription reactions mix without
added transcriptase following the standard protocol by the manufacturer. –RT samples were
checked by standard PCR reaction and the products were run on agarose gel and visualized by
thiazole orange.
Primer design
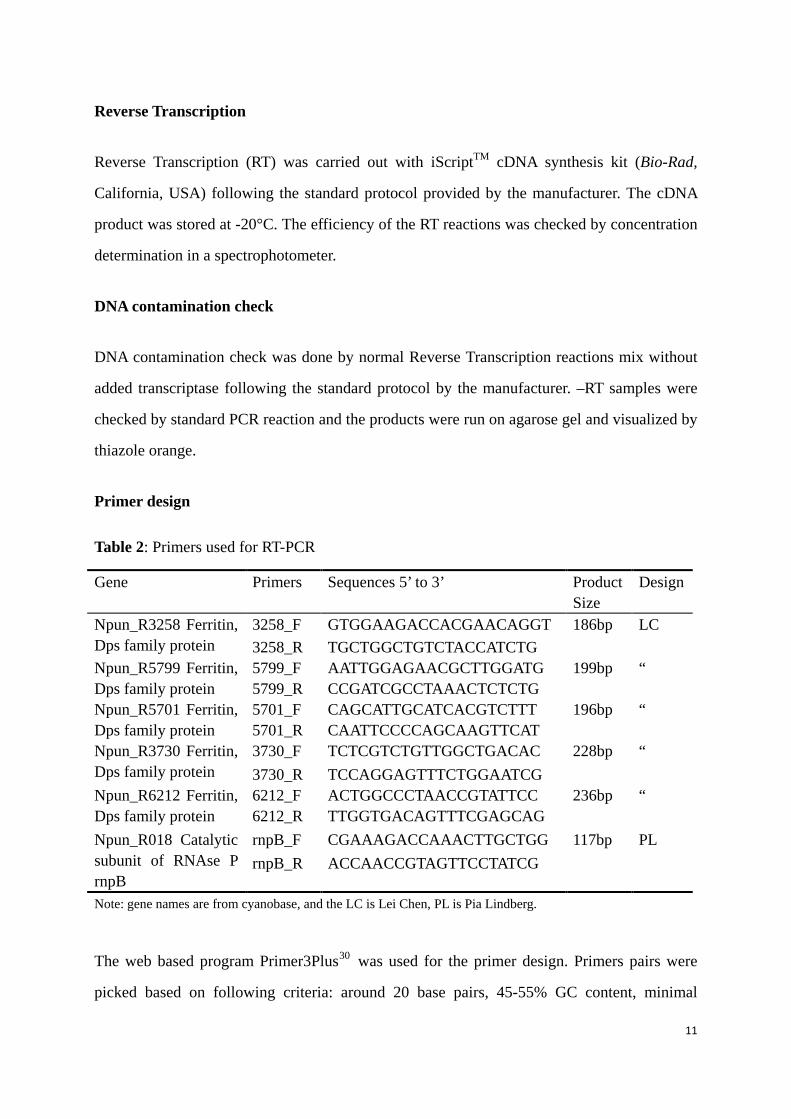
Table 2: Primers used for RT-PCR
Note: gene names are from cyanobase, and the LC is Lei Chen, PL is Pia Lindberg.
The web based program Primer3Plus30
Gene
was used for the primer design. Primers pairs were
picked based on following criteria: around 20 base pairs, 45-55% GC content, minimal
Primers Sequences 5’ to 3’ Product Size
Design
Npun_R3258 Ferritin, Dps family protein
3258_F GTGGAAGACCACGAACAGGT 186bp LC 3258_R TGCTGGCTGTCTACCATCTG
Npun_R5799 Ferritin, Dps family protein
5799_F AATTGGAGAACGCTTGGATG 199bp “ 5799_R CCGATCGCCTAAACTCTCTG
Npun_R5701 Ferritin, Dps family protein
5701_F CAGCATTGCATCACGTCTTT 196bp “ 5701_R CAATTCCCCAGCAAGTTCAT
Npun_R3730 Ferritin, Dps family protein
3730_F TCTCGTCTGTTGGCTGACAC 228bp “ 3730_R TCCAGGAGTTTCTGGAATCG
Npun_R6212 Ferritin, Dps family protein
6212_F ACTGGCCCTAACCGTATTCC 236bp “ 6212_R TTGGTGACAGTTTCGAGCAG
Npun_R018 Catalytic subunit of RNAse P rnpB
rnpB_F CGAAAGACCAAACTTGCTGG 117bp PL rnpB_R ACCAACCGTAGTTCCTATCG
12
self-pairing or complementary, calculated melting temperature around 60°C, all the primers
lead to products 160-250 base pairs. The amplified region was checked via BLAST to ensure
the target specificity of the primers. Primers were synthesized by thermo Scientific (Ulm,
Germany).
Primer efficiency test for RTq-PCR
Primer efficiency was tested by using 10 fold dilution series of a cDNA from none chemical
induced sample at 0 min. The sample quantity started from 200ng per well, six dilutions and
one none template control were prepared. The reaction mix was prepared to a final volume of
15μL (1mM of each primer, 200ng template sample, 7.5μl SYBR Green Mastermix (Bio-Rad,
California, USA)), and all the reactions were made in duplicates. Samples were run in the
MyIQ thermcycler (Bio-Rad, California, USA) for 40 cycles of PCR reaction following by a
melting curve analysis. Melting curves of each product were examined to ensure that one
primer set only produce one PCR product.31 Cycle threshold (Ct) values were plotted against
the log scaled dilution series and a linear curve was regressed based on the dots on the chart.
Then the fitness of curve (R2) and efficiency of the primers were determined.32
RTq-PCR of the samples from different oxidative stress
The quantity of total cDNA for each sample is adjusted to 200ng per reaction. The reaction
mix was prepared to a final volume of 15μL (1mM of each primer, 200ng template sample,
7.5μl SYBR Green Mastermix (Bio-Rad, California, USA)), and all the reactions were made
in duplicates. Samples were run in the MyIQ thermcycler (Bio-Rad, California, USA) for 40
cycles of PCR reaction following by a melting curve analysis. The melting curve of each
reaction mix was examined to ensure that only one product is amplified. The Ct values of
target genes were subtracted by the Ct value of reference gene, rnpB to get the ΔCt value of
each target gene. Then the ΔCt values of treated samples were subtracted by the ΔCt value of
respective untreated samples to get the corresponding ΔΔCt value. The fold difference
between the treated samples and the untreated samples was calculated according to equation:
fold difference= ΔΔCt2− .33 The fold difference was plotted against the sampling time.
13
Results
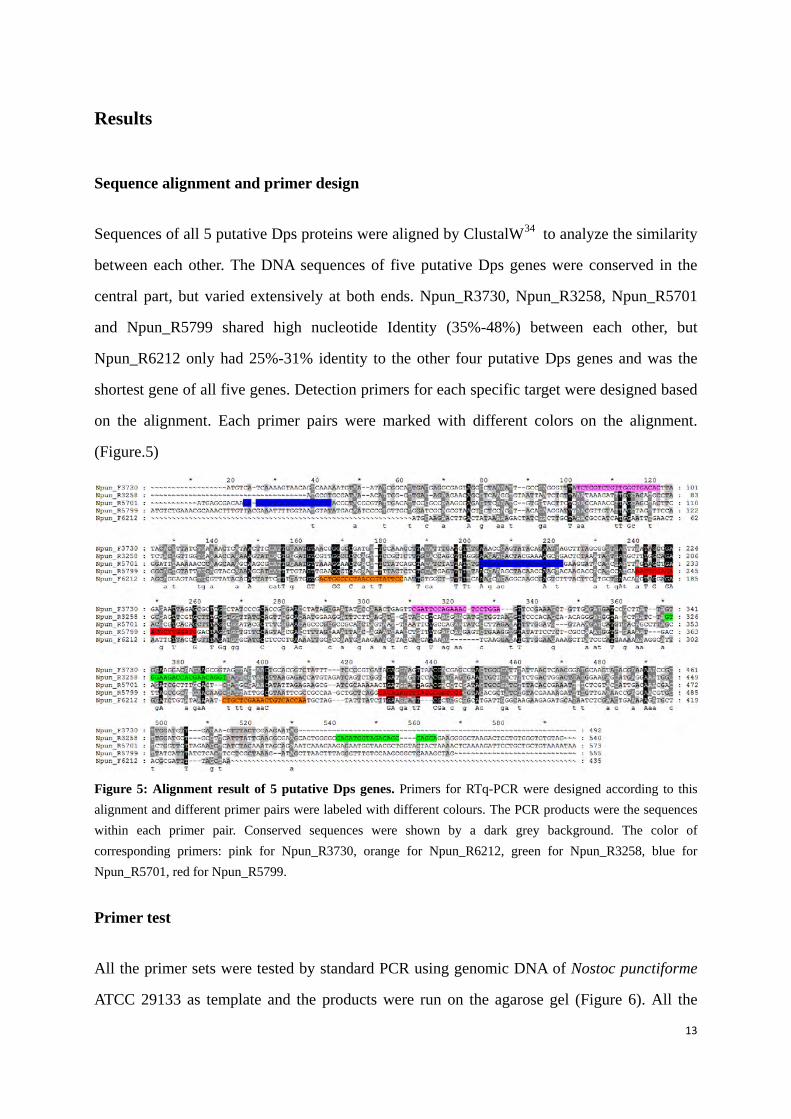
Sequence alignment and primer design
Sequences of all 5 putative Dps proteins were aligned by ClustalW34
to analyze the similarity
between each other. The DNA sequences of five putative Dps genes were conserved in the
central part, but varied extensively at both ends. Npun_R3730, Npun_R3258, Npun_R5701
and Npun_R5799 shared high nucleotide Identity (35%-48%) between each other, but
Npun_R6212 only had 25%-31% identity to the other four putative Dps genes and was the
shortest gene of all five genes. Detection primers for each specific target were designed based
on the alignment. Each primer pairs were marked with different colors on the alignment.
(Figure.5)
Figure 5: Alignment result of 5 putative Dps genes. Primers for RTq-PCR were designed according to this alignment and different primer pairs were labeled with different colours. The PCR products were the sequences within each primer pair. Conserved sequences were shown by a dark grey background. The color of corresponding primers: pink for Npun_R3730, orange for Npun_R6212, green for Npun_R3258, blue for Npun_R5701, red for Npun_R5799.
Primer test
All the primer sets were tested by standard PCR using genomic DNA of Nostoc punctiforme
ATCC 29133 as template and the products were run on the agarose gel (Figure 6). All the
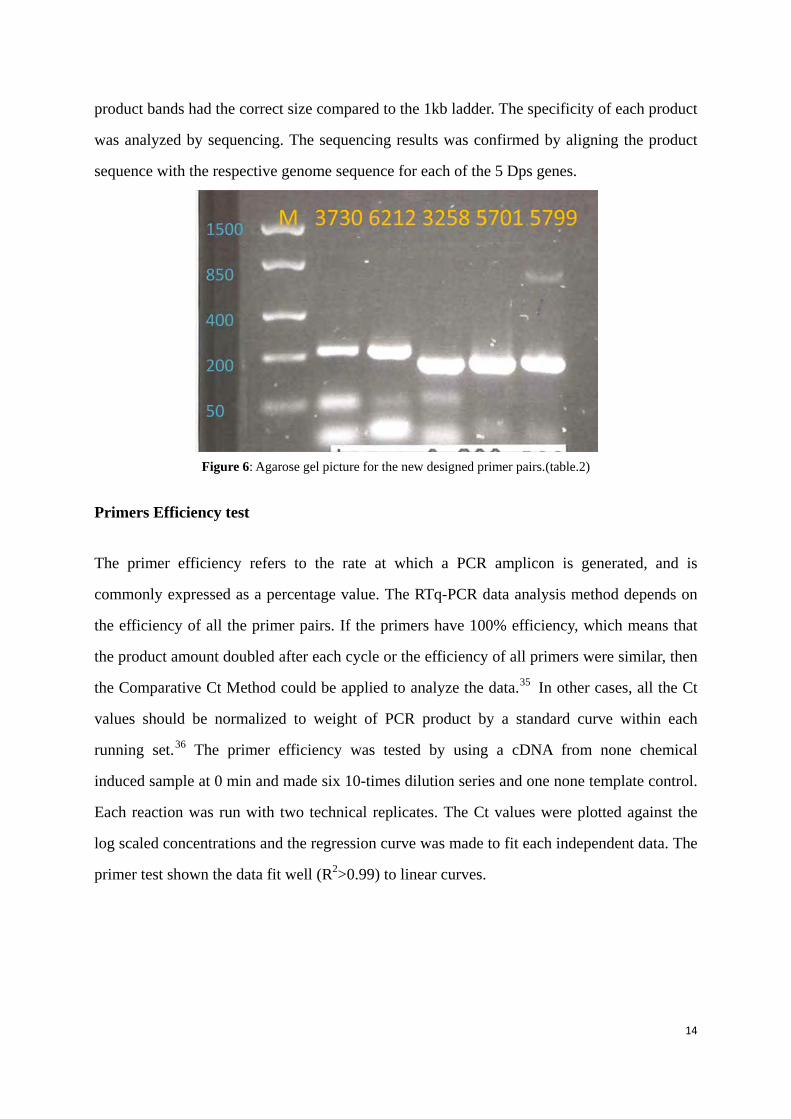
14
product bands had the correct size compared to the 1kb ladder. The specificity of each product
was analyzed by sequencing. The sequencing results was confirmed by aligning the product
sequence with the respective genome sequence for each of the 5 Dps genes.
Figure 6: Agarose gel picture for the new designed primer pairs.(table.2)
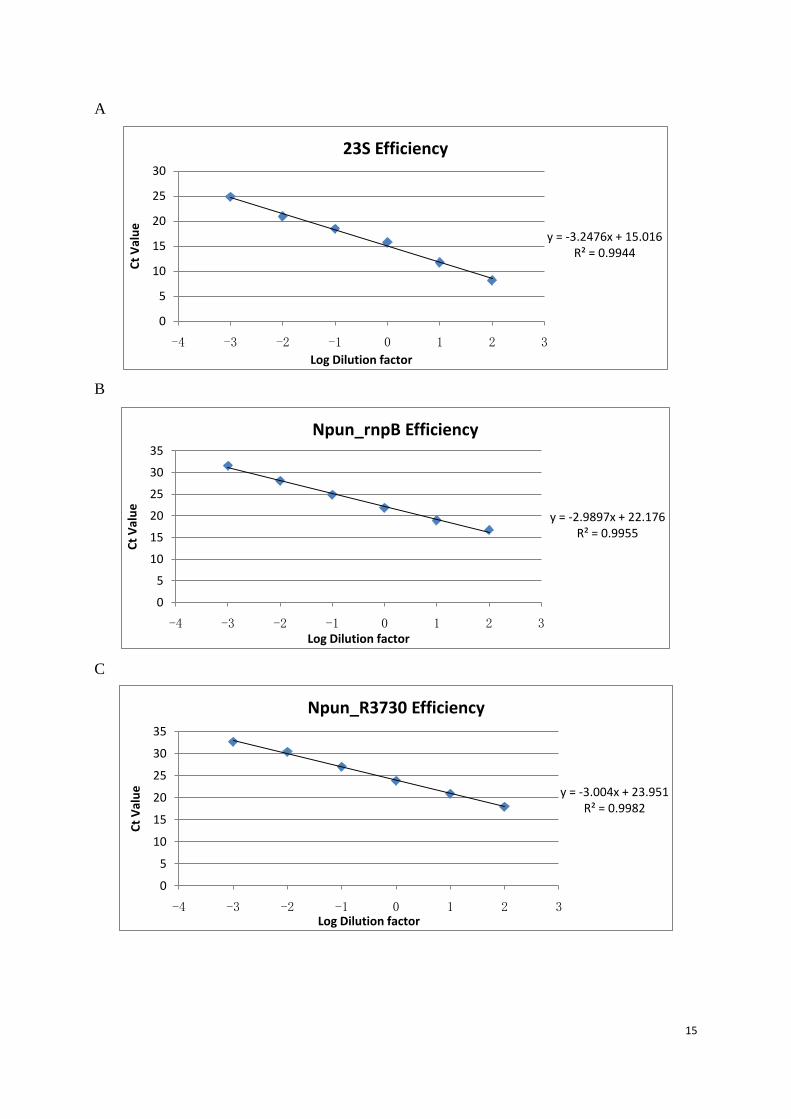
Primers Efficiency test
The primer efficiency refers to the rate at which a PCR amplicon is generated, and is
commonly expressed as a percentage value. The RTq-PCR data analysis method depends on
the efficiency of all the primer pairs. If the primers have 100% efficiency, which means that
the product amount doubled after each cycle or the efficiency of all primers were similar, then
the Comparative Ct Method could be applied to analyze the data.35 In other cases, all the Ct
values should be normalized to weight of PCR product by a standard curve within each
running set.36
The primer efficiency was tested by using a cDNA from none chemical
induced sample at 0 min and made six 10-times dilution series and one none template control.
Each reaction was run with two technical replicates. The Ct values were plotted against the
log scaled concentrations and the regression curve was made to fit each independent data. The
primer test shown the data fit well (R2>0.99) to linear curves.
15
A
B
C
y = -3.2476x + 15.016R² = 0.9944
0
5
10
15
20
25
30
-4 -3 -2 -1 0 1 2 3
Ct V
alue
Log Dilution factor
23S Efficiency
y = -2.9897x + 22.176R² = 0.9955
0
5
10
15
20
25
30
35
-4 -3 -2 -1 0 1 2 3
Ct V
alue
Log Dilution factor
Npun_rnpB Efficiency
y = -3.004x + 23.951R² = 0.9982
0
5
10
15
20
25
30
35
-4 -3 -2 -1 0 1 2 3
Ct V
alue
Log Dilution factor
Npun_R3730 Efficiency
16
D
E
F
y = -2.8197x + 24.909R² = 0.9923
05
10152025303540
-4 -3 -2 -1 0 1 2 3
Ct V
alue
log Dilution factor
Npun_R6212 Efficiency
y = -2.3476x + 28.069R² = 0.9969
00.00
05.00
10.00
15.00
20.00
25.00
30.00
35.00
-1.5 -1 -0.5 0 0.5 1 1.5 2 2.5
Ct V
alue
Log Dilution factor
Npun_R3258 Efficiency
y = -2.9034x + 23.845R² = 0.9989
0
5
10
15
20
25
30
35
-4 -3 -2 -1 0 1 2 3
Ct V
alue
Log Dilution factor
Npun_R5701 Efficiency
17
G
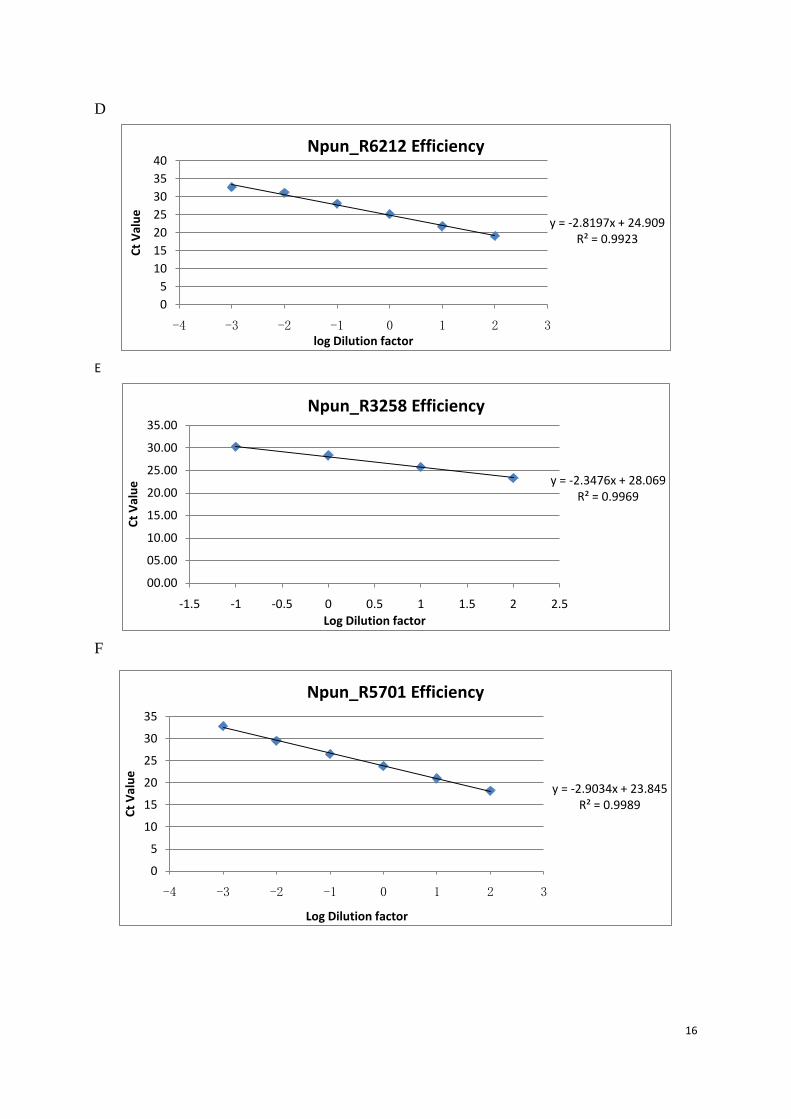
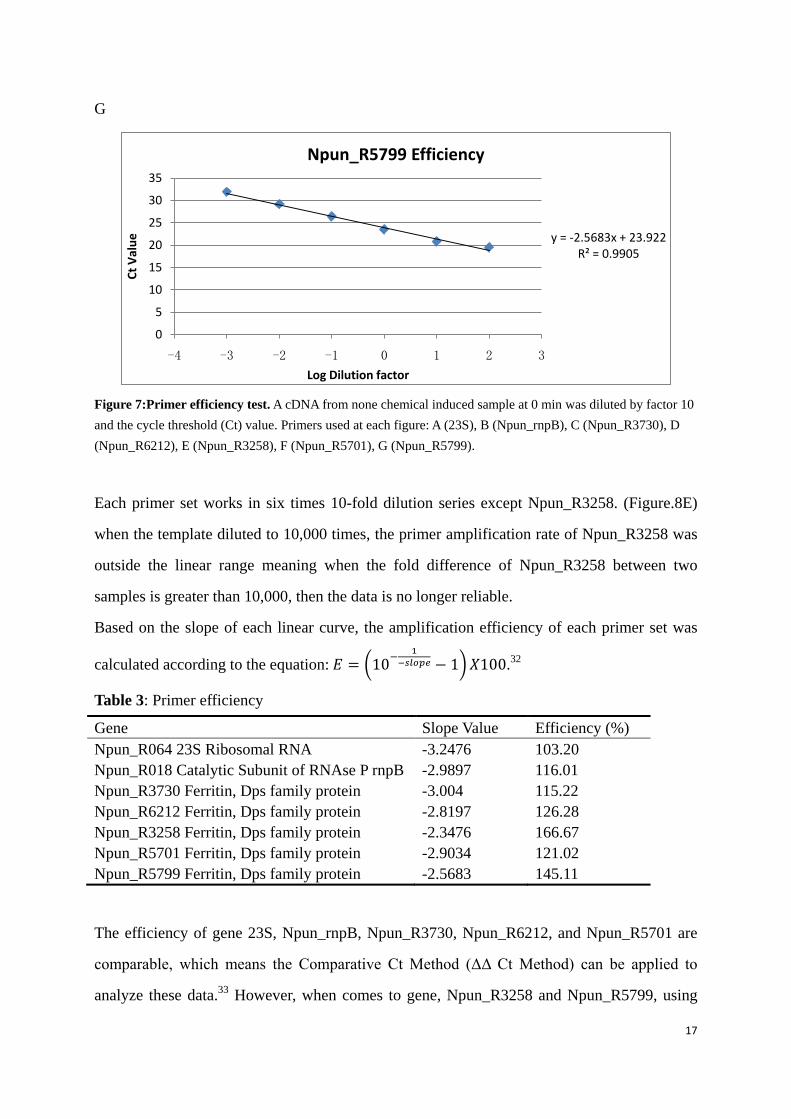
Figure 7:Primer efficiency test. A cDNA from none chemical induced sample at 0 min was diluted by factor 10 and the cycle threshold (Ct) value. Primers used at each figure: A (23S), B (Npun_rnpB), C (Npun_R3730), D (Npun_R6212), E (Npun_R3258), F (Npun_R5701), G (Npun_R5799).
Each primer set works in six times 10-fold dilution series except Npun_R3258. (Figure.8E)
when the template diluted to 10,000 times, the primer amplification rate of Npun_R3258 was
outside the linear range meaning when the fold difference of Npun_R3258 between two
samples is greater than 10,000, then the data is no longer reliable.
Based on the slope of each linear curve, the amplification efficiency of each primer set was
calculated according to the equation: 𝐸 = �10−1
−𝑠𝑙𝑜𝑝𝑒 − 1�𝑋100.32
Table 3: Primer efficiency
Gene Slope Value Efficiency (%) Npun_R064 23S Ribosomal RNA -3.2476 103.20 Npun_R018 Catalytic Subunit of RNAse P rnpB -2.9897 116.01 Npun_R3730 Ferritin, Dps family protein -3.004 115.22 Npun_R6212 Ferritin, Dps family protein -2.8197 126.28 Npun_R3258 Ferritin, Dps family protein -2.3476 166.67 Npun_R5701 Ferritin, Dps family protein -2.9034 121.02 Npun_R5799 Ferritin, Dps family protein -2.5683 145.11
The efficiency of gene 23S, Npun_rnpB, Npun_R3730, Npun_R6212, and Npun_R5701 are
comparable, which means the Comparative Ct Method (ΔΔ Ct Method) can be applied to
analyze these data.33 However, when comes to gene, Npun_R3258 and Npun_R5799, using
y = -2.5683x + 23.922R² = 0.9905
0
5
10
15
20
25
30
35
-4 -3 -2 -1 0 1 2 3
Ct V
alue
Log Dilution factor
Npun_R5799 Efficiency
18
ΔΔ Ct Method may slightly underestimate the transcript level of the two genes. As the
efficiency is much higher than 120%, the PCR reaction is more inhibited than others. So
Npun_R3258 and Npun_R5799 would be more underestimated in samples with higher Ct
value.
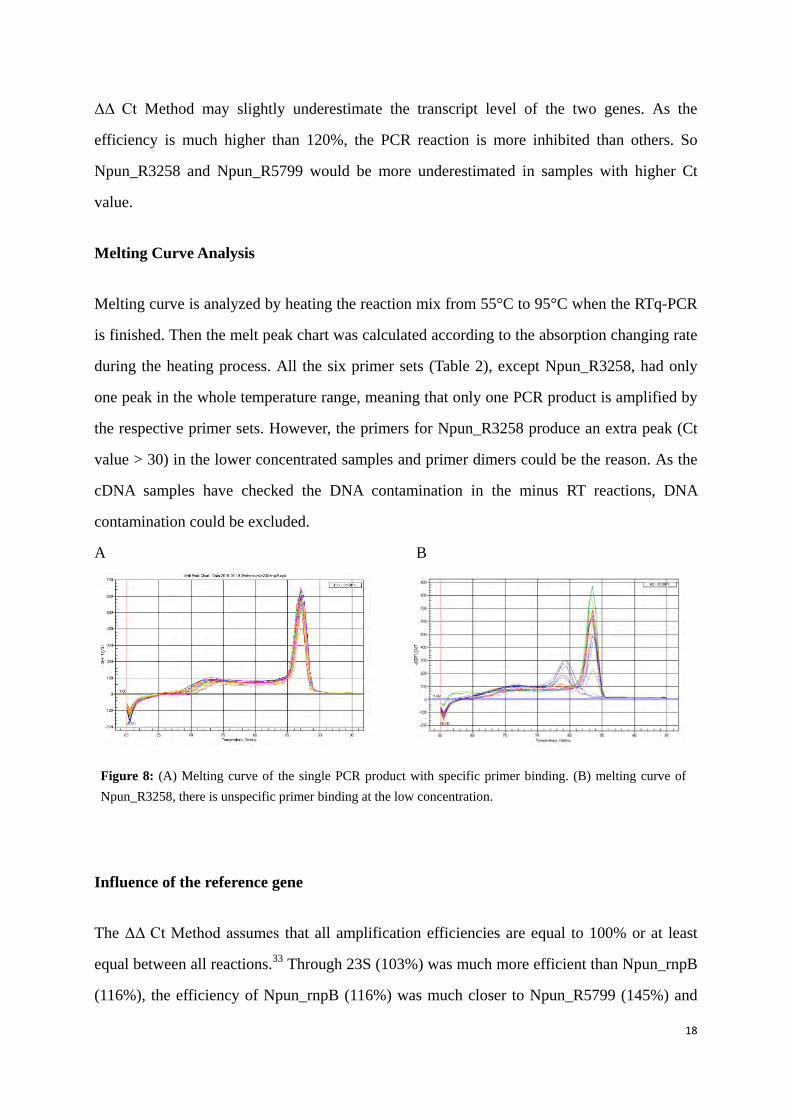
Melting Curve Analysis
Melting curve is analyzed by heating the reaction mix from 55°C to 95°C when the RTq-PCR
is finished. Then the melt peak chart was calculated according to the absorption changing rate
during the heating process. All the six primer sets (Table 2), except Npun_R3258, had only
one peak in the whole temperature range, meaning that only one PCR product is amplified by
the respective primer sets. However, the primers for Npun_R3258 produce an extra peak (Ct
value > 30) in the lower concentrated samples and primer dimers could be the reason. As the
cDNA samples have checked the DNA contamination in the minus RT reactions, DNA
contamination could be excluded.
A B
Influence of the reference gene
The ΔΔ Ct Method assumes that all amplification efficiencies are equal to 100% or at least
equal between all reactions.33 Through 23S (103%) was much more efficient than Npun_rnpB
(116%), the efficiency of Npun_rnpB (116%) was much closer to Npun_R5799 (145%) and
Figure 8: (A) Melting curve of the single PCR product with specific primer binding. (B) melting curve of Npun_R3258, there is unspecific primer binding at the low concentration.
19
Npun_R3258 (166%). Also gene Npun_rnpB (116%) shared most the same amplification
efficiencies with Npun_R5701 (121%), Npun_R3730 (115%) and Npun_R6212 (126%).
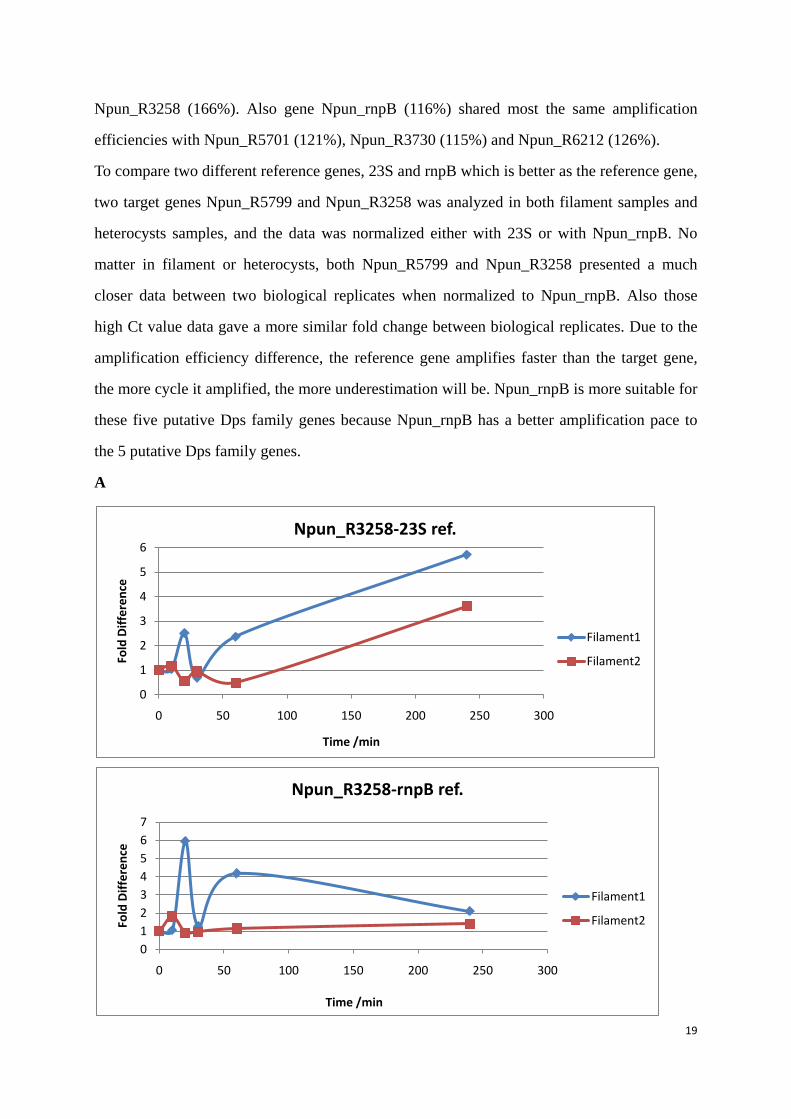
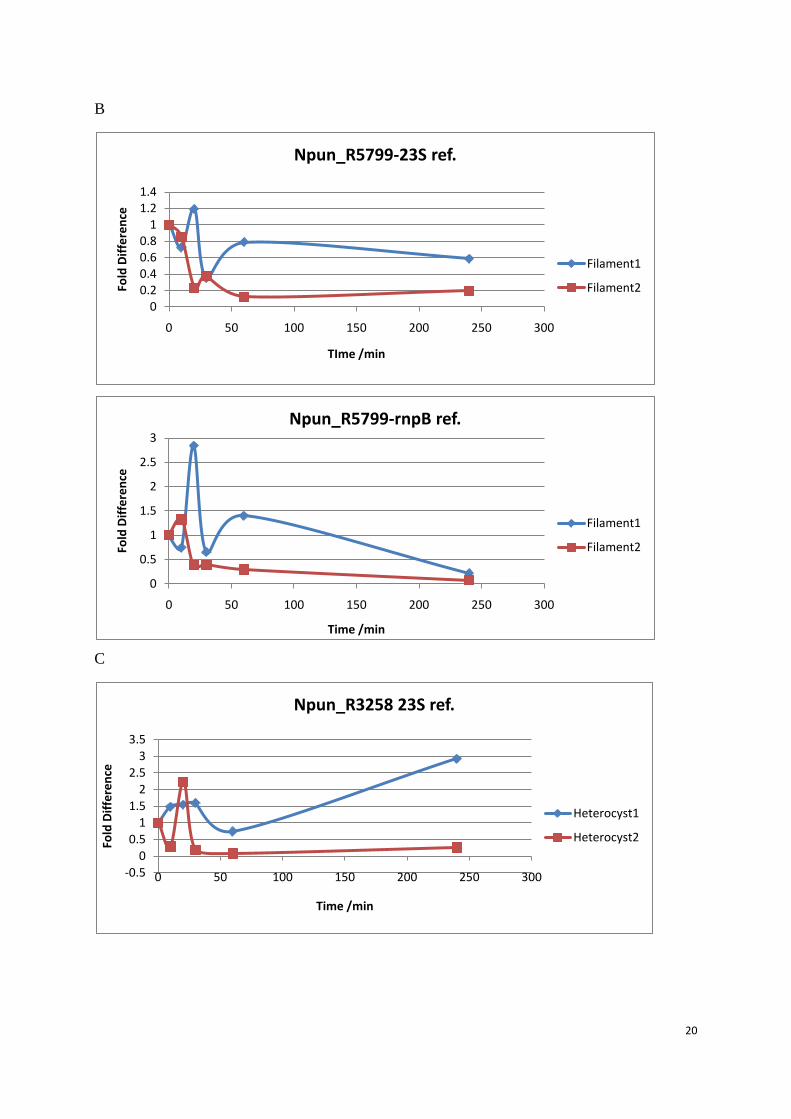
To compare two different reference genes, 23S and rnpB which is better as the reference gene,
two target genes Npun_R5799 and Npun_R3258 was analyzed in both filament samples and
heterocysts samples, and the data was normalized either with 23S or with Npun_rnpB. No
matter in filament or heterocysts, both Npun_R5799 and Npun_R3258 presented a much
closer data between two biological replicates when normalized to Npun_rnpB. Also those
high Ct value data gave a more similar fold change between biological replicates. Due to the
amplification efficiency difference, the reference gene amplifies faster than the target gene,
the more cycle it amplified, the more underestimation will be. Npun_rnpB is more suitable for
these five putative Dps family genes because Npun_rnpB has a better amplification pace to
the 5 putative Dps family genes.
A
0
1
2
3
4
5
6
0 50 100 150 200 250 300
Fold
Diff
eren
ce
Time /min
Npun_R3258-23S ref.
Filament1
Filament2
01234567
0 50 100 150 200 250 300
Fold
Diff
eren
ce
Time /min
Npun_R3258-rnpB ref.
Filament1
Filament2
20
B
C
00.20.40.60.8
11.21.4
0 50 100 150 200 250 300
Fold
Diff
eren
ce
TIme /min
Npun_R5799-23S ref.
Filament1
Filament2
0
0.5
1
1.5
2
2.5
3
0 50 100 150 200 250 300
Fold
Diff
eren
ce
Time /min
Npun_R5799-rnpB ref.
Filament1
Filament2
-0.50
0.51
1.52
2.53
3.5
0 50 100 150 200 250 300
Fold
Diff
eren
ce
Time /min
Npun_R3258 23S ref.
Heterocyst1
Heterocyst2
21
D
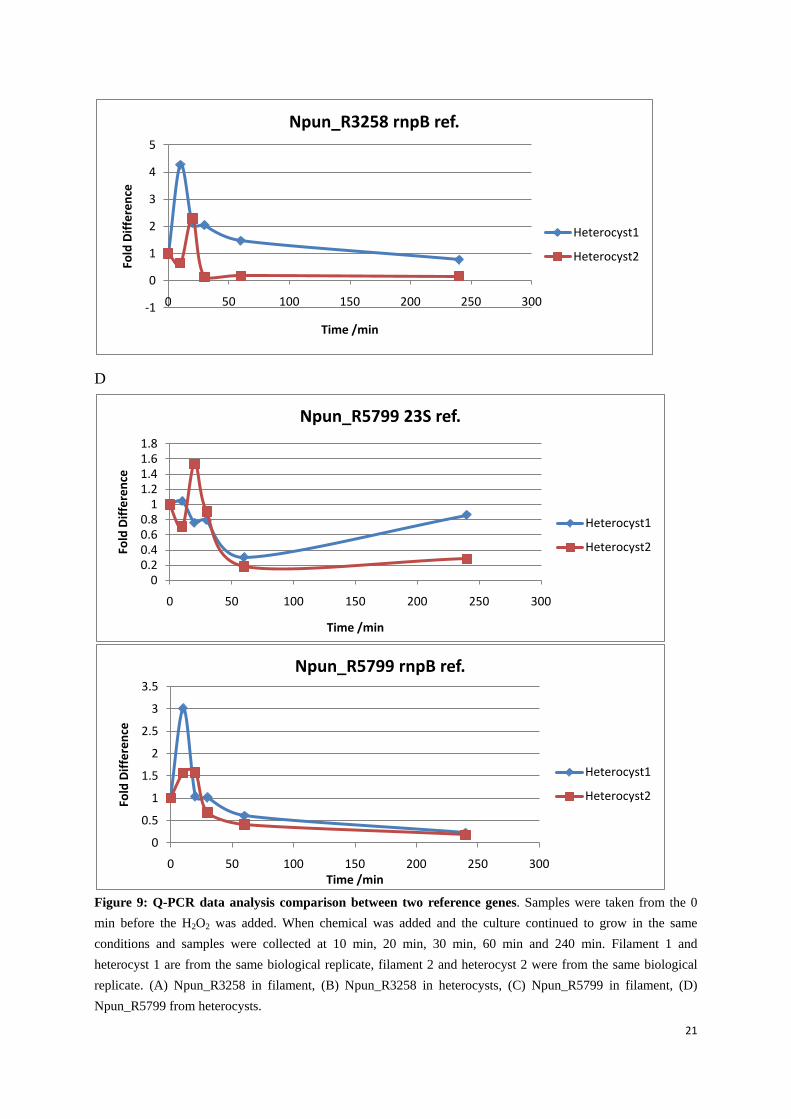
Figure 9: Q-PCR data analysis comparison between two reference genes. Samples were taken from the 0 min before the H2O2 was added. When chemical was added and the culture continued to grow in the same conditions and samples were collected at 10 min, 20 min, 30 min, 60 min and 240 min. Filament 1 and heterocyst 1 are from the same biological replicate, filament 2 and heterocyst 2 were from the same biological replicate. (A) Npun_R3258 in filament, (B) Npun_R3258 in heterocysts, (C) Npun_R5799 in filament, (D) Npun_R5799 from heterocysts.
-1
0
1
2
3
4
5
0 50 100 150 200 250 300
Fold
Diff
eren
ce
Time /min
Npun_R3258 rnpB ref.
Heterocyst1
Heterocyst2
00.20.40.60.8
11.21.41.61.8
0 50 100 150 200 250 300
Fold
Diff
eren
ce
Time /min
Npun_R5799 23S ref.
Heterocyst1
Heterocyst2
0
0.5
1
1.5
2
2.5
3
3.5
0 50 100 150 200 250 300
Fold
Diff
eren
ce
Time /min
Npun_R5799 rnpB ref.
Heterocyst1
Heterocyst2
22
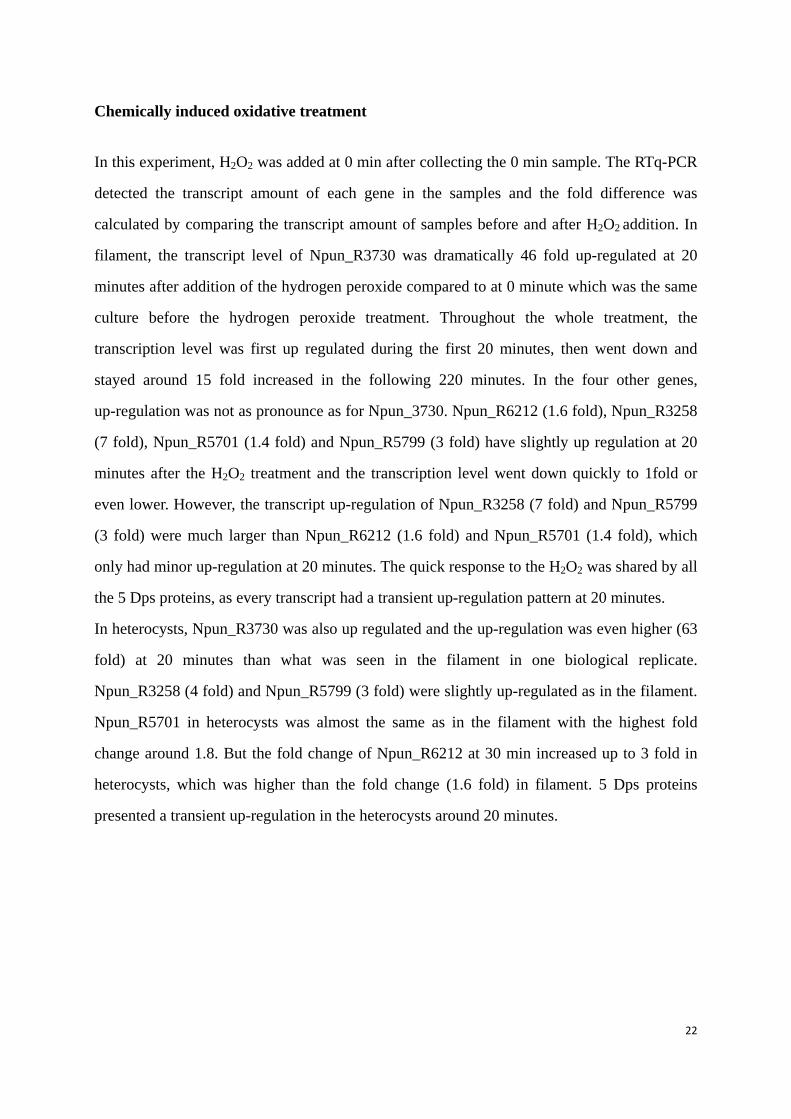
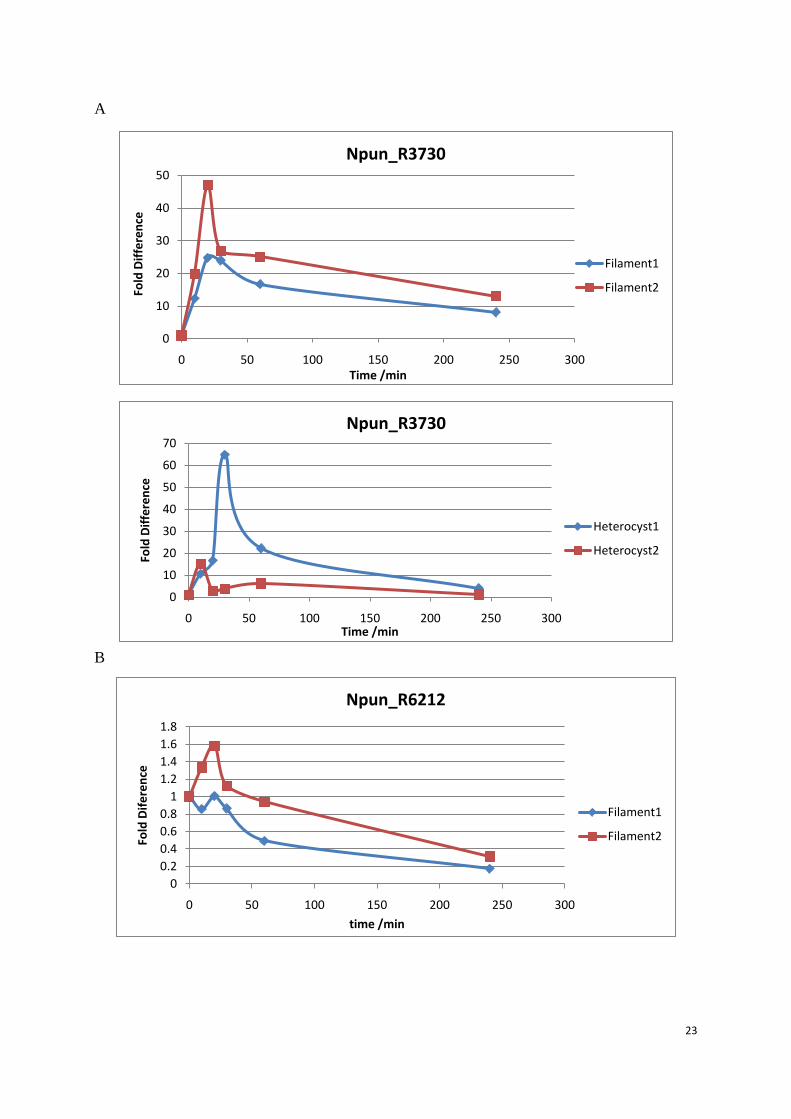
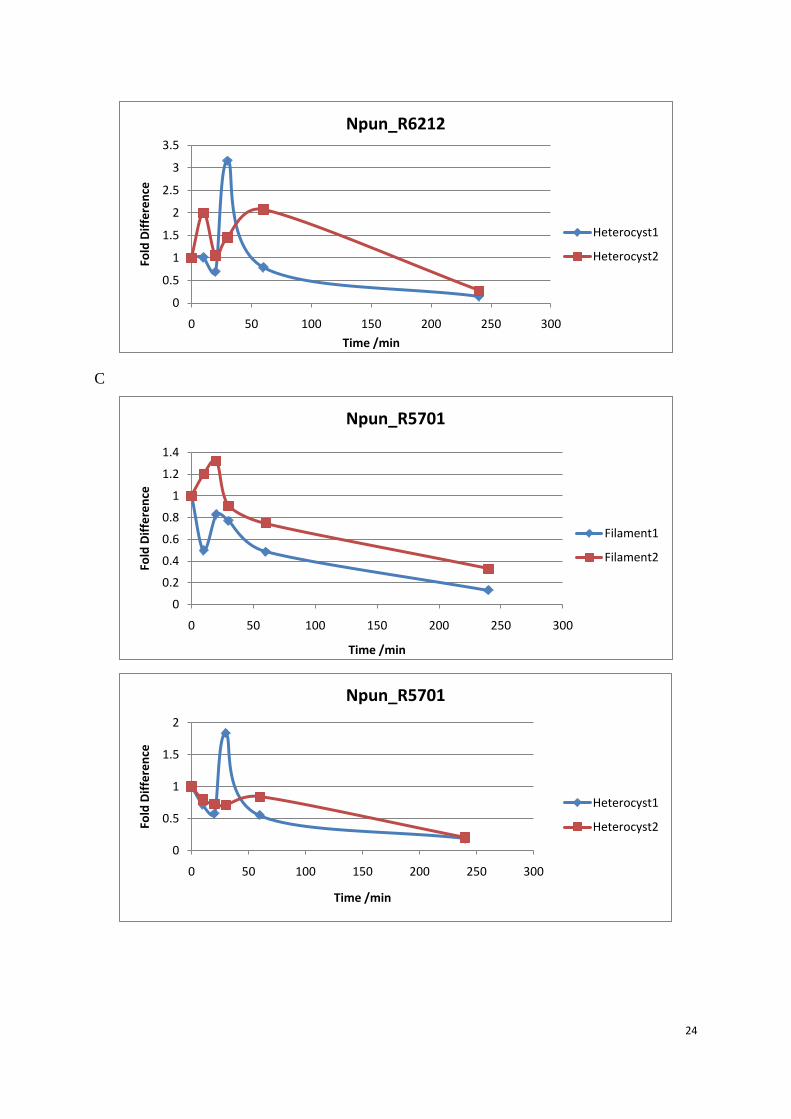
Chemically induced oxidative treatment
In this experiment, H2O2 was added at 0 min after collecting the 0 min sample. The RTq-PCR
detected the transcript amount of each gene in the samples and the fold difference was
calculated by comparing the transcript amount of samples before and after H2O2 addition. In
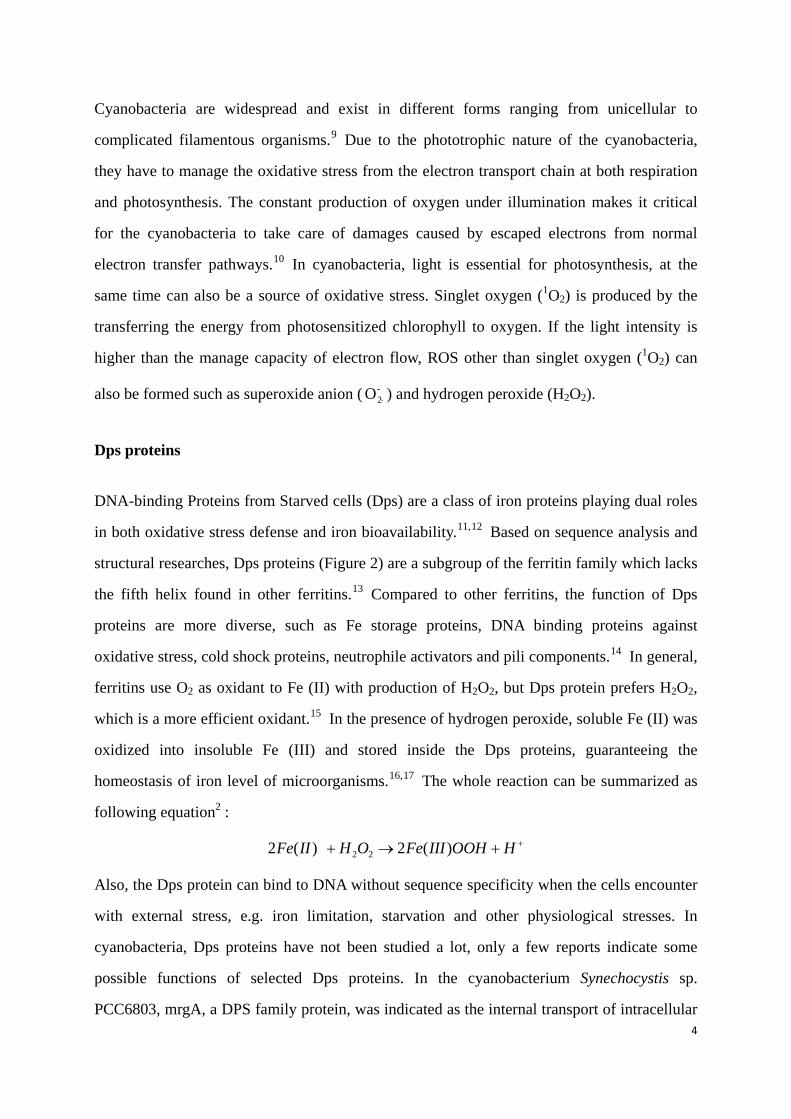
filament, the transcript level of Npun_R3730 was dramatically 46 fold up-regulated at 20
minutes after addition of the hydrogen peroxide compared to at 0 minute which was the same
culture before the hydrogen peroxide treatment. Throughout the whole treatment, the
transcription level was first up regulated during the first 20 minutes, then went down and
stayed around 15 fold increased in the following 220 minutes. In the four other genes,
up-regulation was not as pronounce as for Npun_3730. Npun_R6212 (1.6 fold), Npun_R3258
(7 fold), Npun_R5701 (1.4 fold) and Npun_R5799 (3 fold) have slightly up regulation at 20
minutes after the H2O2 treatment and the transcription level went down quickly to 1fold or
even lower. However, the transcript up-regulation of Npun_R3258 (7 fold) and Npun_R5799
(3 fold) were much larger than Npun_R6212 (1.6 fold) and Npun_R5701 (1.4 fold), which
only had minor up-regulation at 20 minutes. The quick response to the H2O2 was shared by all
the 5 Dps proteins, as every transcript had a transient up-regulation pattern at 20 minutes.
In heterocysts, Npun_R3730 was also up regulated and the up-regulation was even higher (63
fold) at 20 minutes than what was seen in the filament in one biological replicate.
Npun_R3258 (4 fold) and Npun_R5799 (3 fold) were slightly up-regulated as in the filament.
Npun_R5701 in heterocysts was almost the same as in the filament with the highest fold
change around 1.8. But the fold change of Npun_R6212 at 30 min increased up to 3 fold in
heterocysts, which was higher than the fold change (1.6 fold) in filament. 5 Dps proteins
presented a transient up-regulation in the heterocysts around 20 minutes.
23
A
B
0
10
20
30
40
50
0 50 100 150 200 250 300
Fold
Diff
eren
ce
Time /min
Npun_R3730
Filament1
Filament2
00.20.40.60.8
11.21.41.61.8
0 50 100 150 200 250 300
Fold
Dife
renc
e
time /min
Npun_R6212
Filament1
Filament2
0
10
20
30
40
50
60
70
0 50 100 150 200 250 300
Fold
Diff
eren
ce
Time /min
Npun_R3730
Heterocyst1
Heterocyst2
24
C
0
0.5
1
1.5
2
2.5
3
3.5
0 50 100 150 200 250 300
Fold
Diff
eren
ce
Time /min
Npun_R6212
Heterocyst1
Heterocyst2
0
0.2
0.4
0.6
0.8
1
1.2
1.4
0 50 100 150 200 250 300
Fold
Diff
eren
ce
Time /min
Npun_R5701
Filament1
Filament2
0
0.5
1
1.5
2
0 50 100 150 200 250 300
Fold
Diff
eren
ce
Time /min
Npun_R5701
Heterocyst1
Heterocyst2
25
D
E
0
1
2
3
4
5
6
7
0 50 100 150 200 250 300
Fold
Diff
eren
ce
Time /min
Npun_R3258
Filament1
Filament2
-0.50
0.51
1.52
2.53
3.54
4.5
0 50 100 150 200 250 300
Fold
Diff
eren
ce
Time /min
Npun_R3258
Heterocyst1
Heterocyst2
0
0.5
1
1.5
2
2.5
3
0 50 100 150 200 250 300
Fold
Diff
eren
ce
Time /min
Npun_R5799
Filament1
Filament2
26
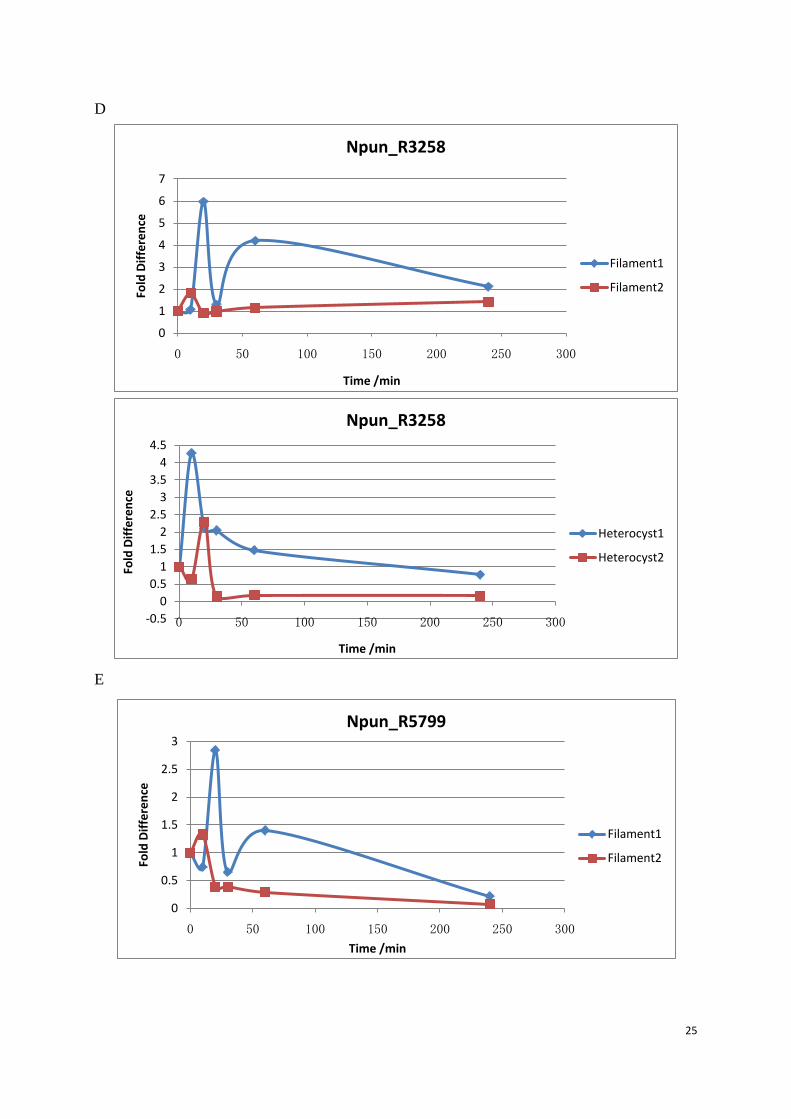
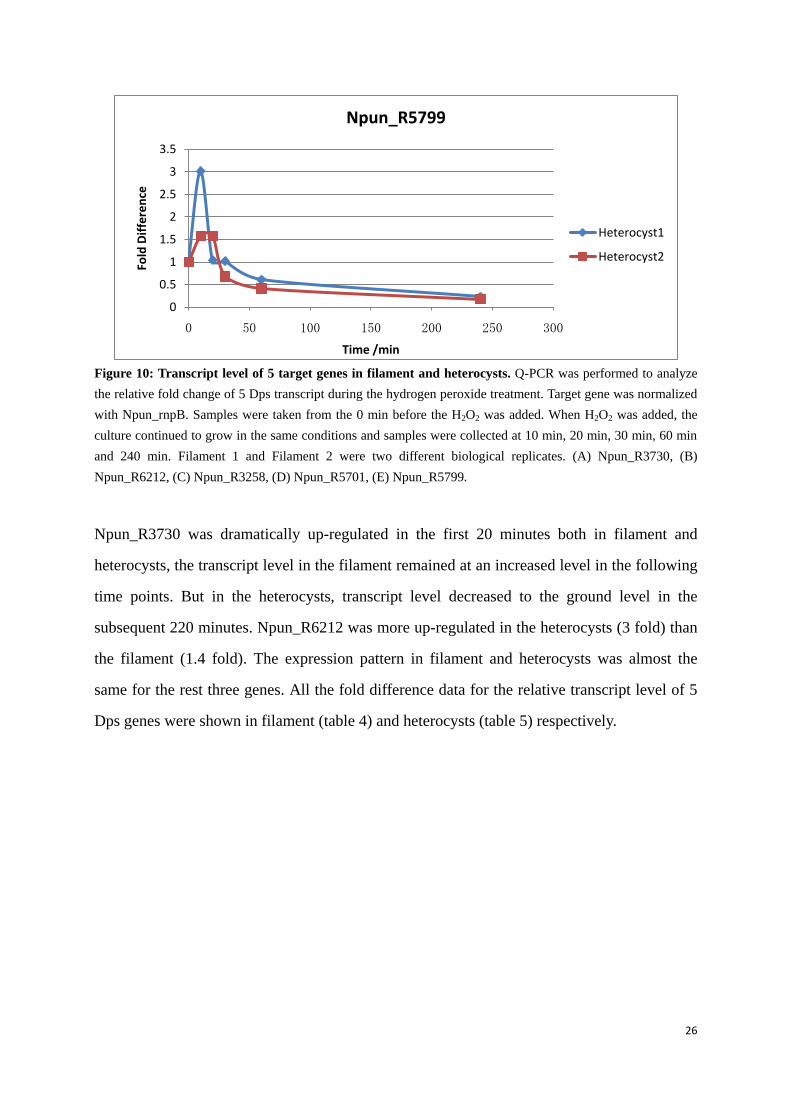
Figure 10: Transcript level of 5 target genes in filament and heterocysts. Q-PCR was performed to analyze the relative fold change of 5 Dps transcript during the hydrogen peroxide treatment. Target gene was normalized with Npun_rnpB. Samples were taken from the 0 min before the H2O2 was added. When H2O2 was added, the culture continued to grow in the same conditions and samples were collected at 10 min, 20 min, 30 min, 60 min and 240 min. Filament 1 and Filament 2 were two different biological replicates. (A) Npun_R3730, (B) Npun_R6212, (C) Npun_R3258, (D) Npun_R5701, (E) Npun_R5799.
Npun_R3730 was dramatically up-regulated in the first 20 minutes both in filament and
heterocysts, the transcript level in the filament remained at an increased level in the following
time points. But in the heterocysts, transcript level decreased to the ground level in the
subsequent 220 minutes. Npun_R6212 was more up-regulated in the heterocysts (3 fold) than
the filament (1.4 fold). The expression pattern in filament and heterocysts was almost the
same for the rest three genes. All the fold difference data for the relative transcript level of 5
Dps genes were shown in filament (table 4) and heterocysts (table 5) respectively.
0
0.5
1
1.5
2
2.5
3
3.5
0 50 100 150 200 250 300
Fold
Diff
eren
ce
Time /min
Npun_R5799
Heterocyst1
Heterocyst2
27
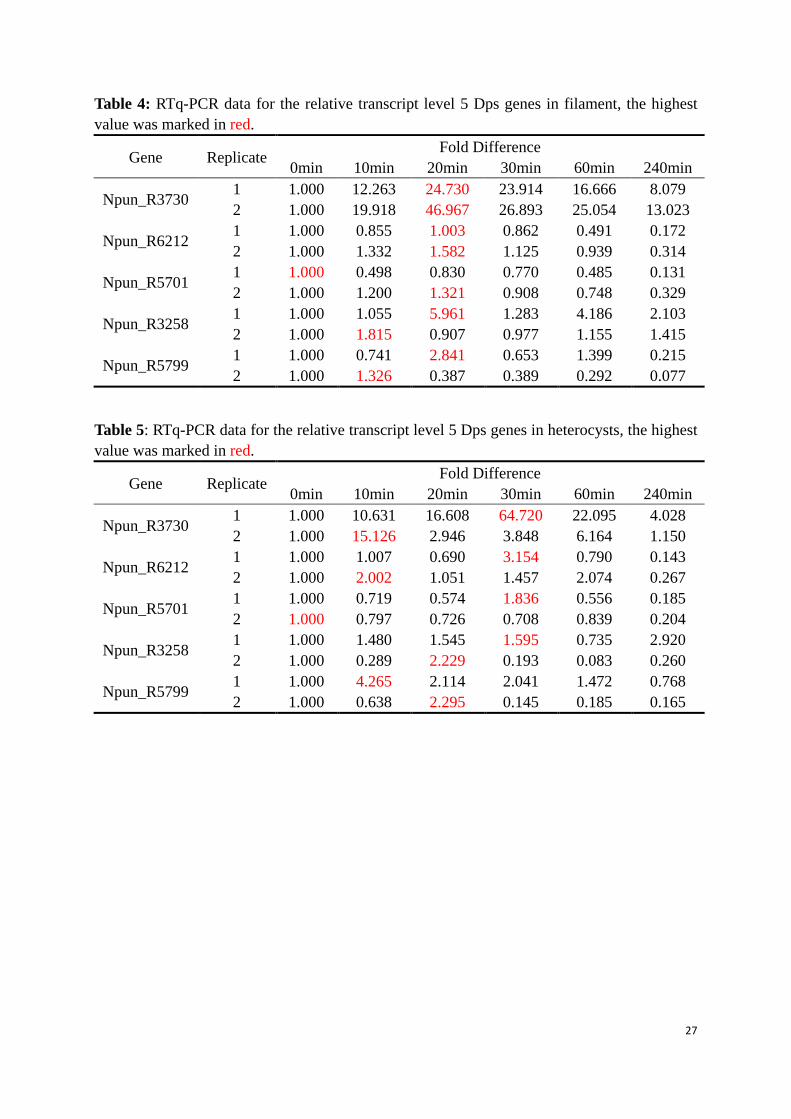
Table 4: RTq-PCR data for the relative transcript level 5 Dps genes in filament, the highest value was marked in red.
Gene Replicate Fold Difference 0min 10min 20min 30min 60min 240min
Npun_R3730 1 1.000 12.263 24.730 23.914 16.666 8.079 2 1.000 19.918 46.967 26.893 25.054 13.023
Npun_R6212 1 1.000 0.855 1.003 0.862 0.491 0.172 2 1.000 1.332 1.582 1.125 0.939 0.314
Npun_R5701 1 1.000 0.498 0.830 0.770 0.485 0.131 2 1.000 1.200 1.321 0.908 0.748 0.329
Npun_R3258 1 1.000 1.055 5.961 1.283 4.186 2.103 2 1.000 1.815 0.907 0.977 1.155 1.415
Npun_R5799 1 1.000 0.741 2.841 0.653 1.399 0.215 2 1.000 1.326 0.387 0.389 0.292 0.077
Table 5: RTq-PCR data for the relative transcript level 5 Dps genes in heterocysts, the highest value was marked in red.
Gene Replicate Fold Difference 0min 10min 20min 30min 60min 240min
Npun_R3730 1 1.000 10.631 16.608 64.720 22.095 4.028 2 1.000 15.126 2.946 3.848 6.164 1.150
Npun_R6212 1 1.000 1.007 0.690 3.154 0.790 0.143 2 1.000 2.002 1.051 1.457 2.074 0.267
Npun_R5701 1 1.000 0.719 0.574 1.836 0.556 0.185 2 1.000 0.797 0.726 0.708 0.839 0.204
Npun_R3258 1 1.000 1.480 1.545 1.595 0.735 2.920 2 1.000 0.289 2.229 0.193 0.083 0.260
Npun_R5799 1 1.000 4.265 2.114 2.041 1.472 0.768 2 1.000 0.638 2.295 0.145 0.185 0.165
28
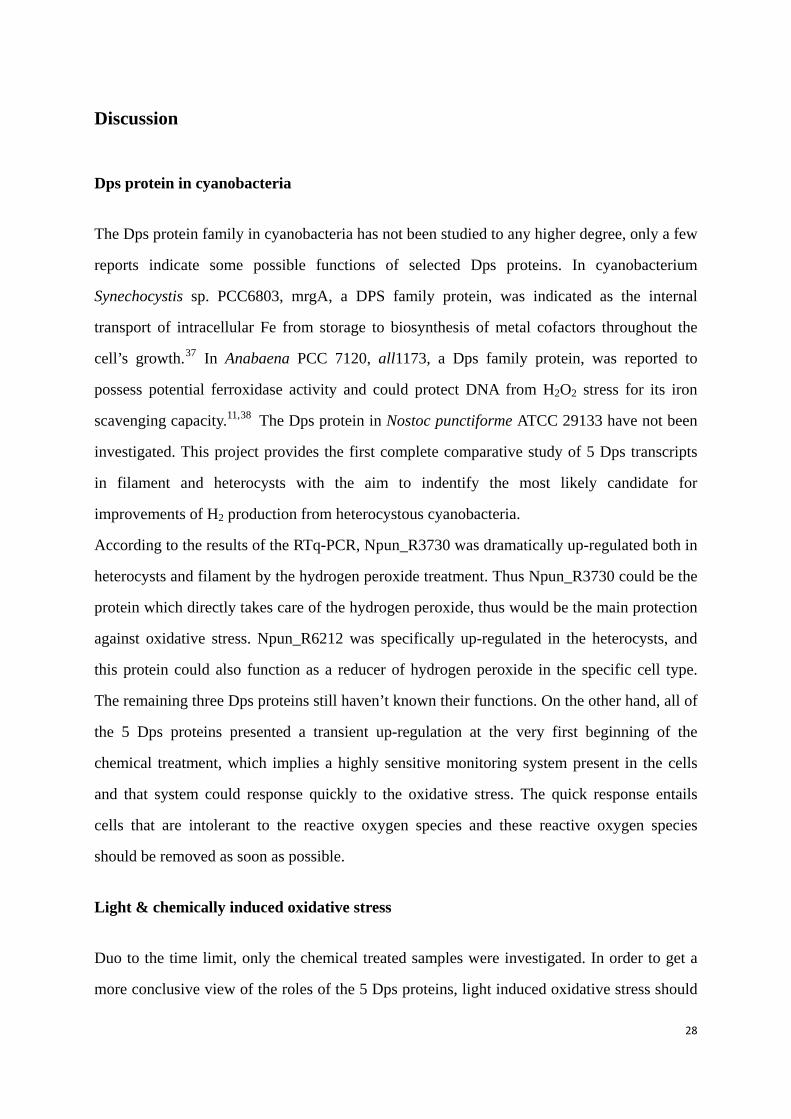
Discussion
Dps protein in cyanobacteria
The Dps protein family in cyanobacteria has not been studied to any higher degree, only a few
reports indicate some possible functions of selected Dps proteins. In cyanobacterium
Synechocystis sp. PCC6803, mrgA, a DPS family protein, was indicated as the internal
transport of intracellular Fe from storage to biosynthesis of metal cofactors throughout the
cell’s growth.37 In Anabaena PCC 7120, all1173, a Dps family protein, was reported to
possess potential ferroxidase activity and could protect DNA from H2O2 stress for its iron
scavenging capacity.11,38
According to the results of the RTq-PCR, Npun_R3730 was dramatically up-regulated both in
heterocysts and filament by the hydrogen peroxide treatment. Thus Npun_R3730 could be the
protein which directly takes care of the hydrogen peroxide, thus would be the main protection
against oxidative stress. Npun_R6212 was specifically up-regulated in the heterocysts, and
this protein could also function as a reducer of hydrogen peroxide in the specific cell type.
The remaining three Dps proteins still haven’t known their functions. On the other hand, all of
the 5 Dps proteins presented a transient up-regulation at the very first beginning of the
chemical treatment, which implies a highly sensitive monitoring system present in the cells
and that system could response quickly to the oxidative stress. The quick response entails
cells that are intolerant to the reactive oxygen species and these reactive oxygen species
should be removed as soon as possible.
The Dps protein in Nostoc punctiforme ATCC 29133 have not been
investigated. This project provides the first complete comparative study of 5 Dps transcripts
in filament and heterocysts with the aim to indentify the most likely candidate for
improvements of H2 production from heterocystous cyanobacteria.
Light & chemically induced oxidative stress
Duo to the time limit, only the chemical treated samples were investigated. In order to get a
more conclusive view of the roles of the 5 Dps proteins, light induced oxidative stress should
29
also be investigated. As the cell response to chemically induced oxidative stress is more
artificial than the light induced oxidative stress. The oxidative chemical has to pass through
the cell membrane before it has effect. The cell envelope (cell wall and membranes) of
heterocysts is thicker than the vegetative cells in the filament and may possess different
physiological properties, the diffusion rate of hydrogen peroxide in two kinds of cell
membranes is not clear. However, in the light induced oxidative stress, more electrons are
produced in the photosystem by increasing the light density, which means more electrons
leave the transport pathway and captured by the di-radical O2. The total amount of all the
reactive oxygen species (ROS) is increased. On the other hand, in the chemical induced stress,
only the level of H2O2 amount increases. Although it is reported that Dps only takes care of
the hydrogen peroxide, the transcript level of Dps proteins could also be affected by the
presence of other ROS. Also, in the light induced oxidative stress, H2O2 is produced with the
presence of light lasting for a longer time and not as in our experiment, H2O2 is only present
for a short time after the adding of chemical.
Variations between biological replicates
In the RTq-PCR data, the two biological replicates have the similar trends, but the data at each
time point varies a lot between the two biological replicates. As the cell response to the
external hydrogen peroxide was very quick, the small time difference of the sample taking
will make the data vary a lot. Even if it is possible to add chemicals into two biological
replicates simultaneously, collecting the sample at the same time point is also impossible due
to the handling. Collecting samples one by one with the same time intervals is more practical.
Moreover, when samples were collected, the cells were still in the chemicals treatment before
removing the media through centrifugation. So the quick and accurate handling is necessary
to have identical biological replicates. Considering the cell response to chemical induced
oxidative stress mainly happens in the first 30 min, more sampling time points are needed to
achieve a more precise transcript changes.
30
RNA quality
RNA quality is crucial for the success of RTq-PCR. A good RNA sample should be little or
even not degraded. RNA is single strand and fragile, also RNase is everywhere in the lab. So
to obtain a high quality of RNA sample, every step should be done on ice, gloves should not
be contaminated during the procedure and handling should be as quick as possible. RNA
quality can be checked by ExperionTM RNA StdSens Analysis Kit (Bio-Rad, California, USA)
see whether the rRNA peaks are separated or not. To the RNA quality could be also checked
by agarose gel and visualized by thiazole orange. A high quality of RNA sample should have
three bright bands without smearing background. As TRIzol is used to extract RNA, DNA
contamination cannot be avoided. After the DNase I treatment, minus RT and standard PCR
should be done to exclude the presence of genomic DNA in the cDNA sample.
Primer efficiency of RTq-PCR
The amplification efficiency of the Q-PCR primers is also important when analyzing the data
with ΔΔ Ct Method. As the ΔΔ Ct Method relies on normalizing the target gene to the
reference gene to determine the fold changes between each sample to overcome the pipetting
and other handling errors, because the reference gene expresses constantly in all conditions.
The primers efficiency depends on the specificity of primers.
100% of the primer efficiency means a doubling of product in each PCR cycle. If the primer
efficiency is not 100% or at least equal to each other, target gene and the reference gene
amplifies at different rates, the ratio between the target gene and the reference gene changes
with the amplification cycle increases, that will underestimate or overestimate the target gene.
In this study, three target genes and a reference gene have almost the same amplification
efficiency, meaning the data of these three genes are reliable when analyzing with the ΔΔ Ct
Method. However, the efficiency of Npun_R3258 and Npun_R5799 are larger than the
reference gene. The target gene amplifies slower than reference gene, which implies the target
gene is somehow underestimated. Another data analysis is Relative Standard Curve Method
which is based on the normalization to the standard curve. The Ct value is converted into the
product weight according to the standard curve to overcome the different amplification
31
efficiency. Then the ratio is calculated by dividing the target gene product weight with the
reference gene product weight. The fold difference between untreated samples and treated
samples could be calculated based on the equation:
referencetargetsample untreated
referencetargetsample treated
difference Fold=
== .32 In that case, each Q-PCR plate should
include the dilution series to calculate the standard curve for each Q-PCR run set. It is
laboring and wasting reagent when scanning plenty of genes.
Conclusion
In general, the Dps genes expression is induced by H2O2 and the five different genes are
differently transcripted in filament and heterocysts. In the H2O2 treatment, Npun_R6212 is
more up-regulated in heterocysts than in the filament and Npun_R3730 is dramatically
up-regulated in both filament and heterocysts, these two genes should be investigated further
to find out the potential to increase the bio-H2 production in cyanobacteria.
32
Outlook
To get an overview of the transcription level of the five putative Dps proteins under oxidative
stress, the light induced oxidative stress samples should be investigated. As the light induced
stress mainly exists in the filament in where the photosynthesis takes place. That’s more
similar to the natural situation when cyanobacteria producing hydrogen. In addition the
reactive oxygen species is produced from respiration and photosynthesis, rather than obtained
from external environment.
The protein level of the five putative Dps proteins under oxidative stress should also be
studied. Since the transcript level changes does not mean the protein level also changes. These
5 putative Dps genes only function when they are translated into proteins. Transcript studies
could reflect the gene regulation, but only protein level alteration could confirm the activity of
Dps protein in handling the oxidative stress.
The transcript level of Npun_R3730 and Npun_R6212 are more influenced in the chemical
treatment. Combing with the results from the light induced oxidative stress, over-expressing
some Dps family protein in NHM539
, the uptake hydrogenase deficient mutant of Nostoc
punctiforme ATCC 29133, then how the Dps expression level change effect the hydrogen
production could be investigated, that might be of importance for a future biotech approach to
increase the production of bio-H2 from cyanobacteria.

33
Acknowledgement
The work presented in this thesis was carried out at the Department of Photochemistry and
Molecular Science, Uppsala University. I would like to thank my supervisor Karin Stensjö for
all her training, advice and support. I learned a lot from her from the very basic part of science
to how to be a scientist. Also I want to thank Paulo Oliveira, Marie Holmqvist, Ellenor
Devine, Pia Lindberg and other cyano members for their patience, advice and fruitful
discussions.
34
Reference
1 Brocks JJ, Logan GA, Buick R & Summons RE (1999) Achaean molecular fossils and the early rise of
eukaryotes. Science 285:1033–1036
2 Latifi A, Ruiz M, Zhang CC (2008) Oxidative stress in cyanobacteria. FEMS Microbiol Rev. 2009;
33(2):258-78.
3 Imlay JA (2003) Pathways of oxidative damage. Annu Rev Microbiol 57: 395–418
4 Barber J, Andersson B (1992) Too much of a good thing: light can be bad for photosynthesis. Trends in
Biochemical Science 17: 61–66.
5 Anderson JM, Chow WS, Park Y-I (1995) The grand design of photosynthesis: acclimation of the
photosynthetic apparatus to environmental cues. Photosynthesis Research 46: 129–139.
6 Regelsberger G, Jakopitsch C, Plasser L, Schwaiger H, Furtmu¨ ller PG, Peschek GA, Zamocky M, Obinger
C ( 2002) Occurrence and biochemistry of hydroperoxidases in oxygenic phototrophic prokaryotes
(cyanobacteria). Plant Physiology and Biochemistry 40: 479–490.
7 Dietz KJ, Stork T, Finkemeier I, Lamkemeyer P, Li WX, El-Tayeb MA, Michel KP, Pistorius EK, Baier M
(2005) The role of peroxiredoxins in oxygenic photosynthesis of cyanobacteria and higher plants: peroxide
detoxification or redox sensing? In: Demmig-Adams B, Adams W, Mattoo A, eds. Photoprotection,
photoinhibition, and environment. Dordrecht, New York, London: Kluwer Academic Press.
8 Giorgio M, Trinei M, Migliaccio E & Pelicci PG (2007) Hydrogen peroxide: a metabolic by-product or a
common mediator of ageing signals? Nat Rev Mol Cell Biol 9: 722–728.
9 Stanier RY & Cohen-Bazire G (1977) Phototrophic prokaryotes: the cyanobacteria. Annu Rev Microbiol 31:
225–274
10 Nishiyama Y, Allakhverdiev SI & Murata N (2006) A new paradigm for the action of oxygen species in the
photoinhibition of photosystem II. Biochm Biophy Acta 1757:742–749.
11 Wei X, Mingjia H, Xiufeng L, Yang G, Qingyu W (2007) Identification and biochemical properties of Dps
(starvation-induced DNA binding protein) from cyanobacterium Anabaena sp. PCC 7120.IUBMB Life
59(10):675-81
12 Narayan OP, Kumari N, Rai LC (2010) Heterologous expression of Anabaena PCC 7120 all3940 (a Dps
family gene) protects Escherichia coli from nutrient limitation and abiotic stresses. Biochem Biophys Res
Commun 394(1):163-9
13 Stork T, Michel KP, Pistorius EK, Dietz KJ 92005) Bioinformatic analysis of the genomes of the
cyanobacteria Synechocystis sp. PCC 6803 and Synechococcus elongatus PCC 7942 for the presence of
peroxiredoxins and their transcript regulation under stress. J Exp Bot 56(422):3193-206
14 Shcolnick S, Shaked Y, Keren N (2007) A role for mrgA, a DPS family protein, in the internal transport of
Fe in the cyanobacterium Synechocystis sp. PCC6803. Biochim Biophys Acta 1767(6):814-9
15 Chiancone E, Ceci P (2010) The multifaceted capacity of Dps proteins to combat bacterial stress conditions:
Detoxification of iron and hydrogen peroxide and DNA binding, Biochim. Biophys. Acta, oi:10.1016
16 Pulliainen AT, Kauko A, Haataja S, Papageorgiou AC, Finne J (2005) Dps/Dpr ferritin-like protein: insights
35
into the mechanism of iron incorporation and evidence for a central role in cellular iron homeostasis in
Streptococcus suis. Mol Microbiol 57(4):1086-100.
17 Shigeoka S, Ishikawa T, Tamoi M, Miyagawa Y, Takeda T, Yabuta Y & Yoshimura K (2002) Regulation
and function of ascorbate peroxidase isoenzymes. J Exp Bot 53: 1305–1319
18Kauko A, Haataja S, Pulliainen AT, Finne J, Papageorgiou AC (2004) Crystal structure of Streptococcus suis
Dps-like peroxide resistance protein Dpr: implications for iron incorporation. J Mol Biol. 338(3):547-58.
19 Levin DB, Lawrence P & Murry L (2004) Biohydrogen production: prospects and limitations to practical
application. Int J Hydrogen Energy 29: 173–185.
20 Tamagnini P, Leitão E, Oliveira P, Ferreira D, Pinto F, Harris DJ, Heidorn T, Lindblad P (2007)
Cyanobacterial hydrogenases: diversity, regulation and applications. FEMS Microbiol Rev. 31(6):692-720
21 Prince RC & Kheshgi HS (2005) The photobiological production of hydrogen: potential efficiency and
effectiveness as a renewable fuel. Crit Rev Microbiol 31: 19–31.
22 Eady RR (1996) Structure–function relationships of alternative nitrogenases. Chem Rev 96: 3013–3030.
23 Rees DC, Akif Tezcan F, Haynes CA, Walton MY, Andrade S, Einsle O & Howard JB (2005) Structural
basis of biological nitrogen fixation. Philos Trans A Math Phys Eng Sci 363: 971–984.
24 Lindberg P (2003) Cyanobacterial hydrogen metabolism – uptake hydrogenase and hydrogen production
by nitrogenase in filamentous cyanobacteria. PhD Thesis, Faculty of Science and Technology, Uppsala
University, Sweden (ISBN 91-554-5708-8).
25 Llama MJ, Serra JL, Rao KK & Hall DO (1979) Isolation and characterization of the hydrogenase activity
from the nonheterocystous cyanobacterium Spirulina maxima. FEBS Lett 98: 342–346.
26 Facey PD, Hitchings MD, Saavedra-Garcia P, Fernandez-Martinez L, Dyson PJ, Del Sol R (2009)
Streptomyces coelicolor Dps-like proteins: differential dual roles in response to stress during vegetative
growth and in nucleoid condensation during reproductive cell division. Mol Microbiol. 73(6):1186-202.
27 Ow SY, Noirel J, Cardona T, Taton A, Lindblad P, Stensjö K, Wright PC (2009) Quantitative overview of
N2 fixation in Nostoc punctiforme ATCC 29133 through cellular enrichments and iTRAQ shotgun proteomics.
J Proteome Res 8(1):187-98.
28 Muro-Pastor, A. M., Valladares, A., Flores, E., and Herrero, A. (1999) The hetC gene is a direct target of the
NtcA transcriptional regulator in cyanobacterial heterocyst development. J. Bacteriol. 181: 6664 – 6669.
29 Razquin, P, Fillat, M F, Schmitz, S, Stricker, O, Bohme, H, Gomez-Moreno C, Peleato M L, (1996)
Expression of ferredoxin-NADP+ reductase in heterocysts from Anabaena sp. Biochem. J. 316 (Pt. 1):
157–160.
30 http://www.bioinformatics.nl/cgi-bin/primer3plus/primer3plus.cgi
31 Nolan T, Hands RE, Bustin SA. (2006) Quantification of mRNA using real-time RT-PCR. Nat Protoc.
1(3):1559-82.
32 Guide to Performing Relative Quantitation of Gene Expression Using Real-Time Quantitative PCR. (2008)
Applied Biosystems
33 Livak KJ, Schmittgen TD (2001) Analysis of relative gene expression data using real-time quantitative
PCR and the 2(-Delta Delta C(T)) Method. Methods. 25(4):402-8.
34 http://www.ebi.ac.uk/Tools/clustalw2/index.html?
35 Karlen Y, McNair A, Perseguers S, Mazza C, Mermod N (2007) Statistical significance of quantitative PCR.
36
BMC Bioinformatics. 8:131.
36 Pfaffl MW. (2001) A new mathematical model for relative quantification in real-time RT-PCR. Nucleic
Acids Res;29(9):e45.
37 Shcolnick S, Shaked Y, Keren N. (2007) A role for mrgA, a DPS family protein, in the internal transport of
Fe in the cyanobacterium Synechocystis sp. PCC6803. Biochim Biophys Acta. 1767(6):814-9
38 Narayan OP, Kumari N, Rai LC (2007) Heterologous expression of Anabaena PCC 7120 all3940 (a Dps
family gene) protects Escherichia coli from nutrient limitation and abiotic stresses. Biochem Biophys Res
Commun. 394(1):163-9
39 Lindberg P, Lindblad P, Cournac L. (2004) Gas exchange in the filamentous cyanobacterium Nostoc
punctiforme strain ATCC 29133 and Its hydrogenase-deficient mutant strain NHM5. Appl Environ Microbiol.
70(4):2137-45.
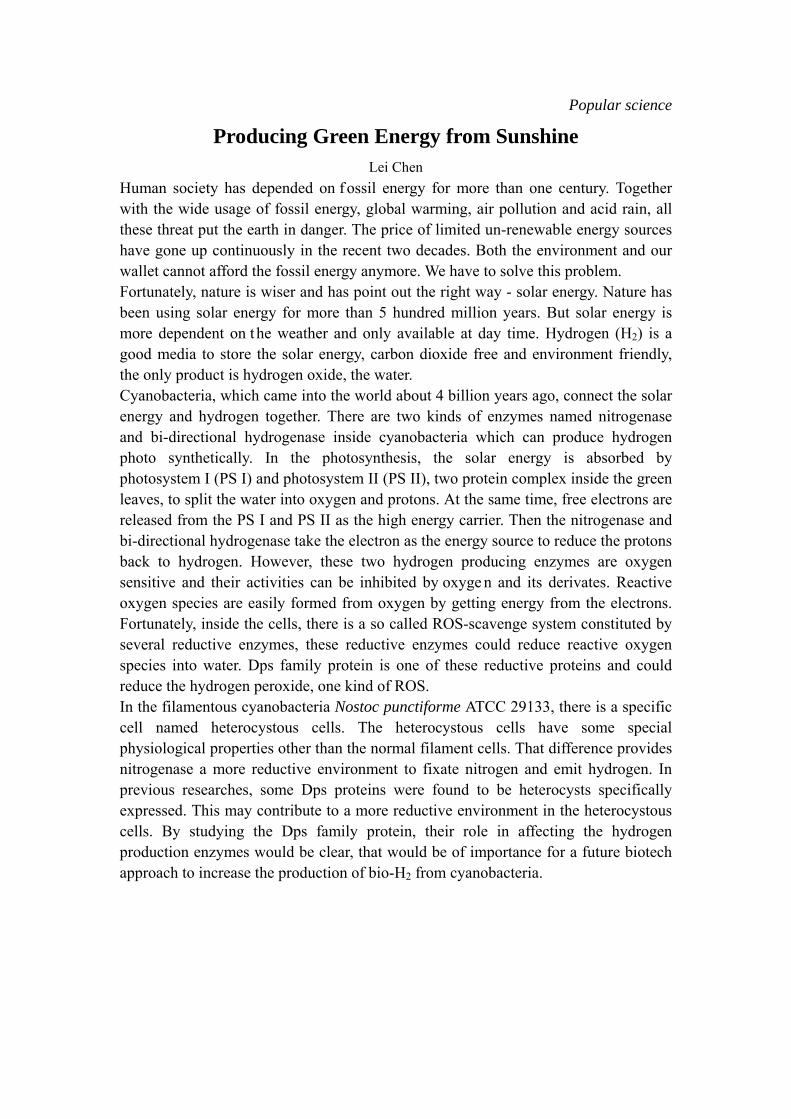
Popular science
Producing Green Energy from Sunshine Lei Chen
Human society has depended on f ossil energy for more than one century. Together with the wide usage of fossil energy, global warming, air pollution and acid rain, all these threat put the earth in danger. The price of limited un-renewable energy sources have gone up continuously in the recent two decades. Both the environment and our wallet cannot afford the fossil energy anymore. We have to solve this problem. Fortunately, nature is wiser and has point out the right way - solar energy. Nature has been using solar energy for more than 5 hundred million years. But solar energy is more dependent on the weather and only available at day time. Hydrogen (H2) is a good media to store the solar energy, carbon dioxide free and environment friendly, the only product is hydrogen oxide, the water. Cyanobacteria, which came into the world about 4 billion years ago, connect the solar energy and hydrogen together. There are two kinds of enzymes named nitrogenase and bi-directional hydrogenase inside cyanobacteria which can produce hydrogen photo synthetically. In the photosynthesis, the solar energy is absorbed by photosystem I (PS I) and photosystem II (PS II), two protein complex inside the green leaves, to split the water into oxygen and protons. At the same time, free electrons are released from the PS I and PS II as the high energy carrier. Then the nitrogenase and bi-directional hydrogenase take the electron as the energy source to reduce the protons back to hydrogen. However, these two hydrogen producing enzymes are oxygen sensitive and their activities can be inhibited by oxyge n and its derivates. Reactive oxygen species are easily formed from oxygen by getting energy from the electrons. Fortunately, inside the cells, there is a so called ROS-scavenge system constituted by several reductive enzymes, these reductive enzymes could reduce reactive oxygen species into water. Dps family protein is one of these reductive proteins and could reduce the hydrogen peroxide, one kind of ROS. In the filamentous cyanobacteria Nostoc punctiforme ATCC 29133, there is a specific cell named heterocystous cells. The heterocystous cells have some special physiological properties other than the normal filament cells. That difference provides nitrogenase a more reductive environment to fixate nitrogen and emit hydrogen. In previous researches, some Dps proteins were found to be heterocysts specifically expressed. This may contribute to a more reductive environment in the heterocystous cells. By studying the Dps family protein, their role in affecting the hydrogen production enzymes would be clear, that would be of importance for a future biotech approach to increase the production of bio-H2 from cyanobacteria.