Embed Size (px)
Citation preview
Responses to Referee 1
Daytime low-level clouds in West Africa – occurrence, associated drivers and shortwave radiation
attenuation by Danso et al.
On behalf of all the authors, I wish to thank the reviewer for the thorough assessment of our study
and for providing us with comments to improve the manuscript during the revision. Please see below
the detailed responses to each of the reviewer’s comments/questions. The reviewer’s comments are
shown in black font while our responses are shown in blue font. Where applicable, the changes that
will be made in the manuscript are shown in italics.
This study, based on the analysis of the ERA5 hourly data from 2006 to 2015, shows the occurrence
of daytime low level clouds in WA at two different latitudes (Sahelian and Guinean). It also aims at
determining the atmospheric conditions for different LLC classes (based on cloud fraction) and their
impact on the solar incoming radiation. This article can be improved at several points of view:
motivation, methodology explanation, results interpretation.
We thank the reviewer for the positive and constructive comments to improve our work.
Main comments:
(1) The LLC events are selected in this study with their cloud base height (< 2 km). This is in
accordance with the definition of low cloud. However, the authors apply this definition at two
very different places in Africa and at very contrasting seasons. The boundary layer varies from
few hundred meters (during monsoon season in the Guinean region) to several kilometres (during
winter season in the Sahelian region). Consequently, the LLC as defined by the authors may
include or not boundary layer clouds according to the region and the season. This should be at
least discussed (see specific comments) since it impacts consequently the different statistics
presented in this study.
We thank the reviewer for this comment. We fully agree that the clouds analyzed in our work may
or may not include all boundary layer clouds due to the definition of LLCs. In the revised
manuscript we will discuss this important issue which could influence the interpretation of some
of our results. The following sentences, for instance, will be incorporated in the methodology
section:
Due to the definition of LLCs used, the present study does not consider the impact of the
atmospheric boundary layer (ABL) that may considerably modify the altitude of the low-level
cloud. Indeed, ABL clouds have their bases higher than 2km especially in the Sahel region during
the dry season. Again, some studies (e.g., Lohou et al. (2020), Pedruzo et al. (2020), Zouzoua et
al. (2020)) have shown that some LLCs can be decoupled from the surface and are therefore not
influenced by the surface heat fluxes.
(2) In addition to the previous comment, LLC with base below 2 km gather stratus, stratocumulus,
cumulus and MCS (as mentioned in the paper). These clouds develop in quite different
atmospheric conditions (specifically in terms of divergence). What is the interest of highlighting
the atmospheric conditions of a mix of different clouds (see specific comments)?
We agree with the reviewer that different low-level clouds may develop under different
atmospheric conditions. This question somehow mirrors comment #4 by Reviewer 2. Due to the
nature of the ERA5 data, it is impossible to make the distinction between the different types of
low-level clouds. However, while low clouds can be associated with different types of forcing
(for example in terms of divergence or cold air advection for stratiform clouds as found in the
DACCIWA studies), we assume that the moisture flux (which is analyzed) conditions will not
differ significantly from one LLC type to the other. In terms of divergence, we believe we can
use our results to postulate the clouds present. This is explained below:
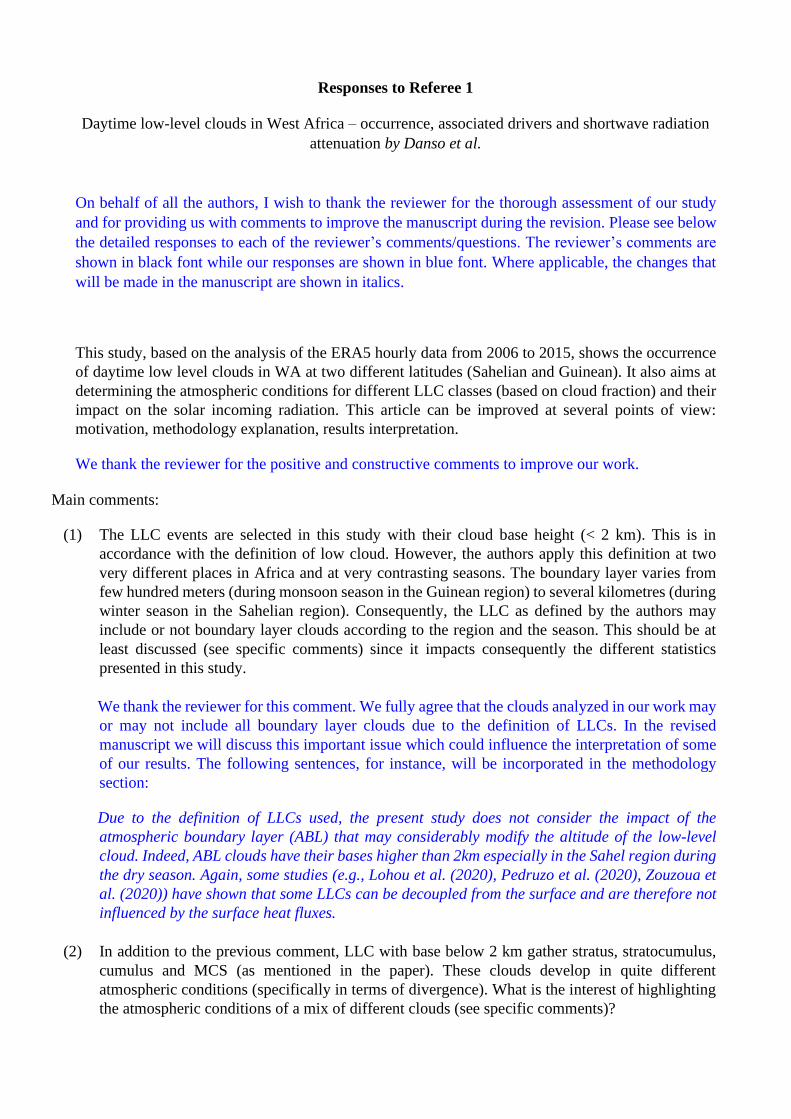
In the original manuscript, we showed divergence and vertical velocity for DJF (but not JAS)
which showed mostly negative values favorable for LLC formation. In specific comment #21 in
this document, the reviewer mentioned that St and Sc clouds are characterized by positive vertical
velocity (contrary to our results for DJF) – and therefore this result cannot be generalized for all
low clouds, we fully agree with this point. LLCs during DJF are likely not St and Sc clouds but
perhaps cumulus clouds. The divergence (and vertical velocity) during JAS is shown in Figure 1
below. As shown, the mean profiles are almost neutral. This can be explained by the fact that in
JAS, St, Sc, Cu, and Cb clouds are all present – since they have opposing vertical velocities, their
combined effect leads to a mean value almost neutral, as shown.
In the revised manuscript (specifically in discussion section under the discussion of atmospheric
conditions), we will introduce and discuss this figure (for JAS) suggesting the types of LLCs that
maybe dominant in which season, so that the divergence/vertical velocities will not be generalized
as we did previously.
Figure 1: Vertical profiles of divergence and vertical velocity during occurrence of the LLC classes
in JAS
(3) The cloud fraction as a parameter to define different LLC classes in order to check their impact
on solar radiation seems quite logical, but not to determine the atmospheric conditions of these
classes.
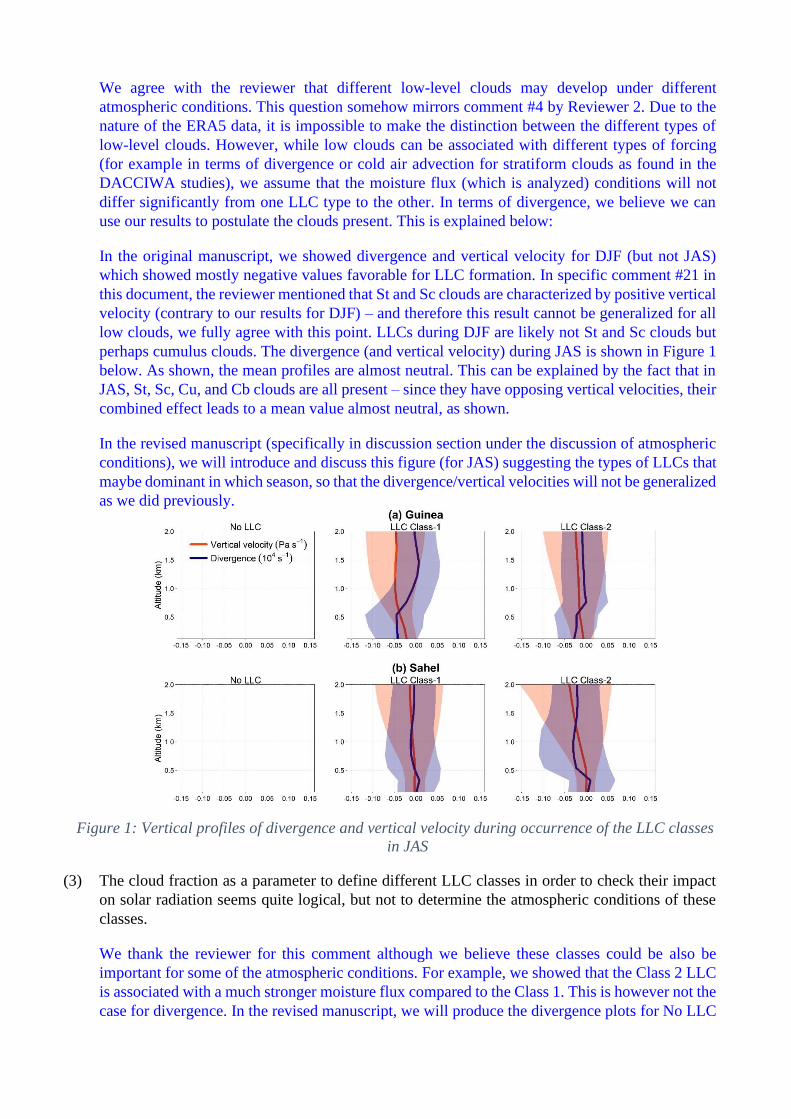
We thank the reviewer for this comment although we believe these classes could be also be
important for some of the atmospheric conditions. For example, we showed that the Class 2 LLC
is associated with a much stronger moisture flux compared to the Class 1. This is however not the
case for divergence. In the revised manuscript, we will produce the divergence plots for No LLC
events and all LLC events (so we will not show Class-1 or Class-2). As an example, we show one
of the plots in Figure 2:
Figure 2: Composite vertical profile of divergence for No LLC and LLC occurrences in (a) Guinea and (b) Sahel for DJF.
(4) Some explanations are missing to fully understand the analyzed atmospheric conditions, specially
the surface flux anomaly.
This has been noted. We are grateful to the reviewer for this comment. We will update the
manuscript with further explanations to understand the analyzed surface flux anomalies
specifically how the anomalies were calculated and analyzed. Other questions pertaining to the
surface fluxes are addressed in our responses to the specific comments.
Specific comments:
(1) P2, line 40: Perhaps the authors could add a reference to the work of Shrage et al. who first
quantified the low level cloud frequency and fraction in southern WA.
• Schrage, J. M. and Fink, A. H.: Nocturnal continental low-level stratus over tropical West Africa:
observations and possible mechanisms controlling its onset, Mon. Weather Rev., 140, 1794–
1809,2012.
Schrage et al. (2012) will be referenced in this sentence in the revised manuscript.
(2) P2, line 48-57: Three very recent articles published in ACP (DACCIWA special issue) should be
cited here since they focus on daytime phase of low level clouds. The first one estimates, with
local measurements, the impact of LLC on the surface net radiation and on the convective surface
fluxes which is one objective of the present study.
• Lohou, F., Kalthoff, N., Adler, B., Babic, K., Dione, C., Lothon, M., PedruzoBagazgoitia, X., and
Zouzoua, M., 2020 : Conceptual model of diurnal cycle of low-level stratiform clouds over
southern West Africa. Atmos. Chem. Phys., 20, 2263–2275, doi: 10.5194/acp-20-2263-2020.
• Maurin Zouzoua, Fabienne Lohou, Paul Assamoi, Marie Lothon, Véronique Yoboue, Cheikh
Dione, Norbert Kalthoff, Bianca Adler, Karmen Babić, and Xabier Pedruzo-Bagazgoitia :
Breakup of nocturnal low-level stratiform clouds during southern West African Monsoon Season,
https://doi.org/10.5194/acp-2020-602
• Pedruzo-Bagazgoitia, X., de Roode, S. R., Adler, B., Babić, K., Dione, C., Kalthoff, N., Lohou,
F., Lothon, M., and Vilà-Guerau de Arellano, J., 2020: The diurnal stratocumulus-to-cumulus
transition over land, Atmos. Chem. Phys., https://doi.org/10.5194/acp-2019-659.
This has been noted. We thank the reviewer for this suggestion. In the revised manuscript, we will
cite these works in this paragraph.
(3) P2-P3 : I do not understand the link between the last sentence of page 2 and the first one of page
3. Could the authors be more explicit? Or perhaps the word « consequently » is not appropriate
in this sentence?
Thank you. There was an error in these sentences. They will now read as:
In the night, the nocturnal LCCs have no influence on surface solar irradiance due to the absence
of sunlight. However, they persist long into the morning and early afternoon hours, thus, directly
influencing the amount of incoming solar irradiance. The conditions associated with these low
clouds during the daytime are less documented.
(4) P3, Line 3 : « ...have been limited to the WAM season... »
Thanks. This will be corrected in the revised manuscript.
(5) P3, line 70 : « Few studies which were done with simulations, reanalysis, and satellite data in the
region (e.g., Adler et al., 2017; Knippertz et al., 2011; van de Linden et al., 2015; Schuster et al.,
2013) have nevertheless shown results similar to those of ground observational studies to some
extent. » Could the authors precise to what observational studies they referred to?
Some findings of all these studies regarding conditions for nocturnal LLCs are similar to findings
in the recent DACCIWA studies (e.g., Babic et al., 2019; Adler et al., 2019).
These observational studies will be referenced in the sentence.
(6) P4, line 100-102: Could the author reword this sentence? Remove this part perhaps “and their
surface heat fluxes explore » ?
Thank you. This sentence will be rephrased. In the revised manuscript, it will read as:
“Other ERA5 variables are analyzed to show some of the atmospheric and surface conditions
during the occurrence of LLCs in order to understand the possible interactions between the
surface and the lower levels of the atmosphere.”
(7) P5, L127-134: This paragraph about upper clouds is very important at several points of view.
Because the threshold on the base height (< 2 km) can mix a lot of cloud types (Stratus,
Stratocumulus, Cumulus, MCS) I wonder if it would be interesting to add a statistic on the LLC
top heights just to be aware of the cloud types mixed in the so large family of LLC.
We thank the reviewer for this comment and yes, it would be interesting to show this. However,
there is no cloud top heights variable in the ERA5 product.
(8) P5, equ. 1:
• It seems to me that equation 1 gives the Moisture Flux. The moisture advection would be defined
with the horizontal gradient of specific humidity. Qavd is named differently along the article:
horizontal moisture flux advection, moisture advection,…
Yes, you are right. The quantity computed is actually moisture flux (which is also known as the
water vapour transport) and not the moisture advection. In the revised manuscript, we will discuss
the moisture flux rather than the advection as we did not compute that. We will also change the
symbol to Qflux as Qadv may suggest advection.
• The sum should be between 1 and N and not between i and N.
Thank you. This error will be corrected in the revised manuscript.
• Why the chosen level for the moisture flux estimate is 950 hPa? Could the authors justify this
choice? Why the integrated value over the vertical is not used in this study?
We used 950 hPa level because during the rainy season the SW monsoon flow is clearly shown
at this level (please also see from one of the DACCIWA studies – Babic et al. 2019 in figure 11
showed this level). We did not use the integrated value over the first 2 km because we plot also
the winds over the moisture flux. The winds near the surface are different from winds at around
800 hPa which is also within the 2 km. Taking the average thus may not show the SW monsoon
flow well.
(9) P5, L: Ek and Holstag study focuses on ABL clouds.
• The present study does not take into account all ABL clouds since a large part of them are higher
than 2 km when the ABL is higher, which is very often the case in Sahelian region.
• Some Stratus or Stratocumulus low cloud are decoupled from the surface and are then not
influenced by the surface flux (see previous suggested papers of Zouzoua et al., Pedruzo et al, and
Lohou et al.).
These two points should be addressed in some way.
Thank you for these comments. The following sentences will be incorporated in the methods
section:
Due to the definition of LLCs used, the present study does not consider the impact of the
atmospheric boundary layer (ABL) that may considerably modify the altitude of the low-level
cloud. Indeed, ABL clouds have their bases higher than 2km especially in the Sahel region during
the dry season. Again, some studies (e.g., Lohou et al. (2020), Pedruzo et al. (2020), Zouzoua et
al. (2020)) have shown that some LLCs can be decoupled from the surface and are therefore not
influenced by the surface heat fluxes.
(10) P6, Equation 2 & 3:
• CRE has two different definitions through equation 2 & 3. The authors could remove equation 2
and just keep equation 3.
We thank the author for this suggestion. Equation 2 will be removed in the revised manuscript.
• What are the clear sky events? Are they cases with no liquid water at all in ERA5? If so, how
many cases are used for CRE estimate? Or are they theoretically calculated? This is important to
understand the CRE for no-LLC cases.
Clear sky events are those events when the cloud fraction in the first 2km is zero – in the ERA5
data cloud fraction can be higher than zero when liquid water is zero as also shown in referee RC3
major comment #1 and our response to the comment. There may be higher level clouds which
may have led to the CRE values during No LLC events. In the revised manuscript, we will modify
Table 2 (which was not correct anyway) to show the number of cases that were used to calculate
the CRE.
(11) P6, L163: “... SW↓ is the downwelling shortwave radiation in all-sky conditions...” If I
understand correctly SW↓ is rather the downwelling short wave radiation for each LLC classes
instead of “all sky conditions”. This could be written in first place?
𝑆𝑊↓ refers to the actual radiation received with all atmospheric conditions of temperature,
humidity, aerosols, clouds etc. (this is why we referred to it as ‘all-sky radiation’). 𝑆𝑊𝐶𝑆↓ on the
other hand, is computed based on the conditions but assuming there are no clouds. So, for each
LLC class event, there is a corresponding 𝑆𝑊↓ value. This point will be made clearer in the
revised manuscript.
(12) P6, L169: The authors should make clear in the text and the legend that this daytime distribution
gathers all the seasons.
Well noted. Thank you for this comment.
The following sentence will be added to the text: “The distribution presents the total occurrence
frequency of all seasons.”
Additionally, the following will be added to the caption: “All seasons are included in the
computed frequencies.”
(13) P6, L180: “Additionally, the early morning peak in the events of LLC Class-2 could also be partly
linked to contributions from tropical oceanic low-level convection which is maximum during the
early morning (Yang and Slingo, 2001).” Could the authors check the Yang and Slingo paper?
It seems to me that Yang and Slingo mentioned the “Tropical oceanic deep convection” (for
example page 798-799 in Yang and Slingo, 2001). If this is so, the paragraph the authors certainly
referred to finishes this way : “Some of these convective systems, under optimal environmental
conditions, continue to grow and reach their mature stage some time later during the night
and early morning”. It is rather deep convection and MCS that Yang and Slingo are talking about.
How do we know that LLC class 2 are deep convection if all seasons are mixed in fig 3? What is
the proportion of deep-convection versus stratocumulus? In what extent the MCS can impact the
statistic presented in Fig 3 for Guinean region? Did the authors try a diurnal cycle for each season?
We agree with the reviewer that Yang and Slingo were referring to deep convection and MCS.
However, with the ERA5 data and based on our definition of LLC, the lower parts of these MCSs
are also considered as LLCs. They showed that some of the tropical oceanic MCSs are maximum
in the night and morning. The proximity of the Guinea region to the ocean means that some of
these systems may move into the Guinean region. In addition, there are residual nocturnal stratus
clouds in the morning (as shown in the DACCIWA studies). All these clouds together will likely
lead to higher cloud fractions (LLC Class 2).
In our statement, we did not say that all Class 2 LLCs are due to the deep MCSs shown by Yang
and Slingo. We indicated that those oceanic deep convections can partly explain the morning
peak of the Class 2. However, it not possible to make the distinction between St and MCS with
the ERA5 dataset. It could be very interesting to also show the contributions of each low cloud
type to the morning peak of LLC Class 2 but this cannot be achieved with the ERA5 data. We
will mention this in our conclusion as a point to be considered in future studies.
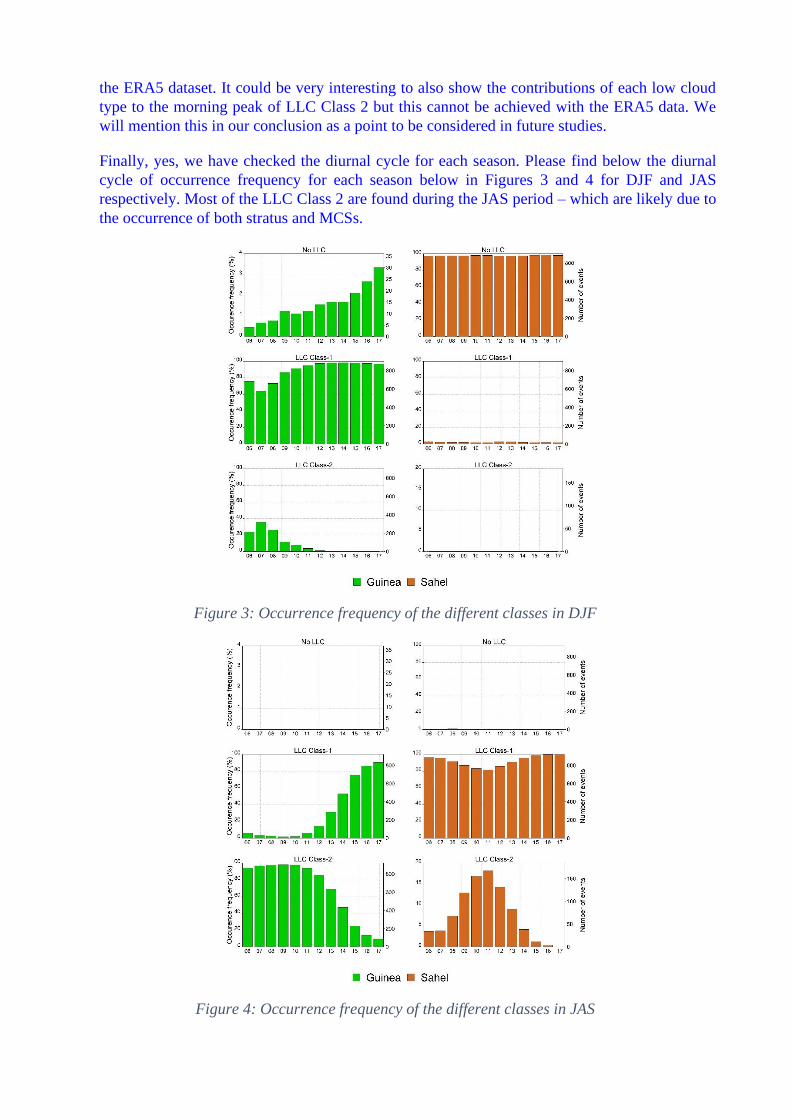
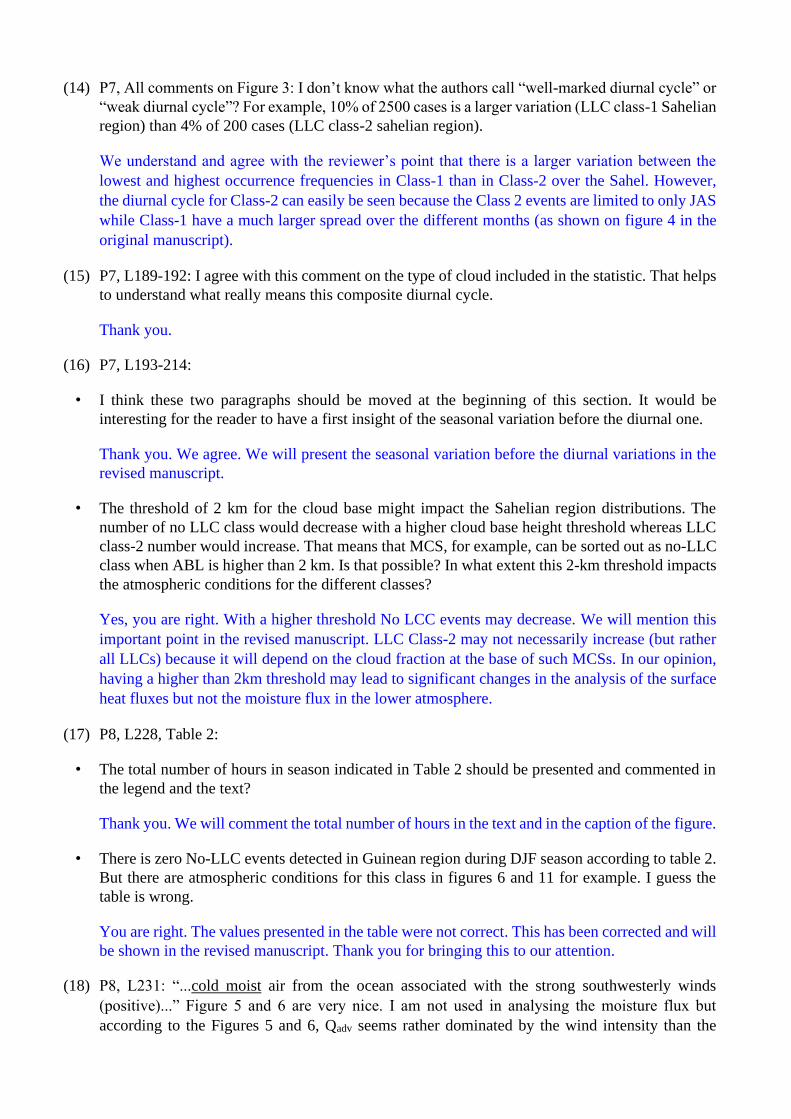
Finally, yes, we have checked the diurnal cycle for each season. Please find below the diurnal
cycle of occurrence frequency for each season below in Figures 3 and 4 for DJF and JAS
respectively. Most of the LLC Class 2 are found during the JAS period – which are likely due to
the occurrence of both stratus and MCSs.
Figure 3: Occurrence frequency of the different classes in DJF
Figure 4: Occurrence frequency of the different classes in JAS
(14) P7, All comments on Figure 3: I don’t know what the authors call “well-marked diurnal cycle” or
“weak diurnal cycle”? For example, 10% of 2500 cases is a larger variation (LLC class-1 Sahelian
region) than 4% of 200 cases (LLC class-2 sahelian region).
We understand and agree with the reviewer’s point that there is a larger variation between the
lowest and highest occurrence frequencies in Class-1 than in Class-2 over the Sahel. However,
the diurnal cycle for Class-2 can easily be seen because the Class 2 events are limited to only JAS
while Class-1 have a much larger spread over the different months (as shown on figure 4 in the
original manuscript).
(15) P7, L189-192: I agree with this comment on the type of cloud included in the statistic. That helps
to understand what really means this composite diurnal cycle.
Thank you.
(16) P7, L193-214:
• I think these two paragraphs should be moved at the beginning of this section. It would be
interesting for the reader to have a first insight of the seasonal variation before the diurnal one.
Thank you. We agree. We will present the seasonal variation before the diurnal variations in the
revised manuscript.
• The threshold of 2 km for the cloud base might impact the Sahelian region distributions. The
number of no LLC class would decrease with a higher cloud base height threshold whereas LLC
class-2 number would increase. That means that MCS, for example, can be sorted out as no-LLC
class when ABL is higher than 2 km. Is that possible? In what extent this 2-km threshold impacts
the atmospheric conditions for the different classes?
Yes, you are right. With a higher threshold No LCC events may decrease. We will mention this
important point in the revised manuscript. LLC Class-2 may not necessarily increase (but rather
all LLCs) because it will depend on the cloud fraction at the base of such MCSs. In our opinion,
having a higher than 2km threshold may lead to significant changes in the analysis of the surface
heat fluxes but not the moisture flux in the lower atmosphere.
(17) P8, L228, Table 2:
• The total number of hours in season indicated in Table 2 should be presented and commented in
the legend and the text?
Thank you. We will comment the total number of hours in the text and in the caption of the figure.
• There is zero No-LLC events detected in Guinean region during DJF season according to table 2.
But there are atmospheric conditions for this class in figures 6 and 11 for example. I guess the
table is wrong.
You are right. The values presented in the table were not correct. This has been corrected and will
be shown in the revised manuscript. Thank you for bringing this to our attention.
(18) P8, L231: “...cold moist air from the ocean associated with the strong southwesterly winds
(positive)...” Figure 5 and 6 are very nice. I am not used in analysing the moisture flux but
according to the Figures 5 and 6, Qadv seems rather dominated by the wind intensity than the
moisture (and even less the temperature of course) from my point of view. I think, and some
AMMA and DACCIWA studies show this, that the moisture advection is null in the Guinean
region during the WAM (e.g. Adler et al., Babic et al.), whereas it is important in the Sahelian
region. It depends on the moisture gradient. So what does the moisture flux show? The monsoon
or the Harmattan horizontal expansion according to the season?
We thank the reviewer for this comment and question.
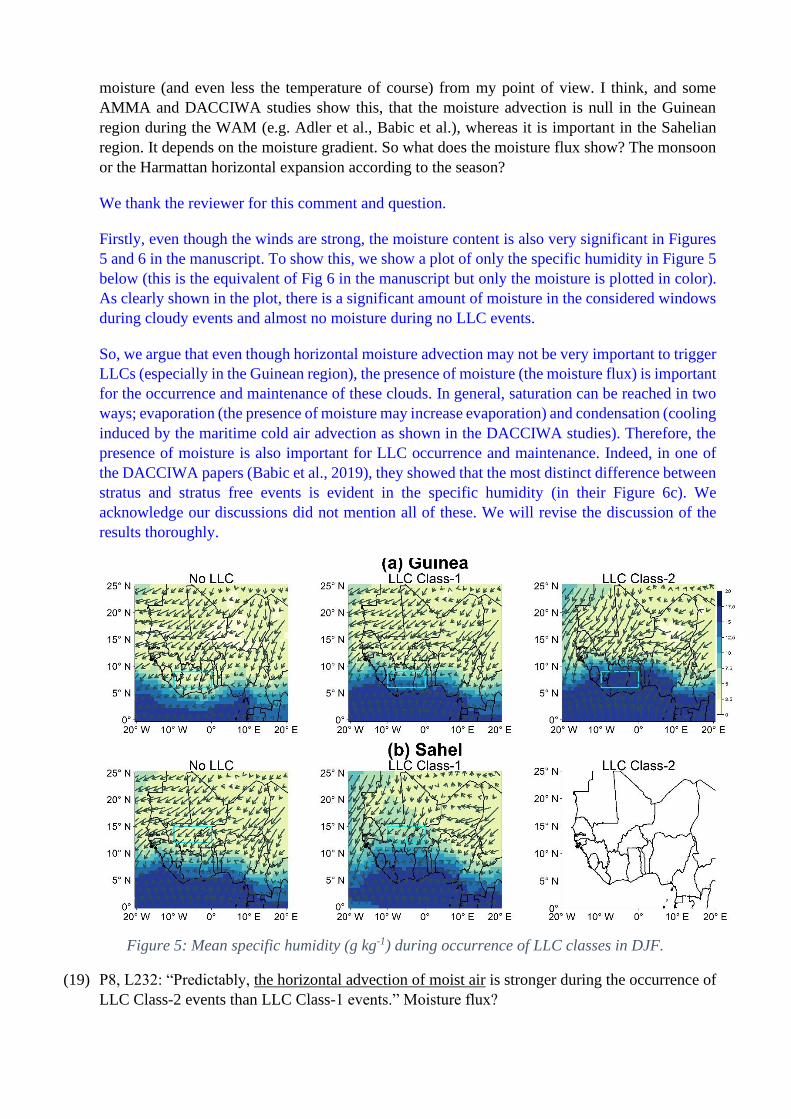
Firstly, even though the winds are strong, the moisture content is also very significant in Figures
5 and 6 in the manuscript. To show this, we show a plot of only the specific humidity in Figure 5
below (this is the equivalent of Fig 6 in the manuscript but only the moisture is plotted in color).
As clearly shown in the plot, there is a significant amount of moisture in the considered windows
during cloudy events and almost no moisture during no LLC events.
So, we argue that even though horizontal moisture advection may not be very important to trigger
LLCs (especially in the Guinean region), the presence of moisture (the moisture flux) is important
for the occurrence and maintenance of these clouds. In general, saturation can be reached in two
ways; evaporation (the presence of moisture may increase evaporation) and condensation (cooling
induced by the maritime cold air advection as shown in the DACCIWA studies). Therefore, the
presence of moisture is also important for LLC occurrence and maintenance. Indeed, in one of
the DACCIWA papers (Babic et al., 2019), they showed that the most distinct difference between
stratus and stratus free events is evident in the specific humidity (in their Figure 6c). We
acknowledge our discussions did not mention all of these. We will revise the discussion of the
results thoroughly.
Figure 5: Mean specific humidity (g kg-1) during occurrence of LLC classes in DJF.
(19) P8, L232: “Predictably, the horizontal advection of moist air is stronger during the occurrence of
LLC Class-2 events than LLC Class-1 events.” Moisture flux?
Yes, this is supposed to be moisture flux and not the advection. It will be changed in the revision
of the discussion of results. Thank you.
(20) P8, L234,“ This inland advection of moist air from the ocean has been found to play a major role
in cooling (Adler et al., 2019b) which in turn enhances saturation of water vapour and
consequently LLC formation (Adler et al., 2019, 2017; Babić et al., 2019b).” Moist air advection
cannot induce a cooling. Adler et al., Babic et al. and Lohou et al. showed that there is no moist
air advection but cold air advection. It is the cold air advection by the low level jet and Atlantic
inflow which induces the saturation and the cloud formation in the Guinean region. That means
that the monsoon flow is not moister than the air in the Guinean region where rain events are
frequent. This can be different for the Sahelian Region which is much drier than the Guinean one.
Please consider to change this comment and make different comments for the two regions.
Thank you. We agree. The whole discussion of the results on atmospheric conditions will be
thoroughly revised to focus on moisture flux rather than moisture advection. We will also use the
findings of the DACCIWA studies to support our discussion wherever appropriate.
(21) P8-9, L245-259: this paragraph deals with the vertical velocity and the divergence of the
horizontal wind.
• I would show only one of these parameters since they should be proportional. No need to comment
both.
We will show only the divergence in the revised manuscript. Thank you.
• The authors precise at the beginning that a negative value of these two parameters is favourable
to cloud formation. Stratus and stratocumulus are characterized by positive vertical velocity (hPa
s-1). So this comment cannot be general and this shows the limit of searching for atmospheric
conditions of a class which may mix different clouds.
We are grateful to the reviewer for this important point. As indicated in the response to main
comment #2, this discussion will be revised.
• “It is also important to note that during JAS, the average vertical profiles of these processes
(divergence and vertical velocity) are not similar to DJF (not shown).”. If this is important,
perhaps the authors should comment a little more on this or show the figures for JAS.
Thanks. The figure will be introduced and commented as indicated in the response to main
comment #2.
• I am not sure what the reader can conclude from this analysis.
As mentioned in our response to your main comment #2, we could use both DJF and JAS plots
of divergence/vertical velocity to postulate the type of LLC which dominates during which
season, since it is not possible to explicitly make such a distinction with the ERA5 dataset.
(22) P9-10, section 4.2:
• Could the author precise how the monthly anomaly is computed because I am very surprised by
these results?
Since we used hourly data, the anomalies were first computed at hourly timescale and then the
monthly means were calculated from those. Please the computation is explained below:
There are ten different values for each hour of a given day and month (10 because ten years of
data is used). For example, there will be ten different heat flux values at 12UTC on 1st Jan, one
value for each year. The mean of all these ten values are first determined. Let’s call this mean
value 𝐻𝐹̅̅ ̅̅ and call each of the individual heat flux values as 𝐻𝐹𝑖. So, the anomaly for the heat flux
value at 12UTC on 1st January 2006 is computed as:
𝐻𝐹𝑎𝑛𝑜𝑚_𝑖 = 𝐻𝐹𝑖 − 𝐻𝐹̅̅ ̅̅
This is done for all hours on all days and months for the period of the study. The monthly mean
anomaly which was shown in the manuscript is then computed from the hourly anomalies.
We will explain the computation of anomalies in the revised manuscript.
• The reduction of the net radiation at surface by the clouds induces a reduction of the surface
sensible and latent heat flux. So, from my point of view, the figure 8 should rather show the cloud
impact on the surface energy budget than the effect of the convective flux on the clouds.
We fully agree with the reviewer. The discussion on heat fluxes presented in the previous
manuscript was flawed since we are not considering heat fluxes before the clouds are formed but
rather during the cloud occurrence. We are going to present a new discussion in the revised
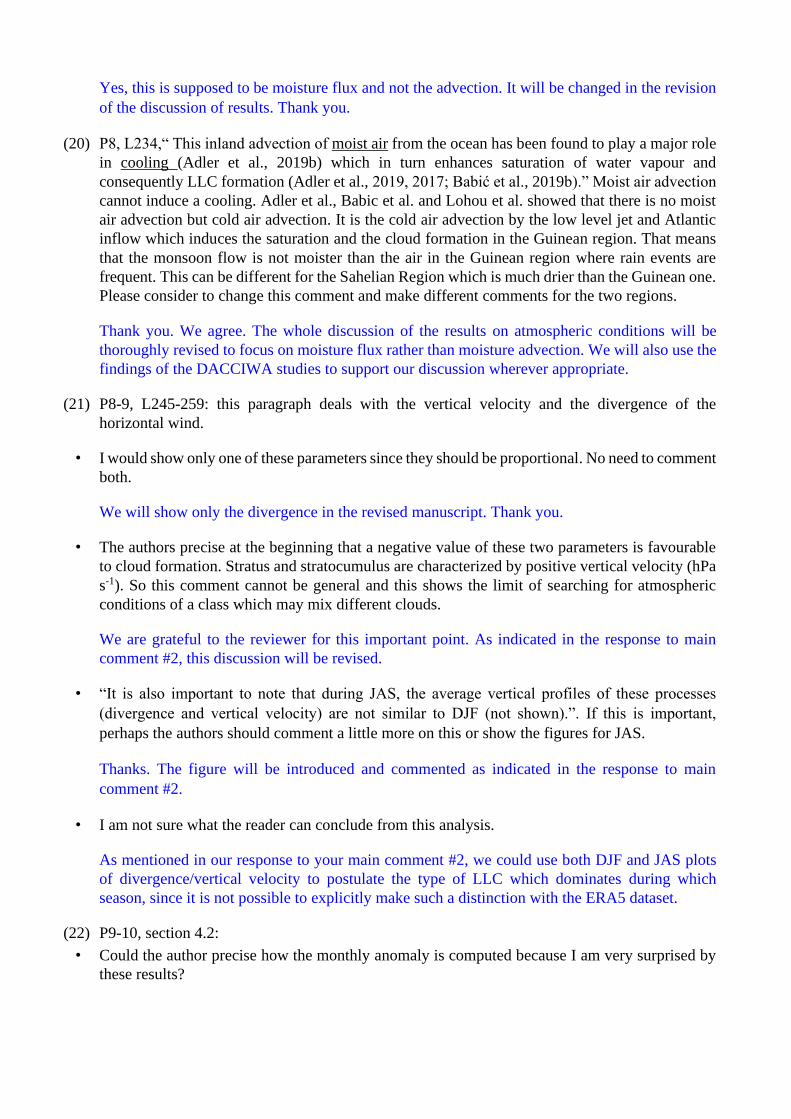
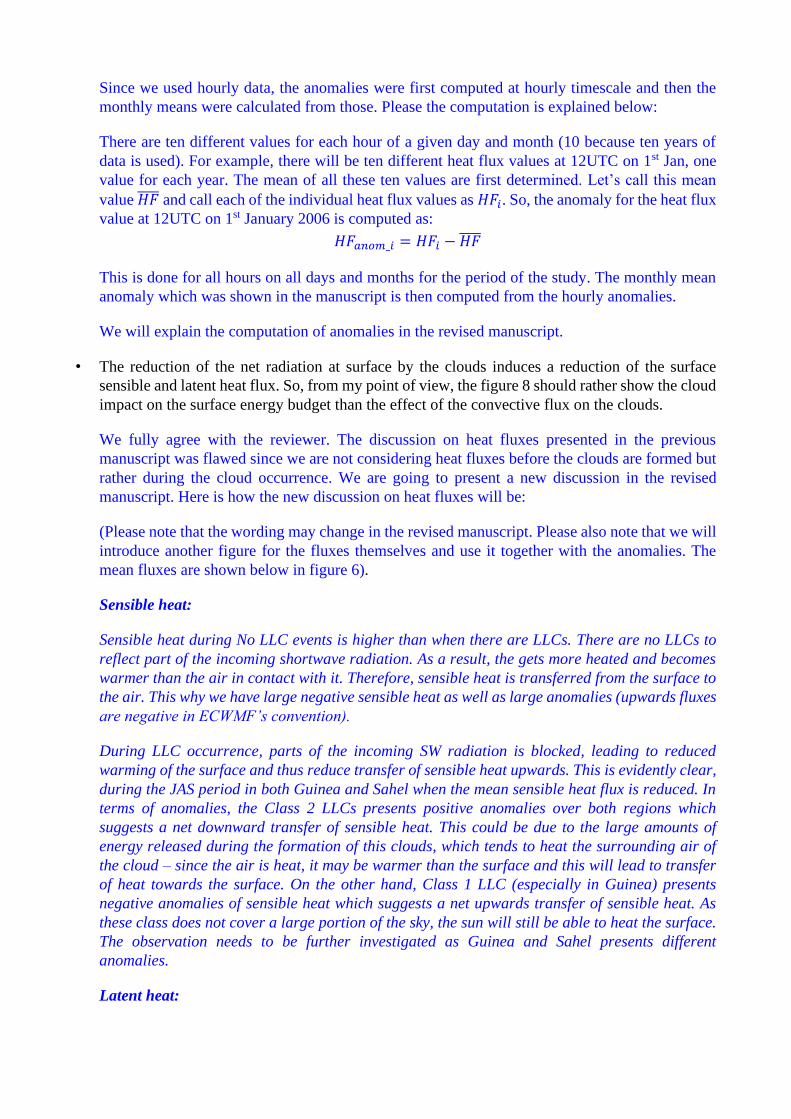
manuscript. Here is how the new discussion on heat fluxes will be:
(Please note that the wording may change in the revised manuscript. Please also note that we will
introduce another figure for the fluxes themselves and use it together with the anomalies. The
mean fluxes are shown below in figure 6).
Sensible heat:
Sensible heat during No LLC events is higher than when there are LLCs. There are no LLCs to
reflect part of the incoming shortwave radiation. As a result, the gets more heated and becomes
warmer than the air in contact with it. Therefore, sensible heat is transferred from the surface to
the air. This why we have large negative sensible heat as well as large anomalies (upwards fluxes
are negative in ECWMF’s convention).
During LLC occurrence, parts of the incoming SW radiation is blocked, leading to reduced
warming of the surface and thus reduce transfer of sensible heat upwards. This is evidently clear,
during the JAS period in both Guinea and Sahel when the mean sensible heat flux is reduced. In
terms of anomalies, the Class 2 LLCs presents positive anomalies over both regions which
suggests a net downward transfer of sensible heat. This could be due to the large amounts of
energy released during the formation of this clouds, which tends to heat the surrounding air of
the cloud – since the air is heat, it may be warmer than the surface and this will lead to transfer
of heat towards the surface. On the other hand, Class 1 LLC (especially in Guinea) presents
negative anomalies of sensible heat which suggests a net upwards transfer of sensible heat. As
these class does not cover a large portion of the sky, the sun will still be able to heat the surface.
The observation needs to be further investigated as Guinea and Sahel presents different
anomalies.
Latent heat:
Latent heat is lower during events of No LLCs than when there are LLCs because not enough
moisture is evaporated (due to lack of moisture, please see figure 6 in the previous manuscript
and figure 4 in this document). During LLC occurrence, there are large mean negative latent heat
indicating more evaporation from the surface. Interestingly, the transfer of latent heat upwards
is higher in Class 1 than in Class 2. Again, in the Class 1 events, the whole sky is not covered so
the surface is still being warmed and higher amounts of moisture is still being evaporated. This
is also why we have mostly negative anomalies of latent heat for Class 1 in both regions,
indicating water vapour transfer upwards. On the other hand, the large cloud fractions during
Class 2 events means that surface heating by the sun will be reduced (although there is still some
evaporation as shown the mean fluxes). This is why anomalies of latent heat are positive i.e., the
energy released in the phase changes during the cloud formation leads to a higher amount of
energy in the air surrounding the cloud, which are likely higher than that from the surface – hence
the net downward transfer of latent heat.
Figure 6: Mean sensible and latent heat fluxes during occurrence of the different Classes.
• This is why I do not understand how the author can find a negative anomaly of the sensible heat
flux during no-LLC event.
During No LLC events, the surface is warmer than the air in contact with it because emitted
longwave radiation from the surface is not absorbed (by clouds as there are no clouds) and re-
emitted into the atmosphere. Thus, sensible heat is transferred from the warmer ground upwards
into the air. The ECMWF convention for vertical fluxes is negative upwards and positive
downwards. Therefore, No LLC events involve larger negative sensible heat values and negative
anomalies – indicating that sensible heat moves upwards from the surface.
We will make this clearer in the revised manuscript.
• The anomalies should be discussed in comparison to the flux itself. Do the author think that an
anomaly lower than 10 W m-2 is significant when the surface flux is around 300 W m-2 and
considering the error of the surface flux in the model.
It could be significant depending on which day and hour. But we may not be able to see this since
we have only shown the monthly mean anomaly. An extreme value in the individual events may
significantly impact the mean monthly anomaly value. We will show the plot of the mean fluxes
and make the comparison with the anomalies in the revised manuscript. Thank you for this
comment.
• At last, the authors deduce from the surface flux anomaly a surface temperature anomaly. The
surface heat fluxes are proportional to the temperature vertical gradient and not directly linked to
the surface temperature. Such a discussion is misleading.
Thank you. Perhaps the response to third bullet point of this question and our proposed new
discussion will help to improve the explanation of the fluxes and anomalies. The discussion on
heat fluxes will be revised.
(23) P11, L313-316: I fully agree with this statement. The surface convective flux should be also
reduced according to the cloud fraction. So how the authors can detangle the effect of the cloud
on the surface flux from the effect of the flux on the cloud triggering?
Thank you for this question. As shown in the proposed new discussion of the heat fluxes, we will
rather discuss the impact of the clouds on the heat fluxes and not the other way.
References
Adler, B., Babia, K., Kalthoff, N., Lohou, F., Lothon, M., Dione, C., Pedruzo-Bagazgoitia, X.,
and Andersen, H.: Nocturnal low-level clouds in the atmospheric boundary layer over southern
West Africa: An observation-based analysis of conditions and processes. Atmos Chem Phys, 19,
663–681, https://doi.org/10.5194/acp-19-663-2019, 2019
Babić, K., Kalthoff, N., Adler, B., Quinting, J. F., Lohou, F., Dione, C., and Lothon, M.: What
controls the formation of nocturnal low-level stratus clouds over southern West Africa during the
monsoon season? Atmos Chem Phys, 19, 13489–13506, https://doi.org/10.5194/acp-19-13489-
2019, 2019