Embed Size (px)
Citation preview
2019
GlobalRESPONSIBILITY
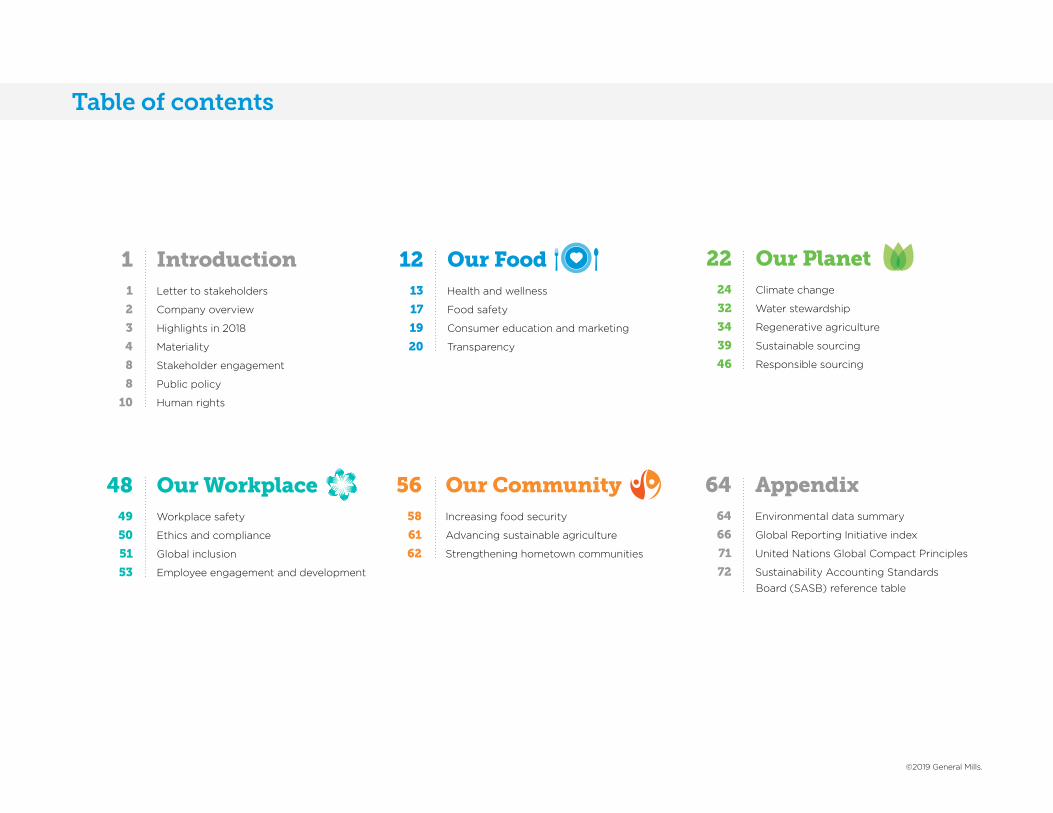
64 Appendix 64 Environmental data summary
66 Global Reporting Initiative index
71 United Nations Global Compact Principles
72 Sustainability Accounting Standards
Board (SASB) reference table
12 Our Food 13 Health and wellness
17 Food safety
19 Consumer education and marketing
20 Transparency
1 Introduction 1 Letter to stakeholders
2 Company overview
3 Highlights in 2018
4 Materiality
8 Stakeholder engagement
8 Public policy
10 Human rights
22 Our Planet 24 Climate change
32 Water stewardship
34 Regenerative agriculture
39 Sustainable sourcing
46 Responsible sourcing
56 Our Community 58 Increasing food security
61 Advancing sustainable agriculture
62 Strengthening hometown communities
48 Our Workplace 49 Workplace safety
50 Ethics and compliance
51 Global inclusion
53 Employee engagement and development
©2019 General Mills.
Table of contents
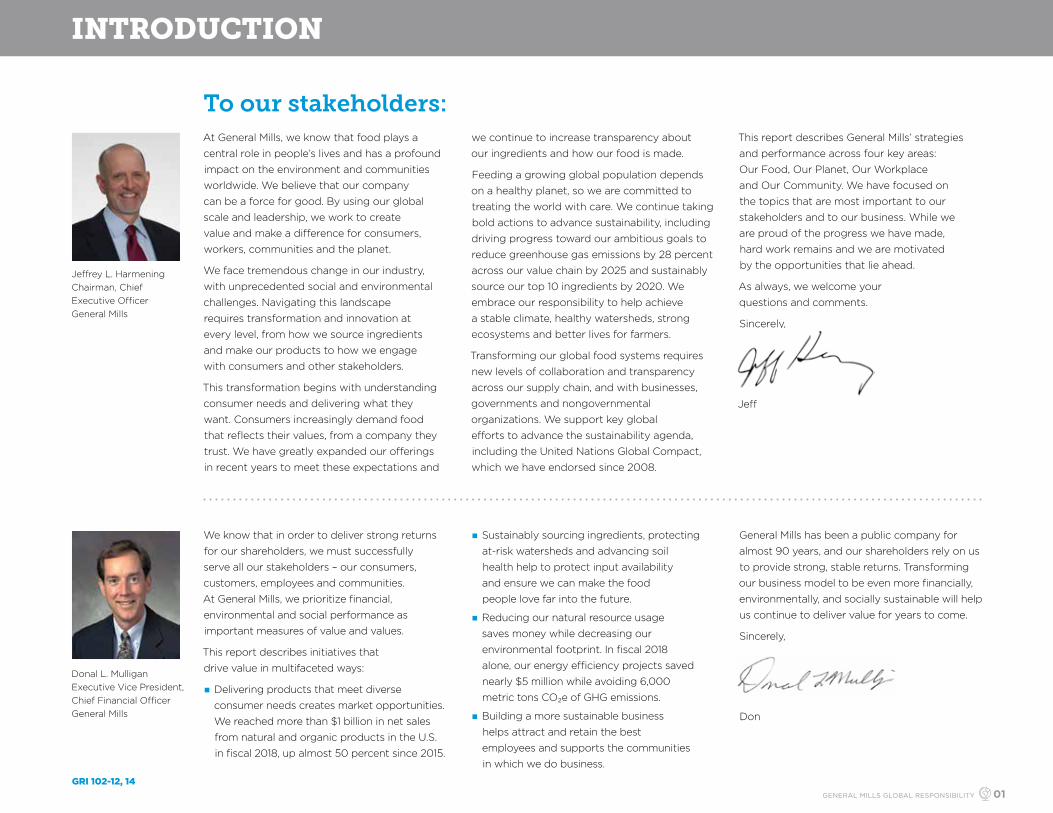
To our stakeholders:At General Mills, we know that food plays a
central role in people’s lives and has a profound
impact on the environment and communities
worldwide. We believe that our company
can be a force for good. By using our global
scale and leadership, we work to create
value and make a difference for consumers,
workers, communities and the planet.
We face tremendous change in our industry,
with unprecedented social and environmental
challenges. Navigating this landscape
requires transformation and innovation at
every level, from how we source ingredients
and make our products to how we engage
with consumers and other stakeholders.
This transformation begins with understanding
consumer needs and delivering what they
want. Consumers increasingly demand food
that reflects their values, from a company they
trust. We have greatly expanded our offerings
in recent years to meet these expectations and
we continue to increase transparency about
our ingredients and how our food is made.
Feeding a growing global population depends
on a healthy planet, so we are committed to
treating the world with care. We continue taking
bold actions to advance sustainability, including
driving progress toward our ambitious goals to
reduce greenhouse gas emissions by 28 percent
across our value chain by 2025 and sustainably
source our top 10 ingredients by 2020. We
embrace our responsibility to help achieve
a stable climate, healthy watersheds, strong
ecosystems and better lives for farmers.
Transforming our global food systems requires
new levels of collaboration and transparency
across our supply chain, and with businesses,
governments and nongovernmental
organizations. We support key global
efforts to advance the sustainability agenda,
including the United Nations Global Compact,
which we have endorsed since 2008.
This report describes General Mills’ strategies
and performance across four key areas:
Our Food, Our Planet, Our Workplace
and Our Community. We have focused on
the topics that are most important to our
stakeholders and to our business. While we
are proud of the progress we have made,
hard work remains and we are motivated
by the opportunities that lie ahead.
As always, we welcome your
questions and comments.
Sincerely,
Jeff
We know that in order to deliver strong returns
for our shareholders, we must successfully
serve all our stakeholders – our consumers,
customers, employees and communities.
At General Mills, we prioritize financial,
environmental and social performance as
important measures of value and values.
This report describes initiatives that
drive value in multifaceted ways:
n Delivering products that meet diverse
consumer needs creates market opportunities.
We reached more than $1 billion in net sales
from natural and organic products in the U.S.
in fiscal 2018, up almost 50 percent since 2015.
n Sustainably sourcing ingredients, protecting
at-risk watersheds and advancing soil
health help to protect input availability
and ensure we can make the food
people love far into the future.
n Reducing our natural resource usage
saves money while decreasing our
environmental footprint. In fiscal 2018
alone, our energy efficiency projects saved
nearly $5 million while avoiding 6,000
metric tons CO₂e of GHG emissions.
n Building a more sustainable business
helps attract and retain the best
employees and supports the communities
in which we do business.
General Mills has been a public company for
almost 90 years, and our shareholders rely on us
to provide strong, stable returns. Transforming
our business model to be even more financially,
environmentally, and socially sustainable will help
us continue to deliver value for years to come.
Sincerely,
Don
Jeffrey L. HarmeningChairman, Chief Executive OfficerGeneral Mills
Donal L. MulliganExecutive Vice President, Chief Financial OfficerGeneral Mills
INTRODUCTION
GRI 102-12, 14GENERAL MILLS GLOBAL RESPONSIBILITY 01

Carbon footprint, fiscal 2018 (percentage of total)
n Agriculture and transformation 48%
n Packaging supply chain 7%
n Producing 10%
n Shipping 7%
n Selling 5%
n Consuming 21%
Total: 15.3 million metric tons CO2e
Total giving, fiscal 2018 (dollars in millions)
n Corporate contributions US$33
n Food donations US$41
n Foundation giving US$28
Total: US$102 million
Net sales by segment, fiscal 2018* (percentage of total)
n North America Retail 64%
n Convenience Stores andFoodservice 12%
n Europe and Australia 13%
n Asia and Latin America 11%
Total: US$15.7 billion
Key metrics
*Does not include US$1.1 billion of net sales from joint ventures.
At General Mills, we serve the world by making food people love. We do this by embracing our five pursuits, which are
at the heart of our company.
Our purpose
Our brandsGeneral Mills produces and markets more than 100 consumer brands in more than 100 countries on six continents.
™
NEW COLOUR LOGO
GRI 102-2
Company overview
GENERAL MILLS GLOBAL RESPONSIBILITY 02

2018 highlights
At General Mills, we work to create holistic value throughout our supply chain, from agriculture and operations to our
consumers and communities. Below are some highlights of our progress in fiscal 2018.
of our 10 priority ingredients sustainably sourced
85 percent
invested in soil health initiatives through 2018
US$4+ million
meals enabled through food donations around the world
29 million
of professional positions held by women globally
49 percent
of pollinator habitat planted through 2018
55,000+ acres 90 percent of our solid waste recycled or processed for recovery
US$102 million in corporate giving worldwide
81 percent of our U.S retail sales volume nutritionally improved since 2005
U.S. natural and organic food producer
2nd largest 100 percent of facilities worldwide audited and/or certified for food safety by independent third parties
decrease of greenhouse gas emissions across our value chain in 2018 compared to 2010
13 percent
of our employees worldwide volunteered in their communities
83 percent
Highlights in 2018
GENERAL MILLS GLOBAL RESPONSIBILITY 03

*In this report, the terms “material” and “materiality” refer to topics that reflect General Mills’ significant environmental and social impacts or that substantially influence our global responsibility strategy. We are not using these terms as theyhave been defined by securities laws in the United States or in the context of financial statements and financial reporting.
Materiality* In 2018, we partnered with Hudson
Consulting to conduct an assessment
to update our list of material global
responsibility issues, last done in 2015.
Input for this analysis included:
n Material issues lists published
by several industry peers
n Input from General Mills global
responsibility experts and executives
n The Sustainability Accounting
Standards Board’s (SASB) materiality
map and disclosure topics for
the processed foods industry
n The Dow Jones Sustainability
Index’s (DJSI) scoring framework
for food products
n Stakeholder and consumer research
Based on the input, we created and
distributed a materiality assessment
survey to stakeholders to determine the
relative importance of each issue. We
received 30 responses from external
stakeholders, most having a global
focus and representing a wide variety of
perspectives, including from academics,
consultants, customers, investors,
nongovernmental organizations
and suppliers. Just over 30 internal
stakeholders responded, representing all
regions and a wide range of functions
and areas of expertise.
Using this stakeholder input, we
developed a draft matrix and worked
with General Mills executives to validate
and finalize the material issues list.
Our final list is included on the following
page, with a visual representation
of where each issue has the most
impact across our value chain.
GRI 102-46, 47
List of issues for materiality assessment
External survey
Internal survey
Materiality assessment process Materiality matrix
Impact on General Mills (input from internal stakeholders)
Imp
ort
ance
fo
r G
ener
al M
ills
to a
dd
ress
(i
nput
fro
m e
xter
nal s
take
hold
ers)
OTHER material issues
PRIORITY material issues
HIGHER
HIG
HE
R
Results of 2015 assessment Industry peers
External disclosure
frameworks
Other stakeholder and consumer
research
General Mills executives
and experts
GENERAL MILLS GLOBAL RESPONSIBILITY 04
GRI 102-46, 47
CO
NSU
MIN
G
SELL
ING
SHIP
PIN
G
PR
OD
UC
ING
PAC
KA
GIN
G
TRA
NSF
OR
MIN
G
AG
RIC
ULT
UR
E
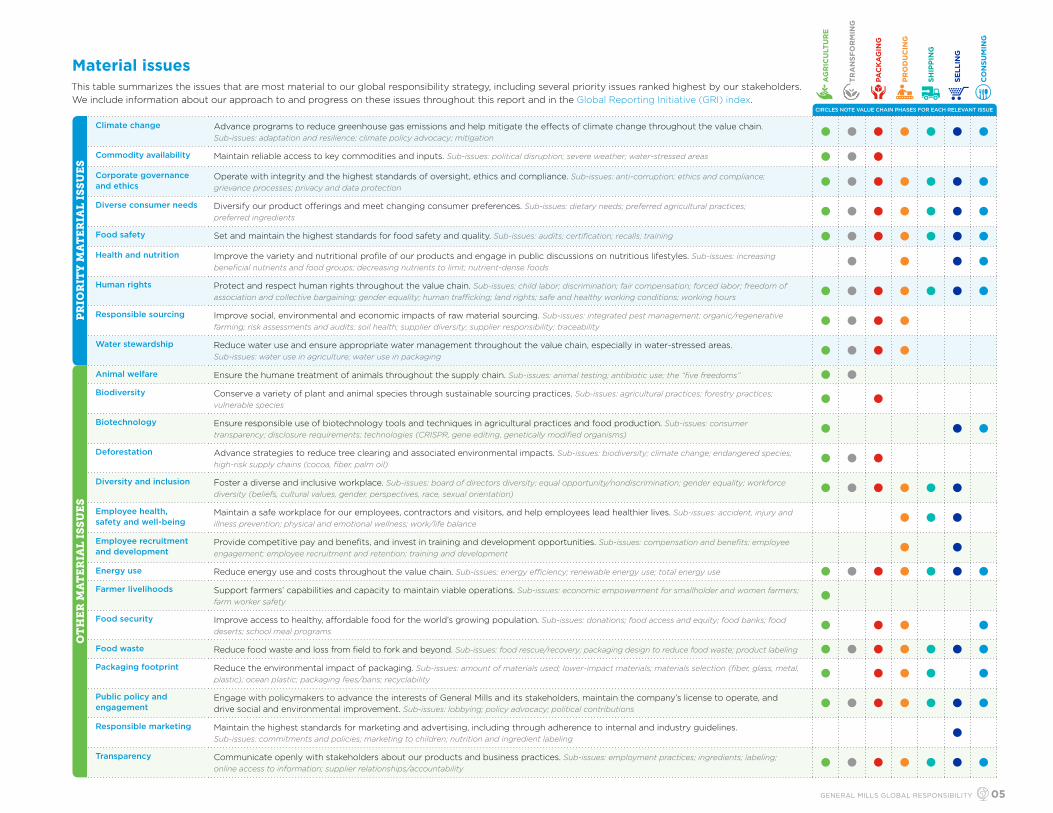
CIRCLES NOTE VALUE CHAIN PHASES FOR EACH RELEVANT ISSUE
Climate change Advance programs to reduce greenhouse gas emissions and help mitigate the effects of climate change throughout the value chain. Sub-issues: adaptation and resilience; climate policy advocacy; mitigation
Commodity availability Maintain reliable access to key commodities and inputs. Sub-issues: political disruption; severe weather; water-stressed areas
Corporate governance and ethics
Operate with integrity and the highest standards of oversight, ethics and compliance. Sub-issues: anti-corruption; ethics and compliance; grievance processes; privacy and data protection
Diverse consumer needs Diversify our product offerings and meet changing consumer preferences. Sub-issues: dietary needs; preferred agricultural practices; preferred ingredients
Food safety Set and maintain the highest standards for food safety and quality. Sub-issues: audits; certification; recalls; training
Health and nutrition Improve the variety and nutritional profile of our products and engage in public discussions on nutritious lifestyles. Sub-issues: increasing beneficial nutrients and food groups; decreasing nutrients to limit; nutrient-dense foods
Human rights Protect and respect human rights throughout the value chain. Sub-issues: child labor; discrimination; fair compensation; forced labor; freedom of association and collective bargaining; gender equality; human trafficking; land rights; safe and healthy working conditions; working hours
Responsible sourcing Improve social, environmental and economic impacts of raw material sourcing. Sub-issues: integrated pest management; organic/regenerative farming; risk assessments and audits; soil health; supplier diversity; supplier responsibility; traceability
Water stewardship Reduce water use and ensure appropriate water management throughout the value chain, especially in water-stressed areas. Sub-issues: water use in agriculture; water use in packaging
PR
IOR
ITY
MA
TE
RIA
L I
SS
UE
SO
TH
ER
MA
TE
RIA
L I
SS
UE
S
Animal welfare Ensure the humane treatment of animals throughout the supply chain. Sub-issues: animal testing; antibiotic use; the “five freedoms”
Biodiversity Conserve a variety of plant and animal species through sustainable sourcing practices. Sub-issues: agricultural practices; forestry practices; vulnerable species
Biotechnology Ensure responsible use of biotechnology tools and techniques in agricultural practices and food production. Sub-issues: consumer transparency; disclosure requirements; technologies (CRISPR, gene editing, genetically modified organisms)
Deforestation Advance strategies to reduce tree clearing and associated environmental impacts. Sub-issues: biodiversity; climate change; endangered species; high-risk supply chains (cocoa, fiber, palm oil)
Diversity and inclusion Foster a diverse and inclusive workplace. Sub-issues: board of directors diversity; equal opportunity/nondiscrimination; gender equality; workforce diversity (beliefs, cultural values, gender, perspectives, race, sexual orientation)
Employee health, safety and well-being
Maintain a safe workplace for our employees, contractors and visitors, and help employees lead healthier lives. Sub-issues: accident, injury and illness prevention; physical and emotional wellness; work/life balance
Employee recruitment and development
Provide competitive pay and benefits, and invest in training and development opportunities. Sub-issues: compensation and benefits; employee engagement; employee recruitment and retention; training and development
Energy use Reduce energy use and costs throughout the value chain. Sub-issues: energy efficiency; renewable energy use; total energy use
Farmer livelihoods Support farmers’ capabilities and capacity to maintain viable operations. Sub-issues: economic empowerment for smallholder and women farmers; farm worker safety
Food security Improve access to healthy, affordable food for the world’s growing population. Sub-issues: donations; food access and equity; food banks; food deserts; school meal programs
Food waste Reduce food waste and loss from field to fork and beyond. Sub-issues: food rescue/recovery; packaging design to reduce food waste; product labeling
Packaging footprint Reduce the environmental impact of packaging. Sub-issues: amount of materials used; lower-impact materials; materials selection (fiber, glass, metal, plastic); ocean plastic; packaging fees/bans; recyclability
Public policy and engagement
Engage with policymakers to advance the interests of General Mills and its stakeholders, maintain the company’s license to operate, and drive social and environmental improvement. Sub-issues: lobbying; policy advocacy; political contributions
Responsible marketing Maintain the highest standards for marketing and advertising, including through adherence to internal and industry guidelines. Sub-issues: commitments and policies; marketing to children; nutrition and ingredient labeling
Transparency Communicate openly with stakeholders about our products and business practices. Sub-issues: employment practices; ingredients; labeling; online access to information; supplier relationships/accountability
Material issuesThis table summarizes the issues that are most material to our global responsibility strategy, including several priority issues ranked highest by our stakeholders. We include information about our approach to and progress on these issues throughout this report and in the Global Reporting Initiative (GRI) index.
GENERAL MILLS GLOBAL RESPONSIBILITY 05
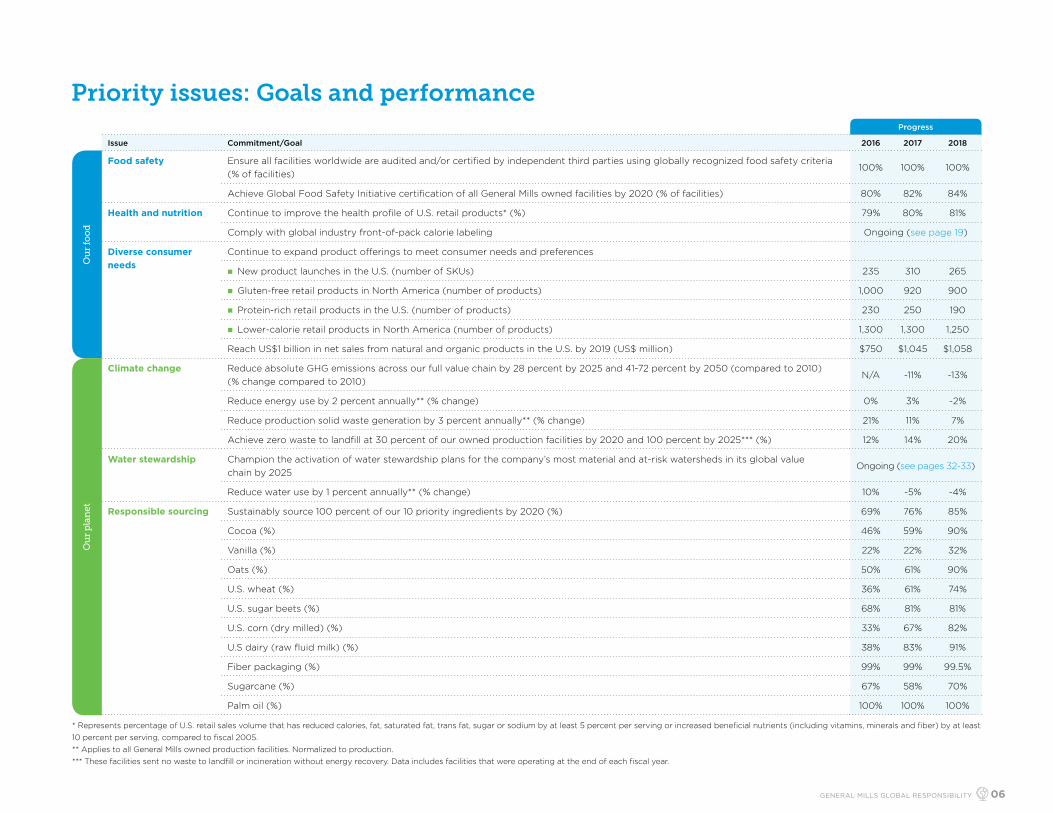
Progress
Issue Commitment/Goal 2016 2017 2018
Food safety Ensure all facilities worldwide are audited and/or certified by independent third parties using globally recognized food safety criteria (% of facilities)
100% 100% 100%
Achieve Global Food Safety Initiative certification of all General Mills owned facilities by 2020 (% of facilities) 80% 82% 84%
Health and nutrition Continue to improve the health profile of U.S. retail products* (%) 79% 80% 81%
Comply with global industry front-of-pack calorie labeling Ongoing (see page 19)
Diverse consumer needs
Continue to expand product offerings to meet consumer needs and preferences
n New product launches in the U.S. (number of SKUs) 235 310 265
n Gluten-free retail products in North America (number of products) 1,000 920 900
n Protein-rich retail products in the U.S. (number of products) 230 250 190
n Lower-calorie retail products in North America (number of products) 1,300 1,300 1,250
Reach US$1 billion in net sales from natural and organic products in the U.S. by 2019 (US$ million) $750 $1,045 $1,058
Climate change Reduce absolute GHG emissions across our full value chain by 28 percent by 2025 and 41-72 percent by 2050 (compared to 2010) (% change compared to 2010)
N/A -11% -13%
Reduce energy use by 2 percent annually** (% change) 0% 3% -2%
Reduce production solid waste generation by 3 percent annually** (% change) 21% 11% 7%
Achieve zero waste to landfill at 30 percent of our owned production facilities by 2020 and 100 percent by 2025*** (%) 12% 14% 20%
Water stewardship Champion the activation of water stewardship plans for the company’s most material and at-risk watersheds in its global value chain by 2025
Ongoing (see pages 32-33)
Reduce water use by 1 percent annually** (% change) 10% -5% -4%
Responsible sourcing Sustainably source 100 percent of our 10 priority ingredients by 2020 (%) 69% 76% 85%
Cocoa (%) 46% 59% 90%
Vanilla (%) 22% 22% 32%
Oats (%) 50% 61% 90%
U.S. wheat (%) 36% 61% 74%
U.S. sugar beets (%) 68% 81% 81%
U.S. corn (dry milled) (%) 33% 67% 82%
U.S dairy (raw fluid milk) (%) 38% 83% 91%
Fiber packaging (%) 99% 99% 99.5%
Sugarcane (%) 67% 58% 70%
Palm oil (%) 100% 100% 100%
Ou
r p
lan
etO
ur
foo
dPriority issues: Goals and performance
* Represents percentage of U.S. retail sales volume that has reduced calories, fat, saturated fat, trans fat, sugar or sodium by at least 5 percent per serving or increased beneficial nutrients (including vitamins, minerals and fiber) by at least10 percent per serving, compared to fiscal 2005.** Applies to all General Mills owned production facilities. Normalized to production.*** These facilities sent no waste to landfill or incineration without energy recovery. Data includes facilities that were operating at the end of each fiscal year.
GENERAL MILLS GLOBAL RESPONSIBILITY 06

Oversight The General Mills leadership team
has ultimate accountability for the
company’s global responsibility
programs and performance. The team
includes Jeff Harmening, Chairman
and Chief Executive Officer; John
Church, Chief Supply Chain and
Global Business Solutions Officer; Jodi
Benson, Chief Innovation, Technology
and Quality Officer; and Jacqueline
Williams-Roll, Chief Human Resources
Officer. The team meets regularly
and receives input from internal and
external experts. The Board of Directors’
Public Responsibility Committee
provides oversight and receives regular
updates from the operating teams.
The Chief Executive Officer also
convenes the Sustainability Governance
Committee three times per year. The
role of the Committee is to approve
and monitor strategy, policy and key
investments related to sustainability.
Additional details about leadership
and governance related to specific
global responsibility issues are included
in relevant sections of this report.
See Corporate Governance to learn
more about the company’s broader
corporate governance structures
and processes, including its Public
Responsibility Committee.
GRI 102-19, 20, 26, 32
General Mills supports the United Nations (UN) Sustainable Development Goals (SDGs), a set of 17 broad goals and 169 more specific targets to drive the 2030
Agenda for Sustainable Development globally. We focus on the goals that most closely align with the company’s priority issues and areas of long-standing
commitment, investment and progress.
n Food security
n Food waste
n Health and nutrition
Learn more.
n Diverse consumer needs
n Food safety
n Health and nutrition
Learn more.
n Water stewardship
Learn more.
n Climate change
n Commodity availability
n Energy use
n Packaging footprint
Learn more.
n Climate change
n Food waste
Learn more.
n Biodiversity
n Deforestation
n Responsible sourcing
Learn more.
United Nations Sustainable Development GoalsM
ATE
RIA
L IS
SUE
S
Also refer to our GRI index for a mapping to SDGs.
r This graphic outlines governance and management ofglobal responsibility focus areas at General Mills.
CEO, CHAIRMAN OF THE BOARD
BOARD OF DIRECTORS’,PUBLIC RESPONSIBILITY
COMMITTEE
CHIEF SUPPLY CHAINAND GLOBAL BUSINESS
SOLUTIONS OFFICER
SUSTAINABILITY GOVERNANCE COMMITTEE
CEO, CHAIRMAN OF THE BOARD
CHIEF SUPPLY CHAIN AND GLOBAL BUSINESS
SOLUTIONS OFFICERCHIEF INNOVATION, TECHNOLOGY AND QUALITY OFFICERCHIEF MARKETING
OFFICER
CHIEF INNOVATION, TECHNOLOGY AND QUALITY OFFICER
GLOBAL RESPONSIBILITY FOCUS AREAS
GLOBAL SUSTAINABILITY
HEALTH AND NUTRITION
GENERAL MILLS FOUNDATION WORKPLACE
CHIEF HUMAN RESOURCES OFFICER
GENERAL MILLS GLOBAL RESPONSIBILITY 07
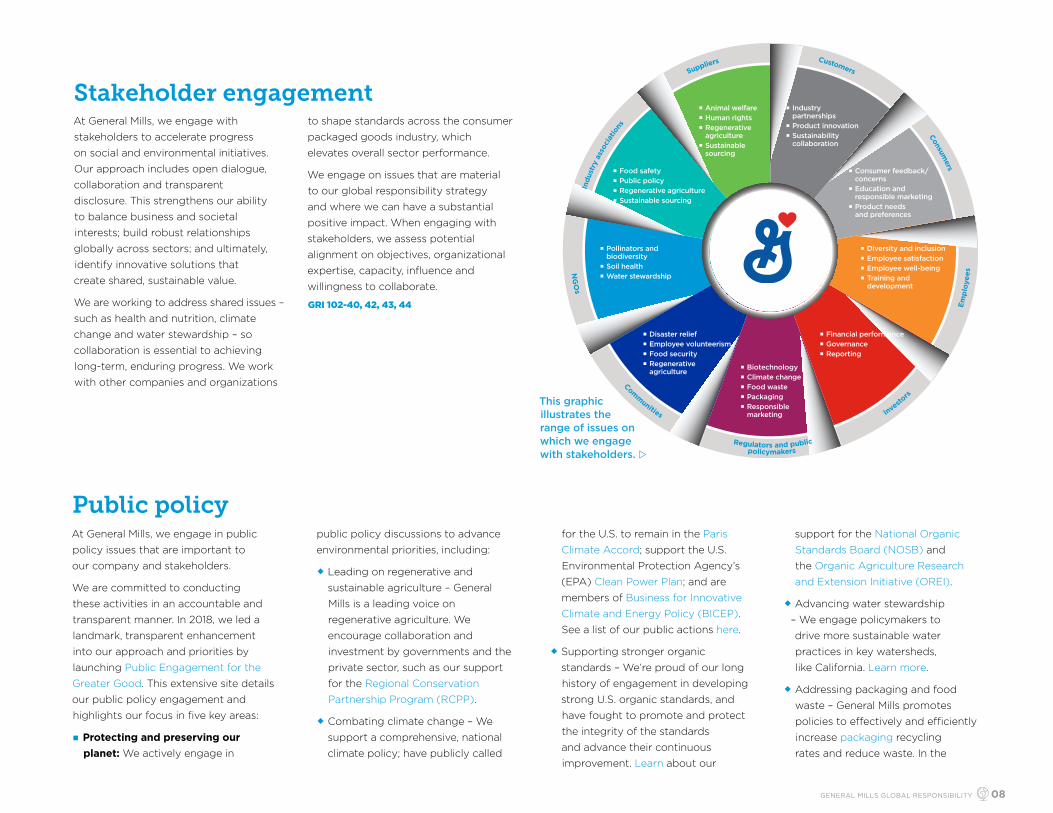
Stakeholder engagement At General Mills, we engage with
stakeholders to accelerate progress
on social and environmental initiatives.
Our approach includes open dialogue,
collaboration and transparent
disclosure. This strengthens our ability
to balance business and societal
interests; build robust relationships
globally across sectors; and ultimately,
identify innovative solutions that
create shared, sustainable value.
We are working to address shared issues –
such as health and nutrition, climate
change and water stewardship – so
collaboration is essential to achieving
long-term, enduring progress. We work
with other companies and organizations
to shape standards across the consumer
packaged goods industry, which
elevates overall sector performance.
We engage on issues that are material
to our global responsibility strategy
and where we can have a substantial
positive impact. When engaging with
stakeholders, we assess potential
alignment on objectives, organizational
expertise, capacity, influence and
willingness to collaborate.
GRI 102-40, 42, 43, 44
Public policy At General Mills, we engage in public
policy issues that are important to
our company and stakeholders.
We are committed to conducting
these activities in an accountable and
transparent manner. In 2018, we led a
landmark, transparent enhancement
into our approach and priorities by
launching Public Engagement for the
Greater Good. This extensive site details
our public policy engagement and
highlights our focus in five key areas:
n Protecting and preserving ourplanet: We actively engage in
public policy discussions to advance
environmental priorities, including:
w Leading on regenerative and
sustainable agriculture – General
Mills is a leading voice on
regenerative agriculture. We
encourage collaboration and
investment by governments and the
private sector, such as our support
for the Regional Conservation
Partnership Program (RCPP).
w Combating climate change – We
support a comprehensive, national
climate policy; have publicly called
for the U.S. to remain in the Paris
Climate Accord; support the U.S.
Environmental Protection Agency’s
(EPA) Clean Power Plan; and are
members of Business for Innovative
Climate and Energy Policy (BICEP).
See a list of our public actions here.
w Supporting stronger organic
standards – We’re proud of our long
history of engagement in developing
strong U.S. organic standards, and
have fought to promote and protect
the integrity of the standards
and advance their continuous
improvement. Learn about our
support for the National Organic
Standards Board (NOSB) and
the Organic Agriculture Research
and Extension Initiative (OREI).
w Advancing water stewardship
– We engage policymakers to
drive more sustainable water
practices in key watersheds,
like California. Learn more.
w Addressing packaging and food
waste – General Mills promotes
policies to effectively and efficiently
increase packaging recycling
rates and reduce waste. In the
Communities
Investo
rs
Em
plo
yees
n Diversity and inclusionn Employee satisfactionn Employee well-beingn Training and
development
n Pollinators and biodiversity
n Soil healthn Water stewardship
n Consumer feedback/concerns
n Education and responsible marketing
n Product needs and preferences
n Food safetyn Public policyn Regenerative agriculturen Sustainable sourcing
n Industry partnerships
n Product innovationn Sustainability
collaboration
n Animal welfaren Human rightsn Regenerative
agriculturen Sustainable
sourcing
n Financial performancen Governancen Reporting
n Disaster reliefn Employee volunteerismn Food securityn Regenerative
agriculturen Biotechnologyn Climate changen Food wasten Packagingn Responsible
marketing
Suppliers
Indu
stry
ass
ocia
tions
Customers
Consumers
Regulators and public
NG
Os
policymakers
This graphic illustrates the range of issues on which we engage with stakeholders. w
GENERAL MILLS GLOBAL RESPONSIBILITY 08

United States, we are a leader in
AMERIPEN – the American Institute
for Packaging and the Environment
– and are actively engaged in
multiple, multi-sector and industry
coalitions aimed at reducing and
ending food waste and loss.
n Delivering nutrition: We actively
engage in public policy discussions
to advance nutrition priorities
consistent with those outlined in our
U.S. Health Metric, including support
for strong Dietary Guidelines for
Americans; the U.S. Food and Drug
Administration’s efforts to reflect the
newest scientific information on the
definition of “healthy”; strong U.S.
school nutrition standards; and the
Supplemental Nutrition Program for
Women, Infants and Children (WIC).
n Ensuring safe food: We actively
engage in public policy discussions to
ensure safe food. We strongly support
the Food Safety Modernization Act
(FSMA) – the largest revamp of
U.S. food safety laws in decades –
and its goal of raising food safety
standards across the food value
chain. We supported the originating
legislation for FSMA and the
regulations for its implementation,
and have consistently called on
Congress to continue adequate
funding for FSMA implementation.
n Increasing food security andstrengthening communities:We actively engage in public
policy discussions in this area,
including the following actions:
w Increasing food security – At the
federal level, we are a longtime
supporter of The Congressional
Hunger Center and are proud to
have received the 2018 Corporate
Partner Hunger Leadership
Award. We also work with several
initiatives to advance public
policy at the state level that
would increase food security.
w Protecting people – We advocate
for inclusive public policies
and add our voice to help lead
change, including for inclusive U.S.
immigration and LGBT policies.
w Strengthening our communities – In
addition to our philanthropic support
for our hometown communities, we
also develop important community
partnerships that drive economic
growth and increase connectiveness.
n Informing consumers and increasingawareness: We actively support
public policy efforts to inform
our consumers and increase their
awareness about our products. For
example, we are active members of
several organizations that provided
comments to the U.S. Department of
Agriculture (USDA) requesting that
more information about bioengineered
ingredients be made available to
consumers, not less. (See one example
here.) Learn more about initiatives
to increase transparency in the
Our Food section of this report.
Compliance: We comply with all
lobbying regulations where applicable.
General Mills is registered as a lobbying
entity at the federal level for the U.S.
House of Representatives and U.S.
Senate and in the states of Minnesota
and California. We file regular reports
on our lobbying activity (see links).
GRI 102-12, 13, 44
Political contributions and membershipsOur civic policy describes our approval
process for corporate political
contributions. The Public Responsibility
Committee of the Board of Directors
oversees the company’s political
activities, including our policy, disclosure
of corporate political contributions,
membership in major trade associations
and independent political expenditures
(although the company has not made
any). During 2018, we made US$2,500 in
direct political contributions. For more
details and historical information, see our
2005-2018 Civic involvement reports.
The General Mills Political Action
Committee (G-PAC) is run by employees
and uses employee funds to make
political contributions to federal and,
in limited cases, state candidates. No
corporate treasury funds are used for
federal candidate contributions, but as
allowed by law, the company pays G-PAC
administration costs. Information regarding
G-PAC transactions is available on the
Federal Election Commission’s website.
General Mills also advances its mission
by partnering with trade associations
and other independent organizations
that share our goals, including:
n International organizations, such
as EuroGlaces and the Brazilian
Association of Food Industries.
n U.S. public policy focused
organizations, such as the Grocery
Manufacturers Association and the
American Bakers Association.
n State or provincial agencies,
local chambers of commerce and
manufacturing organizations, such as
the Minnesota Chamber of Commerce
and the California Manufacturers
& Technology Association.
We report additional details about
our largest U.S. trade association
memberships annually in our civic
involvement reports. We do not belong
to, or make payments to, any tax-exempt
organizations in the United States that
write and endorse model legislation.
Accountability: In 2018, the Center for
Political Accountability rated General
Mills in the top five of the CPA-Zicklin
Index of Corporate Political Disclosure
and Accountability, and the top
food company. This ranking, which
includes all companies in the Standard
& Poor’s 500 index, maintained our
performance from past years.
GRI 415-1
CPA-Zicklin Index of Corporate Political Disclosure and Accountability
Top 5
GENERAL MILLS GLOBAL RESPONSIBILITY 09
Human rightsWe believe that societies, economies
and businesses thrive when human
rights are protected. Respect for human
rights is fundamental to our purpose
of serving the world by making food
people love and to our commitment
to ethical business conduct.
Our approachOur Policy on Human Rights outlines
our approach. We respect and
acknowledge internationally recognized
human rights principles. Within our
company and throughout our supply
chain, we are committed to treating
people with dignity and respect.
To inform our approach in this
area, we look to the UN Guiding
Principles on Business and
Human Rights, the UN Universal
Declaration of Human Rights, and the
International Labour Organization’s
1998 Declaration on Fundamental
Principles and Rights at Work.
The following also underpin our
commitment to human rights:
n General Mills’ Slavery and Human
Trafficking Statement, our Workplace
Standards and Ethical Sourcing Policy,
our Employee Code of Conduct and
our Supplier Code of Conduct
n Use of the Sedex Members Ethical
Trade Audit (SMETA) protocol
n Endorsement of the UN
Global Compact
n Signatory to the UN Women’s
Empowerment Principles
n Membership in AIM-PROGRESS,
a forum of consumer goods
manufacturers focused on
responsible sourcing
n Support for the Consumer Goods
Forum’s Forced Labour Resolution
and Priority Industry Principles
GovernanceThe Public Responsibility Committee
of the General Mills Board of Directors
oversees our work in this area.
Operational accountability rests with
Chief Supply Chain Officer, supported
by members of the members of
the leadership team including the
Chief Executive Officer and heads
of Legal and Human Resources.
GRI 407-1, 408-1, 409-1
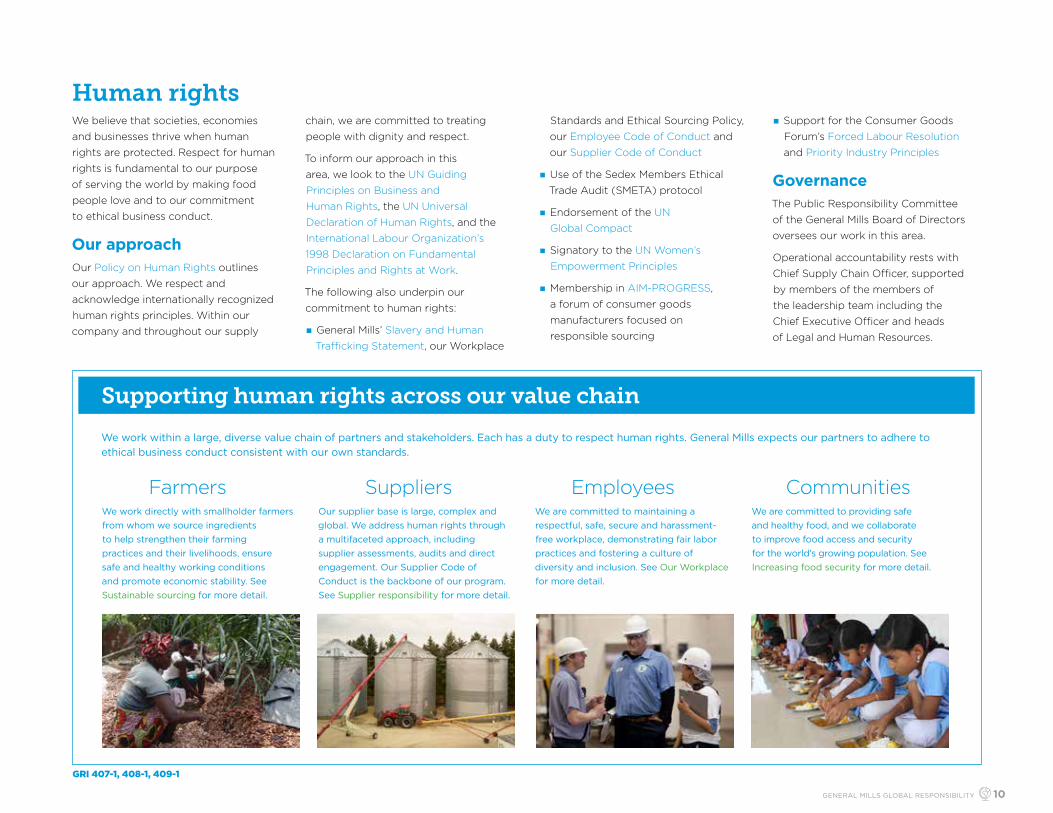
Supporting human rights across our value chain
We work directly with smallholder farmers from whom we source ingredients to help strengthen their farming practices and their livelihoods, ensure safe and healthy working conditions and promote economic stability. See Sustainable sourcing for more detail.
Our supplier base is large, complex and global. We address human rights through a multifaceted approach, including supplier assessments, audits and direct engagement. Our Supplier Code of Conduct is the backbone of our program. See Supplier responsibility for more detail.
We are committed to maintaining a respectful, safe, secure and harassment-free workplace, demonstrating fair labor practices and fostering a culture of diversity and inclusion. See Our Workplace for more detail.
We are committed to providing safe and healthy food, and we collaborate to improve food access and security for the world’s growing population. See Increasing food security for more detail.
Farmers Suppliers Employees Communities
We work within a large, diverse value chain of partners and stakeholders. Each has a duty to respect human rights. General Mills expects our partners to adhere to ethical business conduct consistent with our own standards.
GENERAL MILLS GLOBAL RESPONSIBILITY 10

About this report The General Mills Global Responsibility
Report describes our commitments,
goals, programs and performance
across a broad range of issues. The
company’s Global Sustainability
team has responsibility for the
development of the report. Ultimate
accountability lies with the General
Mills leadership team (see page 7).
The report is structured to explicitly
align with the company’s material
global responsibility issues.
The Global Responsibility Report is
an important part of a broader set of
disclosures that provide stakeholders
a multifaceted description of General
Mills’ performance, including the
company’s annual report, SEC filings
and annual proxy statement.
Report scopen The scope covers the company’s
global operations in fiscal 2018
(52 weeks ended May 27, 2018),
except where noted otherwise.
n Environmental data related to
General Mills’ production facilities
presented in this report and in
the Environmental Data Summary
is reported on a May-April basis
(through April of the year noted).
n This report does not include data
from Blue Buffalo Pet Products, which
General Mills acquired in April 2018.
n Our Scope 1, Scope 2 and a portion of
our Scope 3 greenhouse gas emissions
have been verified by Bureau Veritas.
n Unless otherwise noted, data in this
report is not externally verified and
may occasionally be restated due
to improvements in data collection
methodology and/or accuracy.
Stakeholder inputFor the last several years, General Mills
has engaged Ceres – a coalition of
investors, environmental organizations
and other public interest groups working
with companies to advance their
environmental and social performance
and disclosure – to provide input on our
annual Global Responsibility Report.
This year, nine stakeholders, including
investors, NGO representatives,
corporate practitioners and industry
experts, provided feedback on a
detailed report outline. We value this
input and have incorporated much
of their feedback into the report.
Reporting standardsn This report references the GRI 2016
Sustainability Reporting Standards,
as well as the Food Processing Sector
Supplement. See the GRI index
for details.
n This report references the Sustainability
Accounting Standards Board’s
(SASB) Processed Foods Standard.
See the SASB index for details.
n General Mills endorsed the principles of
the UN Global Compact in 2008. This
report serves as the company’s annual
Communication on Progress. See the
UN Global Compact index for details.
FeedbackWe welcome your comments about
this report. Please send any feedback
GRI 102-49, 50, 53, 54, 56
GENERAL MILLS GLOBAL RESPONSIBILITY 11

IN THIS SECTION
Health and wellness Food safety Consumer education and marketing
Transparency
In fiscal 2018, 81 percent of U.S. Retail sales volume met our Health Metric nutritional criteria.
General Mills is now the second-largest U.S. natural and organic food producer.
100 percent of our facilities worldwide are audited and/or certified by independent third parties using globally recognized food safety criteria.
2nd100%81%
Our FoodAt General Mills, our purpose is to serve
the world by making food people love.
GENERAL MILLS GLOBAL RESPONSIBILITY 12

Nutrition u Material issue | GRI 416-1, FP4, 6, 7
Health and wellness
Our approachOur goal: Our goal is to provide a diverse
portfolio of products that can contribute
to the well-being of consumers and
meet their various needs, including
nutrition. We are committed to making
food with passion and putting people
first by improving the variety and health
profile of our products while adhering
to high standards of food safety.
Investment in research: We invest
in research and development (R&D)
to continuously improve the health
profile of our products and help
us better understand the impact
of food on health and wellness.
Bell Institute of Health and Nutrition: General Mills’ global Bell Institute of
Health and Nutrition is the company’s
source for scientific health and
nutrition expertise that creates value
and growth for General Mills. The
Bell Institute influences General Mills’
product development through:
n Nutrition science research
n Insights on regulatory matters
n Health communications to customers,
nutrition communities and consumers
n Recommendations for product
innovation and reformulation
Learn more on the Bell Institute website.
Leadership and governance: Operationally, responsibility for
product development and marketing
lies within the R&D and marketing
organizations. The Chief Innovation,
Technology and Quality Officer
is responsible for product health
and safety, and product labeling.
Responsibility for marketing
communications is held by the
Chief Marketing Officer. The Bell Institute
of Health and Nutrition reports directly
to the Chief Innovation, Technology and
Quality Officer and regularly updates
the Public Responsibility Committee
of the Board of Directors on the
company’s health and wellness strategy.
Health and Wellness Advisory Council: Since 1989, we have benefited from
the guidance of our global Health and
Wellness Advisory Council, a group of
leading external health and nutrition
experts who provide perspective from
academia and research institutes. The
council meets regularly and challenges
us to continually advance health and
wellness strategies and practices.
CHIEF INNOVATION, TECHNOLOGY AND QUALITY OFFICER
HEALTH AND WELLNESS ADVISORY COUNCIL
PRODUCT MARKETING AND
COMMUNICATIONS
FOOD SAFETY AND
QUALITY
RESEARCH AND DEVELOPMENT
BELL INSTITUTE OF HEALTH AND
NUTRITION
CHIEF MARKETING OFFICER
CEO, CHAIRMAN OF THE BOARD
Nutrient-dense foodsAt General Mills, we provide a diverse portfolio of products, including many nutrient-dense foods, which can help consumers meet dietary recommendations and fit into a healthy eating pattern.
While we traditionally report our progress as increasing certain beneficial nutrients and reducing others, we also recognize that few foods are composed of a single nutrient. Consumption of nutrient-dense foods, like fortified cereals, low-fat and nonfat yogurts
and granola bars containing whole grain and/or fiber, plays an important role in healthy diets. They are important contributors to consumption of key food groups, including whole grains and dairy, and beneficial nutrients like vitamins, minerals, protein and/or fiber, while balancing nutrients to limit. Focusing on nutrient density helps tell the whole story about the nutritional value of a food – beyond what has been increased or reduced – to help support consumers in adopting healthy dietary patterns.
Cheerios, Fiber One and Lucky Charms are examples of nutrient-dense cereals that provide beneficial nutrients, such as key vitamins and minerals, whole grain and fiber. Low-fat and nonfat yogurts, like Yoplait Original Style Yogurt, Go-GURT, Yoplait Light, Greek 100, YQ and Petits Filous yogurt are also nutrient-dense choices. They are important sources of essential nutrients, such as protein, calcium, and often vitamins A and D.
GENERAL MILLS GLOBAL RESPONSIBILITY 13
Our Food Our Planet Our Workplace Our Community
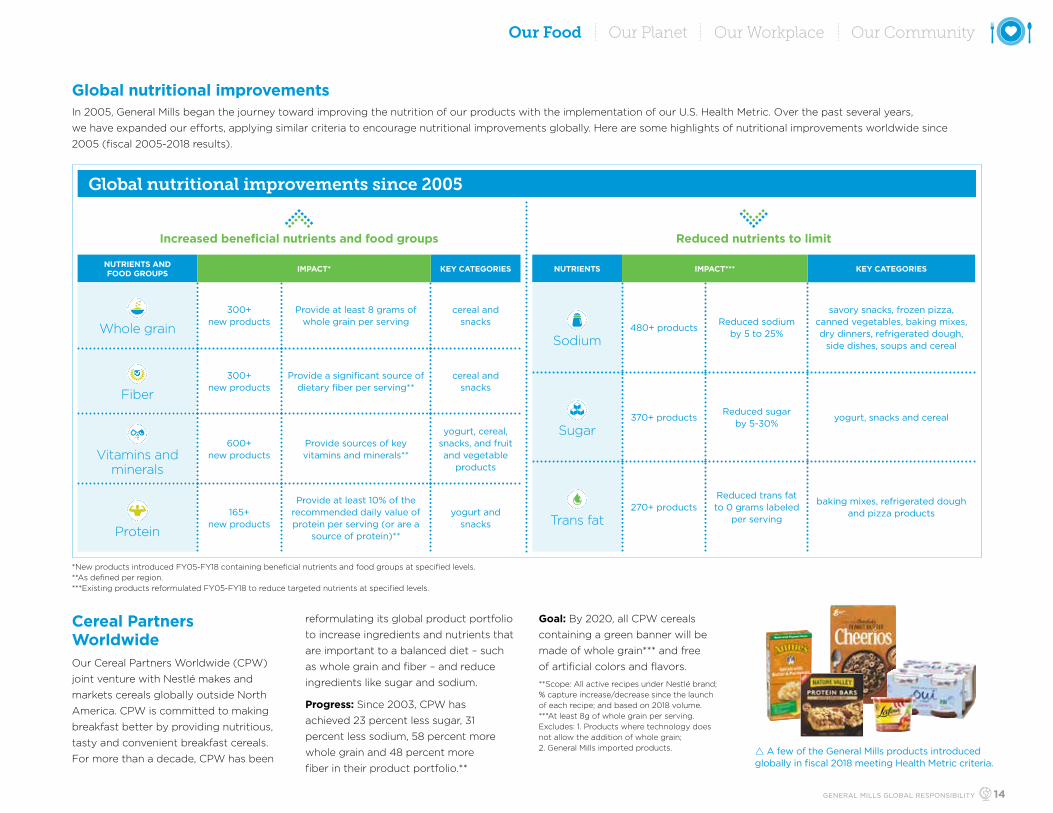
Global nutritional improvementsIn 2005, General Mills began the journey toward improving the nutrition of our products with the implementation of our U.S. Health Metric. Over the past several years,
we have expanded our efforts, applying similar criteria to encourage nutritional improvements globally. Here are some highlights of nutritional improvements worldwide since
2005 (fiscal 2005-2018 results).
Increased beneficial nutrients and food groups
NUTRIENTS AND FOOD GROUPS IMPACT* KEY CATEGORIES
Whole grain
300+ new products
Provide at least 8 grams of whole grain per serving
cereal and snacks
Fiber
300+ new products
Provide a significant source of dietary fiber per serving**
cereal and snacks
Vitamins and
minerals
600+ new products
Provide sources of key vitamins and minerals**
yogurt, cereal, snacks, and fruit and vegetable
products
Protein
165+ new products
Provide at least 10% of the recommended daily value of protein per serving (or are a
source of protein)**
yogurt and snacks
Reduced nutrients to limit
NUTRIENTS IMPACT*** KEY CATEGORIES
Sodium
480+ productsReduced sodium
by 5 to 25%
savory snacks, frozen pizza, canned vegetables, baking mixes, dry dinners, refrigerated dough,
side dishes, soups and cereal
Sugar
370+ productsReduced sugar
by 5-30%yogurt, snacks and cereal
Trans fat
270+ productsReduced trans fat to 0 grams labeled
per serving
baking mixes, refrigerated dough and pizza products
Global nutritional improvements since 2005
Cereal Partners WorldwideOur Cereal Partners Worldwide (CPW)
joint venture with Nestlé makes and
markets cereals globally outside North
America. CPW is committed to making
breakfast better by providing nutritious,
tasty and convenient breakfast cereals.
For more than a decade, CPW has been
reformulating its global product portfolio
to increase ingredients and nutrients that
are important to a balanced diet – such
as whole grain and fiber – and reduce
ingredients like sugar and sodium.
Progress: Since 2003, CPW has
achieved 23 percent less sugar, 31
percent less sodium, 58 percent more
whole grain and 48 percent more
fiber in their product portfolio.**
Goal: By 2020, all CPW cereals
containing a green banner will be
made of whole grain*** and free
of artificial colors and flavors.
**Scope: All active recipes under Nestlé brand; % capture increase/decrease since the launch of each recipe; and based on 2018 volume. ***At least 8g of whole grain per serving. Excludes: 1. Products where technology does not allow the addition of whole grain; 2. General Mills imported products. r A few of the General Mills products introduced
globally in fiscal 2018 meeting Health Metric criteria.
*New products introduced FY05-FY18 containing beneficial nutrients and food groups at specified levels.**As defined per region.***Existing products reformulated FY05-FY18 to reduce targeted nutrients at specified levels.
GENERAL MILLS GLOBAL RESPONSIBILITY 14
Our Food Our Planet Our Workplace Our Community

Spotlight: U.S. Health MetricSince its inception in 2005, more than 1,500 products have been included in the U.S. Retail Health Metric. In fiscal 2018, 81 percent of our U.S. Retail sales volume met Health Metric criteria.
U.S. Retail Health Metric achievement FY05-FY18
More than 1,500 products included in FY05-FY18
FY13 FY14 FY15 FY16 FY17 FY18FY12FY11FY10FY09FY08FY07FY06FY05
16%21%
33%40%
45%
60%64%
68%73% 76% 77% 79% 80% 81%
Drivers of nutritional improvements U.S. Retail sales volume FY05-FY18*
16% Products with increase in beneficial nutrients
n Whole grainn Fibern Vitamins/mineralsn Protein
n Sodiumn Sugarn Trans fat
n Saturated fatn Total fat
46% Products with
both increase in beneficial nutrients
AND decrease in nutrients to limit
38% Products with decrease in
nutrients to limit
FY2018 U.S. Retail Health Metric volume:
U.S. Health Metric criteria:
n Reduce calories, fat, saturated
fat, trans fat, sugar or sodium by
5 percent or more per serving.
n Increase beneficial nutrients – including
vitamins, minerals and fiber – by
10 percent or more per serving.
n Formulate/reformulate products
to include 8 grams of whole grain
or at least a half-serving of fruit,
vegetables, or low or nonfat dairy.
n Formulate/reformulate products to
meet specific internal requirements,
including limiting calories, and
meeting health or nutrition claim
criteria as defined by the U.S. Food
and Drug Administration (FDA).
*The information on this diagram shows efforts we have made to improve the nutrition profile of our products. Divested products are not included.
n 19 percent of our North American product SKUs (300+ products) contain at least 10 percent of the recommended daily value of fiber per serving. Examples include Fiber One Snack Bars and ready-to-eat cereals.
Fiber
n 62 percent of our North American product SKUs (1,250+ products) have 150 calories or less per serving.
n 30 percent of our North American product SKUs (700+ products) have 100 calories or less per serving.
CaloriesCal
n 11 percent of our U.S. retail product SKUs (190+ products) provide at least 10 percent of the daily value of protein per serving.
n 29 percent of our Canadian retail product SKUs (165 products) are a source of protein.
Protein
Spotlight: Nutritional impacts across our North American portfolio*
n At breakfast, Big G cereals are the No. 1 source of whole grain for Americans.
n 20 percent of our North American product SKUs (550+ products) contain at least 8 grams of whole grain per serving. Examples include ready-to-eat cereals and grain-based snack bars.
Whole grain
n 24 percent of our U.S. retail product SKUs (300+ products) provide at least 10 percent of the recommended daily value of calcium per serving.
n 45 percent of our Canadian retail product SKUs (200+ products) are a source of calcium. Examples include yogurt products, fortified cereals and Annie’s Macaroni & Cheese products.
Calcium
*Status as of FY18; includes current products meeting specified criteria.
GENERAL MILLS GLOBAL RESPONSIBILITY 15
Our Food Our Planet Our Workplace Our Community

Our approach: At General Mills, diverse
and evolving consumer needs are at the
center of our business. We include the
voice of our consumers in every decision
we make by understanding their needs,
motivations, values and behaviors. We
consistently monitor key trends and
macro forces that can drive change in
the way people eat and interact with
our brands. Three key consumer-driven
trends that are influencing important
initiatives at General Mills include
responsible living, wellness and balance,
and changing demographic landscapes.
Responsible livingThe combination of an intensifying
pull on natural resources and greater
awareness of social issues is leading to
more personal consumer action. People
increasingly are mindful of factors greater
than themselves – others, animal welfare
and the environment – in their decision-
making. For example, General Mills
natural and organic brands, like Annie’s,
Epic, Cascadian Farm and Muir Glen,
continue to fully integrate sustainability
as a standard operating principle. In
April 2018, we acquired Blue Buffalo, a
mission-driven natural pet food business.
Wellness and balanceAs access to information grows, people
are taking a more proactive and holistic
approach to health and wellness.
Wellness incorporates everything
from physical health to whole body
health, including mental health aspects.
Food options across this wellness
continuum increasingly are available
in a variety of food categories, such
as snacks and yogurt. For example:
n General Mills products recently
launched include YQ by Yoplait,
which delivers an excellent source of
protein with less sugar, and Oui by
Yoplait French-style yogurt focused
on simple, everyday pleasure.
n General Mills is the fourth-largest
producer of gluten-free products
in the U.S.* One in five of our
North American products is
labeled as gluten-free. In 2018, we
offered more than 900 gluten-free
product SKUs in North America.
n 301 INC, General Mills’ business
development and venture capital
unit, invests in products that
deliver options like plant-based
dairy alternatives, nutrition-driven
granola and probiotic drinks.
Changing demographic landscapeShifts in population demographics and
consumer attitudes result in changing
preferences and needs. For example, half
of General Mills consumers are multi-
cultural or 55+ years old. Multicultural
families and Baby Boomers, who are
becoming empty nesters and moving
into retirement, increasingly are looking
for products that fit their varied lives.
For example, Betty Crocker Mug Treats
offer single-serving options for smaller
households, while innovations such as
Cinnamon Toast Crunch Churros Cereal
have multicultural consumers in mind.
Diverse consumer needs u Material issue
Our approach: Today’s fast-changing food industry requires rapid innovation and a steady stream of new ideas. In 2015, General Mills began to invest in small food start-ups through 301 INC, the company’s business development and venture capital unit. The 301 INC team helps expand the vision of entrepreneurs
with promising early-stage brands and also helps make their food products accessible to more people. By combining the vision and passion of these entrepreneurs with General Mills’ extensive capabilities in areas such as product development, supply chain, marketing, operations and channel development, we believe we can meet consumer needs faster than ever.
Our progress: We continue to grow our portfolio and support for entrepreneurial brands. In fiscal 2018, we:
n Added Urban Remedy and GoodBelly Probiotics, two high growth potential companies, to our portfolio.
n Heavily reinvested in dairy-free yogurt maker Kite Hill to help meet consumer demand for more plant-based options.
Partners: As of November 2018, we have 10 partners:
Investing in food innovations
TREND | COMPASS
r General Mills constantly monitors key food trends, including the items highlighted in this trend compass.
*Nielsen xAOC; 52 weeks ending Dec. 29, 2018.
In fiscal 2018, we introduced more than 250 new products in the U.S. to meet diverse consumer needs.
250+
GENERAL MILLS GLOBAL RESPONSIBILITY 16
Our Food Our Planet Our Workplace Our Community

Since 2000, we have steadily expanded our natural and organic business, including through brand acquisitions, to meet growing consumer demand. We offer a mix of certified organic cereals, yogurt, vegetables, fruit products, snacks, meals and baking products.
Our progress:
n Scale – General Mills is now the second-largest U.S. natural and organic food producer.*
n Products – One out of every 12 products in our North American portfolio is certified organic or made
with organic ingredients; approximately 370 organic product SKUs are available throughout the U.S. and Canada.
n Growth – We committed to growing our natural and organic food business to US$1 billion in net sales by 2019, and reached US$1.058 billion in fiscal 2018.**
Sustainable supply: We are also taking steps across our supply chain to ensure a long-term supply of organic ingredients. Learn more about how we are building our organic capacity in the Our Planet section of this report.
Natural and organic brands
®
®
Our natural and organic brands
*Based on SPINS NOMC Dashboard data through Sept. 16, 2018. **Nielsen updated through May 26, 2018; Natural Supermarkets updated through May 27, 2018; Whole Foods updated through May 26, 2018.
Food safety u Material issue | GRI 416-1, 2, FP5
Our approachSafety is a priority for our company
and central to our culture. Leading
with safety – both in the workplace
and the food we make – is one
of the key operating principles
that guides our work.
Investment: We invested US$14.4 million
into food safety in fiscal 2018; equal
to 7.6 percent of our total essential
capital investment for the year.
Collaboration: Food safety leadership
is a differentiator for General Mills, but
not an area of competition. We freely
share our best practices and emerging
areas of concern, as well as collaborate
with industry peers and regulators to
help raise standards industrywide.
Systems: Our global food safety
systems focus on prevention,
intervention and response:
n Processes – Food safety is
integrated into all our processes,
beginning with R&D and extending
across our supply chain.
n Risk mitigation – We conduct
internal risk-based surveillance and
food safety testing at all General Mills
facilities to identify and prioritize
specific areas of risk.
n Audits – Our Global Internal Audit
team periodically audits the
effectiveness and efficiency of
food safety controls and operating
procedures. Results are reported to
the company’s Global Governance
Council and Board of Directors.
n Traceability – Our inventory control and
supplier management systems include
the ability to trace the sources of our
ingredients, which is key to isolating risks
in the event of food safety concerns. We
evaluate our suppliers’ systems to ensure
they meet our traceability requirements.
Training: We provide food safety
training through our global centers
of excellence and online training
academy. In fiscal 2018:
n Our General Mills food safety
team included more than 400
trained quality professionals.
n We conducted Auditor Academy
training sessions attended by 25
participants from two countries.
These sessions help improve our
ability to identify and fix issues,
as well as prevent food safety
problems from occurring.
n We provided food safety training
to more than 3,500 professionals
across the supply chain.
GENERAL MILLS GLOBAL RESPONSIBILITY 17
Our Food Our Planet Our Workplace Our Community

Governance:
n Detailed policies – Governance
of General Mills’ food safety and
regulatory matters begins with a
corporate Food Safety and Regulatory
Policy signed by our Chief Executive
Officer. This corporate policy is
supported by 18 detailed policies
with accompanying standards and
guidance documents. These global
policies cover a broad range of food
safety areas, including regulatory
compliance, trace and recall, labeling,
claims, physical, chemical and
biological hazards, transportation,
and good manufacturing
practices and sanitation.
n Leadership – The Vice President
of Food Safety and Quality has
direct responsibility for food
safety. The Global Internal Audit
team periodically validates that
our food safety processes and
controls are operating effectively.
The company’s Global Governance
Council conducts a quarterly review
of risk, which includes food safety.
PerformanceOur goals:
n 100 percent of General Mills facilities
third-party audited and/or certified.
n 100 percent Global Food Safety
Initiative (GFSI) certification of all
General Mills owned facilities by 2020.
Our progress: External verification and
certification of our facilities includes:
n 100 percent of our facilities worldwide
are audited and/or certified by
independent third parties using globally
recognized food safety criteria.
n 84 percent of our company-owned
production facilities are GFSI certified,
indicating they meet global standards
for food safety management
recognized in more than 150 countries.
Recalls: When we learn about illnesses
that may be linked to our products,
we take quick action. We collaborate
with health officials to investigate the
situation, communicate with consumers
and issue voluntary product recalls
to remove affected products from
store shelves, when appropriate. We
conducted five voluntary product
recalls globally in fiscal 2018 (compared
to nine in fiscal 2017), including
recalls of snack bars, cereal, yogurt,
and fat and tallow products.
SuppliersOur approach:
n Audits – To help ensure the safety of
the raw materials (ingredients and
packaging) we use in our products,
we continue to expand the number
of supplier and co-producer audits
we conduct globally. We perform
direct audits and also encourage
third-party audits and/or certification,
such as through GFSI, as an additional
preventive control measure.
n Supplier training – We bring together
our suppliers around the world to
share food safety knowledge and
communicate food safety expectations.
We conduct supplier training in
classroom settings tailored to the needs
of each market. The seminars address
topics such as biological and physical
hazard controls, allergen management
and production facility sanitization.
Our progress:
n 836 supplier audits were
conducted in 2018.
n 98 co-producer audits were
conducted in 2018.
n 78 percent of our global co-production
sites are GFSI certified.
n 65 percent of global ingredient
suppliers and 92 percent of our North
American ingredient vendor sites are
GFSI certified.
n 300+ suppliers were trained through
supplier schools and webinars in 2018.
n 950+ supplier representatives
participated in training sessions
in Australia, Brazil, China,
India, Spain, Taiwan, Thailand
and the U.S. since 2011.
100 percent of General Mills facilities are third-party audited and/or certified for food safety.
100%
GENERAL MILLS GLOBAL RESPONSIBILITY 18
Our Food Our Planet Our Workplace Our Community

Consumer education GRI 417-1, FP4, 8
Consumer education and marketing
Our approach: General Mills provides
useful, fact-based information on
packages to help consumers make
informed dietary choices. Our
product packages display accurate
nutrition labeling as prescribed by
regulations in the country of sale.
Our commitment: As a member of
the International Food and Beverage
Alliance (IFBA), General Mills has
made a commitment to adopt a
common global approach to nutrition
information on packaging that includes,
at minimum, the labeling of calories
on front-of-pack. This initiative was
implemented globally during 2014-
2016 to inform consumers about
specific product nutrition attributes.
Our progress: Around the world,
our product labeling meets local
regulatory requirements while remaining
consistent with our global approach.
Examples of our compliance with local
and regional guidelines include:
n Argentina and Brazil – All General
Mills package information complies
with local regulations and includes the
energy icon on the front of packaging.
n Australia – The majority of our products
displayed nutrition intake information
on front-of-pack labeling in fiscal 2017,
consistent with the Australian Daily
Intake Guide and IFBA requirements.
n Canada – All General Mills package
information complies with Health
Canada and Canadian Food Inspection
Agency labeling requirements.
n Europe – All General Mills
package information complies
with European Food Information
to Consumers Regulation.
n U.S. – The majority of our U.S. products
now feature front-of-package labeling.
In the U.S., General Mills supports product
labeling changes to help reduce food
waste through clearer guidance for
consumers about food shelf-life. As of
November 2018, we have updated more
than 60 percent of our product packaging
to comply with this voluntary date-labeling
initiative that uses standard nomenclature
to reduce consumer confusion. Learn
more about General Mills’ food waste
reduction efforts in the Our Planet and
Our Community sections of this report.
Responsible marketing u Material issue | GRI 417-1, FP8
Our approach: Whether marketing to
children or adults, we present the qualities
and advantages of our products truthfully,
responsibly and with appropriate taste.
We take special care with respect to
child audiences. We believe that children
should be encouraged to consume
lower-calorie, nutrient-dense foods that
support their growth and activity.
Policies: General Mills’ marketing
policies ensure that our commitment
to responsible marketing underlies all
of our marketing activities. Our child-
directed advertising promotes only
lower-calorie, nutrient-dense products
and respects three key steps to healthier
living: balance, moderation and physical
activity. We take particular care around
the content and nature of advertising
directed to children – including pre-
screening of our ads by the Better
Business Bureau’s Children’s Advertising
Review Unit in the United States.
General Mills’ marketing policies are
reviewed and updated annually by
our company’s Responsible Marketing
Council and reviewed with the
company’s Chief Executive Officer
and other senior leaders of our U.S.
and international operating units. We
adhere to strict internal and industry
guidelines – that in many cases are more
demanding than local regulations – in
producing and reviewing ads to ensure
they are appropriate for the intended
audience. Beyond complying with
applicable law, we ensure that our ads
are consistent with our core values.
When possible, our advertising aims to
reflect the diversity of society. And our
advertising reflects generally accepted
standards of social behavior, avoids
stereotyping people and does not insult
or demean any demographic groups.
Global commitment: As charter
members of IFBA, we joined other
leading food and nonalcoholic beverage
companies in a public letter to the
Director General of the UN’s World
Health Organization in September 2014
communicating a set of enhanced global
commitments that included responsible
marketing and advertising initiatives.
These standards encompassed
commitments around product
reformulation and innovation as well as
r The Annie’s Macaroni & Cheese box on top shows the new standard “best if used by” date label.
GENERAL MILLS GLOBAL RESPONSIBILITY 19
Our Food Our Planet Our Workplace Our Community

Transparency u Material issue | GRI 417-1, FP8
Our approach: At General Mills, we are
committed to increasing transparency
about our food. We recognize that
consumers, regulators, investors and other
stakeholders seek information about our
products and processes. Consumers want
to know what’s in their food, where it
comes from and how it is prepared. They
also want assurance that food has been
grown and harvested in a responsible
and sustainable manner that respects
people, animals and the environment.
As we continue our journey to increase
transparency, our focus is on providing
information to key stakeholders when
and where they need it. For example, to
help consumers learn more about what
is in their food, we provide information
in multiple ways – on packages, through
our company and brand websites, on
our brands’ social media channels and
on third-party sites, such as e-commerce
and transparency platforms.
Our progress: Some examples
of our current transparency
initiatives are outlined here.
n Annie’s introduced products in April
2018 with information on each package
stating that ingredients used to make
a common global approach to providing
nutrition information on packaging,
at the point of sale and through other
channels by the end of 2016. The
enhanced commitments included an
expansion of IFBA’s global marketing
policy, in place since 2009, which
specified that members would only
advertise products that meet better-for-
you criteria or refrain from all product
marketing to children under 12 years old.
The 2014 commitments strengthened
that policy in three core areas: media,
marketing and harmonized criteria. The
policy covers virtually all media and
certain marketing techniques directed at
children under the age of 12. Members
have committed to working toward
harmonizing global nutrition criteria to
ensure that better-for-you foods are
based on robust common standards.
To bolster our global commitment to
comply with the IFBA pledge, General
Mills follows the Children’s Food and
Beverage Advertising Initiative (CFBAI)
nutrition standards in markets where
other regulatory or self-regulatory
standards do not exist. In other words,
we comply with strict nutrition standards
for advertising to children under age 12
in all markets in which we operate, either
the locally-applicable standards (if we are
subject to a self-regulatory or regulatory
program in that market) or the CFBAI
standards (if nothing else is otherwise
applicable in that market). Locally-
applicable programs include the following:
n Australia – Responsible Child
Marketing Initiative of the Australian
Food and Grocery Council
n Brazil – Enhanced Commitment
to Responsible Advertising
to Children pledge
n Canada – Canadian Children’s
Food and Beverage Advertising
Initiative requirements
n Europe – EU Pledge requirements
n Singapore – Singapore Food and
Beverage Industry Responsible
Advertising to Children Initiative
n U.S. – CFBAI requirements
We fully comply with all requirements
of these programs. CFBAI, in particular,
publishes a report annually that
addresses the compliance of all of its
participants. We are not aware of any
instance of non-compliance by General
Mills in the past several years, and
CFBAI has confirmed this in its reports.
In the unlikely event of any instance
of non-compliance, a core function
of our Responsible Marketing Council
would be to address such issues and
determine appropriate corrective action.
Beyond our commitments under the
programs described above, we have
made additional responsible marketing
commitments that exceed industry
norms. For example, we have adopted
industry-leading standards regarding
the responsible use of social media
platforms. We do not, in the context
of any child-directed communication,
encourage children to visit any social
media service for which they are too
young (according to the terms of
those services), nor do we use our own
presence on these social media platforms
to direct any communications to children.
We have also long committed to refrain
from marketing food to children in schools
or at school events – and this commitment
applies to all schools, even middle schools
and high schools. This commitment
covers all forms of marketing (beyond the
identification of the brand and product
on menus and packaging). For example,
we do not depict or display food brands,
products or logos on posters, signs,
scoreboards or school equipment, nor do
we market foods by distributing product
samples or branded merchandise in
schools. There are no exceptions to this
commitment. In the United States, we
operate the Box Tops for EducationTM
school fundraising program which,
through sales of our products and those
of many other companies (primarily
nonfood companies), has provided
close to US$1 billion to schools since the
program’s inception in 1996. Though
schools are the beneficiaries of this
program, we refrain from marketing the
program to school children (whether
inside or outside the school environment).
In September 2018, General Mills joined
other food and beverage companies
in signing a letter to the UN Secretary
General highlighting commitments and
achievements to reduce the burden of
non-communicable diseases in support
of UN Sustainable Development Goal 3.4.
20
Our Food Our Planet Our Workplace Our Community

the limited-edition organic Honey
Bunny Grahams and Elbow Pasta &
Cheddar were grown in a way that
regenerated the soil. The ingredients –
wheat, peas and oats – were traceable
to two farms in Montana through a
specially designed, segregated supply
line. Annie’s regularly shares stories
about its contributions to a better
food system through its website
(including the Farm-to-Yum framework
and its Why Organic and Soil Matters
pages) and social channels.
n In October 2018, Epic Provisions
debuted the first product in the
U.S. featuring the Land to Market
Ecological Outcome Verification
(EOV) seal. The verification program
measures soil health improvements
resulting from sustainable land
management practices, so consumers
know the brand’s meat
snacks are made
from beef cattle
that were raised by
ranchers in a way
that protects the land.
n We provide consumers with answers
to questions about our food at
askgeneralmills.com, including
frequently asked questions, videos,
blogs and other content. The site
includes 521 topics ranging from food
ingredients to gluten-free products and
use of GMOs. More than 58,760 users
visited the site during the 12-month
period ending November 2018.
n In the U.S., we provide product
details through SmartLabel™, an
industry initiative that seeks to share
digital product information with
consumers. As of June 2018, we
have over 300 products listed on
smartlabel.org. This information also
can be accessed by downloading
the SmartLabel app and scanning a
participating UPC or SmartLabel QR
code (if available on packaging).
Responsible sourcing: Details about
our ingredients, how they are sourced
and how we engage with farmers are
included in responsible sourcing content
in the Our Planet section of this report.
Safety: Safety is our highest priority, and
we find broad global consensus among
food and safety regulatory bodies that
approved GMOs are safe. Learn more.
Our approach: We agree with the UN’s
World Health Organization (WHO)
that the development of genetically
modified organisms (GMOs) offers
the potential for increased agricultural
productivity and improved nutritional
value that can enhance human health
and development. Incumbent with any
technology use is the need for supply
chain stakeholders to regularly review,
identify and address issues associated
with the technology, including pest
and weed resistance. Learn more.
Alternatives: We respect consumers’
varying views on the use of biotechnology.
We offer organic and non-GMO
alternatives in most of our major product
categories in the U.S. Learn more.
Transparency: We are committed to
transparency and have been disclosing
the presence of bioengineered
ingredients on our U.S. packages
since 2016. The U.S. Department of
Agriculture has finalized rules for
disclosure moving forward, and we
will continue to voluntarily disclose
the presence of bioengineered
ingredients on our U.S. packages using
the allowed text under the rule.
We respect consumers’ varying views on the use of biotechnology. We have enrolled 400 products – especially our organic products – in the
U.S. Non-GMO Project, a nonprofit organization that provides information to consumers and third-party verification for non-GMO food and products.
Non-GMO Project
r Annie’s is committed to making foods that leave the planet better than we found it by advancing organic and regenerative farming practices.
WATCH VIDEO
Biotechnology u Material issue | GRI FP8
GENERAL MILLS GLOBAL RESPONSIBILITY 21
Our Food Our Planet Our Workplace Our Community

IN THIS SECTION
Climate change
Water stewardship
Regenerative agriculture
Sustainable sourcing
Responsible sourcing
Our greenhouse gas emissions footprint decreased 13 percent in 2018 compared to 2010.
13%
We have invested over US$4 million in soil health initiatives through 2018.
85 percent of our 10 priority ingredients were sustainably sourced in 2018.
85%
Our PlanetOur sustainability mission is to
treat the world with care.
$4+million
GENERAL MILLS GLOBAL RESPONSIBILITY 22

At General Mills, we are committed to treating the world with care, not just today but for generations to come. The health of our
business depends on the health of our planet. The areas of greatest environmental impact in our supply chain – including more
than two-thirds of GHG emissions and 99 percent of water use – occur outside General Mills’ operations, primarily in agriculture.
We collaborate to drive change by promoting environmentally and socially responsible practices across our entire value chain,
from farm to fork and beyond.
STRONG ecosystems BETTER lives for farmersSTABLE climate HEALTHY watersheds
We collaborate with
farmers, suppliers, retailers
and consumers to drive
transformation and combat
climate change. Our goal is to
reduce absolute GHG emissions
across our full value chain by
28 percent by 2025 (compared
to 2010). Learn more.
We focus on water usage
from watershed to production,
to increase efficiency and
resiliency. Our goal is to
champion the activation of
water stewardship plans for
the most material and at-risk
watersheds in our global value
chain by 2025. Learn more.
We promote regenerative
agriculture to protect and
intentionally enhance natural
resources and farming
communities. Our goal is to
advance regenerative farming
practices on 1 million acres of
farmland by 2030. Learn more.
We are committed to
improving the environmental,
social and economic impacts
of raw material sourcing.
Our goal is to sustainably
source 100 percent of our
top 10 priority ingredients
by 2020. Learn more.
We collaborate with our
global supplier base to make
our products with high
ethical standards; ensure
respect for workers and the
environment; expand economic
opportunities; and protect
animal welfare. Learn more.
Overview
Our sustainability pillars
Our actions
Climate change
Water stewardship
Regenerative agriculture
Sustainable sourcing
Responsible sourcing
GENERAL MILLS GLOBAL RESPONSIBILITY 23
Our Food Our Planet Our Workplace Our Community

Leadership and governance: At General
Mills, our Chairman and Chief Executive
Officer has ultimate accountability for
sustainability, which is included in his
annual performance objectives and
impacts his compensation. The Chairman
and CEO convenes the Sustainability
Governance Committee three times each
year to review and approve strategies,
programs and key investments.
Oversight of the company’s sustainability
work is provided by the General Mills
Board of Directors’ Public Responsibility
Committee, which regularly reviews
the company’s sustainability objectives,
strategies and performance.
The company’s Chief Sustainability Officer
stewards the company’s sustainability
work, reporting to the Chief Supply Chain
Officer, and working closely with the
Vice President of Global Sourcing and
other key business leaders to develop,
coordinate and execute programs
to achieve companywide targets.
GRI 102-9, 26
BOARD OF DIRECTORS’PUBLIC RESPONSIBILITY
COMMITTEE
CHIEF SUPPLY CHAIN AND GLOBAL BUSINESS
SOLUTIONS OFFICER
SUSTAINABILITY GOVERNANCE COMMITTEE
CEO, CHAIRMAN OF THE BOARD
CHIEF SUPPLY CHAIN AND GLOBAL BUSINESS
SOLUTIONS OFFICER
CHIEF INNOVATION, TECHNOLOGY AND QUALITY OFFICER
CHIEF MARKETING OFFICER
VP, CHIEF SUSTAINABILITY
OFFICER
VP, GLOBAL SOURCING
VPs, SUPPLY CHAIN
CEO, CHAIRMAN OF THE BOARD
Climate change presents risks to humanity,
our environment and our livelihoods.
Changes in climate not only affect
global food security but also impact our
ability to deliver quality products to our
consumers and value to our shareholders.
Risks: We have assessed the risks
associated with climate change and
their potential impact on our business.
Physical risks include supply chain
disruption due to severe weather
impacting a facility, or commodity
disruption for specific geographically
concentrated ingredients such as cocoa
from West Africa or almonds from
California. We have active mitigation
plans in place to address and minimize
these types of disruptions. Reputational
risks could arise from not addressing
the emissions in our supply chain.
We are doing our part to reach an
aggressive greenhouse gas (GHG)
emissions reduction target and positively
influence the broader value chain. While
regulatory changes present potential
risks, we expect changes in the area of
climate change would impact all food
companies in a similar manner without
significant competitive disadvantage.
Policy: Our General Mills Policy on Climate,
which focuses on mitigation, adaptation,
disclosure and advocacy, establishes a
framework to track and reduce GHG
emissions across our value chain.
Collaboration: We directly control
only a small portion of our value chain,
so driving transformation across the
entire system requires leadership
and collaboration with suppliers,
farmers, packaging producers, product
transport providers, retailers and
consumers. We drive progress through
partnerships and key initiatives, such
as our work with The Land Institute
and The Nature Conservancy (TNC)
to advance regenerative agriculture
and soil health, as well as with Field to
Market: The Alliance for Sustainable
Agriculture. See Agriculture and
transformation for more details.
Combating climate change also requires
collective action across industries and
our broader society. We are a founding
member of the Climate Collaborative
and have made public commitments to
tackle climate change in seven areas:
agriculture, food waste, transportation,
energy efficiency, short-lived climate
pollutants, forests and packaging.
Climate change u Material issues: Climate change; energy use; food waste; packaging footprint | GRI 301 2-3, 302 1-4, 305 1-5, 306-2
Recognition in 2018n CDP Climate Change (A List)
n CDP Water Security (A List)
n 100 Best Corporate Citizens (No. 1 in industry), Corporate Responsibility
n Dow Jones Sustainability Index (member of North American and World indices)
n FTSE4Good Index (member)
n 100 Most Just Companies (No. 1 in industry), Forbes/JUST Capital
n MSCI Index (AA rating)
n Green Ranking (No. 2 in industry), Newsweek
GENERAL MILLS GLOBAL RESPONSIBILITY 24
Our Food Our Planet Our Workplace Our Community

We also participate in the
following initiatives:
n Science Based Targets initiative (SBTi)
n Business for Innovative Climate &
Energy Policy (BICEP) coalition
n We Mean Business
n New York Declaration on Forests
n UN Caring for Climate Declaration
Science-based goal: Reduce absolute
GHG emissions across our full value
chain by 28 percent by 2025 (compared
to 2010). Our longer-term goal is to
achieve sustainable emissions levels
by 2050. This goal is approved by
the Science Based Targets initiative.
Performance: In 2018, our GHG
emissions footprint decreased 13
percent compared to our 2010 baseline,
while net sales rose 6 percent during
that period. This reflects sales of lower
GHG emissions intensive products,
as well as improved efficiency in
manufacturing and logistics. Our GHG
emissions fell 4 percent versus 2017,
while net sales increased 1 percent.
We plan to accelerate recent progress
to reach our emissions reduction goals.
Our ongoing challenge is to decrease our
footprint while growing our business.
See the Appendix for details on our
GHG emissions calculation methodology.
For information on the risks and
opportunities General Mills faces
due to climate change, see our CDP
submission online.
Value chain: The sections on the
following pages break down our footprint
by value chain phase and describe
our efforts to improve performance.
* General Mills worked with Quantis, a sustainability and life-cycle assessment (LCA) consulting firm, to calculate our company’s GHG emissions footprint. The calculation methodologies align with the Greenhouse Gas Protocol, developed by World Resources Institute (WRI) and World Business Council for Sustainable Development (WBCSD). Relative size of value chain segments for 2025 and 2050 are based on 2010 data. Differences compared to the datareported last year are due to enhancements in calculation methodologies and accuracy.
** Compared to 2010.
The path to 2050*
2010
17.7
12.8
7.7
15.316.0
20182017 2025 2050
Consuming
Selling
Shipping
Producing
Packaging supply chain
Agriculture and transformation0
Mill
ion
met
ric
tons
CO
2e
15
20
10
5
2050 goal** Reduce absolute GHG emissions across our full
value chain to sustainable levels in line with scientific consensus
41-72%
28%
2025 goal** Reduce absolute GHG emissions across our full
value chain by 28 percent
GENERAL MILLS GLOBAL RESPONSIBILITY 25
Our Food Our Planet Our Workplace Our Community

EMISSIONS (MILLION METRIC TONS CO2E)
EMISSIONS (MILLION METRIC TONS CO2E)
Agriculture and transformation
represents the largest source of GHG
emissions across our value chain, so
it is central to our reduction efforts.
Performance: Greenhouse gas emissions
in this category decreased 17 percent in
2018 compared to our 2010 baseline. This
was primarily due to reduced purchases
of GHG emissions intensive ingredients,
such as dairy products. Emissions fell
by 2 percent from 2017 to 2018.
Our approach:
n Regenerative agriculture – Farming
practices such as diverse crop
rotations and cover cropping can
sequester carbon in the soil and
reduce GHG levels in the atmosphere.
n Row crops – In the U.S., we partner
with Field to Market and our suppliers
to help growers of corn, sugar
beets and wheat gather data on the
impact of their farming practices,
including GHG emissions. We engage
in similar ways with oats growers
through the Canadian Field Print
Initiative. We then hold workshops
and collaborate with local, trusted
agronomists to identify and implement
continuous improvement practices.
n Dairy products – Dairy management
contributes to GHG emissions,
due to feed production, methane
emissions from digestive processes,
manure, processing, transport of
raw milk and other factors.
n Deforestation – Healthy forests play a
critical role in storing carbon, so we are
working to address deforestation in our
fiber, cocoa and palm oil supply chains.
Agriculture and transformation (48% of total value chain GHG emissions)
Growing and transporting crops, and turning them into food ingredients
KEY DRIVERS (% OF PHASE IN FY18)
2025
6.40
2018
7.38
2017
7.52
2010
8.89
GENERAL MILLS’ LEVEL OF INFLUENCE: MEDIUM
ROW CROPS*
38%DAIRY
22%MEAT
7% 33%OTHER**
* Wheat, dry corn, oats ** Cocoa, soybean oil and
sugarcane represent about one-third of this amount
We continually innovate to reduce the
environmental impact of packaging
through better design – by decreasing
materials use, switching to lower impact
materials (including renewable) and
improving truckload packing efficiencies.
Performance: Greenhouse gas emissions
in this category decreased 19 percent
in 2018 compared to our 2010 baseline.
This was due to design improvements
and a shift toward products with lower
impact packaging. A 7 percent decrease
from 2017 to 2018 was partially due
to a decline in soup and yogurt sales
and the resulting reduction in steel
packaging and aluminum lids, both of
which are GHG emissions intensive.
Sourcing: General Mills has a target to
source 100 percent of our fiber packaging
by 2020 from recycled material or from
virgin wood fiber regions that do not
contribute to deforestation, and we
achieved greater than 99 percent in 2018.
Recycled and recyclable materials: We
continue to increase our use of recycled
and recyclable materials. In 2018, recycled
content represented about 45 percent of
General Mills’ product packaging weight
in the U.S. Approximately 89 percent of
our packaging in the U.S. was recyclable.*
Plastics commitment: In early 2019, we
announced our ambition that 100 percent
of our packaging be recyclable by design
by 2030. See our packaging statement.
External collaboration: We partner with
industry and community organizations
such as the Sustainable Packaging
Coalition (SPC) and The Association of
Plastic Recyclers to improve recycling
effectiveness and availability. To
promote recycling, more than two-thirds
of our products with large enough
packages now include How2Recycle
labels, developed by the SPC.
Packaging supply chain (7% of total value chain GHG emissions)
Producing and transporting packaging materials
KEY DRIVERS (% OF PHASE IN FY18)
GENERAL MILLS’ LEVEL OF INFLUENCE: HIGH
FIBER OTHER
51% 2%METAL
22%PLASTIC
25%
1.171.35 1.09 0.97
20172010 2018 2025
*According to analysis conducted by General Mills in 2018. Packaging is considered recyclable if 60 percent or more of the U.S. population has access to recycling for the material.GENERAL MILLS GLOBAL RESPONSIBILITY 26
Our Food Our Planet Our Workplace Our Community

1.731.75 1.581.26
20172010 2018 2025
Producing (10% of total value chain GHG emissions)
Making our products (mixing and cooking)
KEY DRIVERS (% OF PHASE IN FY18)
FUEL
24% 17%OTHER
59%ELECTRICITY
GENERAL MILLS’ LEVEL OF INFLUENCE: HIGH
The amount and type of energy
we use are the key drivers of GHG
emissions from our operations.
Performance: Greenhouse gas emissions
in this category decreased 9 percent
in 2018 compared to our 2010 baseline,
primarily due to our ongoing progress
in energy efficiency, consolidation
of operations and reductions in the
average GHG emissions intensity
of the electricity we purchase.
Energy use: In addition to our GHG
emissions reduction goal, each General
Mills production facility has a target
to reduce energy use by 2 percent
annually, normalized to production.
During fiscal 2018, this rate decreased
by 2 percent compared to the prior year.
Efficiency improvements were partially
offset by increased production of more
energy intensive product offerings to
meet consumer demands. Absolute
energy use decreased by 7 percent.
We identify and implement improvements
through our Five-Step Energy
Reduction Process, by working with our
manufacturing plants to establish energy
programs, conduct energy analyses,
develop and execute improvement
plans, and validate results. This process
historically focused on facilities with
significant spending on energy. We
have recently evolved it to include all
General Mills manufacturing facilities,
by focusing improvement efforts on
common systems such as compressed
air, lighting and steam/hot water.
In fiscal 2018, we completed more than
60 energy efficiency and reduction
projects across the company. These
saved over 12 million kWh, delivered
US$4.8 million in cost savings
and avoided nearly 6,000 metric
tons CO₂e of GHG emissions.
Renewable energy: We have
implemented numerous renewable
energy initiatives at facilities worldwide
that meet financial guidelines and
support our environmental objectives.
Examples include anaerobic digestion
(which captures and uses methane
to generate electricity), and burning
oat hulls and other bio mass. In June
2017, General Mills signed a 15-year
virtual power purchase agreement with
Renewable Energy Systems (RES) for
100 megawatts of the Cactus Flats wind
project in Concho County, Texas. We
estimate this will generate renewable
energy credits equivalent to more
than one-third of the power used by
our U.S. facilities. As a result, General
Mills rose to No. 32 on the Top 100
list of the Environmental Protection
Agency’s Green Power Partnership. We
plan to pursue additional renewable
energy opportunities in fiscal 2019.
Waste reduction: We also work to
decrease waste, which saves money and
materials and decreases our overall GHG
EMISSIONS (MILLION METRIC TONS CO2E)
* The company’s facility in San Adrian, Spain, rented its roof to a solar company, which generated 5,294 GJ at that location in fiscal 2018. That amount is not included in this table.** Wholly owned or controlled production facilities globally.
Location Generated and used (GJ)
Generated and sold (GJ)
Renewable energy certificates (RECs) Type
Brazil (Cambara, Carolina, Pouso Alegre) 320,150 0 N/A
Input: Biomass (wood)Output: Heat
France (Arras) 3,218 1,548 N/AInput: Biogas (food waste)Output: Heat (used) and electricity (sold)
United States (Fridley, Minnesota) 83,434 0 N/AInput: Biomass (oat hulls)Output: Heat (used)
United States (Murfreesboro, Tennessee)
5,825 (electricity)3,124 (steam)
0 N/AInput: Biogas (food waste)Output: Electricity (used) and Heat (used)
United States (Cactus Flats wind project in Concho County, Texas)
N/A N/A0 (100 MW beginning in August 2018)
Input: WindOutput: Electricity (RECs)
Total 415,751 1,548
Percent of total energy usage** 4.6%
Renewable energy, fiscal 2018*
GENERAL MILLS GLOBAL RESPONSIBILITY 27
Our Food Our Planet Our Workplace Our Community

We work with our suppliers, co-packers,
transportation providers and customers
to reduce the environmental impact of
shipping our products around the world.
Performance: Greenhouse gas
emissions in this category decreased
22 percent in 2018 compared to
our 2010 baseline, due to shifts to
more efficient transport modes and
improvements in truck fuel efficiency.
Strategies:
n Optimizing transportation modes,
including moving loads to modes with
less impact, such as from truck to rail.
n Using innovative technologies
such as lightweight truck cabs.
n Collaborating with suppliers
and customers to increase
capacity utilization and providing
customers incentives to use our
Direct Plant Ship program.
n Prioritizing shippers with strong
environmental credentials. In
North America, 94 percent of
our transportation spend is with
SmartWay certified carriers.*
n Improving logistics planning,
regionally sourcing products, filling
trucks more completely and using
load optimization software.
n Optimizing our customer service
facility and inventory footprint to
decrease outside storage, which
requires additional handling.
1.351.461.14 1.05
20172010 2018 2025
Transporting ingredients to our facilities and our products on to stores
Shipping (7% of total value chain GHG emissions)
FUEL
80%OTHER
20%
KEY DRIVERS (% OF PHASE IN FY18)
GENERAL MILLS’ LEVEL OF INFLUENCE: HIGH
emissions. Each General Mills production
facility has a target to reduce production
solid waste generation by 3 percent
annually, normalized to production. In
fiscal 2018, this rate increased by
7 percent, while absolute waste rose by
1 percent. Main factors included waste-
intensive changes in operations and
overall decreases in production. During
the year, 79 percent of our production
solid waste globally was recycled,
11 percent was processed for energy
recovery and 10 percent was disposed.*
Worldwide, at the end of fiscal 2018,
10 General Mills production facilities (20
percent of the global total) met our zero-
waste-to-landfill criteria.** We continue
working to meet our target to achieve
zero waste to landfill at 30 percent
of our owned production facilities
by 2020 and 100 percent by 2025.
To view additional data about GHG
emissions, energy usage in our
directly controlled operations, and
water and solid waste, see the
Environmental Data Summary.
EMISSIONS (MILLION METRIC TONS CO2E)
*Disposal includes landfill and incineration without energy recovery. **These facilities sent no waste to landfill or incineration without energy recovery.
*Twelve months ending November 2018.
Solid waste by disposition* (% of 2018 global total)
*This graph refers to productionwaste. Disposal includes landfill and incineration without energy recovery.
n Recycling 79%
n Energy recovery 11%
n Disposal 10%
GENERAL MILLS GLOBAL RESPONSIBILITY 28
Our Food Our Planet Our Workplace Our Community

We support the efforts of our customers who are working to reduce energy use and associated GHG emissions related to storing and refrigerating our products.
Performance: Greenhouse gas emissions in this category decreased 9 percent in 2018 compared to our 2010 baseline, largely due to a decrease in the volume of products that require cold storage.
Sales and marketing: This category also includes General Mills activities that support sales and marketing, such as business travel and our corporate offices. We continue to reduce impacts in this area through increased use of virtual meeting technologies and upgrades to more efficient fleet vehicles. From fiscal 2010 through fiscal 2018, we reduced the GHG emissions intensity of our U.S.
sales fleet by 29 percent per mile driven, decreasing annual GHG emissions per vehicle by nearly 0.8 metric tons CO₂e.
Efforts to decrease waste and energy use at our corporate offices include expanding recycling and composting streams, reducing printing, optimizing building energy controls and improving lighting energy efficiency.
In fiscal 2018, at our Minneapolis headquarters, we reduced overall waste by 10 percent and waste to landfill by 30 percent, while increasing composting collection by 50 percent, compared to the prior year.
From 2015 through 2018, we saved US$800,000 through energy use reductions, decreasing GHG emissions by more than 6,700 metric tons CO₂e.
STORAGE AT RETAIL
63%BUSINESS TRAVEL OTHER
5% 22%EMPLOYEE COMMUTE
10%
0.900.93 0.85 0.67
20172010 2018 2025
Making food available for purchase and daily operations of our business
Selling (5% of total value chain GHG emissions)
KEY DRIVERS (% OF PHASE IN FY18)
GENERAL MILLS’ LEVEL OF INFLUENCE: LOW EMISSIONS (MILLION METRIC TONS CO2E)
Enjoying food (shopping, preparing and eating) and disposing
Consumer transportation to and from stores determines the largest part of emissions in this phase, followed by product specifications such as preparation and storage requirements.
Performance: Greenhouse gas emissions in this category decreased 1 percent in 2018 compared to our 2010 baseline, reflecting a shift in our portfolio to more products
that do not require cooking or refrigeration by the consumer.
n Food waste: General Mills supports several initiatives to combat food
waste. In 2018, we enabled 30 million meals for food-insecure people around the world through food donations. Learn more.
Consuming (21% of total value chain GHG emissions)
KEY DRIVERS (% OF PHASE IN FY18)
GENERAL MILLS’ LEVEL OF INFLUENCE: LOW
3.333.34 3.29
2.40
20172010 2018 2025HOME COOKING
27%HOME STORAGE
13%END OF LIFE
13%CONSUMER TRIPS
TO STORE
47%EMISSIONS (MILLION METRIC TONS CO2E)
GENERAL MILLS GLOBAL RESPONSIBILITY 29
Our Food Our Planet Our Workplace Our Community
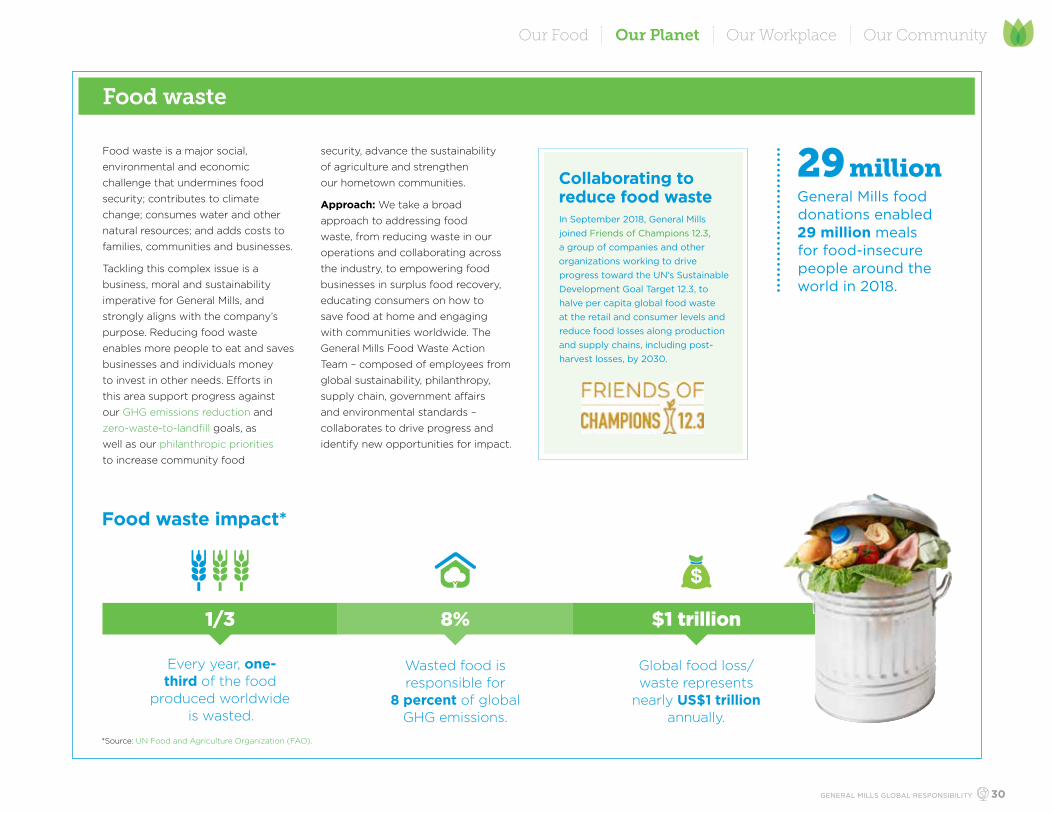
Food waste is a major social,
environmental and economic
challenge that undermines food
security; contributes to climate
change; consumes water and other
natural resources; and adds costs to
families, communities and businesses.
Tackling this complex issue is a
business, moral and sustainability
imperative for General Mills, and
strongly aligns with the company’s
purpose. Reducing food waste
enables more people to eat and saves
businesses and individuals money
to invest in other needs. Efforts in
this area support progress against
our GHG emissions reduction and
zero-waste-to-landfill goals, as
well as our philanthropic priorities
to increase community food
security, advance the sustainability
of agriculture and strengthen
our hometown communities.
Approach: We take a broad
approach to addressing food
waste, from reducing waste in our
operations and collaborating across
the industry, to empowering food
businesses in surplus food recovery,
educating consumers on how to
save food at home and engaging
with communities worldwide. The
General Mills Food Waste Action
Team – composed of employees from
global sustainability, philanthropy,
supply chain, government affairs
and environmental standards –
collaborates to drive progress and
identify new opportunities for impact.
Collaborating to reduce food wasteIn September 2018, General Mills joined Friends of Champions 12.3, a group of companies and other organizations working to drive progress toward the UN’s Sustainable Development Goal Target 12.3, to halve per capita global food waste at the retail and consumer levels and reduce food losses along production and supply chains, including post-harvest losses, by 2030.
Food waste
Food waste impact*
*Source: UN Food and Agriculture Organization (FAO).
Wasted food is responsible for
8 percent of global GHG emissions.
8%
Global food loss/waste represents
nearly US$1 trillion annually.
$1 trillion
Every year, one-third of the food
produced worldwide is wasted.
1/3
General Mills food donations enabled 29 million meals for food-insecure people around the world in 2018.
29 million
GENERAL MILLS GLOBAL RESPONSIBILITY 30
Our Food Our Planet Our Workplace Our Community
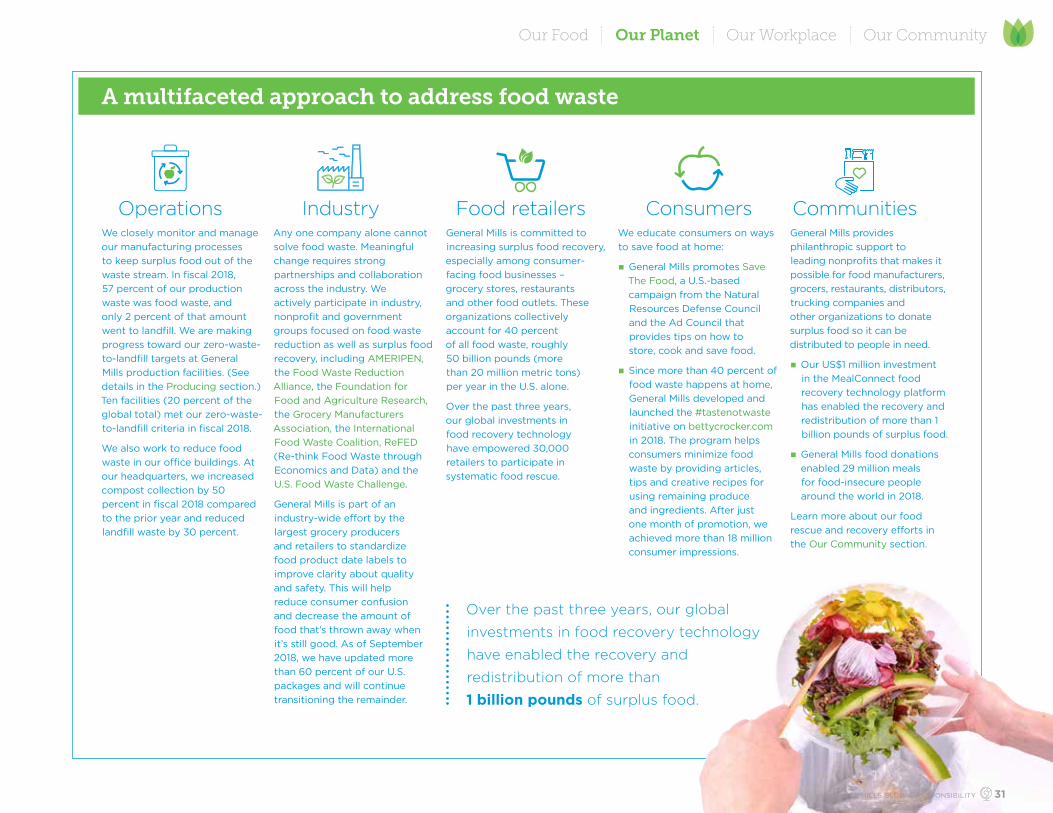
A multifaceted approach to address food waste
We closely monitor and manage our manufacturing processes to keep surplus food out of the waste stream. In fiscal 2018, 57 percent of our production waste was food waste, and only 2 percent of that amount went to landfill. We are making progress toward our zero-waste-to-landfill targets at General Mills production facilities. (See details in the Producing section.) Ten facilities (20 percent of the global total) met our zero-waste-to-landfill criteria in fiscal 2018.
We also work to reduce food waste in our office buildings. At our headquarters, we increased compost collection by 50 percent in fiscal 2018 compared to the prior year and reduced landfill waste by 30 percent.
Any one company alone cannot solve food waste. Meaningful change requires strong partnerships and collaboration across the industry. We actively participate in industry, nonprofit and government groups focused on food waste reduction as well as surplus food recovery, including AMERIPEN, the Food Waste Reduction Alliance, the Foundation for Food and Agriculture Research, the Grocery Manufacturers Association, the International Food Waste Coalition, ReFED (Re-think Food Waste through Economics and Data) and the U.S. Food Waste Challenge.
General Mills is part of an industry-wide effort by the largest grocery producers and retailers to standardize food product date labels to improve clarity about quality and safety. This will help reduce consumer confusion and decrease the amount of food that’s thrown away when it’s still good. As of September 2018, we have updated more than 60 percent of our U.S. packages and will continue transitioning the remainder.
General Mills is committed to increasing surplus food recovery, especially among consumer-facing food businesses – grocery stores, restaurants and other food outlets. These organizations collectively account for 40 percent of all food waste, roughly 50 billion pounds (more than 20 million metric tons) per year in the U.S. alone.
Over the past three years, our global investments in food recovery technology have empowered 30,000 retailers to participate in systematic food rescue.
We educate consumers on ways to save food at home:
n General Mills promotes Save The Food, a U.S.-based campaign from the Natural Resources Defense Council and the Ad Council that provides tips on how to store, cook and save food.
n Since more than 40 percent of food waste happens at home, General Mills developed and launched the #tastenotwaste initiative on bettycrocker.com in 2018. The program helps consumers minimize food waste by providing articles, tips and creative recipes for using remaining produce and ingredients. After just one month of promotion, we achieved more than 18 million consumer impressions.
General Mills provides philanthropic support to leading nonprofits that makes it possible for food manufacturers, grocers, restaurants, distributors, trucking companies and other organizations to donate surplus food so it can be distributed to people in need.
n Our US$1 million investment in the MealConnect food recovery technology platform has enabled the recovery and redistribution of more than 1 billion pounds of surplus food.
n General Mills food donations enabled 29 million meals for food-insecure people around the world in 2018.
Learn more about our food rescue and recovery efforts in the Our Community section.
Operations Industry Food retailers Consumers Communities
Over the past three years, our global
investments in food recovery technology
have enabled the recovery and
redistribution of more than
1 billion pounds of surplus food.
GENERAL MILLS GLOBAL RESPONSIBILITY 31
Our Food Our Planet Our Workplace Our Community
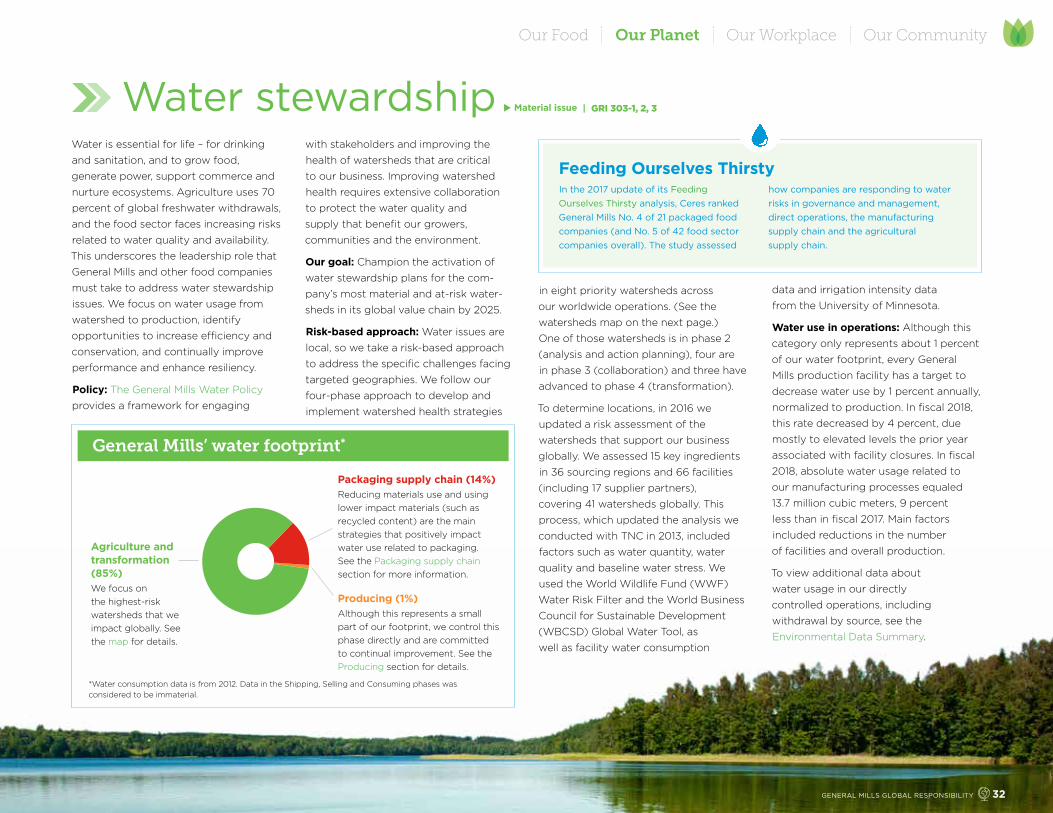
Water is essential for life – for drinking
and sanitation, and to grow food,
generate power, support commerce and
nurture ecosystems. Agriculture uses 70
percent of global freshwater withdrawals,
and the food sector faces increasing risks
related to water quality and availability.
This underscores the leadership role that
General Mills and other food companies
must take to address water stewardship
issues. We focus on water usage from
watershed to production, identify
opportunities to increase efficiency and
conservation, and continually improve
performance and enhance resiliency.
Policy: The General Mills Water Policy
provides a framework for engaging
with stakeholders and improving the
health of watersheds that are critical
to our business. Improving watershed
health requires extensive collaboration
to protect the water quality and
supply that benefit our growers,
communities and the environment.
Our goal: Champion the activation of
water stewardship plans for the com-
pany’s most material and at-risk water-
sheds in its global value chain by 2025.
Risk-based approach: Water issues are
local, so we take a risk-based approach
to address the specific challenges facing
targeted geographies. We follow our
four-phase approach to develop and
implement watershed health strategies
in eight priority watersheds across
our worldwide operations. (See the
watersheds map on the next page.)
One of those watersheds is in phase 2
(analysis and action planning), four are
in phase 3 (collaboration) and three have
advanced to phase 4 (transformation).
To determine locations, in 2016 we
updated a risk assessment of the
watersheds that support our business
globally. We assessed 15 key ingredients
in 36 sourcing regions and 66 facilities
(including 17 supplier partners),
covering 41 watersheds globally. This
process, which updated the analysis we
conducted with TNC in 2013, included
factors such as water quantity, water
quality and baseline water stress. We
used the World Wildlife Fund (WWF)
Water Risk Filter and the World Business
Council for Sustainable Development
(WBCSD) Global Water Tool, as
well as facility water consumption
data and irrigation intensity data
from the University of Minnesota.
Water use in operations: Although this
category only represents about 1 percent
of our water footprint, every General
Mills production facility has a target to
decrease water use by 1 percent annually,
normalized to production. In fiscal 2018,
this rate decreased by 4 percent, due
mostly to elevated levels the prior year
associated with facility closures. In fiscal
2018, absolute water usage related to
our manufacturing processes equaled
13.7 million cubic meters, 9 percent
less than in fiscal 2017. Main factors
included reductions in the number
of facilities and overall production.
To view additional data about
water usage in our directly
controlled operations, including
withdrawal by source, see the
Environmental Data Summary.
Agriculture and transformation (85%)We focus on the highest-risk watersheds that we impact globally. See the map for details.
Producing (1%) Although this represents a small part of our footprint, we control this phase directly and are committed to continual improvement. See the Producing section for details.
Packaging supply chain (14%)Reducing materials use and using lower impact materials (such as recycled content) are the main strategies that positively impact water use related to packaging. See the Packaging supply chain section for more information.
General Mills’ water footprint*
*Water consumption data is from 2012. Data in the Shipping, Selling and Consuming phases wasconsidered to be immaterial.
Feeding Ourselves ThirstyIn the 2017 update of its Feeding Ourselves Thirsty analysis, Ceres ranked General Mills No. 4 of 21 packaged food companies (and No. 5 of 42 food sector companies overall). The study assessed
how companies are responding to water risks in governance and management, direct operations, the manufacturing supply chain and the agricultural supply chain.
Water stewardship u Material issue | GRI 303-1, 2, 3
GENERAL MILLS GLOBAL RESPONSIBILITY 32
Our Food Our Planet Our Workplace Our Community

Four-phase approach to sustainable supply chain water use
PHASE 1
AssessmentA study of key operation and growing region watersheds, using external standards and building on work completed
with The Nature Conservancy (TNC)
PHASE 2
Analysis and action planningDeep-dive analysis of at-risk growing areas,
in conjunction with external experts
PHASE 3
CollaborationEstablish multi-stakeholder water stewardship plan to implement identified improvements
PHASE 4
TransformationImplement water stewardship program with public education and advocacy, funding, and monitoring and reporting
Huang He (Yellow)SHANGDONG, CHINA
Growing region (dairy)RISK LEVEL: EXTREMELY HIGHPHASE 2This watershed is in the analysis phase.
We are in the process of implementing the Alliance for Water Stewardship standard at our facility and the surrounding catchment.
Yongding He HEBEI/SANHE (BEIJING), CHINA
Growing region (dairy), facilityRISK LEVEL: EXTREMELY HIGHPHASE 3
Yangtze (Chang Jiang)SHANGHAI, CHINA
FacilitiesRISK LEVEL: HIGHPHASE 3We are in the process of implementing the Alliance for Water Stewardship standard at our facilities and the surrounding catchments.
GangesMADHYA PRADESH, INDIA
Growing region (wheat)RISK LEVEL: EXTREMELY HIGHPHASE 3General Mills and TNC completed a detailed assessment of the watershed, farming practices and improvement opportunities. We are collaborating with another food company to develop a water fund and to pursue other opportunities for the region. To better understand the challenges and possible solutions in this area, we also met with numerous local farmers. Learn more.
San JoaquinCALIFORNIA, U.S.
Growing region (dairy, nuts, fruits and vegetables), facilityRISK LEVEL: EXTREMELY HIGHPHASE 3General Mills has supported TNC and Sustainable Conservation to develop resources such as the groundwater dependent ecosystem tool and the groundwater recharge assessment tool to assist development of groundwater sustainability plans. Through the California Water Action Collaborative, we share resources and information with other food and beverage companies, suppliers and conservation organizations to improve water security in the San Joaquin watershed. We recently supported development of the Groundwater Exchange, a resource and collaboration portal that helps water managers, water users and community members implement the Sustainable Groundwater Management Act.
Rio Grande/Rio BravoNEW MEXICO, U.S.
FacilityRISK LEVEL: EXTREMELY HIGHPHASE 4We contribute to the Rio Grande Water Fund’s work to help advance water conservation and education e�orts in the Albuquerque community, including restoring forests to reduce catastrophic wildfires that threaten the area’s water supply. Recently, our Albuquerque cereal and snack plant partnered with TNC to collect rain water. See Saving Every Drop. We are tracking Water 2120: Securing our Water Future, the county water utility's 100-year water supply plan for the metropolitan area.
SnakeIDAHO, U.S.
Growing region (wheat, potatoes) RISK LEVEL: EXTREMELY HIGHPHASE 4General Mills is tracking the Eastern Snake River Plain Aquifer Comprehensive Aquifer Management Plan to drive progress toward watershed sustainability. We support TNC to help farmers implement water management and soil health practices that reduce groundwater withdrawals and address declining water levels and watershed health in this area. In 2017, the Natural Resources Conservation Service (NRCS) allocated $5.2 million to promote and implement irrigation and water saving projects through its Regional Conservation Partnership Program. TNC also received a grant from the NRCS to help develop the business case for farmers to reduce water use. Also see Southern Idaho Fieldprint Project and the TNC soil health roadmap.
South Florida BasinsFLORIDA, U.S.
Growing region (sugarcane)RISK LEVEL: HIGHPHASE 4General Mills is tracking The Central Everglades Planning Project (CEPP) that is currently being implemented according to the Integrated Delivery Schedule, a collaboration created with multi-stakeholder input.
An interactive version of this map, which is updated periodically, is also available online.
Risk levels are based on the WWF Water Risk Filter, customized to General Mills.
General Mills’ priority watersheds
GENERAL MILLS GLOBAL RESPONSIBILITY 33
Our Food Our Planet Our Workplace Our Community

Up to one-third of global greenhouse
gas (GHG) emissions stems from the
food system, an estimated 80 percent
of which comes from agriculture.*
To positively impact our planet,
it’s imperative that we adapt the
approach to farming, natural resource
management and energy usage.
We believe that the most promising
solutions start with healthy soil.
We are on a journey to make a
meaningful difference through
regenerative agriculture, which we
define as agriculture that protects and
intentionally enhances natural resources
and farming communities. This approach
is a powerful lever for change across
the agricultural supply chain. It not
only sustains natural resources but can
restore them for generations to come.
To achieve these benefits at scale, we
believe all types of agriculture – organic
and conventional – should be addressed.
Regenerative agriculture can help
address climate change by sequestering
carbon in the soil and reducing GHG
emissions in the atmosphere.
Our goal: Advance regenerative
agriculture practices on 1 million
acres of farmland by 2030.
Our approach: We aim to connect best
practices in regenerative agriculture to
real outcomes across three key areas:
Healthy soil – Soil is a complex
ecosystem that forms the base
of the food chain for humans
and land animals. It plays an essential role
in cleaning and storing water, supporting
biodiversity and regulating the climate.
Biodiversity – Diversity in crop
varieties, grazing animals,
wildlife and pollinators supports
resilient ecosystems can better withstand
disease, pests and climate shocks.
Farmer economic resilience –
Regenerative agricultural
practices reduce the need
for more expensive inputs by fostering
natural nutrient cycling. These
practices can strengthen whole farm
profitability and resilience over time.
We follow three strategies to
drive progress:
n Product and supply chain – Cultivate
and scale regenerative farming
practices in our supplier base.
n Policies and partnerships – Advance
agricultural systems change through
strategic partnerships and research.
n Education and inspiration – Build
awareness and influence change
by educating and inspiring
consumers, farmers, suppliers,
industry peers and our employees.
Measuring impact: During fiscal 2018,
General Mills developed a Regenerative
Agriculture Measurement Protocol,
which outlines how we determine the
impact of agricultural management on
soil health throughout General Mills’
network of regenerative farmers and
ranchers. In fiscal 2018, we collected
and analyzed soil samples from 10
pilot farms in the U.S., totaling 7,500
acres of conventional and organic
land. Protocols for above-ground
biodiversity and farmer economic
resilience are still in development.
We also launched Version 1.0 of the
General Mills Regenerative Agriculture
Scorecard, a self-assessment
tool to help farmers understand
how their practices influence soil
health, biodiversity and economic
resilience in farming communities.
Life-cycle assessment: In 2018, General
Mills worked with Quantis, White Oak
Pastures and Michigan State University to
conduct a life-cycle assessment of White
Oak Pastures, which produces beef for
our EPIC brand. Preliminary results of
the study determined that restoration of
degraded cropland to perennial pastures
and regenerative agricultural practices
sequestered enough carbon in soil to
offset as much as 68 percent of the
farm’s overall GHG emissions footprint
and decrease the footprint per pound of
beef produced by 88 percent compared
to a conventional beef system.**
We will advance regenerative agriculture practices on 1 million acres of farmland by 2030.
1 million
Regenerative agriculture
BRAND DESCRIPTION PRODUCTS
Partnered with Montana farmers to create two limited-edition products with organic ingredients grown using regenerative practices.
Working to commercialize Kernza, a perennial relative of annual wheat, whose deep roots show promise in building soil health and ecosystem resilience.
Partnering with the Savory Institute to launch Land to Market – the first verification standard for regenerative supply chains.
Regenerative agriculture: examples in our supply chain
*Vermuelen, S., Campbell, B. & Ingram, J. (2012). Climate Change and Food Systems. Annual Review of Environment and Resources, 37, 195-222. https://www.annualreviews.org/doi/abs/10.1146/annurev-environ-020411-130608**Value for comparison calculated based on Rotz, 2013. Assumes no carbon loss or storage in cow-calf stage.
u Material issues: Biodiversity; climate change; deforestation; responsible sourcing; water stewardship | GRI 102-12, 13, 201-1, 304-2, 3
GENERAL MILLS GLOBAL RESPONSIBILITY 34
Our Food Our Planet Our Workplace Our Community

More than 99 percent of our food
comes from the soil.* Soil conservation
practices, including planting cover crops,
rotating diverse crops and reducing
tillage can improve soil health.
Research and investmentsThrough 2018, General Mills has
invested more than US$4 million
in initiatives to advance soil health
on U.S. agricultural lands.
Soil health roadmap: In November 2016,
General Mills and TNC unveiled ReThink
Soil: A Roadmap to Soil Health, which
makes the case for better soil health
management practices on U.S. working
lands in the agricultural supply chain.
Partnerships for soil health: In fiscal
2017, General Mills made a three-
year, US$2 million commitment
to TNC, the Soil Health Institute
and the Soil Health Partnership to
develop tools and resources to help
farmers, landowners and supply
chain leaders achieve widespread
adoption of soil health practices.
National Wheat Foundation: In
November 2017, General Mills invested in
soil health practices on U.S. agricultural
farmland with a US$735,000 grant to
the National Wheat Foundation. The
funds will support soil health research on
wheat farms and educational outreach
to more than 125,000 wheat farmers
across the Northern and Southern Plains.
Perennial crop investments: In 2017,
Cascadian Farm and parent company
General Mills launched a project with
The Land Institute to help commercialize
organic Kernza, a perennial grain
with deep roots that shows promise
in increasing soil health, carbon
sequestration, water infiltration and
biodiversity. Through fiscal 2018, General
Mills has contributed US$1 million to the
Forever Green Initiative at the University
of Minnesota to support efforts such as
measuring the GHG mitigation potential
of Kernza and improving genetics and
management practices to increase
and maintain yields. Learn more.
Supplier and grower partnershipsSince 2010, General Mills has worked
with row crop suppliers and growers
to advance progress toward our
commitment to sustainably source
our top 10 priority ingredients by
2020. Key collaborations include:
n Field to Market – We partner with
Field to Market and use their Fieldprint
Platform to support growers of corn,
sugar beets and wheat in driving
towards continuous improvement
in sustainability for U.S. crops.
n National Association of Wheat
Growers (NAWG) and the Soil Health
Partnership (SHP) – Through our
investment with NAWG and SHP and
by leveraging our ongoing work with
Field to Market, six demonstration
farms will identify, test and measure
management practices that produce
economic and environmental benefits.
n Canadian Roundtable for Sustainable
Crops (CRSC) – In Canada, where
General Mills sources the majority of
its oats, we use the CRSC’s Canadian
Field Print Initiative platform, which
is analogous to the FTM Fieldprint
Calculator. We also support research
with farmers and agronomists in
Manitoba and Saskatchewan to
better understand the soil health
and emissions implications of
various farming techniques.
n Midwest Row Crop Collaborative – We
participate in this organization, which
accelerates use of environmentally
preferable agricultural practices
across the Upper Mississippi Basin,
including cover cropping, low or
no tillage and extended rotation.
Soil health
*Pimentel, D. Environ Dev Sustain (2006) 8: 119. https://doi.org/10.1007/s10668-005-1262-8
Five principles of regenerative agriculture and soil health
GENERAL MILLS GLOBAL RESPONSIBILITY 35
Our Food Our Planet Our Workplace Our Community

General Mills is dedicated to increasing
the long-term capacity of our organic
supply chain and expanding organic
acreage. These efforts align with our
growth objectives, consumer demand
and our commitment to regenerative
agriculture. Our goal is to more than
double our organic acreage from
120,000 acres to 250,000 acres
between 2015 and 2019. Through fiscal
2018, we reached 200,000 acres.
Since 2000, General Mills has steadily
grown our organic business with new
products, such as Progresso Organic
Soup, and brand acquisitions, including
Cascadian Farm, Muir Glen and Annie’s.
Supplier partnerships: Cascadian Farm
is partnering with Grain Millers, the
largest organic oat supplier in the U.S.,
to promote continuous improvement
within organic farming. We committed
US$125,000 through 2022 to conduct
soil testing, host field days, share best
practices and help remove hurdles to
advancing the organic movement.
In 2018, Annie’s partnered with
innovative Montana farmers Casey
Bailey and Nate Powell-Palm to create
limited editions of two of our top items,
Elbow Pasta & Cheddar and Honey
Bunny Grahams, with organic ingredients
grown using regenerative practices. We
sourced the oats, peas and wheat for
these products directly from the farmers,
deepening our understanding of the
farming practices behind the ingredients.
Since 2008, Annie’s has partnered with
Organic Valley, a cooperative of more
than 2,000 family farmers, to provide
some of our organic dairy ingredients. In
2017, we worked with Organic Valley, the
Carbon Cycle Institute and the California
Resource Conservation Districts to assist
three farms in California in developing
carbon farm plans, which can be
used to help identify and implement
climate-beneficial farming practices.
Industry collaboration: In 2017, we
launched and hosted two meetings
of the Organic & Regenerative
Agriculture Transition Council, which
brings together sustainable agriculture
leaders, farmers and industry
stakeholders to advance organic and
regenerative agricultural practices.
We are a founding member of the U.S.
Organic Grain Collaboration, which
increases the domestic supply of
organic grain by funding research, field
days and other educational events.
We provided support to the Prairie
Organic Grain Initiative, dedicated
to achieving resiliency and stability
in the prairie organic sector.
Research: We support the Organic
Farming Research Foundation’s efforts
to encourage widespread adoption
of organic farming practices through
research, advocacy and education.
Through Annie’s, we also have long-
standing relationships with the Midwest
Organic and Sustainable Education
Service, which helps farmers adopt
and improve organic practices, and
The Organic Center, which provides
evidence-based research on the
environmental and human health impacts
of organic food and farming. In fiscal
2018, we funded research conducted by
The Organic Center to explore the link
between organic farming management
practices and soil health outcomes.
Large-scale land conversion: In fiscal
2018, General Mills and Gunsmoke Farms
LLC signed an agreement to convert
34,000 acres of conventional farmland
to certified organic acreage by 2020.
Located west of Pierre, South Dakota, the
farm will grow certified organic wheat
and other organic crops as part of a
diverse rotation. General Mills will use the
wheat to make Annie’s pasta products,
including its signature Macaroni & Cheese.
As part of this agreement, General Mills
has partnered with Midwestern BioAg
to provide on-the-ground mentorship
for the farm operators to advance
leading regenerative soil management
practices. In addition, nearly 3,000 acres
of pollinator habitat will be planted
throughout the farm in partnership
with the Xerces Society for Invertebrate
Conservation (Xerces Society).
This type of long-term, direct contracting
is unprecedented for General Mills and
the industry. This agreement provides
farmers and landowners a high level
of security, which supports them in
making a transition of this magnitude.
Organic farming
*Based on SPINS NOMC Dashboard data through Sept. 16, 2018.
Scaling up our organic business
General Mills is now the second-largest U.S. natural and organic food producer.
We reached 200,000 acres of organic acreage through fiscal 2018.
General Mills is among the top five organic ingredient purchasers in the North American packaged foods sector.
We have increased the number of acres from which we source organic ingredients by 175 percent since 2009.
We are working with Gunsmoke Farms LLC to convert 34,000 acres of conventional farmland to organic acreage by 2020.
top
34,000200,000 175%2
GENERAL MILLS GLOBAL RESPONSIBILITY 36
Our Food Our Planet Our Workplace Our Community

Thirty-five percent of crop production
worldwide relies on pollinators such
as bees, birds and butterflies. Diverse
native populations of bees and
other insects are a sign of healthy
and productive ecosystems.
Many of our products contain honey,
fruits, nuts, vegetables and other
ingredients that require pollination,
so healthy and abundant bee
populations are a priority for General
Mills. We work with our suppliers and
leading conservationists to conserve
and expand bee habitats, and we
fund research to better support
the recovery of honey bees.
Since 2011, General Mills and our brands
have invested more than US$6 million to
support pollinator habitat and research
efforts. See chart at right for details.
Public-private partnerships: In fiscal
2017, we launched a five-year project
with the USDA and the Xerces Society to
protect and establish healthy pollinator
habitats. General Mills is donating
US$400,000 each year, matched by
the Natural Resources Conservation
Service (NRCS) division of the USDA
for a total of US$4 million across the
five years. These funds support eight
full-time NRCS field biologists who assist
growers in implementing pollinator
habitats. This commitment will help
to plant more than 100,000 acres of
pollinator habitat through 2021.
Pollinators
“General Mills is the global pioneer in pollinator conservation, both in terms of the investments they’ve made and in terms of creating a model that works.” – Eric Lee-Mӓder, Pollinator Program Co-Director, the Xerces Society for Invertebrate Conservation
FUNDING TIMEFRAME COMMITMENT PROGRESS (THROUGH OCTOBER 2018)
PUBLIC-PRIVATE PARTNERSHIPS
General Mills corporate contributions
$1,250,000
FY17 - FY21
Expansion of the Xerces Society’s Pollinator Conservation Program by adding eight full-time field biologists in key regions of the U.S.
Biologists provided conservation planning and technical support to 350 farms
$750,000 100,000 acres of pollinator habitat planted by 2021
55,000 acres of habitat planted
$2,000,000
BRAND COMMITMENTS
$400,000 FY145 miles of hedgerow and wildflower strips on supplier’s 2,500-acre almond ranch
Completed
$15,000 FY1720 acres of habitat on 500 acres of land owned by two organic dairy suppliers
Completed
$1,650,000 FY17 - FY213,300 acres of pollinator habitat planted by 2020
1,300 acres of habitat planted
$1,185,000 FY17 - FY21Pollinator habitat support on supplier farmland
41 acres of habitat planted
OTHER GENERAL MILLS CHARITABLE CONTRIBUTIONS
$370,000 FY15 - FY18Applied research on bee health in Europe; beekeeper training; pollinator habitat expansion, including Yoplait sourcing regions
500 acres of habitat planted
$550,000 FY12 - FY18Honey bee cell culture research; knowledge sharing and collaboration among pollinator researchers worldwide
Advanced research on honey bee viruses and nutritional supplements for bee health; promoted best beekeeping practices
General Mills investment in pollinators
GENERAL MILLS GLOBAL RESPONSIBILITY 37
Our Food Our Planet Our Workplace Our Community

Integrated pest management (IPM)
strategies – such as biological control,
changing farmer behavior, and the use of
resistant varieties – minimize the threat
of pests and the need to use pesticides
on crops. General Mills has been a leader
in supporting IPM practices for decades.
We fund IPM research, share results and
work with our suppliers and conservation
organizations to drive progress.
We collaborated with the Xerces
Society, Iowa State University and the
USDA’s NRCS on a project launched
in June 2015 to improve IPM practices
in corn and soy systems. In fiscal
2017, the initiative concluded with
publication of the report “Making
Decisions About Neonicotinoid Seed
Treatment Use in Iowa.” This document
provides guidance about which corn
and soybean pests may be targeted
effectively with neonicotinoid seed
treatments, when scouting should occur
to inform related decisions and how to
scout for these early season pests.
In fiscal 2017, we received results from
an analysis we commissioned from
the IPM Institute of North America to
assess the scope of IPM adoption and
pesticide use throughout our North
American supply chains for five major
crops: corn, oats, soybeans, sugar beets
and wheat. The study determined that
current levels of IPM adoption are low
in corn, slightly higher in soybeans and
much higher in oats, sugar beets and
wheat. Reliance on pesticides ranges
from very high in corn, which has
multiple pests, to very low in oats.
These results inform our approach
to IPM adoption across our supply
chain. Through our Field to Market
engagements, we help growers capture
information about pesticide use,
including energy used in the application
of pesticides and embedded GHG
emissions, and apply those findings
to improve sustainability. Additionally,
we plan to have the IPM Institute
present best practices at each of our
North American grower sustainability
engagement workshops in corn, oats,
sugar beets and wheat regions.
Brand partnerships: Several of our
brands (see table on prior page)
have also invested in expanding and
strengthening pollinator habitats in their
supply chains. For example, our Yoplait
business in France has developed a
strategic partnership with Observatoire
Francais d’Apidologie (OFA) to
research why bees are disappearing
and to help regenerate healthy bee
colonies. Since 2015, in partnership with
Yoplait, OFA has planted two billion
flowers through the Flowers for Bees
program to create pollinator habitat in
France.
Research: During fiscal 2018, as part of
our ongoing support of the University of Minnesota Bee Lab, the General Mills Foundation provided a US$100,000 grant to enable scientists to address issues that impact bee health – such as
pathogens, pesticides and nutritional
deficiencies – at the cell level.
Consumer education: Honey Nut
Cheerios launched its Bring Back the
Bees campaign in the U.S. and Canada
in fiscal 2017, to raise awareness about
the declining pollinator population. In a
week, we distributed 1.5 billion wildflower
seeds to 2.5 million households, far
surpassing our goal of 200 million
seeds. During fiscal 2018, we distributed
seeds to 5.5 million households.
Neonicotinoid pesticides: General
Mills recognizes the concern about the
unique role of neonicotinoid pesticides
in pollinator health decline and supports
further study of this important issue
as outlined in the Pollinator Research
Action Plan. Consistent with our
historic commitment to integrated pest
management (see below), we advocate
for the responsible use of neonicotinoids
in our supply chain and expedited U.S.
Environmental Protection Agency review.
Integrated pest management
r Since 2011, General Mills and our brandshave invested more than US$6 millionto support pollinator habitat andresearch efforts.
r Bring Back the Beesdistributed wildflower seedsto households in the U.S.and Canada.
GENERAL MILLS GLOBAL RESPONSIBILITY 38
Our Food Our Planet Our Workplace Our Community

We are committed to eliminating
deforestation of the world’s rainforests
and the resulting impacts on biodiversity,
endangered species and climate change.
Deforestation is a major contributor
to climate change, accounting for an
estimated 15 percent of greenhouse
gas emissions globally. Meanwhile the
production of agricultural commodities
including cocoa, fiber and palm oil is
often associated with a range of human
rights and labor rights issues such as
land tenure, forced labor and sustainable
livelihoods. We are working to eliminate
deforestation in our cocoa, fiber and
palm oil supply chains and to better
understand and address related social
risks. We are signatories to the 2014
New York Declaration on Forests.
Cocoa: Since signing on to the World
Cocoa Foundation’s Cocoa and Forests
Initiative in March 2017, we have worked
closely with suppliers, NGOs and
Proforest to identify strategic actions
to protect and restore forests, increase
sustainable production, and promote
social and community engagement.
Fiber: General Mills has a target to source
100 percent of our fiber packaging by
2020 from recycled material or from
virgin wood fiber regions that do not
contribute to deforestation. In fiscal 2018,
99.5 percent of our fiber purchases
met this criteria.
Palm oil: To help ensure our palm
oil purchases do not contribute to
deforestation of the world’s rainforests or
negatively impact the communities that
depend on them, we have sourced 100
percent of our palm oil from responsible
and sustainable sources since fiscal
2015. See our updated statement
on responsible palm oil sourcing.
The Sustainable sourcing section
provides more details about our
efforts in each of these areas.
Deforestation
We focus on improving the
environmental, social and economic
impacts of raw material sourcing. This
aligns with our core values and helps
ensure availability of the ingredients
we need to make our products. It also
helps us meet our consumers’ growing
desire to understand the link between
the food they purchase and its origin.
Using finite resources and natural
systems more efficiently is essential
to feeding a growing population.
We continue to make progress
toward our goal to sustainably
source 100 percent of our 10 priority
ingredients by 2020. In fiscal 2018,
we achieved 85 percent, up from 76
percent the prior year. We continue
to move our supply chain toward
sustainable sourcing through origin-
direct investment, continuous
improvement and verification efforts
with farmers and supplier partners,
connected data partners and NGOs.
To drive progress toward our 2025
goal to reduce absolute GHG emissions
across our full value chain by 28 percent
(compared to 2010), we increasingly
assess our global raw material
purchasing through a climate lens.
r In fiscal 2018, we sourced greater than 99percent of our fiber packaging from recycledmaterial or from virgin wood fiber regionsthat do not contribute to deforestation.
In fiscal 2018, we sustainably sourced 85 percent of our 10 priority ingredients.
Sustainable sourcingu Material issues: Commodity availability; farmer livelihoods; human rights; responsible sourcing | GRI 102-12, 13, 203-1, 2, 204-1, FP4 85%
GENERAL MILLS GLOBAL RESPONSIBILITY 39
Our Food Our Planet Our Workplace Our Community

Performance dashboard: Sustainable sourcing
Progress* (% of volume sustainably sourced as of May of the year noted) Primary focus**
Strategy Sustainability definition
Raw material/ingredient FY14 FY15 FY16 FY17 FY18 Environmental Social
Cocoa 10% 28% 46% 59% 90%
Origin-direct investment
Direct investment at origin to improve smallholder farmer livelihoods and ingredient quality
Vanilla 45% 45% 22% 22% 32%
Oats 35% 40% 50% 61% 90%
Continuous improvement
Driving towards continuous improvement using industry-based environmental metrics with at least 25 percent of acres under measurement
U.S. wheat 15% 24% 36% 61% 74%
Driving towards continuous improvement using Field to Market framework or comparable metrics with at least 25 percent of acres under measurement
U.S sugar beets 34% 47% 68% 81% 81%
U.S. corn (dry milled)
6% 26% 33% 67% 82%
U.S. dairy (raw fluid milk)
20% 20% 38% 83% 91%Driving towards continuous improvement as outlined in the ICUSD’s Stewardship and Sustainability Framework for U.S. Dairy***
Fiber packaging 99% 99% 99% 99% 99.5%
Verification
Recycled material or virgin wood fiber from regions not contributing to deforestation
Sugarcane 42% 59% 67% 58% 70%
Sourced from independently verified low-risk regions, or compliance with Bonsucro or comparable standards in high-risk regions
Palm oil**** 83% 100% 100% 100% 100%
RSPO mass balanced, segregated sustainable palm or PalmTrace Credits
*Progress numbers may vary from year to year due to changes in suppliers, market conditions or improvements in data tracking methodology. All numbers calculated based on volume except fiber packaging, which is based on percent ofspend sustainably sourced. Aggregate percentage is based on the percentages sustainably sourced for each ingredient, weighted by spend.**Our efforts are focused on areas of significant challenge at the point of origin where we can have the greatest impact.***Measured using the National Milk Producers Federation’s Farmers Assuring Responsible Management (FARM) Environmental Stewardship module (formerly called FarmSmart).****Palm oil target 100 percent by fiscal 2015.
Commitment: Sustainably source 100 percent of our 10 priority ingredients by 2020, representing 40 percent of our annual raw material purchases.
Progress: 85 percent of these raw materials weresustainably sourced in fiscal 2018.85%
GENERAL MILLS GLOBAL RESPONSIBILITY 40
Our Food Our Planet Our Workplace Our Community

We rely on farmers and farming communities for our ingredients. When farmers can earn a good living and take care of the local environment, their lives are better and
their communities are more stable. We invest in smallholder farmers and their communities to improve livelihoods and the sustainability and quality of our ingredients.
Status: 90 percent of the cocoa General Mills purchased in fiscal 2018 was sustainably sourced.*
Cocoa
Challenges:
n Economic viability – the ability of
smallholder farmers to earn enough
from the crop to support their families.
n Deforestation – due to the expansion
of cocoa plantations in some areas.
n Low productivity – low yields,
crop loss due to pests or disease,
and degraded soil fertility.
n Child labor – helping families
keep children in school.
Progress: In 2018, we expanded our
work with key suppliers to provide
direct support to cocoa-growing
communities in West Africa.
Since January 2017, 100 percent
of our powdered cocoa has been
sustainably sourced. During fiscal
2018, we worked to transition nearly
all of the chocolate we purchase to
sustainable sourcing programs.
Collaboration: We work directly with
our suppliers to address systemic
challenges and enforce our Supplier Code
of Conduct, which prohibits forced and
child labor. In addition, we are a member
of the World Cocoa Foundation (WCF),
which works with the food industry
to address social and environmental
issues in the cocoa supply chain.
Since signing on to WCF’s Cocoa and
Forests Initiative in March 2017, we have
worked closely with suppliers, NGOs
and Proforest to identify strategic
actions to protect and restore forests,
increase sustainable production,
and promote social and community
engagement. We collaborated with
those organizations to aggregate and
integrate information to develop a draft
General Mills action plan with intended
investment and forecasted impact
through 2022 for both Côte d’Ivoire and
Ghana. We submitted our plan to WCF
in late 2018 and aim to publish the final
version in spring 2019. This initiative
will also drive progress toward our
2025 GHG emissions reduction goal.
Origin-direct investment
*Cocoa includes chocolate as well as cocoa powder, converted into cocoa bean equivalents. See the definition of sustainably sourced for this ingredient on page 40.
r Our partnership with CARE provides smallholder farmers like Felicia education and training on good agronomic practices.
More than 90 percent of the cocoa we purchase is grown in West Africa.
In Ghana, we are working with cocoa supplier Cargill and CARE in 20 communities to form village cooperatives and provide technical assistance and educational support to more than 2,300 smallholder farmers.
In Nigeria, participating farmer communities are provided with a comprehensive support package reflecting our vision and the Olam Livelihood Charter principles of finance, improved yields, labor practices, market access, quality, traceability, social investment and reduced environmental impact.
In Côte d’Ivoire, we partner with cocoa suppliers Barry Callebaut and Cargill to help smallholder farmers. Our support of the Cargill Cocoa Promise program with the humanitarian NGO CARE in Côte d’Ivoire benefits 10 communities. Our support of Barry Callebaut’s Cocoa Horizons program helps farmers in 65 cocoa cooperatives improve productivity through training, support and financing.*
*Impact from General Mills funding and donations from other companies are combined for maximum impact in the Cocoa Horizons program.
Learn more about the impact of our NGO partnerships in Our Community.
GENERAL MILLS GLOBAL RESPONSIBILITY 41
Our Food Our Planet Our Workplace Our Community

Strategy: We partner with farmers in our
key sourcing regions using frameworks
developed by Field to Market and the
Innovation Center for U.S. Dairy and the
Canadian Field Print Initiative. For U.S.
row crops, we collaborate with third
parties such as Agrible and Syngenta,
which integrate Field to Market’s
sustainability metrics into their farm
management software platforms to
streamline data collection. For U.S. raw
fluid milk, our dairy partners deploy the
National Milk Producers Federation's
Farmers Assuring Responsible
Management (FARM) Environmental
Stewardship module (formerly called
FarmSmart) to measure and track farm
sustainability. The data is evaluated
against key environmental indicators to
establish a natural resource efficiency
baseline for each grower. We then
hold workshops and collaborate with
local, trusted agronomists and other
experts to identify and implement
continuous improvement practices.
See page 44 of the General Mills
2017 Global Responsibility Report
for a graphic illustrating our annual
grower engagement cycle.
Progress: During fiscal 2018, we
continued to elevate sustainability
as central to our global sourcing
strategy. We launched engagements
in new regions and brought
on new supplier partners to
advance progress.
Since 2010, we have worked with more
than 275 growers to collect data on a
cumulative total of over 1,311,000 acres.
Challenges:
n Economic viability – the ability of
smallholder farmers to earn enough
from the crop to support their families.
Progress: During fiscal 2018, we
increased sustainable vanilla purchases
to 32 percent despite ongoing market
volatility and geopolitical instability.
We continue developing innovative
opportunities in Madagascar to produce
enough sustainable vanilla to achieve
our commitment. During fiscal 2018,
we elevated work with a key vanilla
supplier, Virgina Dare, and the NGO
Positive Planet to expand our program
to new localities and farmers. We
launched a village savings and loan
association with Positive Planet to
expand farmer outreach and technical
assistance, which drove increases
in sustainable vanilla volumes.
Collaboration: Our key partners include
our supplier Virginia Dare and industry
group Sustainable Vanilla Initiative.
Status: 32 percent of the vanilla General Mills purchased in fiscal 2018 was sustainably sourced.*
VanillaThe majority of the vanilla we purchase is grown and cured in Madagascar’s Sava region.
1 Madagascar
1
Row crops and dairy are among the most resource intensive of our 10 priority ingredients. To source these raw materials sustainably, we measure
year-on-year progress in field-level resource efficiency and drive continuous improvement over time with farmers in our supply chain.
Continuous improvement
*See the definition of sustainably sourced for this ingredient on page 40.
U.S. wheat
U.S. sugar beets
Oats
Dry milled corn
Increasing sustainability across North America*
NORTHERN PLAINS
SOUTHERN PLAINS
EASTERN CORN BELT
REED CITY, MICHIGANSNAKE
RIVER CENTRAL WISCONSIN
RED RIVER
VALLEY
SASKATCHEWAN
MANITOBA
EASTERN ILLINOIS
EASTERN KANSAS
EASTERN NEBRASKA
General Mills’ priority ingredients sourced from these regions:
Dairy
*Map represents main areas of sourcing; is not comprehensive.
GENERAL MILLS GLOBAL RESPONSIBILITY 42
Our Food Our Planet Our Workplace Our Community

Challenges:
n Climate change – reduce GHG
emissions across the supply chain.
n Soil quality – improve soil health.
n Water quality – address water quality
issues related to agriculture.
n Oat supply – decreased oat production.
Grower engagements:
n Paterson Grain in Manitoba
and North Dakota
n Exceed Grain Marketing,
Richardson, Shark Ag Consulting,
and Viterra in Saskatchewan
Progress:
n Through fiscal 2018, we have
collected data on a cumulative total
of over 117,000 acres in Manitoba,
Saskatchewan, and North Dakota.
We expanded on-the-ground
sustainability programs to measure
natural resource efficiency against
key environmental indicators.
In fiscal 2018:
n In collaboration with our suppliers and
data partners, we brought together
76 farmers to review environmental
footprints and identify continuous
improvement opportunities.
n We expanded to western Manitoba and
North Dakota with key supplier partner
Paterson Grain and collaborated on
oat agronomic research at Paterson’s
research farm in Winnipeg.
n In Saskatchewan, we launched soil
health research with local agronomic
advisor Shark Ag Consulting.
We compared soil health across
several cropping systems to better
understand outcomes resulting
from key management practices.
Challenges:
n Climate change – reduce GHG
emissions across the supply chain.
n Soil quality – improve soil health.
n Water quality – address water quality
issues related to agriculture.
Grower engagements:
n Thresher Artisan Wheat in the
Snake River region
n ADM in the Northern Plains, Southern
Plains and Eastern Corn Belt regions
Progress:
n Through fiscal 2018, we have collected
data on a cumulative total of over
932,000 acres using on-the-ground
sustainability programs to measure
natural resource efficiency against
key environmental indicators.
In fiscal 2018:
n In collaboration with our suppliers and
data partners, we brought together
197 farmers to review environmental
footprints and identify continuous
improvement opportunities.
n In the Northern Plains region, all
growers reported using at least
one conservation practice to
manage erosion, improve water
quality or preserve soil moisture.
n In the Snake River region, 65 percent
of growers reported using three or
more conservation practices such
as managing ground cover and
service residue, split application
of fertilizer, and integrated pest
management techniques.
n The Southern Plains engagement with
ADM and Agrible (recently acquired by
Nutrien) was recognized as the Field to
Market Collaboration of the Year at the
2018 Sustainable Agriculture Summit.
Challenges:
n Climate change – reduce GHG
emissions across the supply chain.
n Soil quality – improve soil health.
n Water quality – address water quality
issues related to agriculture.
Grower engagement:
n Amalgamated Sugar in the
Snake River Valley region
n American Crystal Sugar in the
Red River Valley region
n Michigan Sugar in Michigan
n Western Sugar in the Mountain West
Progress:
n Through fiscal 2018, we have collected
data on a cumulative total of over
151,000 acres using on-the-ground
sustainability programs to measure
natural resource efficiency against
key environmental indicators.
In fiscal 2018:
n In collaboration with our suppliers and
data partners, we brought together
more than 40 farmers to review
environmental footprints and identify
continuous improvement opportunities.
n We expanded to include three
additional sugar beet cooperatives
and had active engagement from
all suppliers.
n 53 percent of sugar beet fields in
the Red River Valley engagement
implemented conservation
practices such as cover crops, grass
waterways, field borders, filter
strips or contour strip cropping.
n Growers participating in the Red River
Valley engagement demonstrated
a 19 percent higher yield compared
to the regional benchmark.
Status: 90 percent of the oats General Mills purchased in fiscal 2018 was sustainably sourced.*
Oats
Status: 74 percent of the U.S. wheat General Mills purchased in fiscal 2018 was sustainably sourced.*
Wheat
Status: 81 percent of the U.S. beet sugar General Mills purchased in fiscal 2018 was sustainably sourced.*
Sugar beets
*See the definition of sustainably sourced for this ingredient on page 40. GENERAL MILLS GLOBAL RESPONSIBILITY 43
Our Food Our Planet Our Workplace Our Community

Challenges:
n Climate change – Reduce GHG
emissions across the supply chain.
n Soil quality – improve soil health.
n Water quality – address water quality
issues related to agriculture.
Grower engagements:
n Didion in South Central Wisconsin
n Bunge in Illinois, Kansas and Nebraska
n ADM in East Central Illinois
Progress:
n Through fiscal 2018, we have collected
data on a cumulative total of over
112,000 acres using on-the-ground
sustainability programs to measure
natural resource efficiency against
key environmental indicators.
In fiscal 2018:
n In collaboration with our suppliers and
data partners, we brought together
20 farmers to review environmental
footprints and identify continuous
improvement opportunities.
n 60 percent of cornfields in the
Wisconsin engagement used
conservation tillage practices and
managed soil erosion 79 percent
more efficiently than the
regional benchmark.
n More than 9,200 acres benefited
from a combination of conservation
practices such as grass waterways,
field borders and conservation cover.
Challenges:
n Climate change – reduce GHG
emissions across the supply chain.
n Water quality – address water quality
issues related to agriculture.
n Animal welfare – address animal
care issues, such as dehorning.
Producer engagements:
n Suppliers to our Reed City, Michigan,
yogurt facility.
Progress:
n Through fiscal 2018, U.S. milk producers
have used the FARM Environmental
Stewardship module to collect data
and calculate the sustainability
impact from farm to production
facility of all directly sourced raw
fluid milk for our Reed City facility.
In fiscal 2018:
n In collaboration with our suppliers
and participating dairies, we reviewed
environmental footprints and best
practices, and discussed advancing
continuous improvement opportunities
related to feed production, milk
production and manure management.
Status: 82 percent of the U.S. dry milled corn General Mills purchased in fiscal 2018 was sustainably sourced.*
Corn
Status: 91 percent of the raw fluid milk General Mills purchased in the U.S. in fiscal 2018 was sustainably sourced.*
DairyThe majority of our directly sourced raw milk comes from the U.S.
1
2
1 United States
We continue to increase the sustainability of fiber packaging, sugarcane and palm oil by working across the industry to improve practices, and we validate progress
by using verification in high-risk regions.
Challenges:
n Deforestation – in some parts
of the supply chain caused by
sourcing fiber for packaging.
Strategy: Ninety-nine percent of our fiber
packaging supply is considered at low risk
for contributing to global deforestation
because the packaging uses either
recycled materials or virgin fiber that is
sourced from regions where deforestation
is not occurring. The remaining one
percent is sourced from countries
considered at high risk, including China.
We follow pulp, paper and packaging
sourcing guidelines developed by
the Consumer Goods Forum.
Progress: In fiscal 2018, we assessed
suppliers in China to better understand
certifications in use and confirmed
that our fiber purchased from China
is only sourced from suppliers that
have FSC Mix certification or better.
Ninety percent of the fiber we use in our packaging comes from the United States and Canada – areas at low risk for deforestation.
1
2
1 United States 2 Canada
Verification
Status: Greater than 99 percent of the fiber packaging General Mills purchased in fiscal 2018 was sustainably sourced.*
Fiber packaging
*See the definition of sustainably sourced for this ingredient on page 40. GENERAL MILLS GLOBAL RESPONSIBILITY 44
Our Food Our Planet Our Workplace Our Community

Challenges:
n Labor rights – including child and forced
labor, and working conditions related
to worker health, safety and hours.
n Visibility – improve lack of visibility
to origin of purchased sugarcane.
n Water quality – address water quality
issues related to agriculture.
Strategy: More than half of the
sugarcane we purchase globally is grown
in low-risk countries, such as the U.S.
and Australia. We continue to leverage
our Bonsucro membership and the
organization’s Production Standard,
plus related credits to help farmers and
mills in our supply chain measure and
increase productivity while reducing
key environmental and social impacts.
Progress: In fiscal 2018, 70 percent
of the sugarcane we purchased was
sustainably sourced, up from 58
percent the prior year. This reflects
an increase in Bonsucro credit
purchases in regions where certified
sugarcane is not available at volume.
During the year, we continued
working with Proforest to map our
sugarcane supply chain and improve
transparency to origin. We also
started evaluating impact investment
opportunities through Bonsucro
and other collaboratives to support
sustainable practices development in
key sourcing regions. As part of our
work with Bonsucro, we encourage
suppliers to conduct benchmarking and
gap analyses as the first step toward
verification. Our major sugarcane
suppliers include Cargill, American
Sugar Refining, United and Imperial.
Status: 70 percent of the sugarcane General Mills purchased in fiscal 2018 was sustainably sourced.*
SugarcaneThe majority of the sugarcane we purchase comes from the Western Hemisphere.
1
3
2
1 United States 2 Mexico3 Brazil
Challenges:
n Deforestation – palm plantation
expansion harms rainforests,
biodiversity, endangered species
and the environment.
n Indigenous rights – irresponsible
practices can threaten the rights
of indigenous peoples.
Strategy: Although General Mills is a
relatively minor user of palm oil, our
purchasing practices can help move
the industry forward. We are dedicated
to sourcing palm oil in a socially and
environmentally responsible manner.
Our initial commitment in 2010 included
compliance with our Supplier Code
of Conduct, as well as prevention and
resolution of social and/or land conflicts
consistent with the principle of free,
prior and informed consent. As part of
our concern about deforestation in palm
oil growing regions, we supplement our
initial commitment with our statement
on responsible palm oil sourcing, which
was strengthened significantly in 2018.
Progress: In fiscal 2015, we met our
commitment to source all palm oil
through sustainable purchases that
meet RSPO standards, and we have
maintained that performance through
fiscal 2018. We have continued to shift
toward mass balance and segregated
palm oil – accounting for 98 percent of
our purchases in 2018 – and away from
certificates. In cases where certificates
are needed, we are aligned with and
using the industry standard of PalmTrace.
Traceability: In 2018, we continued
working with Proforest to trace our palm
oil supply chain, identify sustainability
risks and ensure responsible and
sustainable sourcing. At the end of 2018,
99 percent of our palm oil volume was
categorized as traceable to the extraction
mill – among the best in our industry.
Click here for a list of our current global
direct palm oil suppliers. The most
recent list of mills supplying our direct
suppliers can be found here and here
and will be updated periodically. We
are driving toward increased public
transparency regarding upstream supply
and now expect all of our palm oil
suppliers to follow a similar practice.
Hurdles remain in the palm oil supply
chain. If an audit or other highly credible
source reveals or confirms that a
supplier is seriously violating the stated
principles of our policy, and if that
supplier does not acknowledge and
immediately remediate the concern,
General Mills will suspend or eliminate
palm oil purchases from that vendor.
Status: 100 percent of the palm oil General Mills purchased in fiscal 2018 was sustainably sourced.*
Palm oil Most of the palm oil we purchase comes from Malaysia and Brazil.
1 Malaysia 2 Indonesia3 Brazil
32
1
CY2016* CY2017 CY2018
Mass balance volume 56,970 76,000 76,923
Segregated volume 11,550 6,140 902
RSPO PalmTrace Credits** 6,600 3,740 1,153
Total 75,120 85,880 78,978
Purchasing of RSPO certified volumes (metric tons)
*Calendar year **Formerly known as Green Palm Credits
*See the definition of sustainably sourced for this ingredient on page 40. GENERAL MILLS GLOBAL RESPONSIBILITY 45
Our Food Our Planet Our Workplace Our Community

Our supplier base is large, complex and
global, with thousands of suppliers in more
than 25 countries. We address responsible
sourcing issues through a multifaceted
approach, including supplier assessments,
audits, and direct engagement.
Our Supplier Code of Conduct, the
backbone of our program, outlines
our expectations. It covers four pillars
of responsible sourcing: human rights,
health and safety, the environment and
business integrity. We include the Code in
purchase orders, contracts and ongoing
interactions with suppliers to drive
adoption and continual improvement
throughout our supplier base.
Owned locations and co-packers: Since 2009, third-party firms have
conducted independent audits of our
owned locations and co-packers, which
cover human rights, health and safety,
the environment and business integrity.
(These are separate from food safety
audits.) In fiscal 2018, we transitioned
co-packers to the Sedex Members
Ethical Trade Audit (SMETA) protocol.
This framework is widely recognized
by companies in the food sector, which
enables suppliers to share audit results
with customers and improve efficiency.
Another benefit is that remediation
of identified non-compliances will be
managed and independently verified
by a third-party. By fiscal 2020, our
co-packers will follow the same overall
audit process as our Tier 1 suppliers.
We require corrective action plans
and resolution for any identified non-
compliances. In fiscal 2018, 67 of our
owned locations and co-packers were
audited, representing about 28 percent of
the total, compared to 62 locations the
prior year. Assessment frequency is based
on each site’s performance in past audits.
When significant issues arise in audits, a
Critical Finding Alert email is issued to key
General Mills team members, including
regional leadership, division counsel
and subject matter experts. This group
gathers to review the relationship with the
facility, discuss findings and determine
next steps. Regular progress review
meetings occur until the issue is resolved.
Tier 1 suppliers: During fiscal 2017, we
worked with Bureau Veritas (BV) to
expand and elevate our responsible
sourcing program in our Tier 1 supplier
base. After conducting a high-level
risk assessment and segmentation of
2,300 Tier 1 direct supplier* facilities
worldwide, we identified about 1,200
facilities that have inherent risk, based
on environmental, social and governance
factors. We also assessed suppliers that
provide raw materials or ingredients
covered by our sustainable sourcing
goals, as well as natural and organic
products. During fiscal 2018, we began
inviting facilities globally to participate
in our responsible sourcing program.
We require facilities identified as having
inherent risk to complete a self-assessment
and provide supporting documentation
on policies, procedures and previous
audits, when available. Depending on
the results, some facilities are required
to undergo an onsite third-party audit,
based on the SMETA protocol, covering
human rights, health and safety, the
environment and business integrity. These
facilities develop corrective action plans
to address identified non-compliances.
During fiscal 2018, 196 Tier 1 supplier
facilities completed self-assessments
and 53 underwent third-party audits.
Governance and integration: Our
supply chain and sourcing executive
leadership teams have accountability
for our responsible sourcing programs.
These teams meet at least twice a year
to review progress. We also have a
dedicated responsible sourcing manager
who oversees our work in this area.
We are integrating supplier responsibility
into our global sourcing standards
and processes. As of fiscal 2019,
all General Mills buyers:
n Include a standardized supplier
responsibility review in their
category strategies.
n Evaluate the risk of prospective
suppliers, using due diligence guidance.
n Include language in contracts
related to social and environmental
performance, if appropriate.
n Meet with strategic suppliers
twice a year to discuss progress
and provide feedback using a
performance scorecard, which
includes responsible sourcing.
Continual improvement is required.
To ensure alignment across the function,
all sourcing employees complete
online learning on our Supplier Code of
Conduct. In 2018, we also trained more
than 190 supply chain employees on our
responsible sourcing, supplier diversity
and sustainable sourcing programs as
part of formal onboarding for all new
global sourcing employees.
u Material issues: Animal welfare; commodity availability; human rights; responsible sourcing | GRI 102 12-13, 40, 42-44, FP11-12Responsible sourcing
Supplier responsibility
Type of location
Number of audits Locations with non-compliances
% resolved* % in process*
Owned locations
20 (6 North America, 14 international) 12 100% 0%
Co-packers 47 (26 North America, 21 international) 31 84% 16%
Tier 1 suppliers
53 (38 North America, 15 international)
51 89% 11%
Audit results in fiscal 2018
*As of November 2018. Represents percentage of locations with all non-compliances resolved (fourth column) and percentage of locations with resolution underway (fifth column).
*Direct suppliers provide ingredients or commodities used in our food products or packaging. Indirect suppliers provide products or services such as office supplies, telecommunications and travel that support our business more generally.
GENERAL MILLS GLOBAL RESPONSIBILITY 46
Our Food Our Planet Our Workplace Our Community

General Mills is committed to establishing
and growing relationships with certified
diverse suppliers.* This provides
opportunity to underrepresented groups,
while fostering job creation and economic
development. These efforts also support
our company by delivering innovation,
agility, cost savings and market insights
about our increasingly diverse consumers.
The Supplier Diversity team, which
is embedded in our global sourcing
organization, builds partnerships across
the company to match diverse suppliers
with business needs and opportunities.
The team integrates supplier diversity
into the standard sourcing process,
trains all sourcing buyers in this area
and provides tools to advance the
program. Sourcing product category
managers incorporate diversity into their
strategic plans to drive progress and
share results with sourcing leadership.
We are active members in national
and regional advocacy organizations,
such as the National Minority Supplier
Development Council (NMSDC), North
Central Minority Supplier Development
Council (NCMSDC), Women’s Business
Enterprise National Council (WBENC),
Women’s Business Development
Center (WBDC), and the National
LGBT Chamber of Commerce (NGLCC).
Through these organizations and
other industry groups, we benchmark,
share best practices and network
with prospective diverse suppliers.
Spending with diverse suppliers in North
America decreased between fiscal
2016 and fiscal 2018, due to declining
volumes and supplier consolidation.
Supplier diversity
FY2016 FY2017 FY2018
Minority-owned businesses $359.6 $313.0 $248.8
Women-owned businesses $162.8 $89.7 $97.0
Veteran-owned businesses $12.0 $11.5 $12.7
LGBTQ-owned businesses $0.3 $0.0 $0.3
Total $534.7 $414.2 $358.8
Total (% of spending with suppliers) 6.1% 4.9% 4.3%
General Mills’ spending with diverse suppliers in North America* (US$ million)
*Although some suppliers are certified in multiple categories of diversity, spending with those businesses is included in only one category in this table.
*Businesses owned by minorities, women, veterans, and disabled, lesbian, gay, bisexual and transgender individuals.
General Mills is primarily a plant-based
food company, with large businesses such
as Cheerios and Nature Valley. We also
use some animal-derived products and
have long worked to support the humane
treatment of animals in agriculture.
The foundation of our Animal Welfare
Policy is support for the internationally
recognized “five freedoms” for all animals
across our global supply chain. We
routinely engage with key stakeholders
focused on animal health and welfare
and participate in industry initiatives
that advance livestock production.
These efforts and commitments
demonstrate our values and align
closely with consumer expectations.
Chickens: Eggs are an important
ingredient in ice cream, baked goods
and doughs, and we strive to ensure
that the hens laying them are treated
humanely. Our commitment is to
purchase only 100 percent cage free
eggs for our operations globally by
2025. In 2018, 40 percent of our eggs
purchased worldwide were cage free.
General Mills will work to transition 100
percent of the broiler chickens we buy
in the U.S. to meet a higher standard
of animal welfare by 2024. Also by that
year, we will use only breeds accepted
by the Global Animal Partnership or
the Royal Society for the Prevention
of Cruelty to Animals and processed
using multi-step, controlled atmospheric
stunning. We will ask suppliers to
demonstrate compliance through
certification or third-party auditing.
Cows: General Mills encourages all
suppliers in our dairy supply chain
to support industrywide efforts that
promote the humane treatment of
cattle, including by addressing issues
of pain relief due to dehorning, tail
docking and castration. We support
polled genetics breeding programs, an
approach that has worked in the beef
industry. Until dehorning is eliminated,
we support best management practices
such as procedure timing and use
of analgesics and/or anesthetics.
Pigs: General Mills supports the
humane treatment of pigs in our supply
chain. This includes the development
and implementation of pregnant sow
housing alternatives, which we recognize
will take the industry time to achieve. In
the meantime, we will favor suppliers
that provide plans to create traceability
and to end use of gestation crates within
the U.S. pork supply chain. We’re also
working to understand and address
the issue of pain relief and potential
elimination of castration and tail docking.
Animal welfare
GENERAL MILLS GLOBAL RESPONSIBILITY 47
Our Food Our Planet Our Workplace Our Community

We reduced our global total injury rate to 0.77 injuries per 100 employees in fiscal 2018, down from 0.85 in 2017. Our ultimate goal is zero injuries and illnesses.
Ninety percent of leaders feel Engaging Leader training will positively affect business results.
Forty percent of company officer positions and 49 percent of professional positions are held by women globally.
90%
Our WorkplaceOur goal is to foster a safe,
inclusive and rewarding workplace
where all employees can thrive.
IN THIS SECTION
Workplace safety
Ethics and compliance
Global inclusion
Employee engagement and development
9% 49%
GENERAL MILLS GLOBAL RESPONSIBILITY 48

Our approachAt General Mills, it’s all about our
people. We’re proud of our efforts to
create a safe and inclusive workplace
whether you’re at a Cheerios plant, a
meeting at headquarters or out in the
sales field. And because people are
our greatest resource in building our
business and upholding our values,
we invest in them at every life stage –
within and beyond our office walls.
Governance: Governance for our
labor practices lies primarily within
our Human Resources, Law and
Supply Chain organizations. At an
operational level, the Human Resources
organization leads key employee
initiatives in partnership with company
business leaders at multiple levels.
Reflecting the importance of people
to our business, General Mills employs
a Director of Diversity and Inclusion;
a Director of Global Health Services;
and a Vice President of Engineering,
Global Safety and Environment. At the
board level, the Public Responsibility
Committee maintains responsibility
for issues related to labor practices.
AwardsGeneral Mills received numerous awards in 2018. Listed below is some of the recognition, illustrating our commitment to being an employer of choice for all employees.
n Global 2000: World’s Best Employers (No. 104), Forbes
n Top Employer (China)
n 100 Most Just Companies (No. 1 in industry), Forbes/JUST Capital
n Citizens Awards for Best Community Improvement Program, U.S. Chamber of Commerce Foundation Corporate Citizenship Center
n 100 Best Corporate Citizens (No. 1 in industry), Corporate Responsibility
n 100 Best Companies, Working Mother Media
n Best Companies for Multicultural Women, Working Mother Media
n Top Companies for Executive Women: National Association for Female Executives, Working Mother Media
n Best Places to Work for LGBTQ Equality, Human Rights Campaign
n 50 Best Companies for Diversity, Black Enterprise
n Military Friendly Employer, Viqtory
n Most Reputable Companies in the United States (No. 11), Reputation Institute’s US RepTrak®
n Harris Poll Reputation Quotient® Rankings (No. 30)
n The 25 Most Loved Brands Overall (Pillsbury No. 3, Betty Crocker No. 8, General Mills No. 24), Morning Consult
Workplace safety u Material issue: Employee health, safety and well-being | GRI 403-1, 2, 4
Our approachGeneral Mills is committed to creating a
Zero-Loss Culture in all our locations by
continually mitigating workplace hazards
and reducing environmental impacts.
Our goal: Our goal is to provide incident-
free workplaces for our employees,
contractors and visitors. Our actions
are guided by three safety principles:
n We lead with safety.
n Every incident is preventable.
n We are all accountable.
Our progressHistorically, General Mills has a strong
record of safety leadership. We continue
to improve the safety of our operations:*
n We reduced our global total
injury rate to 0.77 injuries per 100
employees in fiscal 2018, down
from 0.85 in 2017. Our ultimate
goal is zero injuries and illnesses.
n Our global lost-time injury
frequency rate was 0.38 per
100 employees in fiscal 2018.
Results were due to increased
engagement and rigor around our
foundational safety processes.
We gathered safety data from 202
tracked locations in fiscal 2018, 54 of
which are production facilities and
Innovation, Technology and Quality
centers. Those 54 locations were the
main focus of our safety improvement
work. Safety highlights from those
locations in fiscal 2018 include:
n 11 locations operated injury-free.
n 21 locations had a total injury
rate (TIR) below 1.0.
n 16 locations had zero lost-time
accidents due to injuries.
We continued reinforcing our
safety systems, training and
auditing programs in fiscal 2018:
n Standards – We developed and
published additional advanced
safety standards to support our
global Environmental and Safety
Management System (ESMS).
n Measurement – Our Global Safety
Tracking and Environmental
Management System (GSTEMS)
is now fully configured and
capable of sharing enterprise-wide
information across all regions.
n Training – We began the
process of training regional site
professionals on the safety aspects
of our global work system.
n Auditing – We continued expansion
of our enterprise-wide auditing
capabilities for safety and environment
under our Zero-Loss Culture strategy.
SystemsWe communicate safety information
and measure progress using
the following systems:
n We continue the process of phasing
in a single, standardized ESMS at our
supply chain locations. Our focus
includes applying our Zero-Loss Culture
strategy to our foundational health
and safety standards to obtain uniform
compliance and reduce risk worldwide.
w Through GSTEMS, we track
safety data at all production
facilities worldwide, document
necessary actions to reduce
future risks and communicate
*Global incident data includes all General Mills owned/operated facilities, including Yoki and Yoplait International, Häagen-Dazs shops and global offices.GENERAL MILLS GLOBAL RESPONSIBILITY 49
Our Food Our Planet Our Workplace Our Community

Ethics and compliance u Material issue | GRI 102-16, 17, 205-1, 2
Our approachGeneral Mills is committed to conducting
business in an ethical manner that
upholds best practices, complies
with regulations, demonstrates
integrity, provides equal opportunity
and supports fair labor practices.
Our comprehensive Code of Conduct
and Ethics & Compliance program
promote ethical behavior in all aspects
of our employees’ work. Our Code of
Conduct describes the principles that
govern our business conduct, and
points employees to policies and other
resources to answer their questions.
Annually, our company leaders – from
managers upward, nearly 10,000 employ-
ees – must attest to compliance with our
Code of Conduct and business conduct
policies. This certification is evidence
of our high expectations for ethical
conduct in every aspect of our business.
ProgramEthics and compliance: Our Ethics
& Compliance program supports our
value of doing the right thing all the
time; employees are encouraged to
speak up if something doesn’t seem
right or if they have questions about
doing the right thing. The program
includes extensive online resources
and self-directed courses. Our courses
and communications illustrate how
our Code of Conduct and employee
policies apply to our employees’ day-
to-day responsibilities. Our Ethics &
Compliance website provides access
to program resources – available in 10
languages – and employee policies are
available in our Global Policy Center.
Our Ethics Line allows employees
to raise questions or concerns
confidentially and anonymously, where
allowed by law. It is accessible globally
by a toll-free phone call or online at
generalmillsethics.ethicspoint.com.
Anti-corruption: We continue to
strengthen our anti-corruption program.
We assess risks in this evolving area,
review program enhancements
and apply best practices, including
addressing third-party risks. For
example, our Supplier Code of Conduct
(found on our General Mills website)
outlines our ethical expectations and is
included in our contracts with business
partners. We also screen higher-risk third
parties for corruption risk. Internally,
our anti-corruption program includes
an anti-corruption/anti-bribery policy
and online and live training modules
for employees. In addition, we ask
detailed questions related to corruption
risk during each routine, in-depth
business unit audit conducted by our
Global Internal Audit team. Along
with our anti-corruption assessments,
we continually assess regulatory
requirements, enforcement trends
and industry best practices to update
our Ethics & Compliance program.
Training: Using both in-person and
online program modules, we train
employees extensively on corruption
risks and other business concerns,
including conflicts of interest,
competition law, protecting confidential
information, preventing fraud and
maintaining a respectful workplace.
More than 13,000 employees worldwide
are enrolled in our online training
courses. In addition, we supplement
online training with face-to-face anti-
corruption training in markets where
there is a higher risk of corruption.
Action: All allegations of employee
misconduct, including bribery and
corruption, are promptly and thoroughly
investigated in accordance with our
ethics and compliance procedures and
corporate policies. The Audit Committee
of our Board of Directors reviews the
investigation and resolution of these
allegations. Upon completion of the
investigation, our Ethics & Compliance
group ensures appropriate disciplinary
actions (including termination of
third-party relationships), remediation
steps and internal/external reporting.
Equal opportunityWe believe every General Mills employee
has the right to be treated fairly and
deserves the opportunity to stretch
and grow throughout their career.
progress. Using GSTEMS, we
monitor key measures such as:
w Leading safety indicators, including
compliance with internal standards,
regulatory compliance and our
safety observation contact rate –
the percentage of employees
whose safety behaviors are
observed in a given time period
so coaching can be provided to
help employees work safely.
w Advanced mitigations, which are
critical to eliminating hazards
and permanently mitigating
risks across the company.
Leadership and responsibilityn Our Global Safety Governance
Board (GSGB), composed of
regional operating vice presidents,
oversees safety leadership,
structure, processes and actions.
n Senior-level responsibility for workplace
safety lies with the Director of Global
Safety and Environment, who reports
to the Vice President of Engineering,
Global Safety and Environment.
Our Corporate Safety Council is
led by our Chairman and Chief
Executive Officer, who is responsible
for General Mills’ policy and safety
culture. The council, which includes
key members of the company’s
executive leadership team, reviews
safety progress and key initiatives.
n Workplace health and safety is the
responsibility of line management
and each individual employee.
All employees are expected to
work safely by following policies,
procedures and training.
GENERAL MILLS GLOBAL RESPONSIBILITY 50
Our Food Our Planet Our Workplace Our Community
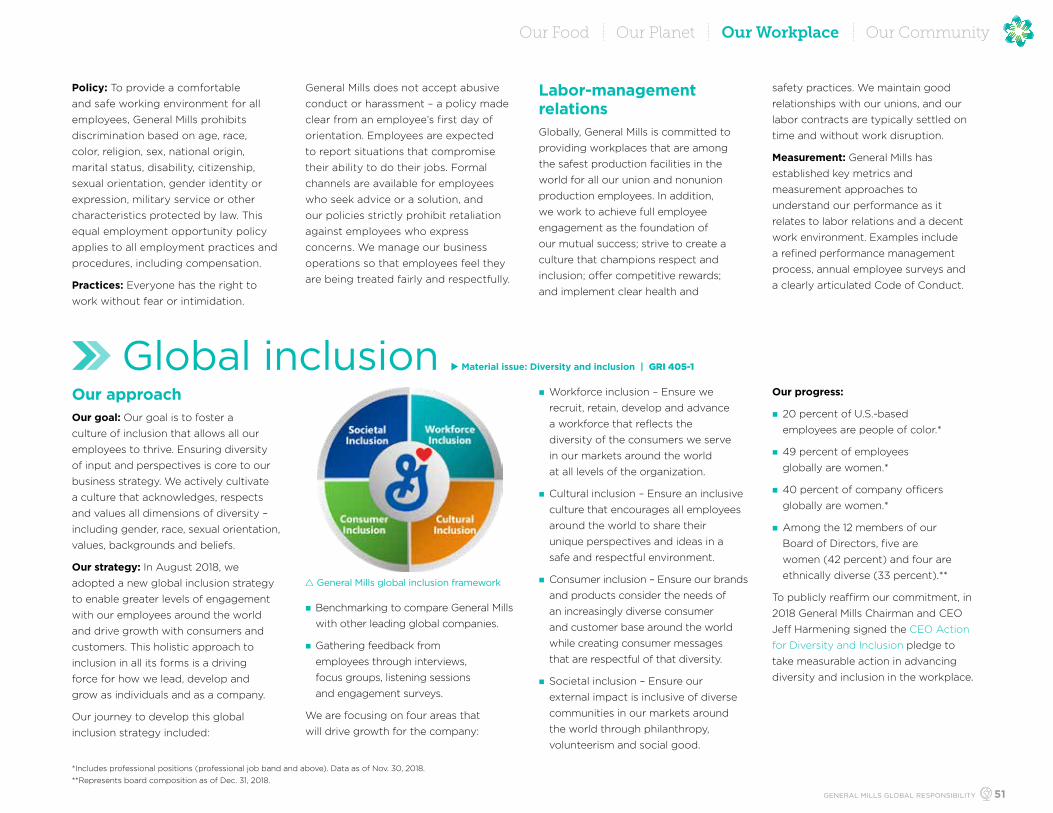
Global inclusion u Material issue: Diversity and inclusion | GRI 405-1
Our approachOur goal: Our goal is to foster a
culture of inclusion that allows all our
employees to thrive. Ensuring diversity
of input and perspectives is core to our
business strategy. We actively cultivate
a culture that acknowledges, respects
and values all dimensions of diversity –
including gender, race, sexual orientation,
values, backgrounds and beliefs.
Our strategy: In August 2018, we
adopted a new global inclusion strategy
to enable greater levels of engagement
with our employees around the world
and drive growth with consumers and
customers. This holistic approach to
inclusion in all its forms is a driving
force for how we lead, develop and
grow as individuals and as a company.
Our journey to develop this global
inclusion strategy included:
n Benchmarking to compare General Mills
with other leading global companies.
n Gathering feedback from
employees through interviews,
focus groups, listening sessions
and engagement surveys.
We are focusing on four areas that
will drive growth for the company:
n Workforce inclusion – Ensure we
recruit, retain, develop and advance
a workforce that reflects the
diversity of the consumers we serve
in our markets around the world
at all levels of the organization.
n Cultural inclusion – Ensure an inclusive
culture that encourages all employees
around the world to share their
unique perspectives and ideas in a
safe and respectful environment.
n Consumer inclusion – Ensure our brands
and products consider the needs of
an increasingly diverse consumer
and customer base around the world
while creating consumer messages
that are respectful of that diversity.
n Societal inclusion – Ensure our
external impact is inclusive of diverse
communities in our markets around
the world through philanthropy,
volunteerism and social good.
Our progress:
n 20 percent of U.S.-based
employees are people of color.*
n 49 percent of employees
globally are women.*
n 40 percent of company officers
globally are women.*
n Among the 12 members of our
Board of Directors, five are
women (42 percent) and four are
ethnically diverse (33 percent).**
To publicly reaffirm our commitment, in
2018 General Mills Chairman and CEO
Jeff Harmening signed the CEO Action
for Diversity and Inclusion pledge to
take measurable action in advancing
diversity and inclusion in the workplace.
Policy: To provide a comfortable
and safe working environment for all
employees, General Mills prohibits
discrimination based on age, race,
color, religion, sex, national origin,
marital status, disability, citizenship,
sexual orientation, gender identity or
expression, military service or other
characteristics protected by law. This
equal employment opportunity policy
applies to all employment practices and
procedures, including compensation.
Practices: Everyone has the right to
work without fear or intimidation.
General Mills does not accept abusive
conduct or harassment – a policy made
clear from an employee’s first day of
orientation. Employees are expected
to report situations that compromise
their ability to do their jobs. Formal
channels are available for employees
who seek advice or a solution, and
our policies strictly prohibit retaliation
against employees who express
concerns. We manage our business
operations so that employees feel they
are being treated fairly and respectfully.
Labor-management relationsGlobally, General Mills is committed to
providing workplaces that are among
the safest production facilities in the
world for all our union and nonunion
production employees. In addition,
we work to achieve full employee
engagement as the foundation of
our mutual success; strive to create a
culture that champions respect and
inclusion; offer competitive rewards;
and implement clear health and
safety practices. We maintain good
relationships with our unions, and our
labor contracts are typically settled on
time and without work disruption.
Measurement: General Mills has
established key metrics and
measurement approaches to
understand our performance as it
relates to labor relations and a decent
work environment. Examples include
a refined performance management
process, annual employee surveys and
a clearly articulated Code of Conduct.
r General Mills global inclusion framework
*Includes professional positions (professional job band and above). Data as of Nov. 30, 2018. **Represents board composition as of Dec. 31, 2018.
GENERAL MILLS GLOBAL RESPONSIBILITY 51
Our Food Our Planet Our Workplace Our Community

LeadershipWe believe that leadership advocacy
and support of our inclusion efforts are
critical to creating the culture we strive
to have. Each of our senior leaders is
responsible for creating inclusion plans
for their respective organizations and
ensuring that their talent pipelines
reflect the diversity of our consumer
base. Our Chief Executive Officer and
Chief Human Resources Officer review
inclusion progress multiple times a year,
and inclusion is incorporated into our
senior level talent reviews. Our senior
leaders also support our inclusion
efforts through their sponsorship
of each of our employee networks,
recruiting and mentoring diverse
employees, and ensuring diverse talent
is represented in our leadership pipeline.
Employee networksMembers of our six employee
networks support each other and
reinforce our culture of inclusion.
Our employee networks include:
n Women’s Leadership Network
n Asian Leader Network
n Betty’s Family Network (LGBTQ)
n Veterans Network
n Black Champions Network
n Hispanic Network
These networks help employees
create more personal and professional
connections within our global work
environment. The ability to connect
with others who are focused on similar
topics allows for more transparent
communication between all employees,
including participating leaders. Our
Women’s Leadership Network is the
first of our networks to expand its
reach with global chapters in countries
such as Brazil, India and France.
v The General Mills Women’s Leadership Network hosted a companywide event on International Women’s Day in March 2018. Women from all functions and levels across the company met to discuss a variety of topics ranging from gender parity to building allies for women in the workplace. Events were held in more than 20 locations around the world. A panel of General Mills women officers, pictured here, shared insights about how they push for progress to support advancement, influence policies and benefits, and enable a culture of courage for women.
More than 600 employees gathered for the General Mills Employee Network Summit in August 2018, bringing together members across our six employee networks. Network members participated in leadership development, community building, exchanging ideas and immersion in the company’s new global inclusion strategy.
Employee Network Summit
GENERAL MILLS GLOBAL RESPONSIBILITY 52
Our Food Our Planet Our Workplace Our Community
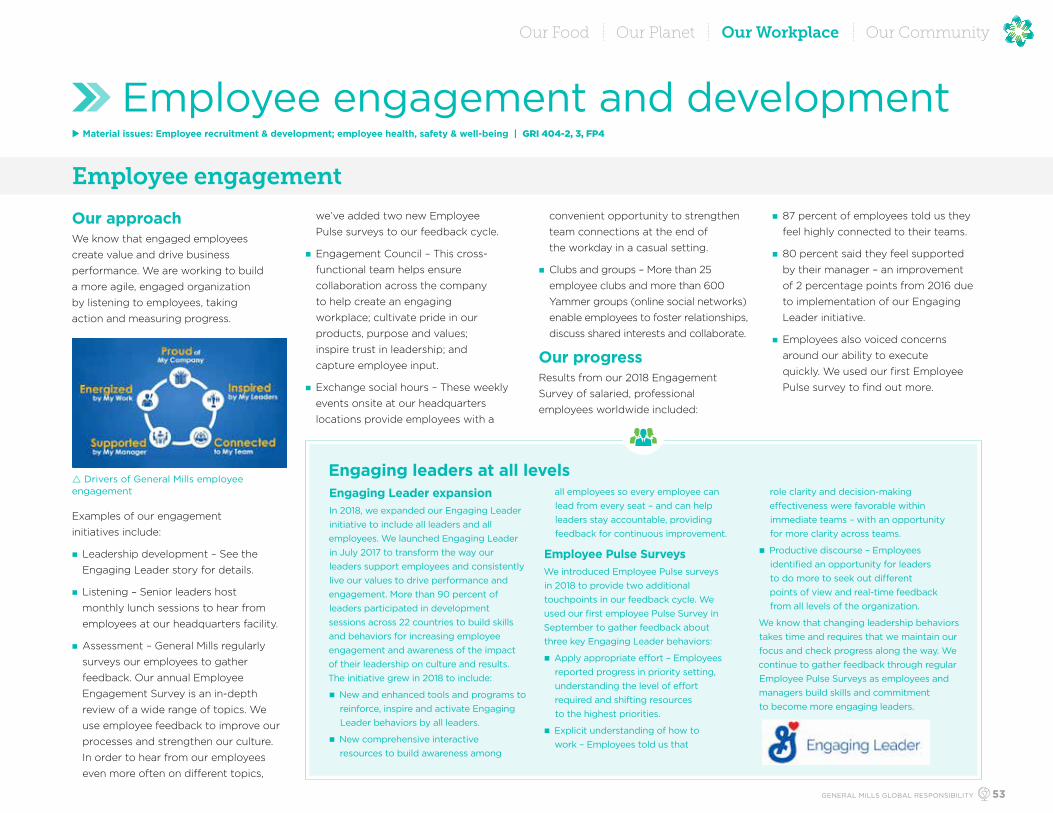
Engaging leaders at all levelsEngaging Leader expansionIn 2018, we expanded our Engaging Leader initiative to include all leaders and all employees. We launched Engaging Leader in July 2017 to transform the way our leaders support employees and consistently live our values to drive performance and engagement. More than 90 percent of leaders participated in development sessions across 22 countries to build skills and behaviors for increasing employee engagement and awareness of the impact of their leadership on culture and results. The initiative grew in 2018 to include:
n New and enhanced tools and programs to reinforce, inspire and activate Engaging Leader behaviors by all leaders.
n New comprehensive interactive resources to build awareness among
all employees so every employee can lead from every seat – and can help leaders stay accountable, providing feedback for continuous improvement.
Employee Pulse SurveysWe introduced Employee Pulse surveys in 2018 to provide two additional touchpoints in our feedback cycle. We used our first employee Pulse Survey in September to gather feedback about three key Engaging Leader behaviors:
n Apply appropriate effort – Employees reported progress in priority setting, understanding the level of effort required and shifting resources to the highest priorities.
n Explicit understanding of how to work – Employees told us that
role clarity and decision-making effectiveness were favorable within immediate teams – with an opportunity for more clarity across teams.
n Productive discourse – Employees identified an opportunity for leaders to do more to seek out different points of view and real-time feedback from all levels of the organization.
We know that changing leadership behaviors takes time and requires that we maintain our focus and check progress along the way. We continue to gather feedback through regular Employee Pulse Surveys as employees and managers build skills and commitment to become more engaging leaders.
Employee engagement and development
Our approachWe know that engaged employees
create value and drive business
performance. We are working to build
a more agile, engaged organization
by listening to employees, taking
action and measuring progress.
Examples of our engagement
initiatives include:
n Leadership development – See the
Engaging Leader story for details.
n Listening – Senior leaders host
monthly lunch sessions to hear from
employees at our headquarters facility.
n Assessment – General Mills regularly
surveys our employees to gather
feedback. Our annual Employee
Engagement Survey is an in-depth
review of a wide range of topics. We
use employee feedback to improve our
processes and strengthen our culture.
In order to hear from our employees
even more often on different topics,
we’ve added two new Employee
Pulse surveys to our feedback cycle.
n Engagement Council – This cross-
functional team helps ensure
collaboration across the company
to help create an engaging
workplace; cultivate pride in our
products, purpose and values;
inspire trust in leadership; and
capture employee input.
n Exchange social hours – These weekly
events onsite at our headquarters
locations provide employees with a
convenient opportunity to strengthen
team connections at the end of
the workday in a casual setting.
n Clubs and groups – More than 25
employee clubs and more than 600
Yammer groups (online social networks)
enable employees to foster relationships,
discuss shared interests and collaborate.
Our progressResults from our 2018 Engagement
Survey of salaried, professional
employees worldwide included:
n 87 percent of employees told us they
feel highly connected to their teams.
n 80 percent said they feel supported
by their manager – an improvement
of 2 percentage points from 2016 due
to implementation of our Engaging
Leader initiative.
n Employees also voiced concerns
around our ability to execute
quickly. We used our first Employee
Pulse survey to find out more.
u Material issues: Employee recruitment & development; employee health, safety & well-being | GRI 404-2, 3, FP4
Employee engagement
r Drivers of General Mills employee engagement
GENERAL MILLS GLOBAL RESPONSIBILITY 53
Our Food Our Planet Our Workplace Our Community
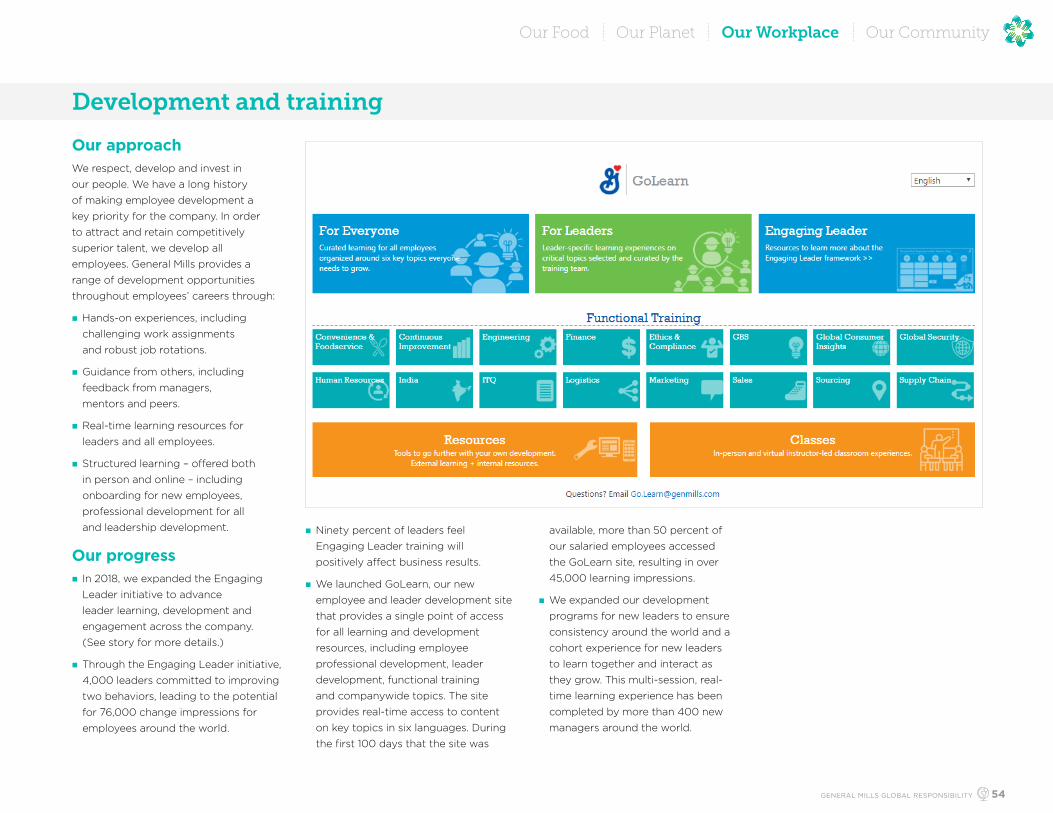
Our approachWe respect, develop and invest in
our people. We have a long history
of making employee development a
key priority for the company. In order
to attract and retain competitively
superior talent, we develop all
employees. General Mills provides a
range of development opportunities
throughout employees’ careers through:
n Hands-on experiences, including
challenging work assignments
and robust job rotations.
n Guidance from others, including
feedback from managers,
mentors and peers.
n Real-time learning resources for
leaders and all employees.
n Structured learning – offered both
in person and online – including
onboarding for new employees,
professional development for all
and leadership development.
Our progressn In 2018, we expanded the Engaging
Leader initiative to advance
leader learning, development and
engagement across the company.
(See story for more details.)
n Through the Engaging Leader initiative,
4,000 leaders committed to improving
two behaviors, leading to the potential
for 76,000 change impressions for
employees around the world.
n Ninety percent of leaders feel
Engaging Leader training will
positively affect business results.
n We launched GoLearn, our new
employee and leader development site
that provides a single point of access
for all learning and development
resources, including employee
professional development, leader
development, functional training
and companywide topics. The site
provides real-time access to content
on key topics in six languages. During
the first 100 days that the site was
available, more than 50 percent of
our salaried employees accessed
the GoLearn site, resulting in over
45,000 learning impressions.
n We expanded our development
programs for new leaders to ensure
consistency around the world and a
cohort experience for new leaders
to learn together and interact as
they grow. This multi-session, real-
time learning experience has been
completed by more than 400 new
managers around the world.
Development and training
GENERAL MILLS GLOBAL RESPONSIBILITY 54
Our Food Our Planet Our Workplace Our Community

Performance managementEach year, approximately 14,000 General
Mills employees globally participate
in our performance management
process. The process includes setting
priorities, frequent check-ins and
feedback, and a formal performance
evaluation process. Employees
also create individual development
plans as part of the process, further
helping to facilitate and encourage
professional development and growth.
RecognitionOur Champions Award celebrates
outstanding achievements and
leadership by individuals and teams
at General Mills. Since the late 1980s,
we have been recognizing award
recipients who have overcome obstacles
with determination and persevered
to deliver significant results for our
business, our employees and our
communities. Based on our Champions
Award criteria, employees are able to
nominate colleagues who exemplify
our core values: play to win; win as a
team; act boldly and move quickly;
grow and inspire; and do the right
thing all the time. In 2018, we added
Engaging Leader behaviors to the
criteria. Seventy Champions Award
winners were selected in 2018.r General Mills performance management process
Our approachWe believe that providing wellness
opportunities for our employees
and their families is crucial to
upholding our company values.
Our progressIn April 2018, we launched our new
My Well-being program in the U.S.
that takes a holistic approach and
supports many aspects of well-being.
A sampling of our programs includes:
n Physical – We encourage good
nutrition, offer employees healthy
dining choices and programs at our
facilities, and provide opportunities
to increase physical activity.
n Emotional – Our LifeWorks Employee
Assistance program helps build
resiliency through counseling,
emotional support and referrals for
U.S. employees and their families.
In 2018, we added a digital sleep
program focused on helping those
with troubled sleep get the resources
and care they need. In 2019, we are
changing the way we approach
mental health: We’ve started by
adding digital ways to engage with
counseling, support and resources to
help reduce barriers and start breaking
the stigma. Many locations also offer
stress and resilience programs.
n Financial – We support the financial
well-being of our employees by
providing them with competitive
programs, resources, salaries and
benefits. Learn more. We also have
financial wellness tools and resources
that allow employees and families
to get on track toward their short-
and long-term financial goals.
n Career – We support our
employees’ career development
with numerous opportunities for
personal and professional growth,
as well as resources to promote
work/life balance. Learn more.
n Social/community – We help
connect employees with community-
based programs where they can
volunteer, receive support and
strengthen connections. Learn
more about our community
engagement programs in the Our
Community section of this report.
Employee well-being
Expanded employee benefitsAt General Mills, we put people first – and that starts with our employees. In a work environment that spans five generations, everyone values different things. We’ve spent a lot of time talking with employees and asking questions about their pain points and what contributes to feeling torn between work and home. As a result, in August 2018 we announced expanded employee benefits beginning in fiscal 2019 for every life stage, including:
n Enhanced maternal leave and parental leave for fathers, partners and adoptive parents.
n New caregiver leave, improved bereavement leave and short-term disability benefits.
n Expanded benefits eligibility to include domestic partners.
Performance management and rewards
GENERAL MILLS GLOBAL RESPONSIBILITY 55
Our Food Our Planet Our Workplace Our Community

IN THIS SECTION
Food security and hunger Sustainable agriculture Hometown communities
We gave US$102 million to charitable causes in fiscal 2018, including General Mills Foundation grants, corporate contributions and food donations.
83 percent of our employees worldwide volunteered in their communities.
Our food donations enabled 29 million meals for food-insecure people across the world in 2018.
$102 million 29
million 83%
Our CommunityOur aim is to build strong, resilient
and sustainable communities.
GENERAL MILLS GLOBAL RESPONSIBILITY 56

Our approachGeneral Mills’ philanthropy is aimed at
supporting flourishing communities and
a thriving planet and ties closely to our
company’s purpose, core business and
food systems knowledge. We partner
in innovative ways with nonprofits
to harness our collective impact in
key areas, while engaging employees
through volunteerism. In short, we work
to harness the power of food for good.
Leadership and governance: General
Mills’ philanthropy and community
engagement programs are led by
the Executive Director of the General
Mills Foundation with support from
program officers. The Foundation
staff includes experienced specialists
who lead and steward the company’s
philanthropy. In addition, employee
councils located across our key global
operating communities assist with local
grant-making by helping to identify
and recommend nonprofits to be
considered for grants. The Foundation
is governed by a Board of Trustees and
Corporate Contributions Committee
that includes the company’s CEO and
leaders from human resources, finance,
legal, R&D and sales functions.
Global focus areas:
Increasing food security
– expanding food
access for families, alleviating
hunger in communities.
Advancing sustainable agriculture – empowering
growers, protecting habitat and
conserving natural resources.
Strengthening hometown communities – making
meaningful impact in the communities
where our employees live and work.
Targeted impact: To ensure General
Mills’ giving is well informed and making
a meaningful difference by strategically
advancing solutions in our priority
issue areas, we use an outcomes-
based philanthropic approach. Led
by our Foundation program officers
with input from internal and external
subject matter experts, we leverage
the evidence base to develop logic
models and impact frameworks for
each of our priority issue areas that
clearly define the end outcomes (social
and environmental) we are targeting;
the key activities and interventions
that best support those outcomes;
and the key measures we will use to
assess our impact and progress along
the way. (See the smallholder farmers
impact framework example at right.)
r See how General Mills uses food as aforce for good.
WATCH VIDEO
IMPACT FRAMEWORK SPOTLIGHT:
Smallholder farmersWe develop impact frameworks for each of our priority issue areas. Our focus on sustainable agriculture includes support for smallholder farmers.
Why we invest: We invest to enhance the well-being and livelihoods of smallholder farmers in our supply chain so they have the capacity (knowledge, skills, empowerment, relationships and other resources) and resiliency necessary to achieve and sustain farm productivity and incomes that meet their families’ economic and social needs.
Targeted outcomes:
n Farmers have capacity and resiliency to withstand shocks (market, climate, etc.), lowering risks to farms and families.
n Farm yield increases (land productivity and crop quality), expanding farm revenue.
n Households are food and nutrition secure.
n Farmers can develop savings and build assets.
n Community members have access to capital to start or expand ventures to improve livelihoods.
n Farmers have greater access to markets through farmer cooperatives and collectives.
n Women influence and can control household economic decisions.
n Children are enrolled in school and attend regularly.
n Children do not participate in inappropriate farm labor.
r Our philanthropy work is strongly aligned with many of the United Nation’s SustainableDevelopment Goals (SDGs), including goals 2, 12 and 13.
Corporate contributions
Food donations
Foundation giving
$28 million
$41 million
$33 million
The amount we gave to charitable causes in fiscal 2018
$102 million
Fiscal 2018 corporate giving
GRI 201-1
GENERAL MILLS GLOBAL RESPONSIBILITY 57
Our Food Our Planet Our Workplace Our Community

What is a food-secure community? When all community members have physical, social and economic access at all times to a wide range of foods that meet their nutritional, cultural and economic needs.
Increasing food security u Material issues: Food security; food waste | GRI 102-13, 40, 42-44, FP4
Community food systemsOur approach: We strengthen
community food systems by:
n Expanding food access – Together
with our nonprofit partners, we are
taking aim at food deserts in and
around our hometown communities
to help ensure that all members
of the community have affordable
access to a wide range of foods.
n Supporting surplus food recovery
and redistribution – General Mills
supports food banks in more than 30
countries, as well as other nonprofits
in our key markets globally.
Our goals:
n Leverage philanthropic partnerships
to help enable 30 billion meals
for hungry people by 2030.
n Eliminate food deserts and increase
food access in at least four General
Mills communities by 2020.
n Invest to expand the capacity of
at least 20 food banks across our
key global markets by 2020.
Our progress:
n Our philanthropic partners enabled
3.5 billion meals worldwide in 2018.
n Community food systems grant
programs have been implemented
in two hometown communities
– Minneapolis, Minnesota, and
Buffalo, New York – to increase
food access and food equity in
underserved neighborhoods.
n Food banks in more
than 30 countries
were supported
and strengthened
by General Mills grants. Our primary
food bank network partners
include the Global Foodbanking
Network and Feeding America.
n 2018 grants included support
for new food bank networks
established in China and India.
In Minneapolis we are working with
the Greater Twin Cities United Way
on a grants program that provides
support to nonprofits focused on
increasing food accessibility, variety,
availability and affordability in the
city’s Northside neighborhoods. As of
December 2018, our community food
systems grants in North Minneapolis
have supported 14 projects spanning
11 nonprofit organizations, including:
n The opening of a new full-service
grocery store that offers health
services and food and
wellness education.
n The expansion of a farmers market
and food hub to enable local food
growers to clean, prepare and sell fresh
foods in the community year-round.
n Growth of a youth-run social
enterprise that grows, prepares
and sells innovative food
products in their community.
In fiscal 2018, we worked with the
United Way of Buffalo and Erie County
to create a food systems grant
program tailored with and for the
Buffalo, New York community. We
announced US$1 million in grants to 13
Buffalo-area nonprofit organizations
supporting programs including:
n A new food co-op and a mobile
grocery store to serve Buffalo’s
food desert neighborhoods.
n Expansion of urban gardens
and the development of a
new urban greenhouse.
n Healthy Corner-Store Initiative to
increase the availability of fresh food
in neighborhood corner-stores.
n Expansion of a community farm
enabling refugee communities to
cultivate culturally preferred foods.
n Culinary and food skills training
for youth.
r In Buffalo, members of the Somali Bantu community cultivate culturally preferred foods at the Somali Bantu Community Farm, supported by a General Mills grant program in partnership with United Way of Buffalo and Erie County. (Credit: Lori Joyce Photography)
General Mills grants supported and strengthened food banks in more than 30 countries.
30 countries
GENERAL MILLS GLOBAL RESPONSIBILITY 58
Our Food Our Planet Our Workplace Our Community

School mealsOur approach: Knowing that schools
can be one of the most powerful levers
for increasing food and nutrition security
among children, we work to improve and
expand access to school meal programs
around the world. In the U.S., Canada and
U.K., our school meals work is focused on
helping schools (predominantly serving
children living in poverty) launch or
expand breakfast programs to eliminate
missing meals. In India, China and Brazil,
our work is focused on strengthening
school feeding programs through
projects that improve the capabilities of
central school kitchens and/or increase
the nourishment of school meals.
Our goals:
n Enable or improve 100 million
school meals for youth living
in poverty by 2020.
n Empower 150 schools serving
at-risk children in General Mills
operating communities to add a
daily school breakfast by 2020.
Our progress: Our philanthropy is
connecting more children than ever
before with school meals, ensuring
that they are nourished and ready to
learn. Our support has enabled more
than 540,000 children worldwide
to access a nourishing school
meal daily, resulting in 116 million
meals a year. Examples include:
n In the Indian states of Uttar Pradesh
and Odisha, our partnership with the
World Food Programme is enabling
school and government officials to
nutritionally fortify school meals
served to 322,000 students daily
(77 million meals per school year).
n Our support for Instituto Melhores
Dias in Brazil enables nourishing
school meals and holistic school-
based programs. Since 2016, Instituto
Melhores Dias has nourished 62,700
schoolchildren at 176 schools,
established 52 school gardens,
and engaged 3,772 teachers and
241 cafeteria workers with General
Mills’ support. Our support will
enable Instituto Melhores Dias to
expand programs that will nearly
double their impact and reach
124,011 children at 304 schools.
n In the U.S., through our partnership
with the Food Research & Action
Center (FRAC), we provide school
breakfast start-up grants to schools in
General Mills communities that serve
children from low-income households.
Working in partnership with local
school district leaders, principals,
parent groups, anti-hunger
advocacy groups and state child
nutrition agencies, FRAC used
funding from General Mills to help
school districts add or expand school
breakfast programs in 11 General Mills
communities. To date, our partnership
with FRAC has enabled more than
14,100 students at 93 schools in
our hometown communities gain
daily access to
a nourishing
school breakfast.
n Through our partnership with No Kid
Hungry, we supported a multiyear
hunger relief campaign focused on
expanding school breakfast programs
in Florida, Michigan, Nevada, Texas,
Washington and Wisconsin. As of
2018, this effort helped launch
programs that connect more than
67,000 children
from low-income
households to daily
school breakfasts.
n Breakfast Club of Canada is the
leading provider of school breakfast
to Canadian children in need. Since
2012, our partnership with Breakfast
Club of Canada has enabled nearly
12,000 children gain daily access to a
nourishing meal at school. General Mills
employees also volunteer their time
to serve meals with Breakfast Club
of Canada. Our support will enable
Breakfast Club of Canada to continue
to provide nourishing school meals
to children at clubs in nearly every
province and raise
awareness about
child hunger
in Canada.
r The World Food Programme supportsfortified school meals for students in India.(Credit: WFP/Isheeta Sumra)
r Children receive nourishing meals through Breakfast Club of Canada. (Credit: Breakfast Clubof Canada)
The number of meals provided to more than 540,000 children worldwide in 2018 with General Mills support.
116 millionr Learn about the impact of nourishing mealsprovided by Instituto Melhores Dias to studentsin Brazil with support from General Mills.
WATCH VIDEO
GENERAL MILLS GLOBAL RESPONSIBILITY 59
Our Food Our Planet Our Workplace Our Community

Food rescue and recoveryOur approach: We catalyze innovative
nonprofit programs that expand surplus
food recovery practices around the globe.
Our goals:
n Invest in food recovery networks
and platforms to empower
25,000 food retailers in surplus
food rescue by 2020.
n Donate General Mills’ surplus food
to enable 200 million meals for
food-insecure people by 2020.
n Enable 10 community nonprofits
in North America to expand their
capacity for food recovery.
Our partners: General Mills provides
philanthropic support to leading
nonprofits that makes it possible for
food manufacturers, grocers, restaurants,
distributors, trucking companies and other
organizations to donate their surplus food
so it can be distributed to people in need.
In the United States, General Mills provided
a US$1 million grant to Feeding America
to refine and scale the MealConnect
food recovery technology platform
that gives food donors like grocery
stores, restaurants and cafes a free, easy
way to reduce waste and transform
their surplus food into nourishing
meals for food-insecure neighbors.
In the U.K., General Mills provides
philanthropic support to FareShare,
which pioneered a retail food
rescue technology platform called
FareShareGO that has recovered
29 million pounds of surplus food
to date and empowered 2,974 retail
locations in the U.K. with systematic
food recovery capabilities, including
Tesco, Asda and Waitrose stores.
Our progress:
n Our global investments in food
recovery technology over the past
three years have empowered more
than 30,000 retailers worldwide to
participate in systematic food rescue.
n In 2018, General Mills piloted
with Feeding America the use of
MealConnect by trucking companies
in the U.S. to help them donate
surplus food from loads that were
rejected due to circumstances such
as slightly damaged packaging. As
a result of the pilot, MealConnect-
Logistics has been adopted by more
than 20 trucking companies.
n Through our original US$1 million
investment in MealConnect, we
have enabled the recovery and
redistribution of more than 1 billion
pounds of surplus food.
n General Mills food donations enabled
29 million meals for food-insecure
people across the world in 2018.
In addition to these food rescue and
recovery programs funded through
philanthropy, General Mills works
across many fronts to prevent and
reduce food waste. Learn more in the
Our Planet section of this report.
As the world’s population continues to rise, we know we must work together to address food security and hunger. In January 2018, General Mills launched the Feeding Better Futures Scholars Program asking young people – ages 13 to 21 – to share their innovative solutions. Five finalists were selected, each having launched successful programs to reduce hunger or improve sustainable agriculture in their communities. In June, Katie Stagliano of Charleston, South Carolina, was selected as the winner for
her work fighting hunger as founder and chief executive gardener of Katie’s Krops. Launched in 2008 when Katie was nine years old, Katie’s Krops empowers kids to grow vegetable gardens and donate the produce to people in need. Since then, the program has grown to 100 gardens around the country and donated thousands of pounds of fresh produce. Katie received US$50,000 to help expand Katie’s Krops, presented her ideas at the Aspen Ideas Festival and is currently being mentored by an industry leader.
Feeding Better Futures
r Learn more about the General Mills Feeding Better Futures Scholars Program.
WATCH VIDEO
r Watch this video to see how General Mills support is helping scale use of the MealConnect app to recover and redirect surplus food across the U.S.
WATCH VIDEO
The number of pounds of surplus food recovered by our hunger relief partners over the past 12 months to feed hungry people (rather than going to waste).
4.2 billion
r With support from General Mills, FareShare in the U.K. last year recovered enough surplus food to help enable 30 million meals for hungry people.
GENERAL MILLS GLOBAL RESPONSIBILITY 60
Our Food Our Planet Our Workplace Our Community

Our approach: We leverage philanthropy
to advance the sustainability of
agriculture and support the conservation
of natural resources around the world.
Aligned with our company’s broader
sustainability goals and commitments,
we philanthropically invest in NGO-led
programs and initiatives that improve the
well-being and resiliency of smallholder
farmers, promote regenerative agricultural
practices, conserve watersheds and
expand pollinator habitats. We believe
these actions have a vital and sustaining
benefit to society and the environment,
while helping to ensure food producers
will be able to feed a growing world.
Our philanthropically funded work
to advance sustainable agriculture
complements the efforts of our
company’s supply chain and business
teams to improve water stewardship,
the health of ecosystems – including
soil health, pollinators and biodiversity –
and sustainable sourcing of ingredients.
Learn more in the Our Planet section
of this report.
Our goals: Our philanthropic goals
within sustainable agriculture include:
n Improve the well-being of 30,000
people (farmers and their families)
by 2030 in smallholder farming
communities from which General
Mills sources cocoa and vanilla.
n Invest in nonprofits to support
widespread adoption of soil health
best practices, such as no-till farming
and the use of cover crops.
n Invest in water stewardship funds
and coalitions in General Mills’
most at-risk watersheds.
n Support the engagement of farmers in
programs to expand pollinator habitat
around agricultural working lands.
Our progress:
n Smallholders – We provided support
to NGO partners in Côte d’Ivoire,
Ghana and Madagascar who are
currently reaching more than 28,000
smallholder farmers and their family
members through programs to improve
farming practices, empower female
farmers, establish farmer cooperatives,
improve food and nutrition security,
support youth education and prevent
child labor. Our NGO partners in this
work include CARE and Positive
Planet. These efforts complement the
collaborative work of our business
teams and suppliers described in the
Our Planet section of this report.
n Soil health – Now at the midpoint of our
three-year, US$3.25 million investment
in soil health, we continue to support
the Soil Health Partnership, Soil Health
Institute and The Nature Conservancy,
extending the complementary
investments of our business teams
described in the Our Planet section.
For example, the Soil Health Institute
has used our US$1 million, 3-year grant
over the past 18 months to identify
the most effective measurements to
assess existing soil health, monitor
progress and track the environmental
impact. The institute has collaborated
with scientists and established more
than 120 research sites across North
America to evaluate the relationship
between soil health indicators and
changes in yield, economics, water
quality and GHG emissions.
n Water stewardship – During 2018,
our contributions supported water
stewardship collaborations in four out
of eight priority watershed regions.
(See more details in the Our Planet
section.) For example, we provided
a US$200,000 contribution to
Sustainable Conservation to improve
and advance water conservation
practices on U.S. dairy and feed farms.
n Pollinators:
w Through our five-year
US$2 million initiative
(US$1.25 million from the
General Mills Foundation and
US$750,000 from Annie’s)
with the Xerces Society for
Invertebrate Conservation, we
continue to support the work of field
biologist teams who are partnering
with farmers to establish and
expand pollinator habitats across
key agricultural regions in the U.S.
w We continue to support research
on bee health by the University
of Minnesota Bee Lab through
our US$150,000 grant in fiscal
2018, building on US$100,000
grants in 2017 and 2016.
w We provided US$125,000 in fiscal
2018 to Observatoire Français
d’Apidologie (OFA) in France to
support OFA bee research, the
European Beekeepers Network
and pollinator habitat plantings.
w These philanthropically funded
efforts complement the
commitments made by our
brands to support pollinator habitat.
(See details in the Our Planet
section.)
Advancing sustainable agricultureu Material issues: Farmer livelihoods; biodiversity; water stewardship | GRI 203-1, 2, FP4
GENERAL MILLS GLOBAL RESPONSIBILITY 61
Our Food Our Planet Our Workplace Our Community

Our approach: Just as we care
about the communities where our
ingredients are grown, we care about
the communities our employees call
home. Around the world, we make a
meaningful impact in our hometown
communities through employee
volunteerism and community giving. Our
employees are General Mills’ greatest
asset, and they are often leaders in their
communities. Supporting local causes
they are passionate about invigorates
our employees and communities.
Our goal is to strengthen hometown
communities by:
n Maintaining an employee volunteerism
rate of 80 percent worldwide.
n Exceeding US$2.5 billion in cumulative
corporate charitable giving by
2020 to strengthen communities.
n Investing in General Mills hometown
communities globally to help
our local communities around
the world grow and thrive.
Our progress:
n 83 percent of our employees
worldwide report volunteering in
their communities, sharing their
time and talent in ways that serve
both people and the planet.
n In fiscal 2018, we contributed
more than US$102 million in
charitable giving worldwide.
n General Mills and our Foundation
have provided more than US$2.4
billion in cumulative giving to
strengthen communities since our
Foundation was established in 1954.*
n We invested in over 50 global
hometown communities with
local grants during fiscal 2018.
Employee volunteerismOur approach: Empower our employees
to apply their skills, expertise and
passion to help their community.
Our progress: General Mills
employees volunteer their time and
talents in more ways than ever:
n Partners in Food Solutions – More
than 500 General Mills employees
have served as volunteers for this
international NGO, founded by
General Mills a decade ago that is
strengthening food security across
Africa. (See story on the next page.)
n Global Volunteer Week – From
prepping meal kits in Hong Kong
to planting gardens in the United
Kingdom, over 3,000 employees
at 42 different locations in 24
countries raised their hand during
our annual Global Volunteer Week
to help strengthen our hometown
communities around the world, giving
a total of 6,100 volunteer hours.
n Nourishing students in Canada –
Employees in Ontario prepare and
serve breakfast to approximately 100
students every day of the school year
at a public school in Mississauga. More
than 40 employees participate –
each person volunteers one hour
every three weeks in groups of
two or three people. In 2018, they
served more than 16,400 breakfasts
to hungry students, providing a
nutritious start to the school day.
n Skills-based volunteerism – General
Mills employees across our marketing
and consumer insights functions
engage in skills-based volunteerism
through our GoodWorks program.
These employees give back to the
community by leveraging their skills
to help nonprofit organizations
with marketing challenges. Since
the program’s inception in 2009,
more than 230 volunteers have
completed 51 pro bono projects
through GoodWorks with rave reviews
from the nonprofit organizations
benefiting from their work.
n Water conservation – Employees
from our Albuquerque, New Mexico,
facility partnered with The Nature
Conservancy to assist a local
elementary school with a water
*Since 1954, General Mills, Inc. and the General Mills Foundation have contributed US$2.4 billion. This figure includes Foundation grants, Box Tops for Education™ giving, corporate contributions and the company’s global food donations.
r These General Mills employees volunteered at the University of Minnesota Bee Lab by building frames for bee hives.
r This team of General Mills employees helped build a house with Habitat for Humanity.
Box Tops for Education Our approach: Box Tops for Education™ is a program operated by General Mills that provides funds for participating U.S. schools, which can be used for supplies and other priorities.
Our progress:
n US$882 million provided through Box Tops for Education since the program began in 1996.
n US$42 million earned by U.S. schools during the 2017-2018 school year.
n 30 million households participating.
n 70,000 U.S. schools benefiting from the program.
Strengthening hometown communities GRI 413-1, FP4
GENERAL MILLS GLOBAL RESPONSIBILITY 62
Our Food Our Planet Our Workplace Our Community
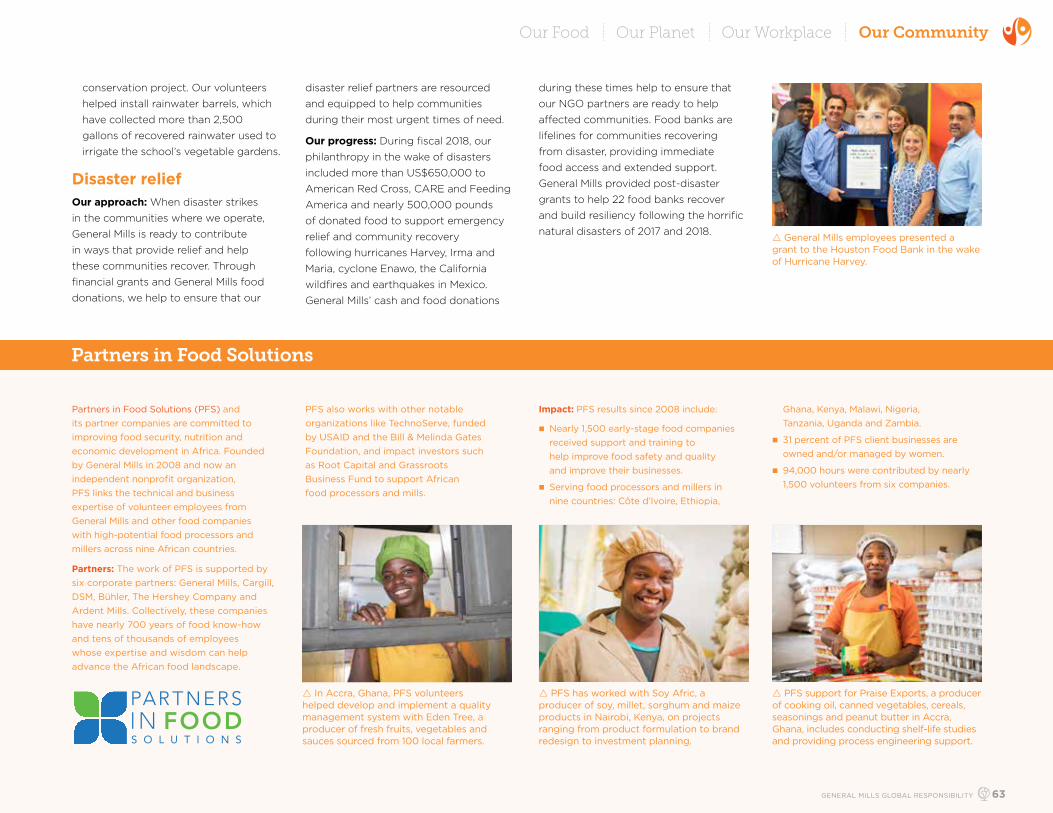
Partners in Food Solutions (PFS) and its partner companies are committed to improving food security, nutrition and economic development in Africa. Founded by General Mills in 2008 and now an independent nonprofit organization, PFS links the technical and business expertise of volunteer employees from General Mills and other food companies with high-potential food processors and millers across nine African countries.
Partners: The work of PFS is supported by six corporate partners: General Mills, Cargill, DSM, Bühler, The Hershey Company and Ardent Mills. Collectively, these companies have nearly 700 years of food know-how and tens of thousands of employees whose expertise and wisdom can help advance the African food landscape.
PFS also works with other notable organizations like TechnoServe, funded by USAID and the Bill & Melinda Gates Foundation, and impact investors such as Root Capital and Grassroots Business Fund to support African food processors and mills.
Impact: PFS results since 2008 include:
n Nearly 1,500 early-stage food companies received support and training to help improve food safety and quality and improve their businesses.
n Serving food processors and millers in nine countries: Côte d’Ivoire, Ethiopia,
Ghana, Kenya, Malawi, Nigeria, Tanzania, Uganda and Zambia.
n 31 percent of PFS client businesses are owned and/or managed by women.
n 94,000 hours were contributed by nearly 1,500 volunteers from six companies.
Partners in Food Solutions
r In Accra, Ghana, PFS volunteers helped develop and implement a quality management system with Eden Tree, a producer of fresh fruits, vegetables and sauces sourced from 100 local farmers.
r PFS support for Praise Exports, a producer of cooking oil, canned vegetables, cereals, seasonings and peanut butter in Accra, Ghana, includes conducting shelf-life studies and providing process engineering support.
r PFS has worked with Soy Afric, a producer of soy, millet, sorghum and maize products in Nairobi, Kenya, on projects ranging from product formulation to brand redesign to investment planning.
conservation project. Our volunteers
helped install rainwater barrels, which
have collected more than 2,500
gallons of recovered rainwater used to
irrigate the school’s vegetable gardens.
Disaster reliefOur approach: When disaster strikes
in the communities where we operate,
General Mills is ready to contribute
in ways that provide relief and help
these communities recover. Through
financial grants and General Mills food
donations, we help to ensure that our
disaster relief partners are resourced
and equipped to help communities
during their most urgent times of need.
Our progress: During fiscal 2018, our
philanthropy in the wake of disasters
included more than US$650,000 to
American Red Cross, CARE and Feeding
America and nearly 500,000 pounds
of donated food to support emergency
relief and community recovery
following hurricanes Harvey, Irma and
Maria, cyclone Enawo, the California
wildfires and earthquakes in Mexico.
General Mills’ cash and food donations
during these times help to ensure that
our NGO partners are ready to help
affected communities. Food banks are
lifelines for communities recovering
from disaster, providing immediate
food access and extended support.
General Mills provided post-disaster
grants to help 22 food banks recover
and build resiliency following the horrific
natural disasters of 2017 and 2018.r General Mills employees presented a grant to the Houston Food Bank in the wake of Hurricane Harvey.
GENERAL MILLS GLOBAL RESPONSIBILITY 63
Our Food Our Planet Our Workplace Our Community
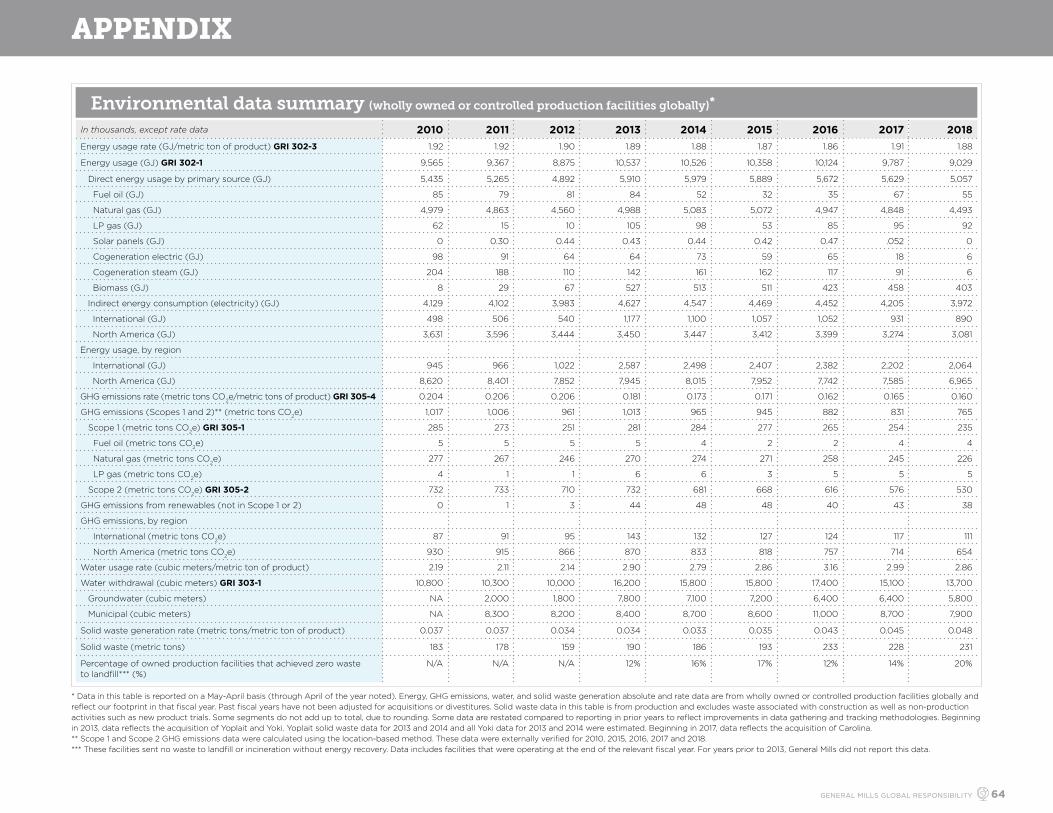
Environmental data summary (wholly owned or controlled production facilities globally)*
In thousands, except rate data 2010 2011 2012 2013 2014 2015 2016 2017 2018Energy usage rate (GJ/metric ton of product) GRI 302-3 1.92 1.92 1.90 1.89 1.88 1.87 1.86 1.91 1.88
Energy usage (GJ) GRI 302-1 9,565 9,367 8,875 10,537 10,526 10,358 10,124 9,787 9,029
Direct energy usage by primary source (GJ) 5,435 5,265 4,892 5,910 5,979 5,889 5,672 5,629 5,057
Fuel oil (GJ) 85 79 81 84 52 32 35 67 55
Natural gas (GJ) 4,979 4,863 4,560 4,988 5,083 5,072 4,947 4,848 4,493
LP gas (GJ) 62 15 10 105 98 53 85 95 92
Solar panels (GJ) 0 0.30 0.44 0.43 0.44 0.42 0.47 .052 0
Cogeneration electric (GJ) 98 91 64 64 73 59 65 18 6
Cogeneration steam (GJ) 204 188 110 142 161 162 117 91 6
Biomass (GJ) 8 29 67 527 513 511 423 458 403
Indirect energy consumption (electricity) (GJ) 4,129 4,102 3,983 4,627 4,547 4,469 4,452 4,205 3,972
International (GJ) 498 506 540 1,177 1,100 1,057 1,052 931 890
North America (GJ) 3,631 3,596 3,444 3,450 3,447 3,412 3,399 3,274 3,081
Energy usage, by region
International (GJ) 945 966 1,022 2,587 2,498 2,407 2,382 2,202 2,064
North America (GJ) 8,620 8,401 7,852 7,945 8,015 7,952 7,742 7,585 6,965
GHG emissions rate (metric tons CO2e/metric tons of product) GRI 305-4 0.204 0.206 0.206 0.181 0.173 0.171 0.162 0.165 0.160
GHG emissions (Scopes 1 and 2)** (metric tons CO2e) 1,017 1,006 961 1,013 965 945 882 831 765
Scope 1 (metric tons CO2e) GRI 305-1 285 273 251 281 284 277 265 254 235
Fuel oil (metric tons CO2e) 5 5 5 5 4 2 2 4 4
Natural gas (metric tons CO2e) 277 267 246 270 274 271 258 245 226
LP gas (metric tons CO2e) 4 1 1 6 6 3 5 5 5
Scope 2 (metric tons CO2e) GRI 305-2 732 733 710 732 681 668 616 576 530
GHG emissions from renewables (not in Scope 1 or 2) 0 1 3 44 48 48 40 43 38
GHG emissions, by region
International (metric tons CO2e) 87 91 95 143 132 127 124 117 111
North America (metric tons CO2e) 930 915 866 870 833 818 757 714 654
Water usage rate (cubic meters/metric ton of product) 2.19 2.11 2.14 2.90 2.79 2.86 3.16 2.99 2.86
Water withdrawal (cubic meters) GRI 303-1 10,800 10,300 10,000 16,200 15,800 15,800 17,400 15,100 13,700
Groundwater (cubic meters) NA 2,000 1,800 7,800 7,100 7,200 6,400 6,400 5,800
Municipal (cubic meters) NA 8,300 8,200 8,400 8,700 8,600 11,000 8,700 7,900
Solid waste generation rate (metric tons/metric ton of product) 0.037 0.037 0.034 0.034 0.033 0.035 0.043 0.045 0.048
Solid waste (metric tons) 183 178 159 190 186 193 233 228 231
Percentage of owned production facilities that achieved zero waste to landfill*** (%)
N/A N/A N/A 12% 16% 17% 12% 14% 20%
* Data in this table is reported on a May-April basis (through April of the year noted). Energy, GHG emissions, water, and solid waste generation absolute and rate data are from wholly owned or controlled production facilities globally and reflect our footprint in that fiscal year. Past fiscal years have not been adjusted for acquisitions or divestitures. Solid waste data in this table is from production and excludes waste associated with construction as well as non-production activities such as new product trials. Some segments do not add up to total, due to rounding. Some data are restated compared to reporting in prior years to reflect improvements in data gathering and tracking methodologies. Beginningin 2013, data reflects the acquisition of Yoplait and Yoki. Yoplait solid waste data for 2013 and 2014 and all Yoki data for 2013 and 2014 were estimated. Beginning in 2017, data reflects the acquisition of Carolina.** Scope 1 and Scope 2 GHG emissions data were calculated using the location-based method. These data were externally verified for 2010, 2015, 2016, 2017 and 2018.*** These facilities sent no waste to landfill or incineration without energy recovery. Data includes facilities that were operating at the end of the relevant fiscal year. For years prior to 2013, General Mills did not report this data.
APPENDIX
GENERAL MILLS GLOBAL RESPONSIBILITY 64

Methodology: We work with Quantis to calculate
our global GHG emissions footprint each fiscal
year, following the guidelines of the GHG Protocol
Corporate Accounting and Reporting Standard.
This footprint covers our complete value chain,
from the farms that grow our ingredients to
consumers who use our products.
We work to continually update our methodology,
visibility and accuracy, and update results as
appropriate each year.
2018
Value chain phase Scope 1 Scope 2 Scope 3 Total 2017 total 2010 total
Agriculture and transformation 0 0 7,380,000 7,380,000 7,520,000 8,890,000
Packaging supply chain 0 0 1,090,000 1,090,000 1,170,000 1,350,000
Producing** 236,000 538,000*** 809,000 1,580,000 1,730,000 1,750,000
Shipping 1,600 0 1,140,000 1,140,000 1,350,000 1,460,000
Selling 47,000 53,000 749,000 849,000 905,000 933,000
Consuming 0 0 3,290,000 3,290,000 3,330,000 3,340,000
Total 284,000 591,000 14,500,000 15,300,000 16,000,000 17,700,000
Greenhouse gas emissions GRI 305-1, 2, 3
*Some segments do not add up to total due to rounding.**Data in the Environmental Data Summary are from wholly owned or controlled production facilities globally. The data in this table include those locations as well as other
wholly owned or controlled facilities globally (such as offices and Häagen-Dazs Shops) as well as fleet vehicles. ***This data is calculated using the location-based method.
GHG emissions across the value chain by scope* (metric tons CO2e)
Workforce by employment type and gender*Female Total
Full-time Part-time Full-time Part-time
Apprentice 82 25 169 45
Casual 3 195 24 257
Intern 43 3 89 3
Regular 11,779 4,093 29,876 6,170
Seasonal 79 9 181 17
Temporary 253 591 524 928
Total 12,239 4,916 30,863 7,420
Workforce by region and gender*Female Total
Africa 0 1
Asia 7,471 13,224
Australasia 151 312
Europe 1,596 4,047
North America 6,191 14,903
South America 1,746 5,796
Total 17,155 38,283
Workforce and governance data summary GRI 102-8, 405-1
*Data at end of fiscal 2018; excludes Blue Buffalo employees.
*Represents board composition as of Dec 31, 2018.
*Data at end of fiscal 2018; excludes Blue Buffalo employees.
Board of Directors diversity (% of total)*Male 58%
Female 42%
African-American 17%
Asian 0%
Hispanic 17%
Native American/American Indian 0%
Age 50+ 92%
Workforce benefits GRI 401-2
Highlights of the benefits offered by General Mills*
Pay Employees earn a competitive salary and annual bonus when they meet our ambitious goals. Salaries are reviewed each year, with increases based on performance and the market value of the position. Annual cash bonuses are based on performance (individual, company and, in some cases, business unit).
Health benefits General Mills offers employees and eligible dependents medical, dental and vision plans starting on the first day of employment.
Retirement and savings plans General Mills offers tools and resources to manage current and future savings goals. Eligibility for General Mills’ 401(k) Plan starts on the first day of employment. Employees can access free, confidential education on managing money, college and tax savings, and more.
Stock options and ownership Company stock is available in the 401(k) Plan. Our voluntary stock purchase program allows another ownership opportunity. Annual stock option grants are available to some management-level employees.
Insurance Life, long-term care, legal, and auto and homeowners insurance is available, plus company-paid short- and long-term disability insurance.
Education assistance Loans and scholarship opportunities are available for employees and family members, plus reimbursement for job-related courses. Employees may be eligible for an unpaid leave of absence to further their education.
Flexible work We offer telecommuting, flextime and part-time arrangements where business conditions allow.
Parenting benefits General Mills offers maternity leave benefits to birth mothers and also offers benefits to new fathers and adoptive parents.
Credit Union Employees and their families are eligible for complete banking and financial services from the General Mills Federal Credit Union, established in 1935.
*Benefits may vary for employees by location and other factors.GENERAL MILLS GLOBAL RESPONSIBILITY 65

Global Reporting Initiative (GRI) index*
Disclosure Location/comments UN SDGs
GRI 102: General Disclosures
Organizational profile
102-1 Name of the organization 2018 10-K
102-2 Activities, brands, products, and services Introduction, 2018 10-K
102-3 Location of headquarters 2018 10-K
102-4 Location of operations GeneralMills.com/Company/Countries
102-5 Ownership and legal form 2018 10-K
102-6 Markets served GeneralMills.com/Company/Countries
102-7 Scale of the organization 2018 Annual Report
102-8 Information on employees and other workers
Appendix 8
102-9 Supply chain Introduction, Our Planet
102-10 Significant changes to the organization and its supply chain
2018 Annual Report
102-11 Precautionary Principle or approach Our Planet
102-12 External initiatives Introduction, Our Planet, Our Community
102-13 Membership of associations Introduction, Our Planet, Our Community
Strategy
102-14 Statement from senior decision-maker CEO letter, 2018 Annual Report
102-15 Key impacts, risks, and opportunities 2018 10-K
Ethics and integrity
102-16 Values, principles, standards, and norms of behavior
Introduction, Our Workplace
16
102-17 Mechanisms for advice and concerns about ethics
Our Workplace 16
Governance
102-18 Governance structure GeneralMills.com/Investors
102-19 Delegating authority Introduction
102-20 Executive-level responsibility for economic, environmental, and social topics
Introduction
Disclosure Location/comments UN SDGs
GRI 102: General Disclosures (cont.)
Governance (cont.)
102-21 Consulting stakeholders on economic, environmental, and social topics
GeneralMills.com/Investors 16
102-22 Composition of the highest governance body and its committees
GeneralMills.com/Investors 5, 16
102-23 Chair of the highest governance body GeneralMills.com/Investors 16
102-24 Nominating and selecting the highest governance body
GeneralMills.com/Investors 5, 16
102-25 Conflicts of interest GeneralMills.com/Investors 16
102-26 Role of highest governance body in setting purpose, values, and strategy
Introduction, Our Planet
102-28 Evaluating the highest governance body's performance
GeneralMills.com/Investors
102-29 Identifying and managing economic, environmental, and social impacts
GeneralMills.com/Investors, Introduction
16
102-30 Effectiveness of risk management processes GeneralMills.com/Investors, Introduction
102-31 Review of economic, environmental, and social topics
GeneralMills.com/Investors, Introduction
102-32 Highest governance body's role in sustainability reporting
Introduction
102-33 Communicating critical concerns GeneralMills.com/Investors
102-34 Nature and total number of critical concerns 2018 Proxy Statement
102-35 Remuneration policies 2018 Proxy Statement
102-36 Process for determining remuneration 2018 Proxy Statement
102-37 Stakeholders involvement in remuneration GeneralMills.com/Investors 16
Stakeholder engagement
102-40 List of stakeholder groups Introduction, Our Planet, Our Community
102-41 Collective bargaining agreements Approximately 30% of U.S. production employees are covered by CBAs.
8
102-42 Identifying and selecting stakeholders Introduction, Our Planet, Our Community
*Using GRI 2016 Sustainability Reporting Standards. Reporting disclosures may not be applied fully for all Standards.GENERAL MILLS GLOBAL RESPONSIBILITY 66
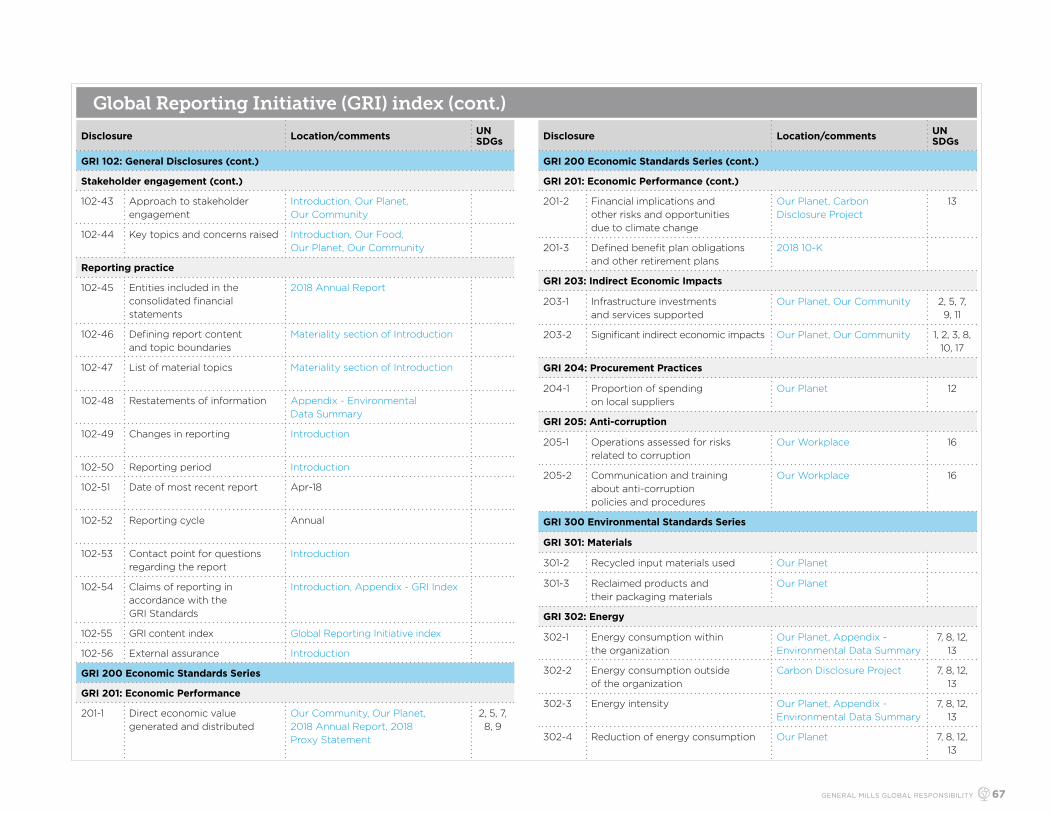
Global Reporting Initiative (GRI) index (cont.)
Disclosure Location/comments UN SDGs
GRI 102: General Disclosures (cont.)
Stakeholder engagement (cont.)
102-43 Approach to stakeholder engagement
Introduction, Our Planet, Our Community
102-44 Key topics and concerns raised Introduction, Our Food, Our Planet, Our Community
Reporting practice
102-45 Entities included in the consolidated financial statements
2018 Annual Report
102-46 Defining report content and topic boundaries
Materiality section of Introduction
102-47 List of material topics Materiality section of Introduction
102-48 Restatements of information Appendix - Environmental Data Summary
102-49 Changes in reporting Introduction
102-50 Reporting period Introduction
102-51 Date of most recent report Apr-18
102-52 Reporting cycle Annual
102-53 Contact point for questions regarding the report
Introduction
102-54 Claims of reporting in accordance with the GRI Standards
Introduction, Appendix - GRI Index
102-55 GRI content index Global Reporting Initiative index
102-56 External assurance Introduction
GRI 200 Economic Standards Series
GRI 201: Economic Performance
201-1 Direct economic value generated and distributed
Our Community, Our Planet, 2018 Annual Report, 2018 Proxy Statement
2, 5, 7, 8, 9
Disclosure Location/comments UN SDGs
GRI 200 Economic Standards Series (cont.)
GRI 201: Economic Performance (cont.)
201-2 Financial implications and other risks and opportunities due to climate change
Our Planet, Carbon Disclosure Project
13
201-3 Defined benefit plan obligations and other retirement plans
2018 10-K
GRI 203: Indirect Economic Impacts
203-1 Infrastructure investments and services supported
Our Planet, Our Community 2, 5, 7, 9, 11
203-2 Significant indirect economic impacts Our Planet, Our Community 1, 2, 3, 8, 10, 17
GRI 204: Procurement Practices
204-1 Proportion of spending on local suppliers
Our Planet 12
GRI 205: Anti-corruption
205-1 Operations assessed for risks related to corruption
Our Workplace 16
205-2 Communication and training about anti-corruption policies and procedures
Our Workplace 16
GRI 300 Environmental Standards Series
GRI 301: Materials
301-2 Recycled input materials used Our Planet
301-3 Reclaimed products and their packaging materials
Our Planet
GRI 302: Energy
302-1 Energy consumption within the organization
Our Planet, Appendix - Environmental Data Summary
7, 8, 12, 13
302-2 Energy consumption outside of the organization
Carbon Disclosure Project 7, 8, 12, 13
302-3 Energy intensity Our Planet, Appendix - Environmental Data Summary
7, 8, 12, 13
302-4 Reduction of energy consumption Our Planet 7, 8, 12, 13
GENERAL MILLS GLOBAL RESPONSIBILITY 67

Global Reporting Initiative (GRI) index (cont.)
Disclosure Location/comments UN SDGs
GRI 300 Environmental Standards Series (cont.)
GRI 303: Water
303-1 Water withdrawal by source Our Planet, Appendix - Environmental Data Summary
6
303-2 Water sources significantly affected by withdrawal of water
Our Planet 6
303-3 Water recycled and reused Our Planet 6, 8, 12
GRI 304: Biodiversity
304-2 Significant impacts of activities, products, and services on biodiversity
Our Planet 6, 14, 15
304-3 Habitats protected or restored Our Planet 6, 14, 15
GRI 305: Emissions
305-1 Direct (Scope 1) GHG emissions Our Planet, Appendix - Environmental Data Summary
3, 12, 13, 14, 15
305-2 Energy indirect (Scope 2) GHG emissions
Our Planet, Appendix - Environmental Data Summary
3, 12, 13, 14, 15
305-3 Other indirect (Scope 3) GHG emissions
Our Planet, Carbon Disclosure Project
3, 12, 13, 14, 15
305-4 GHG emissions intensity Our Planet, Environmental Data Summary
13, 14, 15
305-5 Reduction of GHG emissions Our Planet 13, 14, 15
305-6 Emissions of ozone-depleting substances (ODS)
Ozone-depleting substances (ODS) are most commonly used in small quantities for closed-loop refrigeration systems and occasional fumigation activities. ODS emissions are strictly regulated.
3, 20
305-7 Nitrogen oxides (NOX), sulfur oxides (SOX), and other significant air emissions
Air emissions primarily include particulate matter and organic compounds from ingredient handling, cooking and drying, as well as emissions associated with fuel combustion. Our production facilities are governed by applicable regulations as well as our compliance management program.
3, 12, 14, 15
Disclosure Location/comments UN SDGs
GRI 300 Environmental Standards Series (cont.)
GRI 306: Effluents and Waste
306-1 Water discharge by quality and destination
We do not discharge untreated sanitary wastewater to land or surface waters at any of our locations. Wastewater discharges primarily consist of organic matter from ingredient handling, food production and cleaning processes. Our production facilities are governed by applicable regulations as well as our compliance management program.
3, 6, 12, 14
306-2 Waste by type and disposal method
Our Planet 3, 6, 12
306-3 Significant spills There were no significant spills at our manufacturing locations during the reporting period.
3, 6, 12, 14, 15
306-4 Transport of hazardous waste The quantity of hazardous waste produced and shipped is insignificant relative to the amount of solid waste generated at General Mills. Hazardous waste shipping and disposal is restricted by government regulations.
3, 12
306-5 Water bodies affected by water discharges and/or runoff
No water bodies are significantly affected by company discharges. Our production facilities are governed by applicable regulations as well as our compliance management program.
6, 14, 15
GRI 307: Environmental Compliance
307-1 Non-compliance with environmental laws and regulations
General Mills incurred 3 Notices of Violations (NOVs) and no significant fines during the reporting period.
16
GRI 308: Supplier Environmental Assessment
308-1 New suppliers that were screened using environmental criteria
Supplier Code of Conduct
GENERAL MILLS GLOBAL RESPONSIBILITY 68

Global Reporting Initiative (GRI) index (cont.)
Disclosure Location/comments UN SDGs
GRI 400 Social Standards Series
GRI 401: Employment
401-2 Benefits provided to full-time employees that are not provided to temporary or part-time employees
Appendix 8
GRI 403: Occupational Health and Safety
403-1 Workers representation in formal joint management-worker health and safety committees
Our Workplace 8
403-2 Types of injury and rates of injury, occupational diseases, lost days and absenteeism, and number of work-related fatalities
Our Workplace; Although we had our most statistically safe year in the history of the company, we tragically lost four lives – one General Mills employee and three contractors – in two separate fatal incidents in FY18.
3, 8
403-4 Health and safety topics covered in formal agreements with trade unions
Our Workplace 8
GRI 404: Training and Education
404-2 Programs for upgrading employee skills and transition assistance programs
Our Workplace 8
404-3 Percentage of employees receiving regular performance and career development reviews
Our Workplace 5, 8
GRI 405: Diversity and Equal Opportunity
405-1 Diversity of governance bodies and employees
Our Workplace, Appendix, GeneralMills.com/Investors
5, 8
GRI 407: Freedom of Association and Collective Bargaining
407-1 Operations and suppliers in which the right to freedom of association and collective bargaining may be at risk
Our Planet 8
GRI 408: Child Labor
408-1 Operations and suppliers at significant risk for incidents of child labor
Our Planet 8, 16
Disclosure Location/comments UN SDGs
GRI 400 Social Standards Series (cont.)
GRI 409: Forced or Compulsory Labor
409-1 Operations and suppliers at significant risk for incidents of forced or compulsory labor
Our Planet 8
GRI 412: Human Rights Assessment
412-1 Operations that have been subject to human rights reviews or impact assessments
Our Planet
412-3 Significant investment agreements and contracts that include human rights clauses or that underwent human rights screening
Our Planet, Supplier Code of Conduct
16
GRI 413: Local Communities
413-1 Operations with local community engagement, impact assessments, and development programs
Our Planet, Our Community
GRI 414: Supplier Social Assessment
414-1 New suppliers that were screened using social criteria
Supplier Code of Conduct 5, 8, 16
414-2 Negative social impacts in the supply chain and actions taken
Our Planet 5, 8, 16
GRI 415: Public Policy
415-1 Political contributions Civic Involvement, Introduction
16
GRI 416: Customer Health and Safety
416-1 Assessment of the health and safety impacts of product and service categories
Our Food, Our Workplace
416-2 Incidents of non-compliance concerning the health and safety impacts of products and services
Our Food 16
GRI 417: Marketing and Labeling
417-1 Requirements for product and service information and labeling
Our Food 12
GENERAL MILLS GLOBAL RESPONSIBILITY 69
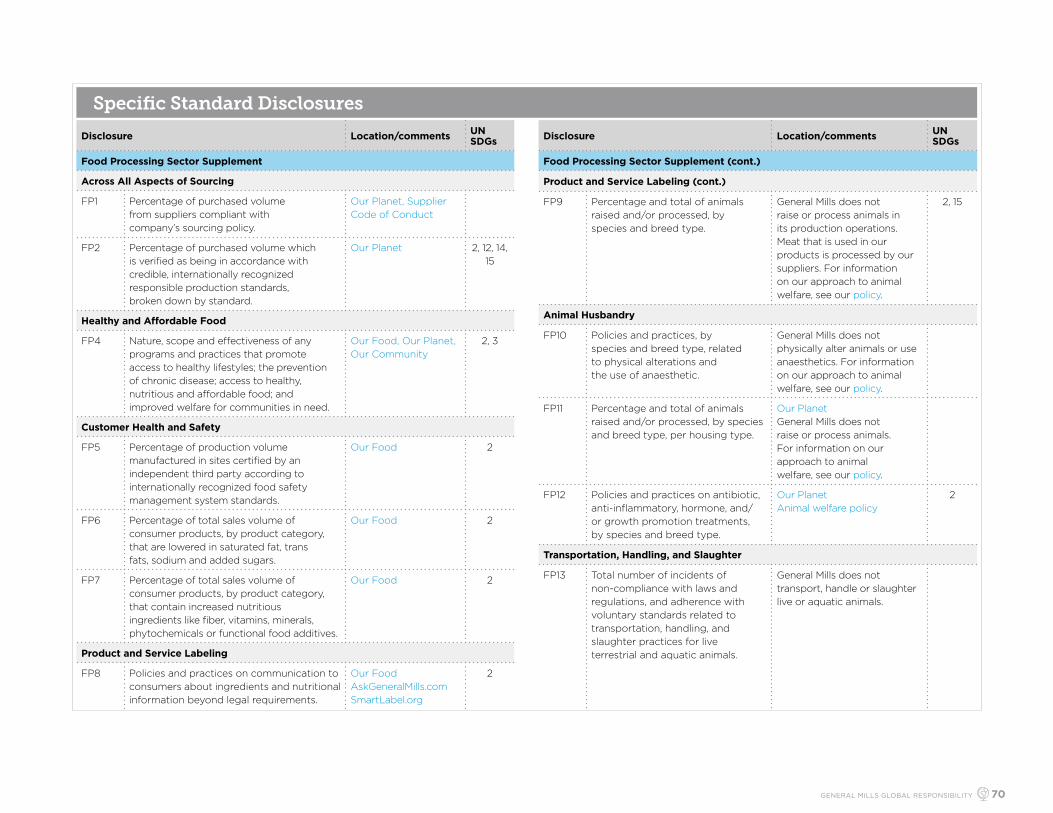
Specific Standard Disclosures
Disclosure Location/comments UN SDGs
Food Processing Sector Supplement
Across All Aspects of Sourcing
FP1 Percentage of purchased volume from suppliers compliant with company’s sourcing policy.
Our Planet, Supplier Code of Conduct
FP2 Percentage of purchased volume which is verified as being in accordance with credible, internationally recognized responsible production standards, broken down by standard.
Our Planet 2, 12, 14, 15
Healthy and Affordable Food
FP4 Nature, scope and effectiveness of any programs and practices that promote access to healthy lifestyles; the prevention of chronic disease; access to healthy, nutritious and affordable food; and improved welfare for communities in need.
Our Food, Our Planet, Our Community
2, 3
Customer Health and Safety
FP5 Percentage of production volume manufactured in sites certified by an independent third party according to internationally recognized food safety management system standards.
Our Food 2
FP6 Percentage of total sales volume of consumer products, by product category, that are lowered in saturated fat, trans fats, sodium and added sugars.
Our Food 2
FP7 Percentage of total sales volume of consumer products, by product category, that contain increased nutritious ingredients like fiber, vitamins, minerals, phytochemicals or functional food additives.
Our Food 2
Product and Service Labeling
FP8 Policies and practices on communication to consumers about ingredients and nutritional information beyond legal requirements.
Our FoodAskGeneralMills.comSmartLabel.org
2
Disclosure Location/comments UN SDGs
Food Processing Sector Supplement (cont.)
Product and Service Labeling (cont.)
FP9 Percentage and total of animals raised and/or processed, by species and breed type.
General Mills does not raise or process animals in its production operations. Meat that is used in our products is processed by our suppliers. For information on our approach to animal welfare, see our policy.
2, 15
Animal Husbandry
FP10 Policies and practices, by species and breed type, related to physical alterations and the use of anaesthetic.
General Mills does not physically alter animals or use anaesthetics. For information on our approach to animal welfare, see our policy.
FP11 Percentage and total of animals raised and/or processed, by species and breed type, per housing type.
Our Planet General Mills does not raise or process animals. For information on our approach to animal welfare, see our policy.
FP12 Policies and practices on antibiotic, anti-inflammatory, hormone, and/or growth promotion treatments, by species and breed type.
Our Planet Animal welfare policy
2
Transportation, Handling, and Slaughter
FP13 Total number of incidents of non-compliance with laws and regulations, and adherence with voluntary standards related to transportation, handling, and slaughter practices for live terrestrial and aquatic animals.
General Mills does not transport, handle or slaughter live or aquatic animals.
GENERAL MILLS GLOBAL RESPONSIBILITY 70

United Nations Global Compact PrinciplesPrinciple Information in report
Human rights
Principle 1: Businesses should support and respect the protection of internationally proclaimed human rights; and Ethics and compliance
Human rights
Supplier Code of Conduct
Principle 2: make sure that they are not complicit in human rights abuses. Ethics and compliance
Human rights
Labor
Principle 3: Businesses should uphold the freedom of association and the effective recognition of the right to collective bargaining;
Human rights
Supplier Code of Conduct
Principle 4: the elimination of all forms of forced and compulsory labor; Human rights
Supplier Code of Conduct
Principle 5: the effective abolition of child labor; and Human rights
Supplier Code of Conduct
Principle 6: the elimination of discrimination in respect to employment and occupation. Ethics and compliance
Global inclusion
Supplier Code of Conduct
Environment
Principle 7: Businesses should support a precautionary approach to environmental challenges; Climate change approach
Sourcing approach
Principle 8: undertake initiatives to promote greater environmental responsibility; and Climate change performance
Responsible sourcing
Producing
Water stewardship
Principle 9: encourage the development and diffusion of environmentally friendly technologies. Climate change performance
Responsible sourcing
Producing
Water stewardship
Anti-corruption
Principle 10: Businesses should work against corruption in all its forms, including extortion and bribery. Supplier Code of Conduct
Code of Conduct
GENERAL MILLS GLOBAL RESPONSIBILITY 71
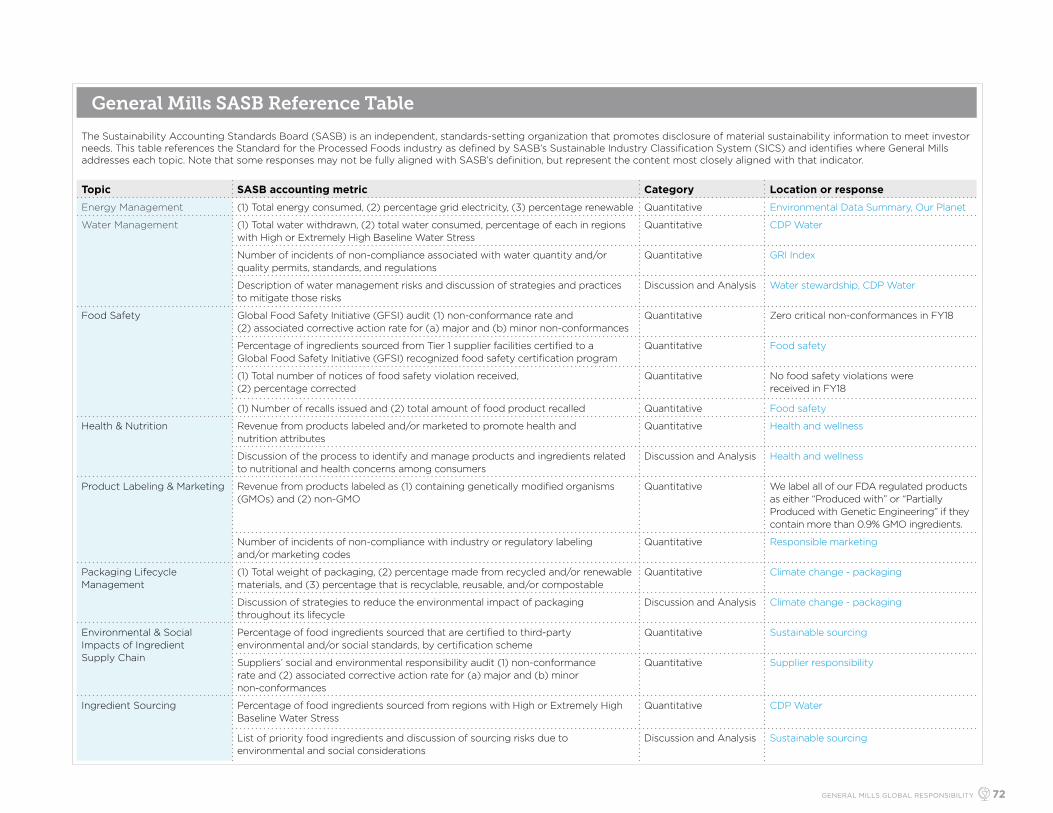
General Mills SASB Reference Table
The Sustainability Accounting Standards Board (SASB) is an independent, standards-setting organization that promotes disclosure of material sustainability information to meet investor needs. This table references the Standard for the Processed Foods industry as defined by SASB’s Sustainable Industry Classification System (SICS) and identifies where General Mills addresses each topic. Note that some responses may not be fully aligned with SASB’s definition, but represent the content most closely aligned with that indicator.
Topic SASB accounting metric Category Location or response
Energy Management (1) Total energy consumed, (2) percentage grid electricity, (3) percentage renewable Quantitative Environmental Data Summary, Our Planet
Water Management (1) Total water withdrawn, (2) total water consumed, percentage of each in regions with High or Extremely High Baseline Water Stress
Quantitative CDP Water
Number of incidents of non-compliance associated with water quantity and/or quality permits, standards, and regulations
Quantitative GRI Index
Description of water management risks and discussion of strategies and practices to mitigate those risks
Discussion and Analysis Water stewardship, CDP Water
Food Safety Global Food Safety Initiative (GFSI) audit (1) non-conformance rate and (2) associated corrective action rate for (a) major and (b) minor non-conformances
Quantitative Zero critical non-conformances in FY18
Percentage of ingredients sourced from Tier 1 supplier facilities certified to a Global Food Safety Initiative (GFSI) recognized food safety certification program
Quantitative Food safety
(1) Total number of notices of food safety violation received, (2) percentage corrected
Quantitative No food safety violations were received in FY18
(1) Number of recalls issued and (2) total amount of food product recalled Quantitative Food safety
Health & Nutrition Revenue from products labeled and/or marketed to promote health and nutrition attributes
Quantitative Health and wellness
Discussion of the process to identify and manage products and ingredients related to nutritional and health concerns among consumers
Discussion and Analysis Health and wellness
Product Labeling & Marketing Revenue from products labeled as (1) containing genetically modified organisms (GMOs) and (2) non-GMO
Quantitative We label all of our FDA regulated products as either “Produced with” or “Partially Produced with Genetic Engineering” if they contain more than 0.9% GMO ingredients.
Number of incidents of non-compliance with industry or regulatory labeling and/or marketing codes
Quantitative Responsible marketing
Packaging Lifecycle Management
(1) Total weight of packaging, (2) percentage made from recycled and/or renewable materials, and (3) percentage that is recyclable, reusable, and/or compostable
Quantitative Climate change - packaging
Discussion of strategies to reduce the environmental impact of packaging throughout its lifecycle
Discussion and Analysis Climate change - packaging
Environmental & Social Impacts of Ingredient Supply Chain
Percentage of food ingredients sourced that are certified to third-party environmental and/or social standards, by certification scheme
Quantitative Sustainable sourcing
Suppliers’ social and environmental responsibility audit (1) non-conformance rate and (2) associated corrective action rate for (a) major and (b) minor non-conformances
Quantitative Supplier responsibility
Ingredient Sourcing Percentage of food ingredients sourced from regions with High or Extremely High Baseline Water Stress
Quantitative CDP Water
List of priority food ingredients and discussion of sourcing risks due to environmental and social considerations
Discussion and Analysis Sustainable sourcing
GENERAL MILLS GLOBAL RESPONSIBILITY 72