Embed Size (px)
Citation preview

EQU
ITY
RESE
ARC
H RBC Capital Markets, LLCChristopher Carril (Analyst)(617) [email protected]
November 10, 2020
Restaurants: Updating Our Thoughts on M&AIn light of the recently announced deal for DNKN to be acquired by Inspire Brands, in thisnote we take a look at recent trends in restaurant M&A, and what it means for the companiesin our coverage.
Is the DNKN deal a sign of things to come? Restaurants have been an active space for M&A—weestimate that approximately 40% of the top 100 largest brands in the US have changed ownershipover the last ten years—and we expect this trend to continue. Restaurants make attractive acquisitiontargets, particularly single brand, asset-light "all-franchised" companies able to generate significantfree cash flow (e.g. DNKN w/near-100% FCF conversion). Additionally, this year's pandemic has alsohighlighted the resilience of fast food models, and especially those featuring significant drive-thru ordelivery/carryout mix (conversely, over 80% of recent large chain bankruptcies are in the full servicesegment). However, the bargain hunting window has largely closed, with average valuations of singlebrand companies back to (or above) pre-COVID levels. But holding this aside, we expect the attractivequalities of restaurants to continue to draw the interest of potential acquirers, setting the stage forcontinued M&A activity.
Thinking through the universe of potential acquirers: We expect private equity to remain activeparticipants in restaurant M&A given the reasons cited above, and driven by substantial available drypowder. Notably, the large, privately held multi-brand owners (e.g. Inspire Brands, JAB Holding, FocusBrands) have been quite active in recent years, taking six public restaurant companies private since 2016,in some of the largest deals in the space. From our perspective, we are also interested in what a potentialacceleration in M&A activity would mean for the public multi-brand owners in our own coverage (YUM,QSR, DRI). We believe that as opportunities arise and business conditions improve, these companieswill continue to execute against their respective strategies, which includes adding brands through M&Aand leveraging their scale advantages (to corporate overhead, marketing, development, etc.). However,we would note that the public platforms may not necessarily be in a hurry to add more brands to theirportfolios, given: 1) opportunities remain in each of these portfolios for further improvement/upside(e.g. QSR's Tim Hortons); 2) substantial longer-term opportunities to gain share for existing brands,given the significant disruption in the industry (which we've previously written about with our RBCConsumer colleagues here); and 3) elevated—but not significantly higher—leverage currently carried bythese companies versus historical levels, which may lead to prioritization of debt reduction over M&A,at least in the near-term.
It's important to highlight that M&A in restaurants is not necessarily limited to acquisitions of otherrestaurant brands. One possible avenue for M&A is a company acquiring its own brand's franchisedrestaurants. Notable examples of this have been completed by EAT, which has acquired nearly 20% ofthe Chili's domestic system in recent years via transactions with franchisees. We have also seen someof the larger companies in our coverage make acquisitions of tech companies. Examples of this includeMCD's acquisition of Dynamic Yield (personalization and decision logic technology) for ~$300M in early2019, followed by its purchase of Apprente (voice technology) later that same year. In the case of MCD,which boasts global system sales of >$100B, the acquisition of another mostly-franchised brand wouldresult in—in the majority of cases—relatively little impact to the bottom line, while ROI on tech thatpotentially drive higher same store sales and unit volumes could be more attractive. Finally, we wouldnote that M&A need not be transformational in nature. The most recent example of this was YUM'sacquisition of Habit Burger, which represents <1% of YUM's total global footprint.
Disseminated: Nov 10, 2020 00:45ET; Produced: Nov 10, 2020 00:31ETPriced as of prior trading day's market close, EST (unless otherwise noted).
All values in USD unless otherwise noted.For Required Conflicts Disclosures, see Page 12.
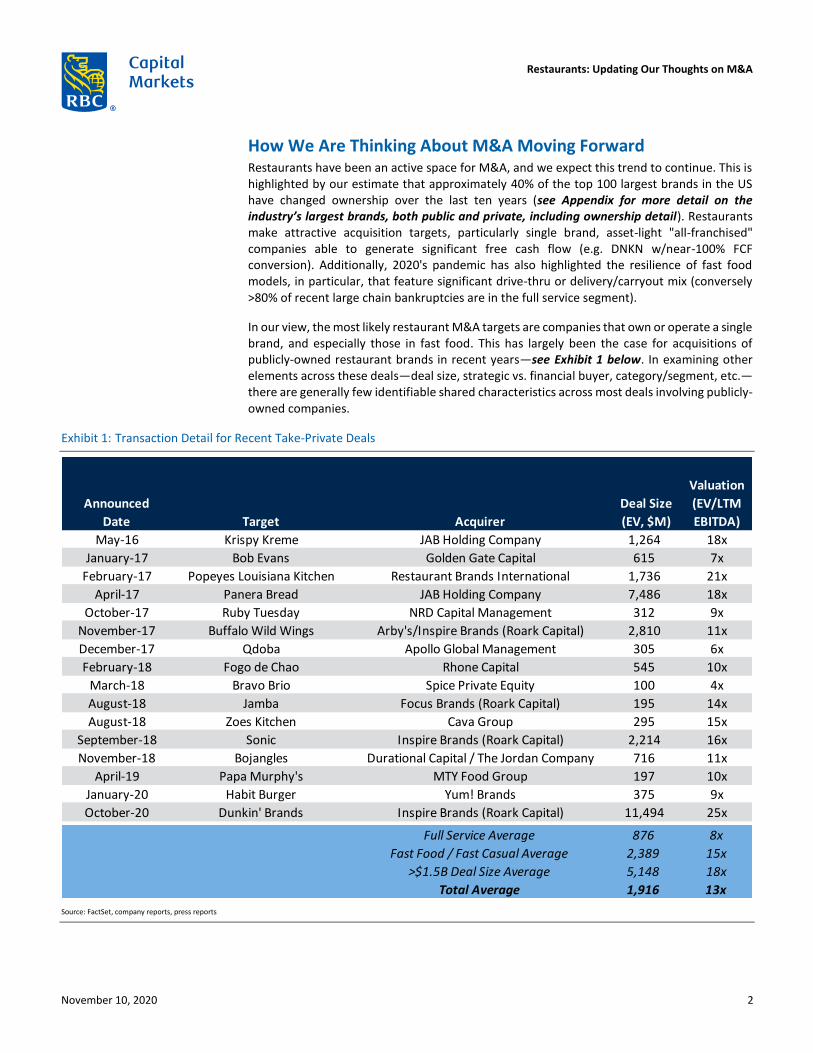
How We Are Thinking About M&A Moving Forward Restaurants have been an active space for M&A, and we expect this trend to continue. This is highlighted by our estimate that approximately 40% of the top 100 largest brands in the US have changed ownership over the last ten years (see Appendix for more detail on the industry’s largest brands, both public and private, including ownership detail). Restaurants make attractive acquisition targets, particularly single brand, asset-light "all-franchised" companies able to generate significant free cash flow (e.g. DNKN w/near-100% FCF conversion). Additionally, 2020's pandemic has also highlighted the resilience of fast food models, in particular, that feature significant drive-thru or delivery/carryout mix (conversely >80% of recent large chain bankruptcies are in the full service segment).
In our view, the most likely restaurant M&A targets are companies that own or operate a single brand, and especially those in fast food. This has largely been the case for acquisitions of publicly-owned restaurant brands in recent years—see Exhibit 1 below. In examining other elements across these deals—deal size, strategic vs. financial buyer, category/segment, etc.—there are generally few identifiable shared characteristics across most deals involving publicly-owned companies.
Exhibit 1: Transaction Detail for Recent Take-Private Deals
Source: FactSet, company reports, press reports
Announced
Date Target Acquirer
Deal Size
(EV, $M)
Valuation
(EV/LTM
EBITDA)
May-16 Krispy Kreme JAB Holding Company 1,264 18x
January-17 Bob Evans Golden Gate Capital 615 7x
February-17 Popeyes Louisiana Kitchen Restaurant Brands International 1,736 21x
April-17 Panera Bread JAB Holding Company 7,486 18x
October-17 Ruby Tuesday NRD Capital Management 312 9x
November-17 Buffalo Wild Wings Arby's/Inspire Brands (Roark Capital) 2,810 11x
December-17 Qdoba Apollo Global Management 305 6x
February-18 Fogo de Chao Rhone Capital 545 10x
March-18 Bravo Brio Spice Private Equity 100 4x
August-18 Jamba Focus Brands (Roark Capital) 195 14x
August-18 Zoes Kitchen Cava Group 295 15x
September-18 Sonic Inspire Brands (Roark Capital) 2,214 16x
November-18 Bojangles Durational Capital / The Jordan Company 716 11x
April-19 Papa Murphy's MTY Food Group 197 10x
January-20 Habit Burger Yum! Brands 375 9x
October-20 Dunkin' Brands Inspire Brands (Roark Capital) 11,494 25x
Full Service Average 876 8x
Fast Food / Fast Casual Average 2,389 15x
>$1.5B Deal Size Average 5,148 18x
Total Average 1,916 13x
Restaurants: Updating Our Thoughts on M&A
November 10, 2020 2

Investors have also generally viewed potential category gaps in multi-brand operator portfolios as a way of screening for potential M&A targets: for example, QSR does not own a pizza brand, therefore the category could be a targeted focus for the company. However, we would highlight that there are examples of brand aggregators that have focused on building a portfolio around one or two categories, including JAB’s Pret Panera portfolio—see Exhibit 2 below for more detail on category focus across the various public and private restaurant platforms.
Exhibit 2: Multi-Brand Operator Brand/Category Map
Source: Company reports
Category
Restaurant
Brands
International
Yum!
Brands
Darden
Restaurants
Bloomin'
Brands
Inspire
Brands
(Roark Capital)
Focus
Brands
(Roark Capital)
Pret Panera
Holding (JAB
Holding Co.)
Krispy Kreme
(JAB
Holding Co.)
Burger Burger KingHabit Burger
GrillSonic Drive-In
Pizza Pizza Hut
Coffee /
CaféTim Hortons
Dunkin'(Deal Announced)
Caribou Coffee,
Espresso HouseKrispy Kreme
Sandwich /
Bakery
Arby's,
Jimmy John's
McAlister's Deli,
Schlotzsky's
Pret A Manger,
Panera Bread
ChickenPopeyes
Louisiana KitchenKFC
Mexican Taco BellMoe's Southwest
Grill
Frozen
DessertsBaskin-Robbins(Deal Announced)
Carvel
OtherAuntie Anne's,
Cinnabon, JambaBagel Brands Insomnia Cookies
Italian /
PizzaOlive Garden Carrabba's
SteakLongHorn
Steakhouse
Outback
Steakhouse
Varied
Menu
Cheddar's,
Yard House,
Bahama Breeze,
Seasons 52
Sports BarBuffalo Wild
Wings
Seafood Bonefish Grill
SteakThe Capital
Grille
Fleming's Prime
Steakhouse
Seafood Eddie V's
Fast
Fo
od
/ F
ast
Cas
ual
Cas
ual
Din
ing
Fin
e D
inin
g
Public Private
Restaurants: Updating Our Thoughts on M&A
November 10, 2020 3

It is also important to recognize that the consideration set does not necessarily end with publicly traded brands. Among the 100 largest domestic restaurant brands (by total US system sales), 58 of those brands are privately held and together represent nearly 20% of the restaurant industry’s total sales. Given the significant representation by privately held brands across the restaurant industry (including those owned by private equity), we feel it is worth highlighting that the list of potential targets is far larger than just the publicly traded brands. For more detail on the largest brands—both public and private—including ownership detail, please refer to the Appendix of this report.
Exhibit 3: Restaurant Industry Sales Mix by Size of Brands (US, 2020E)
Source: Technomic
Regarding valuation, we would highlight that the bargain-hunting window following initial pandemic-related valuation drawdowns has now largely closed. The average valuations of single (or dominant) brand companies, across both the all-franchised group of names, as well as those with higher levels of company restaurant ownership, have largely recovered back to pre-COVID levels. Generally, valuations have largely recovered for franchised and fast food or fast casual names, while valuations for some of the single-brand casual dining operators remain below pre-COVID levels.
Ex-Top 100 Brands($228B)
42 Public Brands in Top 100($158B)
58 Private Brands in Top 100($89B)
Top 100 Brands($248B)
While much attention is paid to the public brands as potential M&A targets, we note that large private brands make up a meaningful portion of the industry
Restaurants: Updating Our Thoughts on M&A
November 10, 2020 4

Exhibit 4: EV/NTM EBITDA (Market Cap. Weighted) of Single Brand Companies, ~$15B or Less in Market Cap
Fast Food / Fast Casual
Full Service
Source: FactSet
A Look at the Multi-Brand Owners/Operators We expect private equity to remain active participants in restaurant M&A given significant available dry powder, as well as the reasons cited above. Notably, large privately held multi-brand owners (e.g. Inspire Brands, JAB Holding Company, Focus Brands) have been very active in recent years, taking six public restaurant companies private since 2016, in some of the largest deals in the space.
Exhibit 5: Restaurant Public-to-Private Transactions, in Chronological Order (Yellow Bars Indicate Deals Completed by Inspire Brands, JAB or Focus Brands)
Source: FactSet, company reports, press reports
From our perspective, we are also interested in what a potential acceleration in M&A activity would mean for the public multi-brand owners in our own coverage (YUM, QSR, DRI). We believe these public platforms are the more likely next candidates to be restaurant acquirers, given Inspire Brand's very recently announced DNKN transaction, while JAB appears to have
16.0x
18.0x
20.0x
22.0x
24.0x
26.0x
28.0x
30.0x
EV/NTM EBITDA (Market Cap-Weighted) 2017-2019 Average
6.0x
8.0x
10.0x
12.0x
14.0x
16.0x
EV/NTM EBITDA (Market Cap-Weighted) 2017-2019 Average
$0M
$2,000M
$4,000M
$6,000M
$8,000M
$10,000M
$12,000M
$14,000MInspire Brands, JAB, Focus Brands have been active in restaurant M&A, taking six public companies private since 2016, in some of the largest deals in the space
Restaurants: Updating Our Thoughts on M&A
November 10, 2020 5

more recently shifted its focus to the pet care industry. For YUM and QSR, acquisitions represent further opportunities to leverage the lean corporate overhead structures of near-100% franchised business to support ongoing mid-single digit restaurant growth. For DRI, adding brands represents potential further share gain opportunities in an otherwise challenged casual dining segment of the industry.
However, we would note that the public platforms may not necessarily be in a hurry to add more brands to their portfolios, given:
1. Opportunities remain to improve within current portfolios: DRI, QSR and YUM also have significant remaining opportunities for improvement within their existing portfolios, and as a result, this may lead management to focus on the current brands rather than seek growth through M&A. We also believe it is worth pointing out that some of the brands that have the most room for improvement within these multi-brand operator portfolios—including YUM’s Pizza Hut and QSR’s Tim Hortons—have been relatively steady profit generators for these companies. So while these brands have perhaps been contributing less to overall growth versus other brands in these portfolios, they have been fairly consistent sources of cash flow generation.
Exhibit 6: Annual Brand Profits
Pizza Hut Annual Adj. EBIT and Company Units
Tim Hortons Annual Adj. EBITDA ($M)
Source: Company reports
2. Industry dynamics point to potentially substantial share gain opportunities: While industry trends have improved since the spring, a significant number of restaurants are expected to permanently close this year. Per estimates from Technomic, nearly 15% of total units will close in 2020, which we estimate will leave nearly $70B of orphaned sales, with this share likely split between food at home and food away from home. We anticipate these closures will be largely concentrated among independents and small chains, and largely in the full service segment of the industry. This will likely result in greater share gain opportunities for the large casual dining chain operators—including DRI—and to a lesser extent fast food operators. Given this significant potential share gain opportunity as a result of the pandemic, chain owners/operators may place less emphasis on share gain opportunities from M&A, at least in the very near-term.
0
100
200
300
400
500
600
700
800
900
$0M
$50M
$100M
$150M
$200M
$250M
$300M
$350M
$400M
2015 2016 2017 2018 2019
EBIT (LHS) Average Company-Owned Units (RHS)
$0M
$200M
$400M
$600M
$800M
$1,000M
$1,200M
2015 2016 2017 2018 2019
Restaurants: Updating Our Thoughts on M&A
November 10, 2020 6

Exhibit 7: Estimated 2020 US Restaurant Industry Unit Closures and Sales Reduction from Restaurant Closures
Estimated US Restaurant Count (2019-2020E)
Estimated Sales Reduction from Restaurant Closures
Source: Technomic, RBC Capital Markets
3. Debt reduction is likely prioritized in the very near-term: Given the incremental debt added recently, as well as the pandemic’s impact on trailing EBITDA, leverage levels for DRI, QSR and YUM are slightly higher than when the companies last made acquisitions. As such, while leverage is not significantly above historical levels, debt reduction may be prioritized in the near-term.
Exhibit 8: Net Debt/LTM EBITDA of Multi-Brand Operators
Source: Company reports and RBC Capital Markets estimates
M&A Has Taken Different Forms Across Our Coverage Acquisitions of Franchised Restaurants Another form of M&A operators can execute is franchisee acquisitions. We have seen two examples of this from EAT in recent years. In 2019, EAT purchased 116 restaurants, located primarily in the Midwest, from franchisee ERJ Dining LLC in a $96 million transaction (funded through an existing line of credit). Previously, in 2015, EAT had acquired 103 restaurants,
-9%-18%
-14%
200,000
300,000
400,000
500,000
600,000
700,000
Limited Service Full Service Total Restaurants
2019 2020E
($68B)Sales
Reduction
($47B)
($95B)
$400B
$420B
$440B
$460B
$480B
$500B
$520B
$540B
$560B
$580B
$600B
2019 RestaurantIndustry Sales
Base Case(~15% Closures)
10% ClosuresScenario
20% ClosuresScenario
0.1x
3.7x
4.8x
0.5x
4.6x4.8x
0.4x
5.5x5.2x
0.0x
1.0x
2.0x
3.0x
4.0x
5.0x
6.0x
DRI QSR YUM
Prior to Last Acquisition CY19 (Year-End) Current
Leverage levels are incrementally higher today for the multi-brand operators, which may choose to reduce debt before making further acquisitions
Restaurants: Updating Our Thoughts on M&A
November 10, 2020 7

primarily located in the Northeast and Southeast, from franchisee Pepper Dining Holding Corporation in a $106.5 million transaction (also funded via EAT’s line of credit).
DRI has also completed acquisitions of restaurants from franchisees following its purchase of Cheddar’s Scratch Kitchen. In DRI’s FY20, it completed the $58.1 million acquisition of 8 restaurants from franchisees (7 operating/1 closed). This transaction was funded via cash on hand, with (~$30M allocated to PP&E). Similarly, in 2017, DRI completed an acquisition of 11 restaurants from franchisees.
A recent (potential) example of franchised restaurant acquisitions involves WEN, which may be participating in the bidding process for restaurants owned by NPC International, its largest franchisee, which has recently filed for bankruptcy. While WEN’s involvement will likely not fundamentally shift the company’s overall strategy (to maintain its ~95%-franchised mix), it does represent another example of a brand owner potentially acquiring franchised assets.
Technology and Marketing Acquisitions We also note that for restaurant companies, M&A activity has not necessarily focused just on restaurants or restaurant brands. In recent years, we have seen large restaurant companies such as MCD and YUM allocate capital toward acquiring technology and marketing companies to improve performance at their existing brands.
MCD made two tech-focused acquisitions during 2019. In March of last year, MCD purchased Dynamic Yield, a company focused on personalization and decision logic technology, for ~$300M. This acquisition by MCD has focused on creating personalized experiences for its customers, thus far via outdoor digital drive-thru menu displays. Some of the technology’s features include the ability to feature menu items based on the time of day, weather, current restaurant traffic and trending menu items. In September 2019, MCD also acquired Apprente, an early-stage company focused on conversational interface technology. The expectation for Apprente is to ultimately drive a faster and more accurate order taking process at the drive-thru.
Meanwhile, in 2015 YUM purchased consumer marketing strategy firm Collider Lab, which had previously worked with the Taco Bell brand. Following that, in 2018, YUM’s Pizza Hut acquired QuikOrder, an online ordering service in a $77M transaction. More recently, in March 2020, YUM acquired Heartstyles, a company focused on leadership development.
Bolt-On Acquisitions vs. Transformational Deals Within our coverage of multi-brand operators, there appears to be a recent bias to adding smaller brands, relative to those in the existing portfolio (or the overall portfolio). The most recent example of this is YUM’s acquisition of Habit Burger, which at the time of acquisition had ~300 total system (company + franchised) restaurants, versus YUM’s then global footprint of >50,000 restaurants.
Restaurants: Updating Our Thoughts on M&A
November 10, 2020 8

Exhibit 9: Snapshot of Most Recent Deals by QSR, DRI and YUM
Source: Company reports and RBC Capital Markets estimates
In examining the rationale behind adding smaller brands to such large portfolios, the most obvious is that when smaller brands are provided scaled support (technology, marketing, etc.) and access to a well-capitalized franchisee base, they are potentially a cheap growth option. In the case of franchised restaurant businesses, specifically, smaller acquisitions also provide franchisors another brand to offer existing franchisees who have potentially reached their development limits on the brands in the franchisor’s existing portfolio.
However, these smaller acquisitions are not without risk. The most obvious risk is that the growth thesis does not play out, and that the capital spent to acquire a smaller brand would have potentially been better allocated elsewhere (e.g. technology). Another risk is that that acquisition integration or brand underperformance requires more of management’s attention than the brand’s relative size would otherwise suggest.
Last Brand
Acquisition Date Closed
# System
Restaurants
Acquired
# of System
Restaurants
Prior to
Acquisition
Acquired
Restaurants as %
of Total System
(Post-
Acquisition)
QSR Popeyes March 2017 2,743 20,351 11.9%
DRI Cheddar's April 2017 165 1,545 9.6%
YUM Habit Burger March 2020 276 50,170 0.5%
Restaurants: Updating Our Thoughts on M&A
November 10, 2020 9

Appendix
Exhibit 10: Top Domestic Fast Food Brand Detail
Source: Technomic, FactSet, company reports, press reports
Top 100
Rank Chain Name Segment
Estimated
US System
Sales
($M, 2020E)
Total US
System
Units
(2019)
US
Franchised
Mix
(2019)
Total
Global
System
Units Public Private
Brand Parent /
Owner Detail
Last
Transaction
Date (If Last
10 Years)
1 McDonald's QSR $38,392 13,846 95% 38,695 P
2 Starbucks QSR $16,676 15,049 42% 31,256 P
3 Chick-fil-A QSR $13,250 2,470 98% 2,470 P
4 Taco Bell QSR $10,950 6,766 93% 7,363 P Yum! Brands
5 Burger King QSR $9,439 7,346 99% 18,838 P Restaurant Brands International Oct-10
6 Wendy's QSR $9,425 5,852 94% 6,788 P
7 Subway QSR $8,772 23,801 100% 40,869 P Doctor's Associates Inc.
8 Domino's QSR $7,924 6,126 94% 17,020 P
9 Dunkin' QSR $7,525 9,630 100% 13,137 P Dunkin Brands Group Inc
11 Pizza Hut QSR $5,363 7,306 100% 18,703 P Yum! Brands
13 Sonic Drive-In QSR $4,805 3,526 94% 3,526 P Inspire Brands (Roark Capital) Dec-18
14 KFC QSR $4,614 4,065 99% 24,104 P Yum! Brands
15 Popeyes Louisiana Kitchen QSR $4,614 2,476 98% 3,316 P Restaurant Brands International Mar-17
17 Little Caesars QSR $3,809 4,237 86% 5,192 P Ilitch Holdings, Inc.
18 Dairy Queen QSR $3,780 4,381 100% 7,179 P Berkshire Hathaway
19 Arby's QSR $3,652 3,359 65% 3,515 P Inspire Brands (Roark Capital) Jul-11
20 Jack in the Box QSR $3,557 2,243 94% 2,243 P
21 Papa John's QSR $2,994 3,142 81% 5,395 P
24 Whataburger QSR $2,608 830 15% 830 P BDT Capital Partners Sep-19
31 Culver's QSR $1,903 732 99% 732 P Oct-17
33 Hardee's QSR $1,819 1,820 93% 2,215 P CKE Inc. (Roark Capital)
42 Carl's Jr. QSR $1,253 1,095 96% 1,690 P CKE Inc. (Roark Capital)
43 Bojangles' QSR $1,245 746 58% 746 P Durational Capital and The Jordan Company Jan-19
45 In-N-Out Burger QSR $1,009 351 0% 351 P
49 El Pollo Loco QSR $814 482 60% 482 P
51 Del Taco QSR $774 596 50% 596 P
53 Krispy Kreme QSR $723 364 56% 1,499 P JAB Holding Company Jul-16
56 Golden Corral QSR $681 483 93% 483 P
57 Papa Murphy's Pizza QSR $666 1,329 95% 1,368 P MTY Group May-19
59 Church's Chicken QSR $637 1,032 83% 1,622 P
60 Tropical Smoothie Cafe QSR $629 834 100% 834 P Levine Leichtman Capital Partners Sep-20
61 Marco's Pizza QSR $616 915 100% 956 P
62 Steak 'n Shake QSR $604 576 37% 610 P Biglari Holdings Inc.
64 Baskin-Robbins QSR $584 2,524 100% 8,160 P Dunkin Brands Group Inc.
68 Checkers Drive-In Restaurants QSR $546 584 79% 584 P Oak Hill Capital Partners Apr-17
69 White Castle QSR $542 371 1% 371 P
70 Captain D's Seafood Kitchen QSR $528 540 46% 540 P Sentinel Capital Partners Dec-17
71 Dutch Bros. Coffee QSR $513 369 68% 369 P
73 Tim Hortons QSR $508 715 100% 4,991 P Restaurant Brands International Dec-14
76 Smoothie King QSR $455 972 96% 1,087 P SK USA, Inc. Dec-15
80 Jamba QSR $439 767 93% 817 P Focus Brands Inc. (Roark Capital) Sep-18
82 Charleys Philly Steaks QSR $428 540 89% 615 P
84 Jack's QSR $421 176 16% 176 P AEA Investors Aug-19
85 Auntie Anne's QSR $420 1,288 99% 2,018 P Focus Brands Inc. (Roark Capital) Nov-10
86 Round Table Pizza QSR $412 435 83% 435 P Global Franchise Group Sep-17
87 Hungry Howie's Pizza QSR $409 537 94% 537 P
96 Taco John's QSR $342 387 97% 387 P
97 Jet's Pizza QSR $340 383 92% 383 P
Restaurants: Updating Our Thoughts on M&A
November 10, 2020 10

Exhibit 11: Top Domestic Fast Casual Brand Detail
Source: Technomic, FactSet, company reports, press reports
Exhibit 12: Top Domestic Full Service Brand Detail
Source: Technomic, FactSet, company reports, press reports
Top 100
Rank Chain Name Segment
Estimated
US System
Sales
($M, 2020E)
Total US
System
Units
(2019)
US
Franchised
Mix
(2019)
Total
Global
System
Units Public Private
Brand Parent /
Owner Detail
Last
Transaction
Date (If Last
10 Years)
10 Chipotle Mexican Grill FC $5,393 2,584 0% 2,622 P
12 Panera Bread FC $5,262 2,160 54% 2,179 P Pret Panera Holding (JAB) Jul-17
16 Panda Express FC $3,850 2,209 7% 2,286 P Panda Restaurant Group Inc
29 Zaxby's FC $1,958 910 85% 910 P
30 Jimmy John's Gourmet Sandwiches FC $1,948 2,787 98% 2,787 P Inspire Brands (Roark Capital) Sep-16
35 Wingstop FC $1,703 1,231 97% 1,385 P Apr-10
38 Five Guys FC $1,604 1,368 64% 1,633 P
39 Raising Cane's Chicken Fingers FC $1,591 457 19% 482 P
40 Jersey Mike's Subs FC $1,387 1,667 96% 1,667 P
48 Qdoba Mexican Eats FC $834 730 52% 739 P Apollo Global Management Mar-18
50 Firehouse Subs FC $812 1,155 97% 1,186 P
55 McAlister's Deli FC $705 460 93% 460 P Focus Brands Inc. (Roark Capital)
58 Moe's Southwest Grill FC $662 730 99% 732 P Focus Brands Inc. (Roark Capital)
65 Jason's Deli FC $563 283 35% 283 P
66 Freddy's Frozen Custard & Steakburgers FC $558 368 92% 368 P
72 Shake Shack FC $511 185 12% 275 P
74 MOD Pizza FC $476 467 19% 478 P
78 Portillo's FC $452 62 0% 62 P Berkshire Partners Jul-14
81 Habit Burger Grill, The FC $432 273 13% 273 P Yum! Brands Mar-20
83 Noodles & Company FC $422 457 15% 457 P
88 Einstein Bros. Bagels FC $408 710 45% 710 P JAB Holding Company Nov-14
90 Boston Market FC $406 390 5% 390 P Engage Brands LLC Apr-20
94 Blaze Pizza FC $356 313 98% 336 P
95 Pollo Tropical FC $345 174 18% 174 P Fiesta Restaurant Group
Top 100
Rank Chain Name Segment
Estimated
US System
Sales
($M, 2020E)
Total US
System
Units
(2019)
US
Franchised
Mix
(2019)
Total
Global
System
Units Public Private
Brand Parent /
Owner Detail
Last
Transaction
Date (If Last
10 Years)
22 Olive Garden CDR $2,915 866 1% 901 P Darden Restaurants Inc.
23 Applebee's CDR $2,655 1,665 96% 1,787 P Dine Brands Global
25 Buffalo Wild Wings CDR $2,605 1,206 48% 1,280 P Inspire Brands (Roark Capital) Feb-18
26 Chili's Grill & Bar CDR $2,566 1,242 24% 1,612 P Brinker Intermational
27 Texas Roadhouse CDR $2,126 553 12% 581 P
28 IHOP MSR $1,960 1,710 100% 1,841 P Dine Brands Global
32 Denny's MSR $1,831 1,558 92% 1,694 P
34 Outback Steakhouse CDR $1,818 724 20% 979 P Bloomin’ Brands Inc.
36 Red Lobster CDR $1,655 679 0% 749 P Thai Union Aug-20
37 Cracker Barrel MSR $1,614 660 0% 660 P
41 Cheesecake Factory, The CDR $1,264 206 0% 232 P The Cheesecase Factory Inc
44 LongHorn Steakhouse CDR $1,233 530 3% 532 P Darden Restaurants Inc.
46 Red Robin Gourmet Burgers CDR $991 556 18% 574 P
47 Waffle House MSR $847 1,959 23% 1,959 P
52 BJ's Restaurant & Brewhouse CDR $766 208 0% 208 P
54 Fridays CDR $716 385 54% 831 P Sentinel Capital, TriArtisan Capital Jul-14
63 P.F. Chang's CDR $587 221 2% 317 P TriArtisan Capital Advisors Mar-19
67 Hooters CDR $553 341 38% 432 P Nord Bay Capital, TriArtisan Capital Advisors Jul-19
75 Cheddar's Scratch Kitchen CDR $456 175 8% 175 P Darden Restaurants Inc. Apr-17
77 Carrabba's Italian Grill CDR $454 225 9% 225 P Bloomin’ Brands Inc.
79 Bob Evans MSR $448 483 0% 483 P Golden Gate Capital Apr-17
89 First Watch MSR $407 368 15% 368 P Advent International Aug-17
91 Ruby Tuesday CDR $396 451 3% 470 P NRD Capital Management Dec-17
92 Bonefish Grill CDR $370 197 4% 197 P Bloomin’ Brands Inc.
93 Ruth's Chris Steak House FD $366 135 39% 156 P
98 California Pizza Kitchen CDR $339 199 8% 237 P Golden Gate Capital Jul-11
99 Mellow Mushroom CDR $338 187 99% 187 P
100 Yard House CDR $335 79 0% 79 P Darden Restaurants Inc. Aug-12
Restaurants: Updating Our Thoughts on M&A
November 10, 2020 11

Companies mentionedBrinker International, Inc. (NYSE: EAT US; $50.07; Sector Perform)Darden Restaurants, Inc. (NYSE: DRI US; $120.55; Outperform)Dunkin' Brands Group, Inc. (NASDAQ: DNKN US; $106.05; Sector Perform)McDonald's Corporation (NYSE: MCD US; $213.22; Outperform)Restaurant Brands International Inc. (NYSE: QSR US; $58.08; Outperform)Yum! Brands, Inc. (NYSE: YUM US; $101.98; Sector Perform)
Required disclosuresConflicts disclosuresThis product constitutes a compendium report (covers six or more subject companies). As such, RBC Capital Markets chooses toprovide specific disclosures for the subject companies by reference. To access conflict of interest and other disclosures for thesubject companies, clients should refer to https://www.rbccm.com/GLDisclosure/PublicWeb/DisclosureLookup.aspx?entityId=1.These disclosures are also available by sending a written request to RBC Capital Markets Research Publishing, P.O. Box 50, 200 BayStreet, Royal Bank Plaza, 29th Floor, South Tower, Toronto, Ontario M5J 2W7 or an email to [email protected].
The analyst(s) responsible for preparing this research report received compensation that is based upon various factors, includingtotal revenues of the member companies of RBC Capital Markets and its affiliates, a portion of which are or have been generatedby investment banking activities of the member companies of RBC Capital Markets and its affiliates.
Distribution of ratingsFor the purpose of ratings distributions, regulatory rules require member firms to assign ratings to one of three rating categories -Buy, Hold/Neutral, or Sell - regardless of a firm's own rating categories. Although RBC Capital Markets' ratings of Outperform (O),Sector Perform (SP), and Underperform (U) most closely correspond to Buy, Hold/Neutral and Sell, respectively, the meanings arenot the same because our ratings are determined on a relative basis.
Distribution of ratings
RBC Capital Markets, Equity Research
As of 30-Sep-2020
Investment Banking
Serv./Past 12 Mos.
Rating Count Percent Count Percent
BUY [Outperform] 788 52.96 248 31.47
HOLD [Sector Perform] 619 41.60 135 21.81
SELL [Underperform] 81 5.44 11 13.58
Conflicts policyRBC Capital Markets Policy for Managing Conflicts of Interest in Relation to Investment Research is available from us on request.To access our current policy, clients should refer tohttps://www.rbccm.com/global/file-414164.pdfor send a request to RBC Capital Markets Research Publishing, P.O. Box 50, 200 Bay Street, Royal Bank Plaza, 29th Floor, SouthTower, Toronto, Ontario M5J 2W7. We reserve the right to amend or supplement this policy at any time.
Dissemination of research and short-term trade ideasRBC Capital Markets endeavors to make all reasonable efforts to provide research simultaneously to all eligible clients, havingregard to local time zones in overseas jurisdictions. RBC Capital Markets' equity research is posted to our proprietary websiteto ensure eligible clients receive coverage initiations and changes in ratings, targets and opinions in a timely manner. Additionaldistribution may be done by the sales personnel via email, fax, or other electronic means, or regular mail. Clients may alsoreceive our research via third party vendors. RBC Capital Markets also provides eligible clients with access to SPARC on the Firms
Restaurants: Updating Our Thoughts on M&A
November 10, 2020 12
proprietary INSIGHT website, via email and via third-party vendors. SPARC contains market color and commentary regardingsubject companies on which the Firm currently provides equity research coverage. Research Analysts may, from time to time,include short-term trade ideas in research reports and / or in SPARC. A short-term trade idea offers a short-term view onhow a security may trade, based on market and trading events, and the resulting trading opportunity that may be available. Ashort-term trade idea may differ from the price targets and recommendations in our published research reports reflecting theresearch analyst's views of the longer-term (one year) prospects of the subject company, as a result of the differing time horizons,methodologies and/or other factors. Thus, it is possible that a subject company's common equity that is considered a long-term'Sector Perform' or even an 'Underperform' might present a short-term buying opportunity as a result of temporary selling pressurein the market; conversely, a subject company's common equity rated a long-term 'Outperform' could be considered susceptibleto a short-term downward price correction. Short-term trade ideas are not ratings, nor are they part of any ratings system, andthe firm generally does not intend, nor undertakes any obligation, to maintain or update short-term trade ideas. Short-term tradeideas may not be suitable for all investors and have not been tailored to individual investor circumstances and objectives, andinvestors should make their own independent decisions regarding any securities or strategies discussed herein. Please contactyour investment advisor or institutional salesperson for more information regarding RBC Capital Markets' research.For a list of all recommendations on the company that were disseminated during the prior 12-month period, please click on thefollowing link: https://rbcnew.bluematrix.com/sellside/MAR.actionThe 12 month history of SPARCs can be viewed at https://www.rbcinsightresearch.com.
Analyst certificationAll of the views expressed in this report accurately reflect the personal views of the responsible analyst(s) about any and all ofthe subject securities or issuers. No part of the compensation of the responsible analyst(s) named herein is, or will be, directly orindirectly, related to the specific recommendations or views expressed by the responsible analyst(s) in this report.
Third-party-disclaimersThe Global Industry Classification Standard ("GICS”) was developed by and is the exclusive property and a service mark of MSCI Inc. (“MSCI”) and Standard & Poor's Financial ServicesLLC (“S&P”) and is licensed for use by RBC. Neither MSCI, S&P, nor any other party involved in making or compiling the GICS or any GICS classifications makes any express or impliedwarranties or representations with respect to such standard or classification (or the results to be obtained by the use thereof), and all such parties hereby expressly disclaim all warrantiesof originality, accuracy, completeness, merchantability and fitness for a particular purpose with respect to any of such standard or classification. Without limiting any of the foregoing,in no event shall MSCI, S&P, any of their affiliates or any third party involved in making or compiling the GICS or any GICS classifications have any liability for any direct, indirect, special,punitive, consequential or any other damages (including lost profits) even if notified of the possibility of such damages.
RBC Capital Markets disclaims all warranties of originality, accuracy, completeness, merchantability or fitness for a particular purpose with respect to any statements made to the mediaor via social media that are in turn quoted in this report, or otherwise reproduced graphically for informational purposes.
References herein to "LIBOR", "LIBO Rate", "L" or other LIBOR abbreviations means the London interbank offered rate as administered by ICE Benchmark Administration (or any otherperson that takes over the administration of such rate).
Disclaimer
RBC Capital Markets is the business name used by certain branches and subsidiaries of the Royal Bank of Canada, including RBC Dominion Securities Inc., RBCCapital Markets, LLC, RBC Europe Limited, Royal Bank of Canada, Hong Kong Branch and Royal Bank of Canada, Sydney Branch. The information contained in thisreport has been compiled by RBC Capital Markets from sources believed to be reliable, but no representation or warranty, express or implied, is made by RoyalBank of Canada, RBC Capital Markets, its affiliates or any other person as to its accuracy, completeness or correctness. All opinions and estimates contained in thisreport constitute RBC Capital Markets' judgement as of the date of this report, are subject to change without notice and are provided in good faith but withoutlegal responsibility. Nothing in this report constitutes legal, accounting or tax advice or individually tailored investment advice. This material is prepared for generalcirculation to clients and has been prepared without regard to the individual financial circumstances and objectives of persons who receive it. The investments orservices contained in this report may not be suitable for you and it is recommended that you consult an independent investment advisor if you are in doubt aboutthe suitability of such investments or services. This report is not an offer to sell or a solicitation of an offer to buy any securities. Past performance is not a guideto future performance, future returns are not guaranteed, and a loss of original capital may occur. RBC Capital Markets research analyst compensation is basedin part on the overall profitability of RBC Capital Markets, which includes profits attributable to investment banking revenues. Every province in Canada, state inthe U.S., and most countries throughout the world have their own laws regulating the types of securities and other investment products which may be offered totheir residents, as well as the process for doing so. As a result, the securities discussed in this report may not be eligible for sale in some jurisdictions. RBC CapitalMarkets may be restricted from publishing research reports, from time to time, due to regulatory restrictions and/ or internal compliance policies. If this is the case,the latest published research reports available to clients may not reflect recent material changes in the applicable industry and/or applicable subject companies.RBC Capital Markets research reports are current only as of the date set forth on the research reports. This report is not, and under no circumstances should beconstrued as, a solicitation to act as securities broker or dealer in any jurisdiction by any person or company that is not legally permitted to carry on the business of asecurities broker or dealer in that jurisdiction. To the full extent permitted by law neither RBC Capital Markets nor any of its affiliates, nor any other person, acceptsany liability whatsoever for any direct, indirect or consequential loss arising from, or in connection with, any use of this report or the information contained herein.No matter contained in this document may be reproduced or copied by any means without the prior written consent of RBC Capital Markets in each instance.
Additional information is available on request.
Restaurants: Updating Our Thoughts on M&A
November 10, 2020 13

To U.S. Residents:This publication has been approved by RBC Capital Markets, LLC (member FINRA, NYSE, SIPC), which is a U.S. registered broker-dealer and which acceptsresponsibility for this report and its dissemination in the United States. Any U.S. recipient of this report that is not a registered broker-dealer or a bank acting ina broker or dealer capacity and that wishes further information regarding, or to effect any transaction in, any of the securities discussed in this report, shouldcontact and place orders with RBC Capital Markets, LLC.To Canadian Residents:This publication has been approved by RBC Dominion Securities Inc.(member IIROC). Any Canadian recipient of this report that is not a Designated Institution inOntario, an Accredited Investor in British Columbia or Alberta or a Sophisticated Purchaser in Quebec (or similar permitted purchaser in any other province) andthat wishes further information regarding, or to effect any transaction in, any of the securities discussed in this report should contact and place orders with RBCDominion Securities Inc., which, without in any way limiting the foregoing, accepts responsibility for this report and its dissemination in Canada.To U.K. Residents:This publication has been approved by RBC Europe Limited ('RBCEL') which is authorized by the Prudential Regulation Authority and regulated by the FinancialConduct Authority ('FCA') and the Prudential Regulation Authority, in connection with its distribution in the United Kingdom. This material is not for generaldistribution in the United Kingdom to retail clients, as defined under the rules of the FCA. RBCEL accepts responsibility for this report and its dissemination inthe United Kingdom.To German Residents:This material is distributed in Germany by RBC Europe Limited, Frankfurt Branch which is regulated by the Bundesanstalt für Finanzdienstleistungsaufsicht (BaFin).To Persons Receiving This Advice in Australia:This material has been distributed in Australia by Royal Bank of Canada, Sydney Branch (ABN 86 076 940 880, AFSL No. 246521). This material has been prepared forgeneral circulation and does not take into account the objectives, financial situation or needs of any recipient. Accordingly, any recipient should, before acting onthis material, consider the appropriateness of this material having regard to their objectives, financial situation and needs. If this material relates to the acquisitionor possible acquisition of a particular financial product, a recipient in Australia should obtain any relevant disclosure document prepared in respect of that productand consider that document before making any decision about whether to acquire the product. This research report is not for retail investors as defined in section761G of the Corporations Act.To Hong Kong Residents:This publication is distributed in Hong Kong by Royal Bank of Canada, Hong Kong Branch, which is regulated by the Hong Kong Monetary Authority and theSecurities and Futures Commission (SFC) in Hong Kong, RBC Investment Services (Asia) Limited and RBC Global Asset Management (Asia) Limited, both entitiesare regulated by the SFC. This material is not for general distribution in Hong Kong to persons who are not professional investors (as defined in the Securities andFutures Ordinance of Hong Kong (Cap. 571) and any rules made thereunder.To Singapore Residents:This publication is distributed in Singapore by the Royal Bank of Canada, Singapore Branch, a registered entity licensed by the Monetary Authority of Singapore.This material has been prepared for general circulation and does not take into account the objectives, financial situation, or needs of any recipient. You are advisedto seek independent advice from a financial adviser before purchasing any product. If you do not obtain independent advice, you should consider whether theproduct is suitable for you. Past performance is not indicative of future performance. If you have any questions related to this publication, please contact the RoyalBank of Canada, Singapore Branch. Royal Bank of Canada, Singapore Branch accepts responsibility for this report and its dissemination in Singapore.To Japanese Residents:Unless otherwise exempted by Japanese law, this publication is distributed in Japan by or through RBC Capital Markets (Japan) Ltd. which is a Financial InstrumentsFirm registered with the Kanto Local Financial Bureau (Registered number 203) and a member of the Japan Securities Dealers Association (JSDA) and the FinancialFutures Association of Japan (FFAJ).
.® Registered trademark of Royal Bank of Canada. RBC Capital Markets is a trademark of Royal Bank of Canada. Used under license.Copyright © RBC Capital Markets, LLC 2020 - Member SIPC
Copyright © RBC Dominion Securities Inc. 2020 - Member Canadian Investor Protection FundCopyright © RBC Europe Limited 2020
Copyright © Royal Bank of Canada 2020All rights reserved
Restaurants: Updating Our Thoughts on M&A
November 10, 2020 14