Embed Size (px)
Citation preview

RESTORATION MONITORING OF OYSTER REEFS INTRODUCTION
Oysters are sessile molluscs found in the class Bivalvia, which means they have two calcareous shells (shown in Figure 1.1 –1.2) that protect the soft body mass of the oyster and have an elastic ligament that controls the opening of the shell. The oyster’s adductor muscle however is used to keep the oyster shell closed. Adult oysters reproduce when water temperatures exceed 68°F (~20°C) (Mann et al. 1994; SCORE updated 2004) releasing their eggs and sperm into the water column. A fertilized egg develops into a planktonic (free-swimming) ciliated larva in about 6 hours. A fully shelled veliger1 larva is formed within 12 to 24 hours. The larva remains planktonic for about three weeks. At the end of three week period, the larva has developed a foot, then settles to the bottom of the water column and attaches to hard substrate (Bahr and Lanier 1981; National Academies Press 2004; SCORE updated 2004). The larva then cements itself to suitable substrate where it changes to an adult. The new attached oyster is known as a spat (SCORE updated 2004). Oysters are found in estuaries, sounds and bays, from brackish water to salty lagoons (approximately 12ppt to 28ppt).
Figure 1.1. A natural bed of very healthy intertidal oyster clusters, South Carolina Photo courtesy of Ray Haggerty (retired) South Carolina Department of Natural Resources, Charleston, SC.
1 Larval stage of a molluscs and is identified by its velum
1
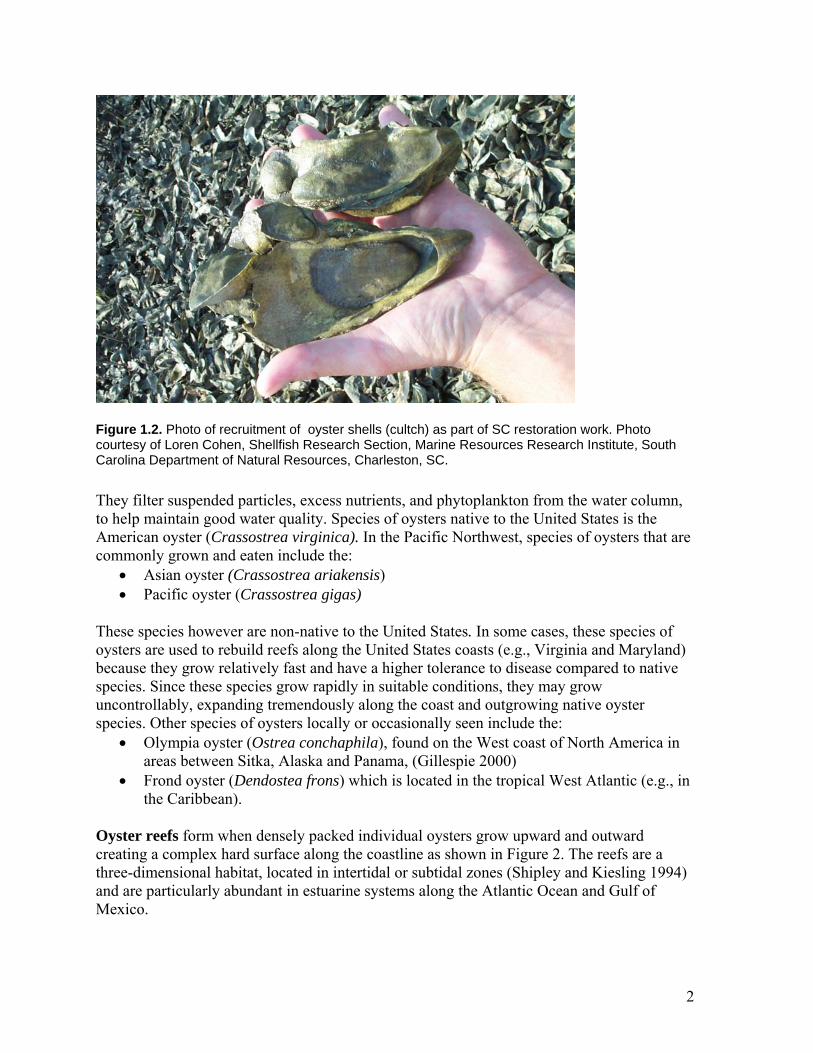
Figure 1.2. Photo of recruitment of oyster shells (cultch) as part of SC restoration work. Photo courtesy of Loren Cohen, Shellfish Research Section, Marine Resources Research Institute, South Carolina Department of Natural Resources, Charleston, SC. They filter suspended particles, excess nutrients, and phytoplankton from the water column, to help maintain good water quality. Species of oysters native to the United States is the American oyster (Crassostrea virginica). In the Pacific Northwest, species of oysters that are commonly grown and eaten include the:
• Asian oyster (Crassostrea ariakensis) • Pacific oyster (Crassostrea gigas)
These species however are non-native to the United States. In some cases, these species of oysters are used to rebuild reefs along the United States coasts (e.g., Virginia and Maryland) because they grow relatively fast and have a higher tolerance to disease compared to native species. Since these species grow rapidly in suitable conditions, they may grow uncontrollably, expanding tremendously along the coast and outgrowing native oyster species. Other species of oysters locally or occasionally seen include the:
• Olympia oyster (Ostrea conchaphila), found on the West coast of North America in areas between Sitka, Alaska and Panama, (Gillespie 2000)
• Frond oyster (Dendostea frons) which is located in the tropical West Atlantic (e.g., in the Caribbean).
Oyster reefs form when densely packed individual oysters grow upward and outward creating a complex hard surface along the coastline as shown in Figure 2. The reefs are a three-dimensional habitat, located in intertidal or subtidal zones (Shipley and Kiesling 1994) and are particularly abundant in estuarine systems along the Atlantic Ocean and Gulf of Mexico.
2

Figure 2. Oyster reefs along the coastline. Effects of simulated harvesting evaluating the impacts and recovery of intertidal fishery practices, project followed recovery for 2 or 3 years. Photo courtesy of Loren Cohen, Shellfish Research Section, Marine Resources Research Institute, South Carolina Department of Natural Resources, Charleston, SC. Oyster reefs are dominant in estuarine systems along the Atlantic and Gulf of Mexico. Oyster reefs provide habitat for marine organism and birds, supply breeding, feeding, nursery grounds as well as refuge from predation for some species. Additionally the hard structure of the oyster reef stabilizes sediments to help improve water quality as well as provide shoreline protection. The reefs also have a significant economic value for the United States seafood industry as they support many recreationally and commercially valuable animals such as fish, crabs, shrimp and oysters in parts of the United States such as Louisiana, Mississippi, and Maryland.
3

Figure 3. Picking oysters by hand at low tide. Photograph courtesy of Bob Williams, Willapa Bay, Washington. Publication of the National Oceanic & Atmospheric Administration (NOAA), NOAA Central Library. http://www.photolib.noaa.gov/fish/fish0744.htm If the reefs are not in good health, it will affect faunal abundance and diversity. Despite their importance, oyster reef ecosystems have been degraded by various human pressures (Lenihan and Peterson 1998; Gagliano and Gagliano 2002). Since healthy oyster reefs support a thriving ecosystem and are also economically important to the fishing industry, restoration efforts should be performed to ensure that these habitats are returned to a healthy functioning state and that they are monitored and properly managed. In bays and sounds along much of the US coast, oyster reef restoration efforts are being performed in order to replace or maintain the critical ecosystem functions provided by both the oyster organisms and the complex habitat they create. When restoring oyster reefs, the primary ecological goals are usually to restore the physical structure and functioning of the ecosystem, promote oyster growth, and successfully develop complex ecological communities. Many volunteer groups, government agencies (local, state and federal), and universities have developed management and restoration plans for oyster reefs. In figures 4 and 5, there are two methods shown that can be used to create oyster reefs. The individual shown in Figure 4 is using a high pressure water system to distribute oyster shells from the platform of a boat, into the water, along the coastline. Over time, waves will further distribute shells allowing them to establish themselves along the coast by attaching to one another or, other hard substrates in order to form a reef.
4

Figure 4.1. Large-scale reef restoration shell planting in 2002, Folly Creek, Charleston Co., South Carolina, Andy Jennings running the water pressure nozzle. Photo courtesy of Loren Cohen, Shellfish Research Section, Marine Resources Research Institute, South Carolina Department of Natural Resources, Charleston, South Carolina.
Figure 4.2. Photo courtesy of Ray Haggerty (retired), SCDNR, large-scale reef restoration shell planting in 2002, Bull Creek, Beaufort Co., South Carolina.
5

Individuals shown in Figure 5 help to create reefs by transplanting oyster shells along the coast. Here oysters are placed in individual bags and laid down side by side until the selected area for oyster restoration is filled. Over time, oysters will grow through the bags and attach themselves to one another forming a hard reef structure.
Figure 5.0. South Carolina Aquarium SCORE reef building project, Charleston SC reef bags Individuals placing bags filled with oyster shells along the shoreline. Photo courtesy of Loren Cohen, Shellfish Research Section, Marine Resources Research Institute, South Carolina Department of Natural Resources, Charleston, SC.
6

Figure 5.1. Bags filled oyster shells along the shoreline to form reefs. SC Aquarium SCORE reef building project, Charleston SC. Photo courtesy of Loren Cohen, Shellfish Research Section, Marine Resources Research Institute, South Carolina Department of Natural Resources, Charleston, SC. Organization of Information - Following the section titled “Human Impacts to Oyster Reefs,” the structural characteristics of oyster reefs that are applicable to restoration monitoring are presented. These structural characteristics presented will generally be monitored first depending on the goals of the restoration project. After the structural characteristics have been addressed, the habitat’s functional characteristics are discussed later in the chapter. Some of these characteristics, if not all, should be monitored to ensure the habitat is functioning efficiently. Two matrices are then presented at the end of this chapter to show the connection between the habitat’s structural and functional characteristics to the parameters that can be considered for monitoring. Whenever possible, parameters shown in this list are discussed throughout the text to show how they can be used and factors that may influence them. These parameters are not expected to be monitored in all restoration projects. The information simply presents the role each characteristics plays and how it may be useful if monitored. Some characteristics however can be monitored before the project begins to gather baseline information on the condition of the habitat, and at the end of the project to
7

assess results. Also provided are various types of methods that can be used when monitoring a specific parameter however, one must consider the project goals and what type of data is expected to be collected. Experts in the field must be consulted as to the best method to use in a specific area. Finally, an annotated bibliography of monitoring and restoration-related oyster reef literature and a review of technical methods manuals are presented in Appendices I and II respectively to direct the reader to additional information that can be useful for developing a restoration monitoring plan.
HUMAN IMPACTS TO OYSTER REEFS Oyster reefs like other coastal habitats are threatened by various stressors such as:
• coastal development • harvesting techniques • run-off from agricultural and industrial sources • over-harvesting • oyster diseases
Coastal development in many cases involves the use of heavy machinery which disrupts or even destroys the oyster reef structure. Oyster harvesting techniques such as dredging also disrupts reef structure and faunal communities that are present (Lenihan and Peterson 1998). Over-harvesting can also threaten reefs as fishermen remove oysters in large amounts reducing the size of the reef structure (Coen et al. 1999). The reduction in oyster reef structure, in turn, reduces the abundance and diversity of faunal species, many of which are commercially and recreationally important. It is important to understand the structural and functional characteristics of oyster reefs in order to effectively monitor and restore these valuable coastal habitats.
Oyster harvesting techniques may also impact the reef’s structure and faunal community. Popular oyster harvesting techniques such as dredging, hand-tonging, and diver-collecting were investigated to determine how they alter oyster reef morphology, and caused incidental mortality to un-harvested oysters in the Neuse River, North Carolina (Lenihan and Peterson 1997). Reefs harvested with dredges experienced maximum reduction of reef height compared to other reefs that used a different technique. Harvesting disturbs the reef structure and may cause ecological changes. Reef height controls local hydrology flow, which, in turn, affects recruitment, growth, and survival of oysters. Reefs that were harvested by divers, rather than dredging, experienced the lowest incidental mortality and maximum catch per unit effort. It is therefore important to select carefully the type of oyster harvesting technique to avoid damaging the reef’s structure. Agricultural and industrial run-off from various sources affects the survival and growth of oysters. In many cases, run-off contains toxins or fertilizers, which may promote algae growth and cause a reduction in oxygen levels around the reef. As a result, oyster’s functional ability such as its ability to filter water efficiently decreases and eventually the oysters die. In the Neuse River in North Carolina, oysters declined because of low dissolved oxygen and environmental disturbances. Deep water reefs disturbed by harvesting were exposed to bottom-water with low dissolved oxygen levels throughout estuarine
8
stratification. As a result of low dissolved oxygen, oysters and other reef-associated invertebrates and demersal fishes eventually died (Lenihan and Thayer 1999). This was caused by the oyster’s inability to filter water and provide nutrients to the species that rely on them.
Oyster diseases also threaten the survival and recruitment of oysters and have been studied by many researchers. The parasites Perkinsus marinus, which causes Dermo, and Haplosporidium nelson resulted in MSX disease that caused oyster mortalities throughout the east coast of the United States (Leonard et al. 1999). MSX disease is brought on by a parasite which was introduced to East coast from Asia. The occurrence and intensity of Dermo and MSX in Eastern oysters found in Rhode Island waters was surveyed by various practitioners (Leonard et al. 1999). Perkinsus marinus infection levels were observed at their highest in August and may have been responsible for the oyster mortalities at several sites. Beginning in the 1950’s along the Chesapeake Bay, the native oyster (Eastern oyster Crassostrea virginica) was infected by Dermo and MSX diseases. Such diseases over time caused a significant decline in the Chesapeake’s native oysters which in turn significantly reduced the size of the oyster reefs. By 1990, these diseases were seen on oyster reefs throughout other areas such as Delaware, Maine, Massachusetts and Connecticut causing significant increase in oyster deaths on a much broader scale. Disease infected oysters tend not to filter water properly causing water quality to deteriorate around the reef. In addition decrease in the reef structure and reduced water quality can cause reef-associated fish either to die or migrate to other areas.
Importance of Monitoring Oyster Reefs Practitioners should conduct monitoring of the oyster reefs’ structural and functional characteristics both during and after restoration in order to: • evaluate the state of the habitat • understand the functioning of the ecosystem • monitor the interaction of the organisms on and around the reefs. Parameters selected for monitoring should be based on the particular goals and objectives of the restoration project. Monitoring restoration efforts allows the practitioner to determine whether modifications must be made to the project and to track the success of the restoration project (Molluscan Ecology Program 2002). Monitoring should also be conducted to (Coen 2003 per comm.):
• evaluate stressors at existing, but degraded, oyster reefs that might be targets for restoration (e.g., water quality, salinity, low D.O., disease).
• evaluate sites proposed for restoration. Some of the most important features here are bottom condition, water quality such as D.O., harmful algal blooms, and natural recruitment of oysters. (Note: both steps, a and b, could be combined to a category of pre-restoration monitoring).
• facilitate adaptive management. This means measuring those elements during the restoration process which will allow practitioners to modify their approach. For instance, monitoring the quality of the substrate in the years after initial planting can reveal whether or not it is necessary to add substrate to provide clean settlement sites.
9

Also, monitoring for oyster recruitment during the early years of the restoration process can indicate whether the site is recruitment limited and brood stock enhancement might be justified.
• assess restoration success. Most of which is discussed in this chapter.
There are various structural and functional characteristics that can be considered to monitor the success of a restoration project. Examples of characteristics that should be taken into consideration when evaluating and monitoring oyster reef restoration succession include (Coen 2003 per comm.): • Availability and integrity of substrate for continued oyster settlement.
Areas where oyster reef restoration is an issue: o Adequate substrate for settlement may be limited, so all restoration efforts
begin with the addition of substrate(s) or ‘cultch to sites where:
oyster recruitment and survival rates are sufficiently high, material is rapidly covered with oysters and provides substratum for additional oyster recruitment over time,
oyster recruitment and survival rates are low, competition with other epifauna often occurs. Substrate degradation caused by boring sponges and sedimentation may reduce the availability of clean substrate (generally oyster shell) for oyster settlement.
o Assessing the availability of adequate substrate prior to recruitment each year can provide a basis for making adaptive management decisions such as whether adding supplemental substrate(s) is needed.
• Oyster recruitment levels should be evaluated before, during and after the
restoration. Without new recruits the restoration effort, which in most cases involves planting some shell, is ineffective. It is crucial that oyster recruitment be monitored for a minimum of three to four years following the construction of reef foundation (Coen 2003 per comm.).
10

There are several components to this monitoring need that can lead to different adaptive management decisions and assessments of success. This includes:
Larval availability/settler abundance
Early post-settlement survival
o traditional “spat collectors” are substrates (shells, tiles, or other materials) that can be retrieved on a regular basis throughout the peak settlement time for oysters,
o they should be placed in the vicinity of reef restoration projects to assess the “potential recruits” to the reef,
o expectations about the abundance of newly settled oysters will vary locally, but some minimal level of oyster recruitment will be required for successful restoration.
o if oyster settlement is unsuccessful, the restoration project must either: - be relocated
- oyster brood stock in the area enhanced, or - remote set oysters onto
substrates deployed onto reefs including relaying seed
o standard stock assessments of oysters (e.g., young-the-year recruits) provides a measure of success of the reef substratum and may suggest some remediation if the success is low. It is important to obtain quantitative estimates at sufficient frequency and over more than one recruitment season,
o if the number of settling oysters is sufficiently high but the number of surviving new recruits is low, then it may be possible to identify the cause(s) of this mortality and changes may result.
An example with regard to early post-settlement survival was observed in Virginia, where reef bases constructed of alternative substrates (surf clam shell and coal ash pellets, intertidal) were found to have similar settlement abundances as reefs of oyster shell, but much higher predation-induced mortality rates (Coen 2003 per comm.). The result was that restoration using the alternative substrate as bases was unsuccessful, while that using oyster shells was successful. Incidentally, a midcourse change (modifications made as needed during the project) would be to cap the clam shell and coal ash bases with a layer of oyster shells. Similarly, current restoration efforts in some states are revealing that degradation of shell substrate by boring sponge may demand fresh shell be added to a restoration site for several consecutive years until a
11

sufficient number of living oysters establish themselves on the reef (Coen 2003 per comm.).
• Abundance and size frequency distribution of oysters on the reef. The size and frequency of oysters on the reef suggests an age structure critical to estimating population demographics and its growth potential.
Figure 6. A small-scale experiments to assess the impact of boat wakes on newly planted Gulf shell, Inlet Creek experiments. Photo courtesy of Loren Cohen, Shellfish Research Section, Marine Resources Research Institute, South Carolina Department of Natural Resources, Charleston, SC.
• Diseases and related monitoring Oyster diseases are widespread throughout regions where oyster restoration is likely to be conducted. It is important to measure disease prevalence and intensity for two reasons:
o because knowing disease levels can play a role in understanding mortality patterns and affect adaptive management decisions and,
o because an important goal of oyster restoration efforts is to develop oyster populations with greater disease tolerance over a longer period of time
12

(especially in North Carolina (NC), Virginia (VA) and Maryland (MD)). It is necessary to follow disease dynamics to track progress towards this goal.
This is currently urging potential introductions of exotic (non-native) oyster species (NC, VA). In South Carolina, a lot of effort is placed on monitoring diseases along with environmental information (temperatures, intertidal, subtidal, pH, DO, depth, salinity, etc., expensive).
Structural Characteristics of Oyster Reefs When designing a successful oyster reef restoration monitoring plan, one must first understand the structural characteristics of the habitat and how they relate to the project goals. These structural characteristics include:
• Biological o Habitat created by animals
• Physical o Topography/Bathymetry o Sediment type and grain size o Tides and Hydroperiods o Turbidity/Light availability
• Hydrological o Water sources
• Chemical o Salinity o Dissolved Oxygen
Since these structural characteristics can influence oyster attachment, establishment and growth, practitioners, must first monitor them to ensure conditions are favorable for successful restoration. Once reefs have been established, the practitioner can begin monitoring the reef’s functioning capacity such as providing breeding, feeding and nursery grounds for fish and other marine organisms. Pre-restoration monitoring is recommended before restoration is conducted to determine baseline conditions. After restoration efforts, post-restoration monitoring is performed to track the success of the project by comparing the restoration site to reference sites. This section however concentrates on the structural characteristics of oyster reefs and methods that can be used to sample, measure and monitor each parameter. BIOLOGICAL
Habitat created by animals
As mentioned earlier in the introduction, oyster reefs are formed when individual oysters accumulate and form a complex structure that rises above the bottom floor. Oysters are filter feeding bivalve molluscs filtering microalgae, suspended particulate organic matter, and dissolved organic matter from the water column over their gills. Recruitment, settlement and growth of oysters over time increases the size of the reef which supports local and
13

commercial fisheries such as crabs, oysters and fish. The structure of the reef forms a three-dimensional biogenic2 habitat in intertidal or subtidal zones composed of multiple year classes of oysters which also provides microhabitats for many different species of animals such as polychaetes and shrimps (Shipley and Kiesling 1994). Intertidal oyster reefs are found throughout the entire intertidal zone, from near bottom to depths where the reef’s top frequently breaks the surface of the water at low tide (Chesapeake Bay Program 2002). Subtidal oyster reef however extends slightly above the bottom yet below the intertidal zone.
Monitoring Methods
The NOAA Coastal Services Center and South Carolina Department of Natural Resources (SCDNR) have been working together to develop high-resolution remote sensing methods for assessing intertidal oyster reefs along the South Carolina coast (Finkbeiner et al. 2003). Multiple image processing, photography, spectral clustering, and digital texture analysis are methods primarily used to determine the boundaries and spatial characteristics of oyster reefs (Finkbeiner et al. 2003) Restoration practitioners can also used digital and analog aerial photography to assess oyster reef conditions during restoration. Figure 7 shows an aerial photograph of intertidal oyster reefs.
Figure 7. Represents an aerial photograph of oyster reefs. SCDNR, reef construction, Inlet Creek, SC, Charleston Co. Photo courtesy of George Steele, South Carolina Department of Natural Resources, Charleston, SC.
For four years, side-scan surveys were used for rapid and accurate assessment of oyster reefs in turbid waters in south Louisiana (Allen et al. 2003). They compared the number of shells recorded from quadrant sampling in each sampling site. Dredge sampling was integrated with
2 resulting from the actions of living organisms
14

groundtruth side-scan surveys to make results more relevant to the oyster industry. Combining the use of side-scan sonar and GIS to monitor oyster productivity is useful for monitoring and tracking changes to oyster reef communities (Allen et al. 2003).
PHYSICAL
Topography
Topography of intertidal oyster reef has a distinct three dimensional structure that is composed of living oyster shell. The reefs provide vertical relief and structural heterogeneity (e.g., the height and width of the oyster shells that form reefs) that attracts and sustains fish population such as:
• striped bass (Morone saxatilis), • bluefish (Pomatomus saltatrix), and • weakfish (Cynoscion regalis).
The size of vertical relief affects faunal abundance and utilization in oyster reefs (Breitburg and Miller 1998). The complexity of the reef structure and vertical relief increases habitats for fish and decapods utilizing the reef as refuge (Lenihan 1999). Size of the reef’s vertical relief can improve water quality by enhancing the removal of materials from the water near the reef. Along the Neuse River, in North Carolina, oyster decline and change in topography results from various environmental disturbances (Lenihan and Thayer 1999). Following their investigations, researchers were able to determine that some harvest practices affected the reef’s topography by reducing the height of oyster reefs, causing a decrease in flow speeds across reefs. In addition, reduced flow speeds caused an increase in sedimentation which reduced the quality of suspended food material for oysters. This explained why oyster’s growth on harvest-disturbed reefs was slow, their health was relatively poor and mortality rates were higher.
Monitoring and Measuring Methods
Estuarine and coastal benthic habitats are evaluated using underwater acoustic technology with reflected sound energy to identify surface objects, texture, and density disturbances, and to classify benthic habitat (Smith et al. 2001). Researchers have used sub-bottom profiling systems, side scan sonar, and acoustic seabed classification systems (ASCS) to successfully assess oyster reef structures. Data collected on the quality and quantity of oyster shell resources was then integrated with Geographical Information Systems (GIS) to assess oyster habitat (Smith et al. 2001). Using this method can help practitioners evaluate changes in oyster reef structure over time following restoration efforts. A recommended method for rapidly classifying bottom type navigation is to combine mapping by acoustic profiler to differentiate substrate type, and a fathometer to assess bottom relief and a global positioning system (GPS) to determine accurate position (Simons et al. 1992). This method has effectively mapped oyster reefs and oyster bottom of Galveston Bay, Texas. Instruments are employed using a small research vessel, in most weather conditions, and in shallow (<1 m) or deep (>10 m) water.
15

Subtidal oyster reefs can be measured and evaluated using hydroacoustic techniques (Dealteris 1988). This technique involves a precision survey echo sounder operating at 200 kHz, and a side-scan sonar system operating at 100 kHz. Based on studies, the sounder proved very effective for remote sensing of bottom type and topographic features within a narrow channel of an estuary. The sonar map also provided complete bottom coverage.
In Florida, the reef’s oyster size and abundance were measured using quadrat sampling on ten reefs. The use of quadrats for assessing the oyster size and abundance is shown in Figure 8.0 and 8.1. Reef patterns, and the effect channels may have on the reef’s structure were then characterized using low-altitude aerial imagery and GIS-based mapping (Grizzle and Castagna 2000). Patterns seen using aerial imagery proved that water movements influence reef development (Grizzle and Castagna 2000). Aerial imagery and GIS mapping proved effective for assessing reef patterns and bottom coverage.
Figure 8.1. large-scale reef restoration sampling of shell planted in 2002, sampled in 2003, Hamlin Creek, SC, using 0.25 m x 0.25 m quadrats to assess oyster recruitment. Photo courtesy of Loren Cohen, Shellfish Research Section, Marine Resources Research Institute, South Carolina Department of Natural Resources, Charleston, SC.
16
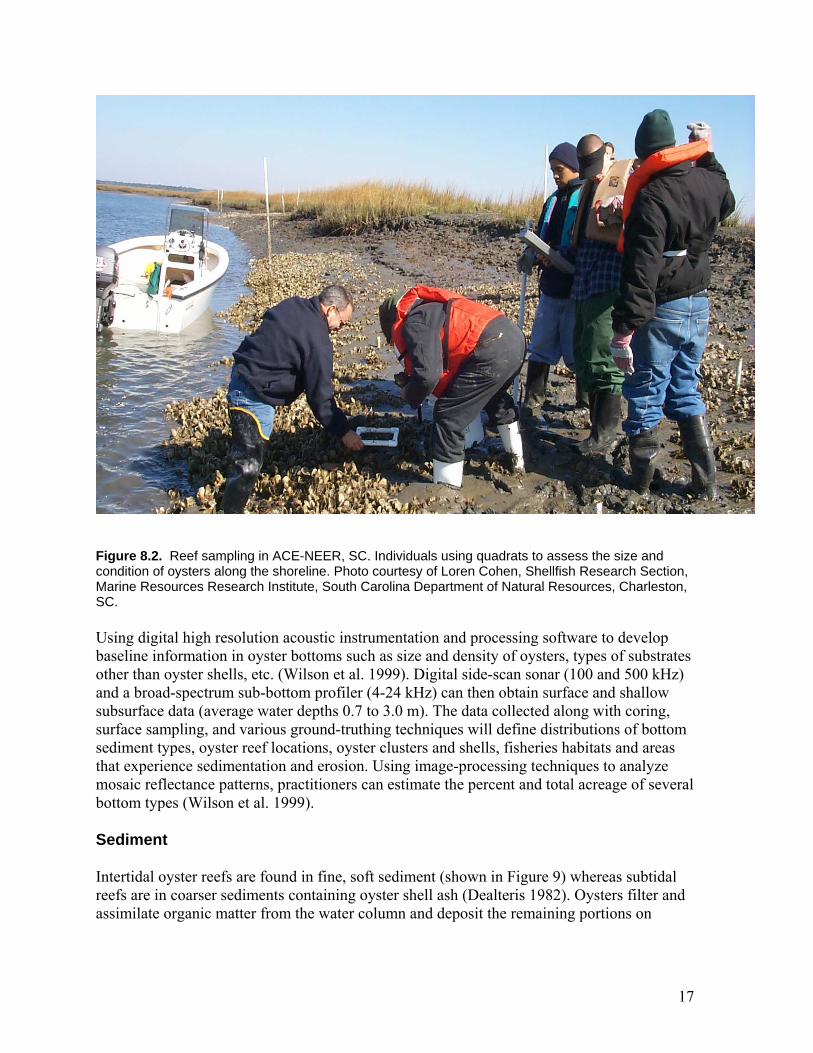
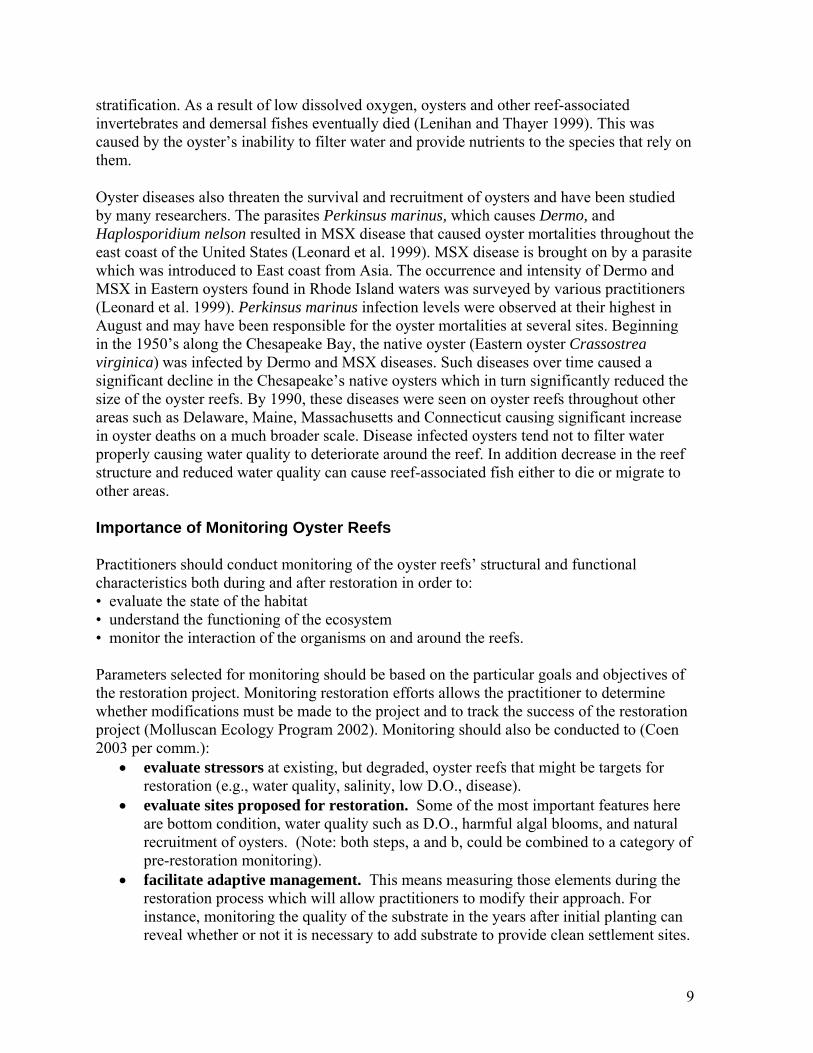
Figure 8.2. Reef sampling in ACE-NEER, SC. Individuals using quadrats to assess the size and condition of oysters along the shoreline. Photo courtesy of Loren Cohen, Shellfish Research Section, Marine Resources Research Institute, South Carolina Department of Natural Resources, Charleston, SC.
Using digital high resolution acoustic instrumentation and processing software to develop baseline information in oyster bottoms such as size and density of oysters, types of substrates other than oyster shells, etc. (Wilson et al. 1999). Digital side-scan sonar (100 and 500 kHz) and a broad-spectrum sub-bottom profiler (4-24 kHz) can then obtain surface and shallow subsurface data (average water depths 0.7 to 3.0 m). The data collected along with coring, surface sampling, and various ground-truthing techniques will define distributions of bottom sediment types, oyster reef locations, oyster clusters and shells, fisheries habitats and areas that experience sedimentation and erosion. Using image-processing techniques to analyze mosaic reflectance patterns, practitioners can estimate the percent and total acreage of several bottom types (Wilson et al. 1999).
Sediment
Intertidal oyster reefs are found in fine, soft sediment (shown in Figure 9) whereas subtidal reefs are in coarser sediments containing oyster shell ash (Dealteris 1982). Oysters filter and assimilate organic matter from the water column and deposit the remaining portions on
17
bottom sediments. Sediments, therefore, act as a nutrient sink providing food for benthic organisms.
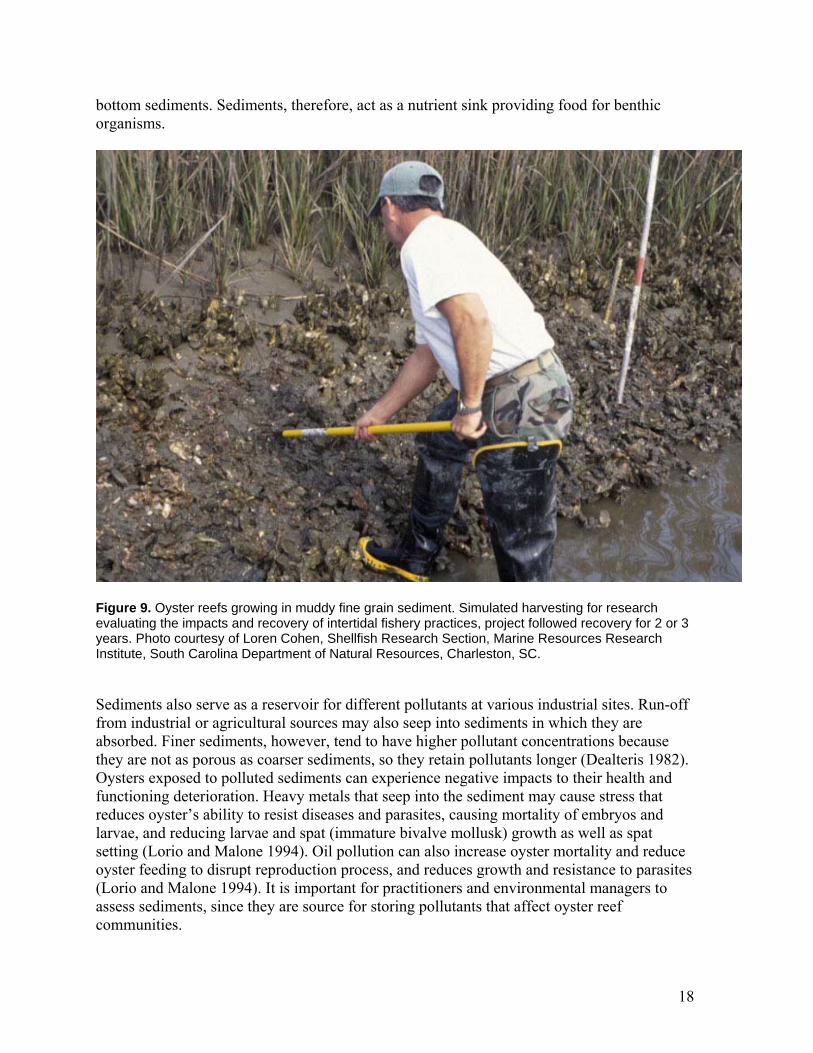
Figure 9. Oyster reefs growing in muddy fine grain sediment. Simulated harvesting for research evaluating the impacts and recovery of intertidal fishery practices, project followed recovery for 2 or 3 years. Photo courtesy of Loren Cohen, Shellfish Research Section, Marine Resources Research Institute, South Carolina Department of Natural Resources, Charleston, SC. Sediments also serve as a reservoir for different pollutants at various industrial sites. Run-off from industrial or agricultural sources may also seep into sediments in which they are absorbed. Finer sediments, however, tend to have higher pollutant concentrations because they are not as porous as coarser sediments, so they retain pollutants longer (Dealteris 1982). Oysters exposed to polluted sediments can experience negative impacts to their health and functioning deterioration. Heavy metals that seep into the sediment may cause stress that reduces oyster’s ability to resist diseases and parasites, causing mortality of embryos and larvae, and reducing larvae and spat (immature bivalve mollusk) growth as well as spat setting (Lorio and Malone 1994). Oil pollution can also increase oyster mortality and reduce oyster feeding to disrupt reproduction process, and reduces growth and resistance to parasites (Lorio and Malone 1994). It is important for practitioners and environmental managers to assess sediments, since they are source for storing pollutants that affect oyster reef communities.
18

Sampling and Monitoring Methods
Sediments can be sampled using vibracore samplers (Volety et al. 2002), that contains a 3-inch diameter aluminum irrigation pipe that vibrates into the sediment. Sediment compaction evaluated by sediment height inside and outside the pipe. The top of the pipe is then covered and the pipe removed with the core sampled sealed. The core is then retrieved by dividing the aluminum pipe and then separating the cores. The sediment can then be characterized by analyzing grain size through dry sieving, and using pipettes (McManus 1988) as well as a laser coulter counter (Volety et al. 2002). Percent carbon and oxygen present in sediment samples are determined using acid dissolution, and the percent organics via ignition. To conduct carbon and nitrogen isotope analyses, sediment samples are dried and acidified with 10% hydrochloric acid to eliminate all carbonates. The samples are then dried again and analyzed for carbon and nitrogen (Volety et al. 2002). To differentiate substrate type and assess bottom relief respectively, an acoustic profiler along with a fathometer can be used to chart records and interpret sediment characteristics and reefal features (Ellis et al. 1993). Ground-truthing will differentiate reef from clam beds and coarse shell hash. Bathymetry and sediment type data were processed using Geographic Information System (GIS) to create maps of reefs. Arc/Info software was used to develop maps of reefs in most of Galveston Bay, Trinity Bay, East Bay, and West Bay. Oyster reefs abundance and oyster bottom documented in this study was significantly higher than the amount of reefs recorded in the past (60’s and 70’s) by Texas Parks and Wildlife Department. These results indicate that reef growth increased over the years the majority of the reefal areas were created due to human activities (e.g. spoil banks, oil and gas field development, oyster leases, change in current flow) (Ellis et al. 1993). Tides/Hydroperiods Tides play a significant role in oyster reef survival by delivering nutrients in which inorganic particulate material is taken up by oysters and released. They also act as a flushing system, removing excess nutrients, and preventing feces and biodeposit3 build up in the water. Oyster reefs develop productively in areas where bottom currents transport biodeposits away from the reef. If biodeposits are not removed, oysters can be inundated with their own feces and pseudofeces4 preventing filter-feeding from occurring. Not only do tides transport nutrients, but they also transport oyster larvae to promote oyster settlement, growth and reef development (Ruzecki and Hargis 1989). Along the Pataguanset River in Connecticut, oyster populations consisted of large adult oysters and a small number of juveniles. Underwater observations confirmed the tremendous silting of newly planted shell cultch, which prevented oyster settlement. This increase in siltation was due to construction of a railroad causeway which caused river width reduction and restricted tidal flushing. In addition, tidal restrictions caused a decline in oyster recruitment because oysters were not able to attach to substrates covered largely by silt (Visel et al. 1989).
3 includes feces and pseudofeces which are nutrient rich food sources that can be easily assimilated by organisms 4 Substance discarded by suspension feeders or deposit feeders as potential food
19

Sampling Method
Harmonic analysis is a relatively straight forward method used to assess hydroperiod in various wetland types (Nuttle 1997). It allows quantitative sampling by gauging the breadth and timing of the main periodic element in a time series of water levels (Nuttle 1997).Quantitative measures of hydroperiod display the relationships between hydroperiod and functioning of oyster reef communities. Turbidity Though oysters filter water and improve its quality, an increase in turbidity can influence oyster reef growth and survival. Sediment increase in the water column caused by high energy tides can smother oyster larvae, as well as disturb the filter feeding process of oysters, affecting their growth and development (Rose 1973; Cairns 1990; Chew 2002). High and persistent levels of sediment cause permanent changes in oyster reef community structure. Sources that increase sediments and turbidity are agriculture, forestry, mining, road construction, and urban activities (Cairns 1990). This includes diversity, density, biomass, growth, and rates of reproduction and mortality as well as altering local food webs (Cairns 1990). In addition to sedimentation, oyster reef communities are negatively impacted by excess nutrients in sediments from runoff, which promotes algae growth and increases turbidity. Resulting algal blooms not only depletes oxygen available for organisms such as oyster larvae and fish (Cheney et al. 2001) but also limit needed sunlight for other vegetative species surrounding the growing oyster reefs. Sampling and Monitoring Methods A turbidimeter measures water turbidity by passing a beam of light through the sample and measuring the quantity of light scattered by particulate matter (Rogers et al. 2001). The turbidity measurements are then shown in Nephelometer Turbidity Units (NTU’S) on the display (Rogers et al. 2001). Turbidity can also be measured by the depth of light penetration using a secchi disc to measure water clarity (Lee 1979; Parsons et al. 1984; Steel and Neuhausser 2002). It is a disc shaped instrument with alternating black and white quadrants, attached to a rope or another type of extension line and lowered into the water column from the shore, pier or boat until the disc is no longer visible. As light travels through the water column, some of it is absorbed by phytoplankton and dissolved material. The remaining light reflects off the secchi disc and travels back through the water column where more is absorbed. As the disc is slowly lowered in the water, it gradually becomes harder to see, as increasing amounts of light are absorbed. The depth at which the disc can no longer be seen, is the depth where light is being absorbed as it passes down and back up through the water column. This is recorded as the secchi disc depth. This procedure can be done multiple times (3 times on average) in the same point to get the average turbidity value (Steel and Neuhausser 2002).
20

HYDROLOGICAL Water sources Sources of water entering oyster reef communities should be taken into consideration when developing a restoration plan, as this can influence the success or failure of a restoration project. Upstream land uses for that experience agricultural or industrial chemical run-off and sewage water, adversely affects oyster reef and faunal community health (Scott et al. 1996; Zoun 2003). Runoff from sewage can promote fecal coliform presence which further degrades water quality and negatively affects oyster health. Oyster degradation affects their faunal community as well as humans that harvest oysters for consumption (Rodriguez 1986; Zoun 2003). Additional water sources, such as groundwater and surface water, also affect oyster reef communities. By evaluating oyster reef water sources, and the potential impacts resulting from them, restoration practitioners can design an effective restoration plan to include monitoring parameters used to measure water quality. Discussed is an example of how upland water sources may affect oyster reefs.
Upland source While oysters are filter feeders, they cannot readily filter substances in high concentrations. In some cases, oysters become infected with diseases or simply decline in health because of exposure to high chemical concentrations. The Chesapeake Bay oyster population has decreased significantly because of discharged municipal and industrial waste into the bay waters (Chen and Roesijadi 1994). The chemical pollutants that were the primary threat to oysters were: • trace heavy metals (e.g., As, Cd, Cr, Cu, Hg, Sn, and Zn) • organic compounds (e.g., pesticides, phthalate ester, polynuclear aromatic hydrocarbons (PAHs), and • polychlorinated biphenyls (PCBs). High levels of both types of chemicals in the sediment of the bay were seen (Chen and Roesijadi 1994). Because oysters are sedentary bottom dwellers, they are exposed to high concentrations of these toxins (Chen and Roesijadi 1994) which can result in their decline and reduce their ability to function efficiently. This makes monitoring and recording the source of oyster reef water supply and adjacent land use a priority. Run-off from land activities has proven to be a significant factor in the reduction of oyster populations. Many researchers have studied the impacts of land-use activities on coastal areas reefs (Marcus 1989). Such land use activities included recreational marinas, an industrial point source wastewater discharge, and agricultural non-point source pesticide runoff. Results showed that recreational marinas displayed the lowest pollutant levels in oysters with no harmful biological effects. The industrial point-source activity showed the highest pollutant levels in oysters and significantly detrimental biological effects. The agricultural runoff activity however showed moderate pollutant levels in oysters but significantly harmful biological effects to oysters.
21

CHEMICAL Dissolved Oxygen Dissolved oxygen plays a role in oyster survival and growth. In some cases low dissolved oxygen has resulted in oyster mortalities reducing reef size. In Bon Secour Bay, Alabama, during summer 1999, continuous decrease of oxygen levels caused a significant decline in oysters and reduced reef structure (Rikard et al. 2000). Along Puget Sound, Washington and Tomales Bay, California, an increase rate of oyster mortalities were also seen as a result of long periods of low dissolved oxygen (DO) (Cheney et al. 2001). During the evening, there was a long period of neap tides with low and slow-moving water which resulted in daily and successive reductions in DO levels causing oyster decline. In addition, DO reductions also resulted in macroalgae blooms and high phytoplankton densities altering oyster communities. Oyster reductions throughout the Neuse River in North Carolina, another case mentioned earlier in this chapter, was a result of low dissolved oxygen. In addition, the number of fishes and invertebrates that occupied oyster reefs also reduced (Lenihan and Thayer 1999). These examples provided show that dissolved oxygen plays a role in oyster survival and should be taken in consideration when monitoring restoration success over time.
Measuring Methods
There are several methods used to measure dissolved oxygen (DO). The inexpensive titration-based drop count technique, the dissolved oxygen meter, and the commercial fiber optic oxygen sensor. An oxygen meter consists of a sensor and the meter (Hargreaves and Tucker 2002). The fiber optic oxygen sensor consists of an optical fiber with a sensor tip that contains a thin layer of oxygen-sensitive fluorescent dye. Once the sensor is placed into the water sample, the optical fiber stimulates the dye to release fluorescent light that travels to a photo detector. Oxygen diffusing in the sensor tip connects to the fluorescent dye, reducing the intensity of light emission to show low oxygen concentration (Hargreaves and Tucker 2002). Salinity Oyster reefs can be found in a wide salinity range (12 ppt to 28 ppt). Extreme salinity fluctuations affect the survival, growth and distribution of oysters that form reefs as well as the abundance and distribution of other macroinvertebrates. During severe storms, salinity changes occur in estuaries which may promote oyster diseases (Powell 1995). Dermo disease increases during periods of high salinity. Oyster’s death usually occurs during the summer when severe storms like El Niño occur frequently. Also, during periods of low rainfall, Dermo disease may occur as salinity increases causing oyster death (Powell 1994). The effect of environmental changes such as salinity on the Eastern oyster, Crassostrea virginica population was investigated using simulation models (Dekshenieks et al. 2000). Simulations revealed that salinity is the primary factor controlling the spatial degree of oyster distribution. Other research studied the optimum salinity for the spat of the pearl oyster, Pinctada fucata martensii (Numaguchi and Tanaka 1986). Researchers found that spat died at below 30% sea water (salinity 11.4ppt) however the optimum salinity for the spat was greater than 60% sea water
22
(salinity 22.7ppt). Such studies show that salinity plays an important role in the spat of oyster and should be measured and closely monitored when conducting restoration practices to track salinity changes that may affect oyster reef development, growth and faunal community. Measuring Methods
Among many commercial instruments used to measure salinity is a hand-held refractometer. This instrument measures the light bend between dissolved salts as it passes through seawater (Rogers et al. 2001). Salinity is measured on a calibrated refractometer by first placing a few drops of the seawater under a transparent slide, and reading salinity by looking through the eye piece (Rogers et al 2001).
A hydrometer measures salinity by comparing the weight of the seawater to fresh water samples The glass tube hydrometer is placed into the jar until it floats. The number on the hydrometer scale at the water surface and the temperature of the water is then identified, to determine the salinity by looking up the values on tables that come with hydrometers (Rogers et al. 2001).
FUNCTIONAL CHARACTERISTICS OF OYSTER REEFS Oyster reefs perform important functions such as:
• Provide habitats for plants, fish and invertebrates • Provide breeding, feeding and nursery grounds for fish, crustaceans, other invertebrates
and birds species • Create a hard structure that is used as a place of refuge against larger predators • Provide a place for sessile organisms to attach to • Assist in cycling nutrients for marine organism to utilize • Maintain water quality and stabilizing sediments • Protect coastal areas from erosion
By performing these functions, reefs are able to support important local and commercial fisheries as well as maintain species of plants and animals diversity and abundance. If the health of the reef is degraded in anyway, it can affect the functioning of this habitat such as its’ ability to filter sediments (Righetti 2000) and cycle nutrients for reef organisms (Dame et al. 1989) or provide a healthy nursery and breeding grounds for organisms (Crockett et al. 1998; Anderson and Connell 1999). Understanding how this habitat functions is important when attempting to restore it. In addition to restoration efforts, monitoring should be performed to determine whether the habitat is functioning efficiently and to track the success of the restoration project. This section concentrates on the biological, physical and chemical functions performed by oyster reefs. Also provided are some methods that can be used to sample, measure and monitor some of the functional parameters affiliated with each of the characteristics described. For example, oyster reefs are used as breeding and feeding grounds by many species of animals. These functions are measured by counting the number of animals that use the habitat for these reasons. Also recorded is the type of species that utilize the habitat. Not
23
all functional characteristics described however are expected to be measured. The information provided simply illustrates the importance of the habitat. The examples provided, are just a few of the numerous methods that can be used. Sources are cited throughout the text to guide readers to additional information.
Habitat
Oyster reefs support a complex trophic structure and biodiversity. They provide habitat for numerous species including crustaceans, benthic invertebrates and fish. Crustaceans such as crabs occupy the crevices inside the oyster reef. Benthic invertebrates like grass shrimp are commonly found occupying the bottom areas. Fish use the oyster reef in various ways. For instance, toadfish attach their eggs to the underside of fused oyster shells while striped blennies, gobies and skilletfish lay their eggs in dead oyster shell beds (Coen et al. 1999a). Because oyster reefs support many valuable commercial and recreational fisheries and add to species diversity, it is important to manage, monitor and restore these unique habitats. Habitat use and health of the habitat should be closely monitored since any deterioration in the habitat’s condition will likely affect fauna abundance and survival. Some of the animal species that live amongst oyster reefs include:
• oysters (Crassostrea virginica), • fiddler crabs (genus Uca), • blue crab (Callinectes sapidus), • grass shrimp (Hippolyte sp.), • mussels (Mytilus edulis), • rockfish (genus Sebastes), • oyster toadfish (Opsanus tau), • sea squirts (Molgula manhattensis), • blue heron (Ardea herodias), • ibis (Eudocimus rubber) • American oystercatcher (Haematopus palliates).
Common vegetative species that live on oyster reefs include seaweeds and algae, and are also food sources for many species of fish and crustaceans. Some of these vegetative species include:
• spiny seaweed (Acanthophora spicifera) (Kilar and McLachan 1986a) • algae (Carpophyllum scalare Suhr, Anatheca dentata (Suhr) Papenfuss, Ceramium
obsoletum and C. agardh Phytoplankton, found in the water column associated with oyster reefs, are filtered by oysters and other epifaunal suspension feeders (McFarlane 1994).
24

Monitoring Methods Vegetation Oyster reef vegetation is measured by evaluating its cover, distribution and abundance. Quadrats, made of plastic and are rectangular or square in shape, provide reference frames used to estimate abundance, cover and biomass of plants. . They can be placed randomly, or at a fixed position in an area to observe specific areas at a time. Estimate Species abundance by calculating the mean of samples collected from each study area. Monitoring frequency for vegetation growth is based on a species growth rate and time of year. Practitioners should track vegetation increase or decrease over time. Vegetation can also be measured and recorded for visual information using fixed viewpoint photography (Moore 2001). Taking photographs at a specific point to develop habitat surveys, allows recording of changes occurring in the habitat’s physical structure This also shows whether visual photographs taken of these changes in smaller areas is a good representation of larger areas (Moore 2001). A Single Lens Reflex camera with a 50mm lens, a 35mm or 28mm wide angle lens, and a fixed focal length will ensure repeatability of the view angle each time the photo is taken (Moore 2001). Photos can then be compared to show increase or decrease in vegetation over time. Breeding, Nursery and Feeding Grounds
Reefs provide breeding and nursery grounds for many species such as crustaceans, fishes and birds. Just a few examples are provided to show how oyster reefs are used by some species of animals. Mussels for instance commonly attach and spawn in areas next to oyster reefs. As mentioned earlier, oyster toadfish lay eggs near oyster reefs and attaches their eggs to the underside of the oyster shells; and gobies, blennies and skillet fish lay their eggs on the inside of newly dead oyster shells (Breitburg 1999). Also recreational and commercial valuable finfishes including:
• striped bass (Morone saxatilis) • bluefish (Pomatomus saltatrix) • weakfish (Cynoscion regalis) commonly use oyster reefs as nursery grounds (Harding
and Mann 1999).
Reefs provide feeding grounds for mobile and sessile species. Juvenile crustaceans for example feed on invertebrates that are present in reef sediments; seagulls feed on small fish that are present in shallow waters near the reef or in reef crevices; and predatory fish feed on the oysters and in some cases may alter the reef structure. Researchers have studied the effects of fish predation on oysters recruiting to experimental panels of three different sizes (Anderson and Connell 1999). Results showed that oyster numbers reduced significantly averaging 40% on panels open to predatory fish. Fish also significantly altered the distribution of various oyster sizes. As a result, the reef structure is altered and in some cases may reduce the size of the structure (Anderson and Connell 1999). As the oyster reef
25

structure decreases, so do faunal numbers because the reef cannot accommodate as large a number of animal species.
Intertidal reefs are an important habitat and foraging grounds for shorebirds. Near Fisherman's Island, Virginia, some researchers observed the roosting and foraging behavior of the American Oystercatcher Haemotopus palliatus within and adjacent to thirteen reefs consisting of surf clam shell, oyster shell and coal ash pellets (Crockett et al. 1998). The American Oystercatcher was seen resting and feeding mainly on reefs composed of oyster shell (Crockett et al. 1998). As a result, oyster reefs serves as important resting and feeding areas for birds (Crockett et al. 1998). If oyster reefs are degraded in any way, bird communities that occupy the reefs within a specific area may be forced to migrate to other areas where environmental conditions are suitable and food is available.
Sampling and Monitoring Methods: Animal Species Birds Aerial surveys and direct counts can be used to monitor birds along coastal and estuarine habitats. Aerial surveys inventory migrant shorebirds (Erwin et al. 1991) and monitor wintering populations (Morrison and Ross 1989). Surveys are used to estimate relative abundance of migratory and wintering populations, and to assess population trends of migratory shorebirds. Direct counts are used to estimate number of shorebirds (bird density). Data collected on the number of birds in a habitat are recorded on audio tape and then copied onto data sheets. In some cases video cameras and aerial photography are used with aerial surveys (Dolbeer et al. 1997). Aerial photography provides precise estimates of birds and visual records of the structure of oyster reefs habitats. Fish Different types of nets can be used to sample fish in oyster communities such as gill nets which consist of lose netting, floatation devices that are located on the top and weights to keep the bottom of the trap suspended in sediments (shown in Figure 10). As fish swim through the water, they are caught with the nets and then measured (species type, size and abundance).
26

Figure 10. The use of nets to collect samples of fish and other marine organisms along oyster reefs. Fisherman Island Project, VA Eastern Shore. Photo courtesy of Mark Luckenbach, Eastern Shore Laboratory, Virginia Institute of Marine Sciences. Visual surveys are also used to assess fish communities. Underwater visual census is used for estimating fish abundance via snorkeling, scuba diving or video cameras. Organisms are counted using quadrats, transects, or fixed point counts (Samoilys and Carlos 2000). Transects are marked to define the boundaries of the study count area. Fixed point counts entails counting from a specific point as you rotate in the quadrat (Samoilys and Carlos 2000).
During restoration monitoring, fish are captured on both natural reefs (reference reef) and created oyster reefs to make comparisons between the two reef types. Species type, abundance (density) and diversity are recorded in a given area for both natural and created reefs. Researchers have made estimates on enhanced fisheries in restored reefs (Peterson et al. 2003). They analyzed quantitative measurements of fish abundance and large mobile crustaceans on oyster reefs, and on nearby sedimentary habitat in the southeast United States. Densities were compared in each species by size (in relation to age) on oyster reefs and sedimentary bottom to estimate how oyster reef restoration on sedimentary bottom may increase fisheries abundance. They analyzed published information on growth rates of each species as well as empirical data on age-specific survivorship. The per-unit-area enhancement of fish production and large mobile crustaceans expected from the addition of oyster reef habitat was then calculated. Results showed that 10 m2 of restored oyster reef in the southeast United States is estimated to yield an additional 2.6 kg of fish and large mobile
27

crustacean production per year. Also a restored reef that reaches twenty to thirty years old is estimated to have an increase in fish and large mobile crustacean production by a cumulative amount of 38 to 50 kg for every 10 m2. This study suggests that oyster reef habitat currently limits reef-associated fish and crustaceans’ production in the southeast United States. Based on large amounts of fishes with reef-dependent prey, and the depletion of reef habitat over time, researchers feel this is a rational hypothesis.
The frequent use of oyster reefs by fishes can be assessed by evaluating patterns of transient fish species richness, abundance and size-specific habitat use (Harding and Mann 2001). Along the Piankatank River in Virginia, researchers observed the use of sand bottom to oyster reefs by fish (Harding and Mann 2001). Fish species such as:
• Atlantic croaker (Micropogonias undulatus), • Atlantic menhaden (Brevoortia tyrannus), • bluefish (Pomatomus saltatrix), • silver perch (Bairdiella chrysoura), • spot (Leiostomus xanthurus), • spotted seatrout (Cynoscion regalis), • striped bass (Morone saxatilis), • weakfish (Cynoscion nebulosus) were seen in both sand bar and oyster reefs.
By observing transient fish size and abundance patterns between sand bar and oyster shell bar, practitioners identified that size and abundance of fish increased as the habitat changed from sand bar to oyster reef.
Nekton A quantitative sampling method for nekton5 on intertidal oyster reefs includes a 24-m2 lift net (Wenner et al. 1996). This method surrounds an area of oyster reef with a buried net at low tide, allowing the water level to rise, raising the net at high tide to trap and collect nekton (Wenner et al. 1996). This method was used to sample nekton on natural and artificially constructed reefs composed of Eastern oyster (Crassostrea virginica). Efficiency (mark-recapture) studies were then performed to evaluate the method. Advantages to using this method are:
• the habitat in the area to be sampled will experience minimal damage • the size and shape of the net system can fit a variety of habitats • no permanent structures, other than a shallow perimeter trench, are present to act as
attractants • it is inexpensive to purchase and maintain gear.
This lift net method proved more efficient on natural reefs than artificial reefs, and the return rate was slightly better for Fundulus heteroclitus than for Palaemonetes spp., therefore captured species will vary.
5 Organisms that can swim without the help of water currents such as most fish, mammals, turtles, sea snakes, and aquatic birds.
28

Crustaceans Blue crab recruitment can be quantified using settlement trays filled with either air-dried oyster shells or artificial seagrass. This allows the practitioner to observe which habitat type crabs primarily prefer to settle throughout the different life stages (Etherington et al. 1996). Seagrasses should be assessed because they are considered oyster reef associated habitats that influence reef communities. In Beaufort, North Carolina, researchers placed trays on unstructured seafloor to assess recruitment of blue crab megalopae6. Also quantified were the effects of patch shape (square vs. thin) and patch "edge" versus "center" on density. Using this method, researchers were able to show that blue crabs relied on both seagrass and oyster reefs as a place for settlement and refuge, therefore, both habitat types function as an interconnected community. Xanthid crabs Panopeus herbstii and Eurypanopeus depressus abundance can be determined with regard to surface oyster reef shell cover, surface oyster cluster volume, subsurface shell content, substrate sand and silt composition, and oyster reef elevation (Meyer 1994). Along Mill Creek in North Carolina, crabs were collected monthly from twelve 0.25 m2 x 15 cm deep quadrats, during low tide, from intertidal oyster reefs. With the use of quadrats, researchers were able to effectively assess crab abundance at selected areas throughout the study site, in order to obtain a good representation of these species of crabs within the entire creek (Meyer 1994). Invertebrates Quadrats are used to identify invertebrate species cover and abundance (species density) on oyster reefs (Grizzle and Castagna 1996; Harris and Paynter 2001; Murray et al. 2002). Species abundance is estimated by calculating the mean of two to three samples collected from each study area. To keep track of organisms counted in quadrats, some organisms, if not to small can be marked as they are counted and then recorded on a data sheet. Quadrats can be fixed so that a sample area can be measured repeatedly. Transects are also used to collect field data by recording the number of organisms and species in each sampling unit along the line or by collecting samples of species along a line or within a habitat (Michener et al. 1995; Haws et al. 1995).
6 Megalopae refers to the postlarval stage of a crab (Bliss 1982).
29

PHYSICAL FUNCTIONS
Provide Substrate Attachment
Oyster reefs form when substrates, including both living and dead oysters, accumulate and serve as a base for organisms such as:
• mussels • serupilid worms • bryozoans • hydroids • barnacles • macroalgae and • spat (spawn of oyster) attachment.
Crustose algae and other macroalgae for instance, are found attached to oyster shell substrate especially in shallow shoreline areas (McFarlane 1994). Figure 11 shows clusters of oysters and algae attach to shells. Oyster’s shells also support mussels and barnacles which in turn provide protection and food for:
• juvenile Dungeness crab Cancer magister • shore crabs Hemigrapsus • tube building gammarid amphipods such as:
o Amphithoe and Corophium, o caprellid amphipods, o tanaids, o annelids such as the scaleworm Harmothoe (Dumbauld 2002).
Reefs also support recruitment of oysters which contributes to the increase in size of the reef’s structure. Along Fisherman's Island, Virginia, intertidal reefs were constructed using oyster shell (O’Beirn et al. 1998). Oyster recruitment and settlement occurred on oyster shell reefs at various tidal heights (high-, mid- and low- intertidal) which allowed continuous growth of the reef as well as support various organisms.
30

Figure 11. Oyster shell in field with fouling sponges attached, South Carolina. Photo courtesy of South Carolina Department of Natural Resources, Charleston, SC.
Refuge from Predation
Oyster reefs provide refuge from predation for numerous species such as: • resident predators (e.g., rock crabs, gobies and certain shrimp) • transient predators (e.g., blue crabs and pinfish). Small fishes hide within spaces in the reef to avoid being preyed on by predators that feed on the reef surface (Coen et al. 1999a): • xanthid crabs also hide in reef crevices from other animals, such as oyster toadfish and blue crabs (Meyer 1994), • zooplankton seek refuge in reef crevices from predators such as larval and juvenile naked gobies and, • benthic organisms hide within oyster reef sediments from crustaceans like blue crabs. Some researchers observed the use of oyster reefs as refuge against resident predators, (e.g., rock crabs, gobies and certain shrimp) and transient predators (e.g., blue crabs and pinfish) (Posey
31

et al. 2000). Fauna was sampled to show the consistent use of reef habitats by predatory fish and decapods. Researchers observed a trend regarding lower abundance of specific infaunal groups near oyster reefs. Laboratory experiments supported the probability of off-reef foraging by reef-affiliated predators. Based on results, authors highly recommend that habitats be considered as interrelated components in restoration and management efforts. Shoreline Erosion
Oyster reefs serve as barriers that protect shorelines from erosion by reducing wave energy entering coastal habitats like in marshes. As the waves approach the shoreline, the physical structure of oyster reefs reduces the force of the waves which helps protect the shoreline from erosion (as shown in Figure 12). Once oyster reefs slow wave energy, they are able to stabilize sediments, reduce vegetation loss and conserve other habitat types such as marshes as well as promote faunal use of the habitat without the threat of being swept away by waves (Meyer and Townsend 2000).
Figure 12. Small-scale experiments to assess the impact of boat wakes on newly planted Gulf shell, Inlet Creek experiments in April 2000. Photo courtesy of Loren Cohen, Shellfish Research Section, Marine Resources Research Institute, South Carolina Department of Natural Resources, Charleston, SC.
32

Water Filtration
Oyster reefs improve water quality in estuarine environments by filtering suspended solids and nutrients as well as alter hydrology patterns which further assist particulate removal. Oysters also reduce particulate inorganic material and organic material that are suspended in the water column (Newell 1988). During the filtration process, sediments settle out of the water column and onto the bottom (Meyer and Townsend 2000). If water quality is poor, many benthic invertebrates may become contaminated and die. Fish that feed on contaminated benthic invertebrates, will also become contaminated (Newell 1988). Oyster health should be monitored frequently to ensure that they are functioning efficiently. If oysters are infected by disease or reefs have deteriorated by some other means, they will not be able to filter water readily which in turn reduces water quality.
At the Marine Ecosystem Research Laboratory (MERL) adjacent to Narragansett Bay, researchers evaluated oyster’s effect on sedimentation. Two hundred oysters (about 35 mm in valve length) were placed into three mesocosms7, and three mesocosms without oysters were used as controls. Results showed that oysters induced rates of sedimentation to the benthos. Mesocosms containing oysters showed constant rates of sedimentation that were more than twice those in the control tanks. Overall filter feeding oysters played a significant role in increasing sediment deposition rates (Mugg et. al. 2001). Various researchers have shown that oyster reefs play a significant role in maintaining good water quality, therefore monitoring water quality as part of an ongoing oyster reef restoration project should be conducted to ensure that oysters are functioning efficiently.
Stabilizes Sediments
Oyster reefs promote sediment stabilization by reducing waves and allowing the sediments to settle to the bottom. Some researchers have examined sediment stabilization with the use of oyster cultch to lower intertidal marsh fringes (Meyer et al. 1997). There was significantly higher marsh edge vegetation loss in areas with no oyster cultch8 compared to cultched areas. Also seen were significantly higher sediment erosion rates for non-cultched areas compared to cultched areas. This study showed that by adding intertidal oyster cultch help to stabilize sediment within marshes and preserve marsh vegetation.
Oyster reef also stabilize bottom sediments for benthic organisms such as hard clams and aquatic plants. The oyster filter feeding systems transport sediment materials by removing suspended mater from the water column and depositing the material on the bottom. As a result suffocation and burial of oysters by sediment is minimized. Oyster reefs ability to stabilize sediments therefore is important for the survival of oysters and benthic organisms. When restoring oyster reefs, rate of sediment stabilization should be monitored to ensure sediments are being stabilized readily and reefs are functioning efficiently.
7 Experimental tanks allowing studies to be performed on a smaller scale. 8 Empty oyster shells and other materials that are on the ground and used as a place of attachment
33

CHEMICAL FUNCTIONS Nutrient Cycling
Oysters play a role in nutrient cycling of carbon, phosphorus and nitrogen. They feed by filtering algae from the water and seize nutrients (nitrogen and phosphorus) that algae have taken up. Oysters remove suspended matter from the water column, deposit it on the bottom and then convert particulate matter into dissolved material and biomass. Once matter has been converted to biomass, oysters then release ammonium. Along intertidal oyster reefs in Bly Creek, South Carolina, researchers demonstrated that oysters were able to store nitrogen and phosphorus in estuaries (Dame et al. 1989). Since nutrient levels play an important role in the health of oysters, nitrogen, phosphorus and carbon levels should be measured and monitored before and after reef restoration efforts.
Some researchers have studied the filtering ability and nutritional requirements of the Pacific Oyster, Crassostrea gigas (Righetti 2000), but minimum consideration is given to where these excreted nutrients from oysters may be distributed and eventually settles. In some cases, excreted matter may return to nutrient cycling systems as ammonium (NH4), which is then consumed by phytoplankton and bacteria (Righetti 2000). It was found that C. gigas receiving excess algal food releases a significant amount of ammonium in the Tomales Bay, California. Phytoplankton in the Bay then utilizes this ammonium as a food source. Ammonium released by C. gigas may represent more than 50% of nitrogen consumed by phytoplankton. This shows that filter feeders play a significant role in providing nutrients that support phytoplankton-based food webs (Righetti 2000).
Common Parameters for Monitoring Oyster Reefs – A closed circle ( ) denotes a variable/parameter that, at a minimum, should be considered in monitoring restoration performance. Variables without a closed circle (○) may also be measured depending on specific restoration goals. This matrix is not exhaustive, but represents those elements most commonly used in restoration monitoring of oyster reef communities. These characteristics have been recommended for consideration by experts specializing in the restoration of this habitat.
34
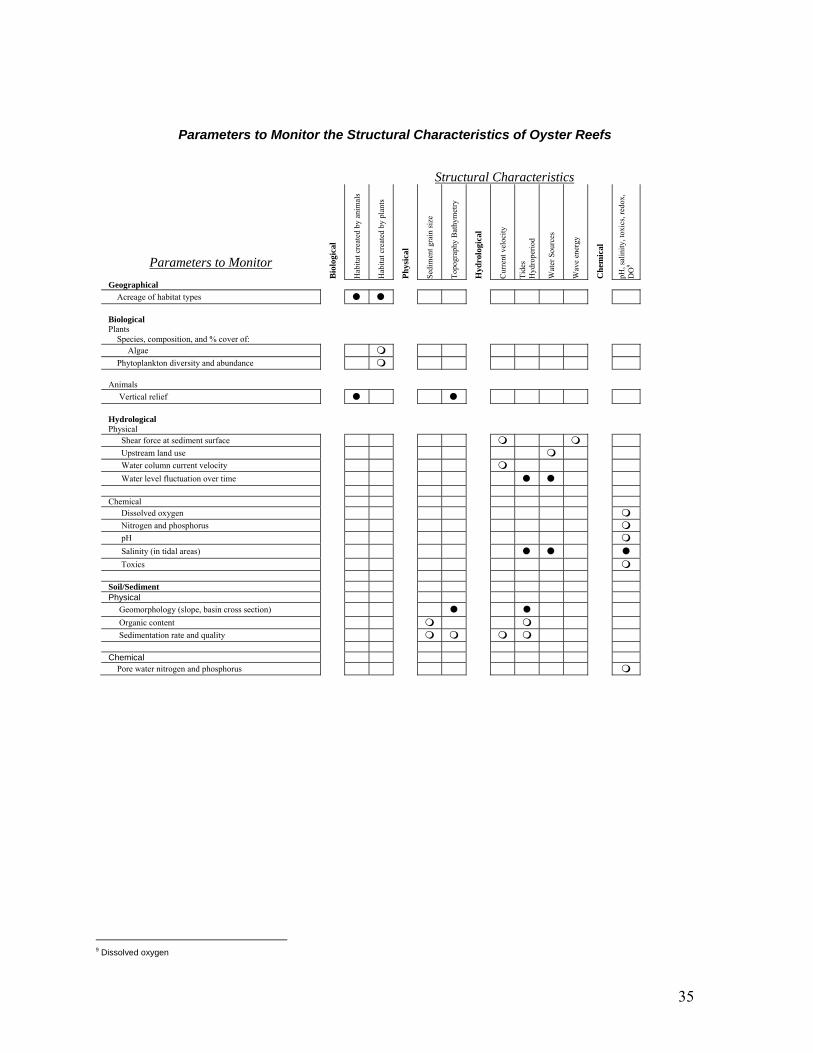
Parameters to Monitor the Structural Characteristics of Oyster Reefs
Structural Characteristics
Parameters to Monitor B
iolo
gica
l
Hab
itat c
reat
ed b
y an
imal
s
Hab
itat c
reat
ed b
y pl
ants
Phys
ical
Sedi
men
t gra
in si
ze
Topo
grap
hy B
athy
met
ry
Hyd
rolo
gica
l
Cur
rent
vel
ocity
Tide
s H
ydro
perio
d
Wat
er S
ourc
es
Wav
e en
ergy
Che
mic
al
pH, s
alin
ity, t
oxic
s, re
dox,
D
O9
Geographical Acreage of habitat types
Biological
Plants
Species, composition, and % cover of:
Algae
Phytoplankton diversity and abundance
Animals
Vertical relief
Hydrological
Physical
Shear force at sediment surface
Upstream land use Water column current velocity
Water level fluctuation over time Chemical Dissolved oxygen Nitrogen and phosphorus pH Salinity (in tidal areas) Toxics Soil/Sediment Physical Geomorphology (slope, basin cross section)
Organic content Sedimentation rate and quality Chemical Pore water nitrogen and phosphorus
9 Dissolved oxygen
35

Parameters to Monitor the Functional Characteristics of Oyster Reefs
Functional Characteristics
Parameters to Monitor B
iolo
gica
l
Prov
ides
bre
edin
g gr
ound
s
Prov
ides
feed
ing
grou
nds
Prov
ides
nur
sery
are
as
Prov
ides
refu
ge fr
om p
reda
tion
Prov
ides
subs
trate
for a
ttach
men
t
Supp
orts
a c
ompl
ex tr
ophi
c st
ruct
ure
Supp
orts
bio
mas
s pro
duct
ion
Supp
orts
bio
dive
rsity
Phys
ical
Alte
rs tu
rbid
ity
Red
uces
ero
sion
pot
entia
l
Red
uces
wav
e en
ergy
Che
mic
al
Mod
ifies
che
mic
al w
ater
qua
lity
Supp
orts
nut
rient
cyc
ling
Geographical Acreage of habitat types Biological Plants Species, composition, and % cover of:
Algae Interspersion of habitat types Phytoplankton diversity and abundance Biological Animals Species, composition, and abundance of: Birds Fish Invasives Invertebrates Vertical relief of reef Physical PAR Secchi disc depth
36

Cont’d Functional Characteristics
Parameters to Monitor B
iolo
gica
l
Prov
ides
bre
edin
g gr
ound
s
Prov
ides
feed
ing
grou
nds
Prov
ides
nur
sery
are
as
Prov
ides
refu
ge fr
om p
reda
tion
Prov
ides
subs
trate
for a
ttach
men
t
Supp
orts
a c
ompl
ex tr
ophi
c st
ruct
ure
Supp
orts
bio
mas
s pro
duct
ion
Supp
orts
bio
dive
rsity
Phys
ical
Alte
rs tu
rbid
ity
Red
uces
ero
sion
pot
entia
l
Red
uces
wav
e en
ergy
Che
mic
al
Mod
ifies
che
mic
al w
ater
qua
lity
Supp
orts
nut
rient
cyc
ling
Trash Upstream land use Water column current velocity Water level fluctuation over time Chemical Dissolved oxygen Nitrogen and phosphorus Toxics Soil/Sediment Physical Basin elevations Geomorphology (slope, basin cross section) Sediment grain size (OM10/sand/silt/clay/gravel/cobble) Sedimentation rate and quality
10 Organic matter
37

References Allen, Y. C., C. A. Wilson, H. Roberts, J. Supan, and B. Pausina. 2003. Ground truthing
hydroacoustic data with commercial oyster dredging. Journal of Shellfish Research 2: 317.
Anderson, M. J., and S. D. Connell. 1999. Predation by fish on intertidal oysters. Marine
Ecology Progress Series 187: 203-211. Bahr, L. M., and W. P. Lanier. 1981. The ecology of intertidal oyster reefs of the south
Atlantic Coast: A Community Profile. Biological Service, Program Fish and Wildlife Service (U.S.)., Fish and Wildlife Service, Office of Biological Service, Washington, DC (USA),105 p.
Bliss, D. E. 1982. Shrimps, lobsters, and crabs: their fascinating life story. New Century
Publishers, Inc., New Jersey. Brietburg, D., and T. Miller. 1998. Are oyster reefs essential fish habitat? Use of oyster reefs
by ecologically and commercially important species. Journal of Shellfish Research 17: (np).
Breitburg, D. L., L. D. Coen, M. W. Luckenbach, R. Mann, M. Posey, and J. A. 2000. Oyster
reef restoration: Convergence of harvest and conservation strategies, Journal of Shellfish Research 19: 371-377.
Cairns, J. 1990. Disturbed ecosystems as opportunities for research in restoration ecology. In
W. R. Jordan, M. E. Gipin, and J. D. Abers (eds.), Restoration Ecology: A Synthetic Approach to Ecological Research. Cambridge: Cambridge University Press.
Chen, T. T., and G. Roesijadi. 1994. Effects of trace metals and organic pollutants on stress-induced proteins in oyster larvae and spat: A molecular approach, 184p. In E. J. Olmi, III, B. Hens, P. Hill, and J. G. Sanders (eds.), 1994 Workshop Report, Chesapeake Bay Environmental Effects Studies: Toxic Research Program.
Cheney, D., R. Elston, B. MacDonald, K. Kinnan, and A. Suhrbier. 2001. The roles of
environmental stressors and culture methods on the summer mortality of the Pacific oyster Crassostrea gigas. Journal of Shellfish Research 20: 1195.
Chesapeake Bay Program. 2002. Aquatic reef restoration. Chesapeake Bay Program, 410 Severn Avenue, Suite 109, Annapolis, MD 21403. Contact information: (800) 968-7229. URL: http://www.chesapeakebay.net/reefrest.htm
Chew, K. K. 2002. Burrowing shrimp versus Pacific northwest oysters. Aquaculture Magazine 28: 71-75.
38

Coen, L. 2003. Metrics for restoring intertidal and subtidal oyster habitats. Pers. Comm., Email, February 3, 2003. Silver Spring, MD.
Coen, L. D., D. M. Knott, E. L. Wenner, N. H. Hadley, and A. H. Ringwood. 1999a.
Intertidal oyster reef studies in South Carolina: Design, sampling and experimental focus for evaluating habitat value and function. In M. W. Luckenbach, R. Mann, and J. A. Wesson (eds.), Oyster Reef Habitat Restoration: A Synopsis and Synthesis of Approaches. Virginia Institute of Marine Science Press, Gloucester Point, Virginia.
Coen, L. D., R. E. Giotta, M. W. Luckenbach, and D. L. Breitburg. 1999. Oyster reef
function, enhancement, and restoration: Habitat development and utilization by commercially- and ecologically-important species. Journal of Shellfish Research 18: 712.
Crockett, J. A., M. W. Luckenbach, and F. X. O'Beirn. 1998. Shorebird usage and predation
on oyster reefs at Fisherman's Island Virginia, U.S.A. Journal of Shellfish Research 17: (np).
Dame, R. F., J. D. Spurrier, and T. G. Wolaver. 1989. Carbon, nitrogen and phosphorous
processing by an oyster reef. Marine Ecology Progress Series 54: 249-256.
Dealteris, J. T. 1988. The application of hydroacoustics to the mapping of subtidal oyster
reefs. Journal of Shellfish Research 7: 41-45. Dekshenieks, M. M., E. E. Hofmann, and E. N. Powell. 1993. Environmental effects on the
growth and development of eastern oyster, Crassostrea virginica (Gmelin, 1791), larvae: A modeling study. Journal of Shellfish Research 12: 241-254.
Dekshenieks, M. M., E. E. Hofmann, J. M. Klinck, and E. N. Powell. 2000. Quantifying the
effects of environmental change on an oyster population: A modeling study. Estuaries 23: 593-610.
Dolbeer, R. A., J. L. Belant, and C. E. Bernhardt. 1997. Aerial photography techniques to
estimate populations of laughing gull nests in Jamaica Bay, New York, 1992-1995. Colonial Waterbirds 20: 8-13.
Dumbauld, B. R. 2002. The role of oyster aquaculture as habitat in (USA) West Coast
estuaries: A review. In T. Droscher (ed.), Proceedings of the 2001 Puget Sound Research Conference. Puget Sound Action Team, PO Box 40900 Olympia WA 98504 USA.
Ellis, M. S., S. Jung; E. N. Powell. 1993. Status and trends analysis of oyster reef habitat in
Galveston Bay, Texas. Journal of Shellfish Research 12: 154.
39

Erwin, R. M., D. K. Dawson, D. B. Stotts, L. S. McAllister, and P. H. Geissler. 1991. Open marsh water management in the Mid-Atlantic Region: Aerial surveys of waterbird use. Wetlands 11: 209-228.
Etherington, L. L., D. B. Eggleston, W. E. Elis, and C. P. Dahlgren. 1996. Patch size and
substrate effects on blue crab recruitment, p. 95. In S. A. Woodin, D. M. Allen, S. E. Stancyk, J. Williams-Howze, R. J. Feller, D. S. Wethey, N. D. Pentcheff, G. T. Chandler, A. W. Decho, and B. C. Coull (eds.), 24th Annual Benthic Ecology Meeting in Columbia, South Carolina, March 7-10.
Finkbeiner, M., B. Stevenson, B. Anderson, M. Yianopolous, L. Coen, G. Martin, and K.
Cullen. 2003. Managing and monitoring intertidal oyster reefs with remote sensing in coastal South Carolina. Journal of Shellfish Research 22: 330.
Gagliano, S. M., and M. Gagliano. 2002. Coastal protection and enhancement through oyster
reef bioengineering. Coastal Environments Inc., Baton Rouge, Louisiana. Contact information: Mark Gagliano, (985) 845-2879, [email protected]. URL: http://bayinfo.tamug.tamu.edu/SOBS/SOBSpapers/Gagliano.html
Gillespie, G. E. 2000. Committee on the Status of Endangered Wildlife in Canada (COSEWIC)
Status Report on Olympia Oyster (Ostrea conchaphila), 27 p. Grizzle, R., and M. Castagna. 2000. Natural intertidal oyster reefs in Florida: Can they teach
us anything about constructed/restored reefs? Journal of Shellfish Research 19: 609. Grizzle, R., and M. Castagna. 1996. Spatial patterns of intertidal oyster reefs in the Canaveral
National Seashore, Florida. Journal of Shellfish Research 15: 526. Harding, J. M., and R. Mann. 1999. Fish species richness in relation to restored oyster reefs,
Piankatank River, Virginia. Bulletin of Marine Science 65: 289-300. Harding, J. M., and R. Mann. 2001. Oyster reefs as fish habitat: Opportunistic use of restored
reefs by transient fishes. Journal of Shellfish Research 20: 951-959. Hargreaves, J. A., and C. S. Tucker. 2002. Measuring dissolved oxygen concentration in
aquaculture. Southern Regional Aquaculture Center (SRAC), SRAC Publication No. 4601. URL: http://aquanic.org/publicat/usda_rac/efs/srac/4601fs.pdf
Harris, C. S., and K. T. Paynter, Jr. 2001. The effect of local population density on growth
and condition in the eastern oyster Crassostrea virginica. Aquaculture 2001: Book of Abstracts, p. 279. World Aquaculture Society, 143 J. M. Parker Coliseum Louisiana State University Baton Rouge LA 70803 USA.
Haws, M. C., B. E. Ponia, D. P. Cheney, and H. W. Thomforde. 1995. Ecological
Characterization and Environmental Monitoring in Conjunction with Pearl Farming of the Tongareva Lagoon, Cook Islands. Aquaculture 95 Book of Abstracts.
40

Kilar, J. A., and J. McLachlan. 1986a. Ecological Studies of the Alga, Acanthophora spicifera (Vahl) Borg. (Ceramiales: Rhodophyta): Vegetative fragmentation. Journal of Experimental Marine Biology and Ecology 104: 1-21.
Lee, C. K. 1979. Seasonal and spatial study of oyster spat in Mobile Bay and East Mississippi Sound, 97p. In C. Serruya (ed.), Mississippi-Alabama Sea Grant Consortium; Ocean Springs, MS (USA).
Lenihan, S., and C. G. Peterson. 1997. Effects of oyster harvesting on the habitat value of restored oyster reefs: An experimental analysis. Journal of Shellfish Research 16: 270.
Lenihan, S., and C. G. Peterson. 1998. How habitat degradation through fishery disturbance enhances impacts of hypoxia on oyster reefs. Ecological Applications 8: 128-140.
Lenihan, S., and G. W. Thayer. 1999. Ecological effects of fishery disturbance to oyster reef habitat in eastern North America. Journal of Shellfish Research 2: 719.
Leonard, K. III., M. Gomez-Chiarri, and A. Ganz. 1999. Detecting the presence of Perkinsus marinus in the Eastern oyster, Crassostrea virginica, in Rhode Island waters. Journal of Shellfish Research 18: 331p.
Lorio, W. J., and S. Malone. 1994. The cultivation of the American Oyster (Crassostrea virginica). Southern Regional Aquaculture Center, SRAC Publication No. 432. URL: http://wildlife.tamu.edu/publications/432fs.pdf
Mann, R., J. Rainer, and R. Morales-Alamo. 1994. Reproductive activity of oysters, Crassostrea virginica (Gmelin, 1791) in the James River Virginia, during 1987-88. Journal of Shellfish Research 13: 157-164.
Marcus, J. M. 1989. The impacts of selected land-use activities on the American oyster, Crassostrea virginica (Gmelin). University of South Carolina, School of Public Health, Department of Epidemiology and Biostatistics. Dissertation Abstracts International PT. B., Science and Engineering 50: 346 p.
McFarlane, R. W. 1994. Oyster Reef, p. 30. In F. S. Shipley, and R.W. Kiesling (eds.),
Galveston Bay National Estuary Program: A Conceptual Model of Galveston Bay. Galveston Bay National Estuary Program Publication GBNEP-44. URL: http://www.rice.edu/armadillo/Galveston/Chap3/oyster.html
Meyer, D. L., and E. C. Townsend. 2000. Faunal utilization of created intertidal eastern oyster (Crassostrea virginica) reefs in the southeastern United States. Estuaries 23: 34-45.
Meyer, D. L., G. W. Thayer, P. L. Murphey, J. Gill, C. Doley, and L. Crockett. 1997. The function of created intertidal oyster reefs as habitat for fauna and marsh stabilization,
41

and the potential use of geotextile in oyster reef construction. Journal of Shellfish Research 16: 272.
Meyer, D. L. 1994. Habitat partitioning between the xanthid crabs Panopeus herbstii and Eurypanopeus depressus on intertidal oyster reefs in southeastern North Carolina. Estuaries 17: 674-679.
Michener, W. K., J. W. Brunt, and W. H. Jefferson. 1995. New techniques for monitoring
American oyster (Crassostrea virginica) recruitment in the intertidal zone, p. 267-273. In D. E. Aiken, S. L. Waddy, and G. Y. Conan (eds.), Shellfish Life Histories and Shellfishery Models. Selected Papers from a Symposium in Moncton, New Brunswick., ICES, Copenhagen (Denmark), ICES Marine Science Symposia 199.
Molluscan Ecology Program. 2002. Monitoring and Restoration of Oyster Reefs. Virginia
Institute of Marine Science. Virginia Institute of Marine Science, P.O. Box 1346, Gloucester Point, Virginia U.S.A. 23062-1346. Contact information: Dr. Roger Mann, Department of Fisheries Science, [email protected]. URL: http://www.vims.edu/mollusc/monrestoration/monoyster.htm
Moore, J. M. 2001. Procedural guideline 1-2: Fixed viewpoint photography. In J. Davies, J. Baxter, M. Bradley, D. Connor, J. Khan, E. Murray, W. Sanderson, C. Turnbull, and M. Vincent (eds.), Marine Monitoring Handbook. UK Marine Science Project, and Scottish Association of Marine Science. Joint Nature Conservation Committee, English Nature, Scottish Natural Heritage, Environment and Heritage Services. URL: http://www.jncc.gov.uk/marine/mmh/Introduction.pdf.
Morrison, R. I. G., and R. K. Ross.1989. Atlas of nearctic shorebirds on the coast of South America. Canadian Wildlife Service Spec. 1 and 2 Publication, Ottawa.
Mugg, J., M. A. Rice, and M. Perron. 2001. Effects of filter-feeding oysters on sedimentation
rates and phytoplankton species composition: preliminary results of mesocosm experiments. Journal of Shellfish Research. 20: 525.
Murray, S. N., R. F. Ambrose, and M. N. Dethier. 2002. Methods for Performing Monitoring,
Impact and Ecological Studies on Rocky Shores. U.S. Department of the Interior, Minerals Management Service, Pacific OCS Region.
National Academies Press. 2004. Oyster Biology. In Non-native Oysters in the Chesapeake
Bay. National Academy of Sciences, p. 60-99.
Newell, R. I. E. 1988. Ecological changes in the Chesapeake Bay: Are they the results of over- harvesting the American oyster Crassostrea virginica?, p. 536-546. In M. P. Lynch, and E. C. Krome (eds.), Understanding the Estuary: Advances in Chesapeake Bay Research. CRC Publication 129 CBT/TRS 24/88, Gloucester Point, Virginia.
42

Numaguchi, K., and Y. Tanaka. 1986. Effects of salinity on mortality and growth of the spat of the pearl oyster, Pinctada fucata martensii. Bulletin of National Research Institute of Aquaculture, 9: 41-44. Japan/Yoshokukenho.
Nuttle, W. K. 1997. Measurement of wetland hydroperiod using harmonic analysis. Wetlands 17: 82-89.
O'Beirn, F. X., M. W. Luckenbach, and J. Nestlerode. 1998. Oyster recruitment as a function of substrate type and tidal elevation. Journal of Shellfish Research 17: (np).
O'Beirn, F. X., M. W. Luckenbach, J. A. Nestlerode, and G. M. Coates. 2000. Toward design criteria in constructed oyster reefs: Oyster recruitment as a function of substrate type and tidal height. Journal of Shellfish Research 19: 387-395.
Parsons, T. R., Y. Maita, and C. Lalli. 1984. A manual of chemical and biological methods
for seawater analysis. Pergamon Press, London. Peterson, C. H., J. H. Grabowski, S. P. Powers. 2003. Estimated enhancement of fish
production resulting from restoring oyster reef habitat: quantitative valuation. Marine Ecology Progress Series 264: 249-264.
Posey, M. H., T. D. Alphin, C. M. Powell, and J. M. Rhoads. 2000. Use of oyster reefs by mobile fauna: Consequences for adjacent sandflat habitats. Journal of Shellfish Research 19: 611.
Powell, E. 1994. Oysters Revisited: Monitoring Mollusc Health in Galveston Bay. Quaterdeck vol. 2, no. 1. Department of Oceanography, College of Geosciences, Texas A&M University 3146 TAMU, College Station, TX 77843-3146. Contact information: [email protected]: http://www-ocean.tamu.edu/Quarterdeck/QD2.1/Powell/powell.html
Righetti, L. 2000. Nitrogen excretion by the Pacific Oyster, Crassostrea gigas; a contributor
to estuarine nutrient cycling in Tomales Bay, CA. Journal of Shellfish Research 19: 611.
Rikard, F. S., R. K. Wallace, D. Rouse, and I. Saoud. 2000. The effect of low oxygen on oyster survival during reef restoration efforts in Bon Secour Bay, Alabama. Journal of Shellfish Research 1: 640.
Rodriguez, S. H. 1986. Coliform bacteria in the manipulation of oysters (Crassostrea virginica ) in Tabasco, Mexico. Anales del Instituto de Ciencias del Mar y Limnologia, Universidad Nacional Autonoma de Mexico, Mexico City 13: 445-448
Rogers, C. S., G. Garrison, R. Grober, A-M, Hillis, and M-A. Franke. 2001. Coral Reef Monitoring manual for the Caribbean and Western Atlantic. National Park Sevice, Virgin Islands National Park, St. John, USVI 00831.
43

Rose, C. D. 1973. Mortality of market-sized oysters (Crassostrea virginica) in the vicinity of
a dredging operation. Chesapeake Science 14: 135-138.
Ruzecki, E. J., and W. J. Hargis, Jr. 1989. Interaction between circulation of the estuary of the James River and transport of oyster larvae, p. 255-279. In B. J. Neilson, A. Kuo, and J. Brubaker (eds.), Estuarine Circulation Publications.
Samoilys, M. A., and G. Carlos. 2000. Determining methods of underwater visual census for estimating the abundance of coral reef fishes. Environmental Biology of Fishes 57: 289-304.
Scott, G. I., M. H. Fulton, E. D. Strozier, P. B. Key, J. W. Daugomah, D. Porter, and S. Strozier. 1996. The effects of urbanization on the American oyster, Crassostrea virginica (Gmelin). Journal of Shellfish Research 15: 523-524.
Shipley, F. S., and R. W. Kiesling (eds.). 1994. The State of the Bay. A Characterization of the Galveston Bay Ecosystem, 232p. Galveston Bay National Estuary Program.
Simons, J. D., E. N. Powell, J. Song, and T. M. Soniat. 1992. An improved method for mapping oyster bottom using a global positioning system and an acoustic profiler. Aquaculture 92: Growing Toward the 21st Century, p. 207.
Smith, G. F., D. G. Bruce, and E. B Roach. 2001. Remote acoustic habitat assessment techniques used to characterize the quality and extent of oyster bottom in the Chesapeake Bay. Marine Geodesy 24: 171-189.
South Carolina Oyster Reef Enhancement (SCORE). 2004 updated. Oyster Biology and Ecology. South Carolina Department of Natural Resources (SCDNR) Marine Resources, 217 Fort Johnson Road, Charleston, SC 29412. Contact information: Nancy Hadley, [email protected], (843) 953-9841; Loren Coen, [email protected], (843) 953-9152. URL: http://www3.csc.noaa.gov/scoysters/html/bio.htm
Steel, E. A., and S. Neuhausser. 2002. Comparison of methods for measuring visual water clarity. Journal of the North American Benthological Society 21: 326-335.
Visel, T. C., R. E. Goursey, and P. J. Auster. 1989. Reduced oyster recruitment in a river
with restricted tidal flushing. Journal of Shellfish Research 8: 459. Volety, A., M. Savarese, G. Tolley, A. Ning Loh, and M. J. Byrne. 2002. Characterization of
community assemblages in oyster-reef habitats of the Estero Estuary: Monitoring the ecological impact of watershed management. Joint effort by Florida Gulf Coast University, College of Arts & Sciences 10501 FGCU Blvd and, South, Ft. Myers, FL, 33965 and United States Geological Survey, 3745 Broadway, Suite 301, Fort Myers,
44

FL 33901. URL: http://www.charlotteharbornep.org/agendas-2003/Policy/5-28-03/6-FGCU's%20EPA%20Grant-%20Oyster%20Proposal.pdf.
Wenner, E., H. R. Beatty, and L. Coen. 1996. A method for quantitatively sampling nekton on intertidal oyster reefs. Journal of Shellfish Research 15: 769-775.
Wilson, C. A., H. H. Roberts, J. Supan, and W. Winans. 1999. The acquisition and interpretation of digital acoustics for characterizing Louisiana's shallow water oyster habitat. Journal of Shellfish Research 18: 730-731.
Zoun, R. J. 2003. Estimation of fecal coliform loadings to Galveston Bay. Thesis, Master of Science in Engineering, the University of Texas at Austin. URL: http://www.crwr.utexas.edu/reports/pdf/2003/rtp03-05.pdf
45

ANNOTATED BIBLIOGRAPHY
OYSTER REEFS Bartol I. K., and R. Mann. 1995. Small scale patterns of recruitment on a constructed
intertidal reef: the role of spatial refugia, p. 159-170. In M. W. Luckenbach, R. Mann and J. Wesson (eds.), Oyster Reef Habitat Restoration: A synopsis and synthesis of approaches. Williamsburg, Virginia: Virginia Institute of Marine Science, College of William and Mary: VIMS Press.
Researchers constructed a three-dimensional oyster reef using oyster shell in the Piankatank River, Virginia, and evaluated settlement and mortality patterns of oysters from June 1993 to September 1994. The reef extended from 2.5 m below mean low water (MLW) to 0.75 m above MLW and covered 150 x 30 m. In 1993 twelve intertidal hummocks were sampled along upstream and downstream transects using transects on two mounds (one sheltered from wave currents and one exposed to wave currents) during each period of sampling. On the reefs transects were marked to prevent re-sampling. In 1994, eight hummocks were partitioned into 64 x 20 cm plots using rope and reinforced bars, and experimental sites. Three tidal heights were considered, 25 cm above MLW, MLW and 90 cm below MLW. Sampling was then conducted at each of these levels. In intertidal and subtidal locations, settlement and mortality occurrences were monitored at the reef surface and within the reef depths interstices of 10cm. In subtidal locations settlement was greater and showed no difference in settlement intensity between surface and subsurface environments. Along the intertidal-subtidal continuum survival rates for most of the year were highest at MLW. At this location, physical and predatory influences were minimal. The results indicate that both reef tidal elevation and substrate thickness provide microscale refugia for settlement and survival of early oyster life history stages. Breitburg, D. L., L. D. Coen, M. W. Luckenbach, R. Mann, M. Posey, and J. A. Wesson.
2000. Oyster reef restoration: Convergence of harvest and conservation strategies. Journal of Shellfish Research 19: 371-377.
This paper focuses on oyster reef restoration, protection, and construction to meet harvest, water quality, and fish habitat goals in order to view an overall image of why oyster reef monitoring, restoration and management is important ecologically and economically. The restoration actions that are considered useful and described in this document are constructing reefs at different depths and using different base materials; constructing reefs with varying spatial dispersion patterns; positioning constructed reefs in varying proximity to other landscape elements; constructing reefs in areas with different tidal ranges and water quality and harvesting status; and constructing reefs with varying shapes and vertical structure. Good monitoring and restoration efforts are important to ensure that future restoration efforts are improved, and can enhance the basic information needed to recognize the ecology of oysters and their role in estuarine and coastal systems. Additional information on techniques used to monitor and restore oyster reefs are described in this document.
46
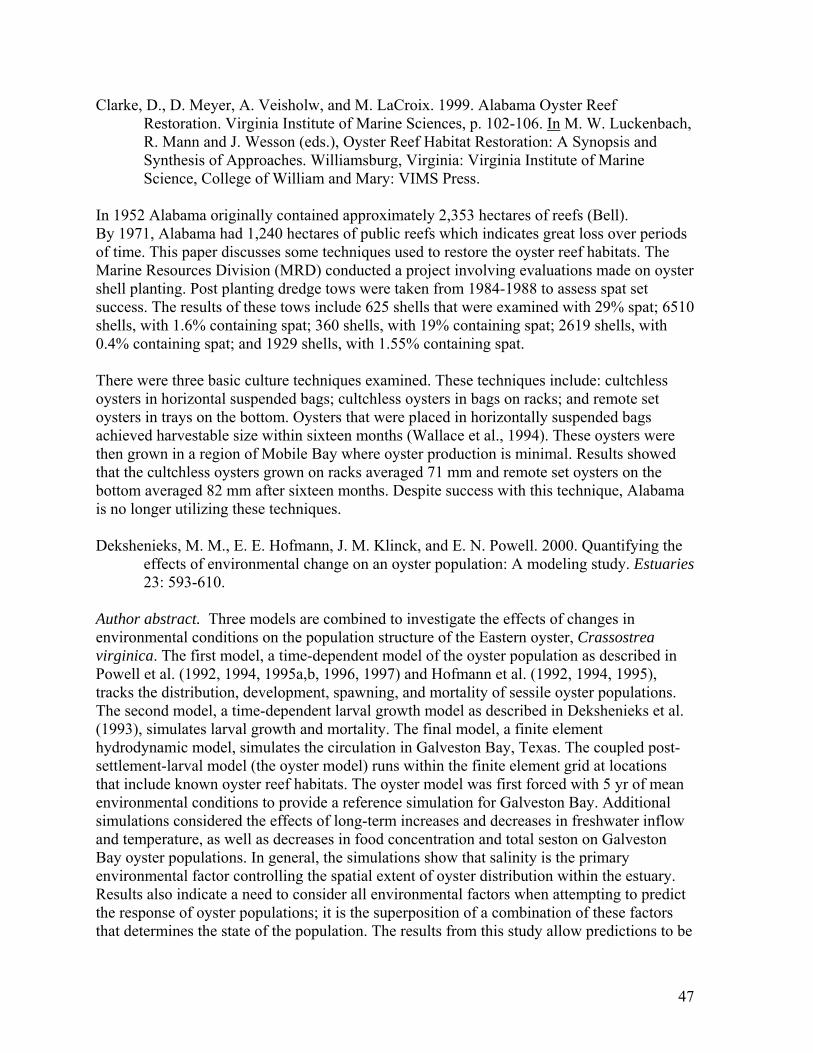
Clarke, D., D. Meyer, A. Veisholw, and M. LaCroix. 1999. Alabama Oyster Reef Restoration. Virginia Institute of Marine Sciences, p. 102-106. In M. W. Luckenbach, R. Mann and J. Wesson (eds.), Oyster Reef Habitat Restoration: A Synopsis and Synthesis of Approaches. Williamsburg, Virginia: Virginia Institute of Marine Science, College of William and Mary: VIMS Press.
In 1952 Alabama originally contained approximately 2,353 hectares of reefs (Bell). By 1971, Alabama had 1,240 hectares of public reefs which indicates great loss over periods of time. This paper discusses some techniques used to restore the oyster reef habitats. The Marine Resources Division (MRD) conducted a project involving evaluations made on oyster shell planting. Post planting dredge tows were taken from 1984-1988 to assess spat set success. The results of these tows include 625 shells that were examined with 29% spat; 6510 shells, with 1.6% containing spat; 360 shells, with 19% containing spat; 2619 shells, with 0.4% containing spat; and 1929 shells, with 1.55% containing spat. There were three basic culture techniques examined. These techniques include: cultchless oysters in horizontal suspended bags; cultchless oysters in bags on racks; and remote set oysters in trays on the bottom. Oysters that were placed in horizontally suspended bags achieved harvestable size within sixteen months (Wallace et al., 1994). These oysters were then grown in a region of Mobile Bay where oyster production is minimal. Results showed that the cultchless oysters grown on racks averaged 71 mm and remote set oysters on the bottom averaged 82 mm after sixteen months. Despite success with this technique, Alabama is no longer utilizing these techniques. Dekshenieks, M. M., E. E. Hofmann, J. M. Klinck, and E. N. Powell. 2000. Quantifying the
effects of environmental change on an oyster population: A modeling study. Estuaries 23: 593-610.
Author abstract. Three models are combined to investigate the effects of changes in environmental conditions on the population structure of the Eastern oyster, Crassostrea virginica. The first model, a time-dependent model of the oyster population as described in Powell et al. (1992, 1994, 1995a,b, 1996, 1997) and Hofmann et al. (1992, 1994, 1995), tracks the distribution, development, spawning, and mortality of sessile oyster populations. The second model, a time-dependent larval growth model as described in Dekshenieks et al. (1993), simulates larval growth and mortality. The final model, a finite element hydrodynamic model, simulates the circulation in Galveston Bay, Texas. The coupled post-settlement-larval model (the oyster model) runs within the finite element grid at locations that include known oyster reef habitats. The oyster model was first forced with 5 yr of mean environmental conditions to provide a reference simulation for Galveston Bay. Additional simulations considered the effects of long-term increases and decreases in freshwater inflow and temperature, as well as decreases in food concentration and total seston on Galveston Bay oyster populations. In general, the simulations show that salinity is the primary environmental factor controlling the spatial extent of oyster distribution within the estuary. Results also indicate a need to consider all environmental factors when attempting to predict the response of oyster populations; it is the superposition of a combination of these factors that determines the state of the population. The results from this study allow predictions to be
47

made concerning the effects of environmental change on the status of oyster populations, both within Galveston Bay and within other estuarine systems supporting oyster populations. Harding, J. M., and R. Mann. 2001. Oyster reefs as fish habitat: Opportunistic use of restored
reefs by transient fishes. Journal of Shellfish Research 20: 951-959. Author abstract. Under the Magnuson-Stevenson Fisheries Management Act of 1996, current fisheries management practice is focused on the concept of Essential Fish Habitat (EFH). Application of the EFH concept to estuarine habitats relates directly to ongoing oyster reef restoration efforts. Oyster reef restoration typically creates complex habitat in regions where such habitat is limited or absent. While healthy oyster reefs provide structurally and ecologically complex habitat for many other species from all trophic levels including recreationally and commercially valuable transient finfishes, additional data is required to evaluate oyster reef habitats in the context of essential fish habitat. Patterns of transient fish species richness, abundance, and size-specific habitat use were examined along an estuarine habitat gradient from complex reef habitat through simple sand bottom in the Piankatank River, Virginia. There was no clear delineation of habitat use by transient fishes along this cline of estuarine habitat types (oyster reef to sand bar). Atlantic croaker (Micropogonias undulatus), Atlantic menhaden (Brevoortia tyrannus), bluefish (Pomatomus saltatrix), silver perch (Bairdiella chrysoura), spot (Leiostomus xanthurus), spotted seatrout (Cynoscion regalis), striped bass (Morone saxatilis), and weakfish (Cynoscion nebulosus) were found in all habitat types examined. In general, the smallest fish were found on the sand bar, the site with the least habitat heterogeneity. As habitat complexity increased along the gradient from oyster shell bar through oyster reef, transient fish size and abundance increased. Opportunistic habitat use by this suite of generalists relates variations in habitat quality as related to habitat-specific productivity and suggested that oyster reefs may be important but not essential habitat for these fishes. Lenihan, H. S., C. H. Peterson, J. E. Byers, J. H. Grabowski, G. W. Thayer, and D. R. Colby.
2001. Cascading of habitat degradation: Oyster reefs invaded by refugee fishes escaping stress. Ecological Applications 11: 764-782.
Author abstract. In this study researchers evaluated the structural complex, species-rich biogenic reefs created by the eastern oyster, Crassostrea virginica, in the Neuse River estuary, North Carolina, USA. Researchers first sampled fishes and invertebrates on natural and restored reefs and on sand bottom to compare fish utilization of these different habitats and to characterize the trophic relations among large reef-associated fishes and benthic invertebrates, and secondly, tested whether bottom-water hypoxia and fishery-caused degradation of reef habitat combine to induce mass emigration of fish that then modify community composition in refuges across an estuarine seascape. Experimentally restored oyster reefs of 1 m tall "degraded" or 2 m tall "natural" reefs were constructed at 3 and 6 m depths. Samples were taken of the hydrographic conditions within the estuary over the summer to monitor onset and duration of bottom-water hypoxia/anoxia, resulting from density stratification and anthropogenic eutrophication Reduction of reef height caused by oyster dredging exposed the reefs located in deep water to hypoxia/anoxia for >2 wk, killing reef-associated invertebrate prey and forcing mobile fishes into refuge habitats. Refugee
48

fishes gathered at high densities on reefs in oxygenated shallow water, where they depleted epibenthic crustacean prey populations. However, physical disturbances can impact remote, undisturbed refuge habitats by movement and abnormal concentration of refugee organisms that have strong trophic impacts. The results show that reserves placed in proximity to disturbed areas may be impacted indirectly but may serve as an important refuge function on a scale comparable to the mobility of consumers. Meyer, D. L. 1994. Habitat partitioning between the xanthid crabs Panopeus herbstii and
Eurypanopeus depressus on intertidal oyster reefs in southeastern North Carolina. Estuaries 17: 674-679.
Author abstract. The abundances of the xanthid crabs Panopeus herbstii and Eurypanopeus depressus were examined relative to surface oyster shell cover, surface oyster cluster volume, subsurface shell content, substrate sand and silt composition, and oyster reef elevation. During August 1986 through July 1987, xanthid crabs were collected monthly from twelve 0.25 m super(2) x 15 cm deep quadrats, during low tide, from intertidal oyster reefs in Mill Creek, Pender County, North Carolina, USA, with respective quadrat details recorded. The abundance of P. herbstii, and to a lesser degree of E. depressus, was positively correlated with surface shell cover. The abundance of E. depressus, and to a lesser degree P. herbstii, was positively correlated with surface cluster volume. The majority of P. herbstii inhabited the subsurface stratum of the oyster reef, whereas the majority of E. depressus inhabited the cluster stratum. Seasonality (i.e., temperature) appeared to influence the strata habitation of both species, with a higher incidence of cluster habitation during warmer months and a lower incidence during colder months. Crab abundance was not related to other factors examined, such as subsurface shell, substrate sand and silt composition, or elevation within the oyster reef. The analyses show that P. herbstii and E. depressus have partitioned the intertidal oyster reef habitat, with E. depressus exploiting surface shell clusters and P. herbstii the subsurface stratum. Refer to publication for additional information on methods used.
Meyer, D. L., and E. C. Townsend. 2000. Faunal utilization of created intertidal eastern
oyster (Crassostrea virginica) reefs in the southeastern United States. Estuaries 23: 34-45.
Author abstract. Oyster cultch was added to the lower intertidal marsh-sandflat fringe of three previously created Spartina alterniflora salt marshes. Colonization of these created reefs by oysters and other select taxa were then examined. The created reefs supported numerous oyster reef-associated faunas at equivalent or greater densities than adjacent natural reefs. Eastern oyster (Crassostrea virginica) settlement at one site of created reef exceeded that of the adjacent natural reefs within 9 months of reef creation. Within 2 years, harvestable-size C. virginica (>75 mm) were present in the created reefs along with large numbers of C. virginica clusters. The created reefs also had a higher number of molluscan, fish, and decapod species than the adjacent natural reefs. After 2 yr the densities of C. virginica, striped barnacle (Balanus amphitrite), scorched mussel (Brachidontes exustus), Atlantic ribbed mussel (Geukensia demissa), common mud crab (Panopeus herbstii), and flat mud crab (Eurypanopeus depressus) within the created reefs was equivalent to adjacent natural reefs. Data collected indicate that created oyster reefs can readily acquire functional
49

ecological attributes of their natural counterparts. Based on the results, reef function and physical and ecological linkages of oyster reefs to other habitats (marsh, submerged aquatic vegetation, and bare bottom) should be taken into consideration when reefs are created in order to provide resources that are able to maintain estuarine systems. Michener, W. K., J. W. Brunt, and W. H. Jefferson. 1995. New techniques for monitoring
American oyster (Crassostrea virginica) recruitment in the intertidal zone, p. 267-273. In D. E. Aiken, S. L. Waddy, and G. L. Conan, (eds.), Shellfish Life Histories and Shellfishery Models. Selected Papers from a Symposium Held in Moncton, New Brunswick, 25-29 June 1990., ICES, Copenhagen (Denmark). ICES Marine Science Symposia 199. ICES, Copenhagen, Denmark.
Author abstract. Changes in oyster reef size, organism density, and community organization can occur randomly or in relation to controlling biotic and abiotic factors. Non-random spatial discontinuities may be interpreted as ecologically important edges and could provide important insights into habitat quality, settlement, recruitment, competition, predation, and other ecological processes. In this study, vertical settlement tubes were deployed along an estuarine transect to document variable invertebrate recruitment to intertidal oyster reef communities. A Squared Euclidean Distance algorithm with a moving window filter was utilized to identify discontinuities in community recruitment. The sampling and analytical approaches provided useful insights into recruitment patterns which could be related to intra-estuarine physical and chemical variability. These and related techniques can likely be used to address regional and estuary-wide shellfisheries-related problems. O'Beirn, F. X., M. W. Luckenbach, J. A. Nestlerode, and G. M. Coates. 2000. Toward design
criteria in constructed oyster reefs: Oyster recruitment as a function of substrate type and tidal height. Journal of Shellfish Research 19: 387-395.
Author abstract. Restoration of degraded oyster reef habitat generally begins with the addition of substrate that serves as a reef base and site for oyster spat attachment. Remarkably, little is known about how substrate type and reef morphology affect the development of oyster populations on restored reefs. A three-dimensional, intertidal reefs were constructed near Fisherman's Island, Virginia: two reefs in 1995 using surf clam (Spisula solidissima) shell and six reefs in 1996 using surf clam shell, oyster shell, and stabilized coal ash. Researchers monitored oyster recruitment and growth quarterly at three tidal heights (intertidal, mean low water, and subtidal) on each reef type since their construction. Oyster recruitment in 1995 exceeded that observed in the two subsequent years. High initial densities on the 1995 reefs decreased and stabilized at a mean of 418 oyster/m2. Oyster settlement occurred on all reef types and tidal heights in 1996; however, post-settlement mortality on the surf clam shell and coal ash reefs exceeded that on the oyster shell reefs, which remained relatively constant throughout the year (mean = 935 oysters/m2). Based on the field observations, predation accounts for most of the observed mortality and that the clam shell and coal ash reefs suffer greater predation. Oyster abundance was consistently higher in the intertidal zone on all reefs for each year studied. Based on patterns observed, researchers concluded that the provision of spatial refugia (both intertidal and interstitial) from predation is important for successful oyster reef restoration in this region.
50
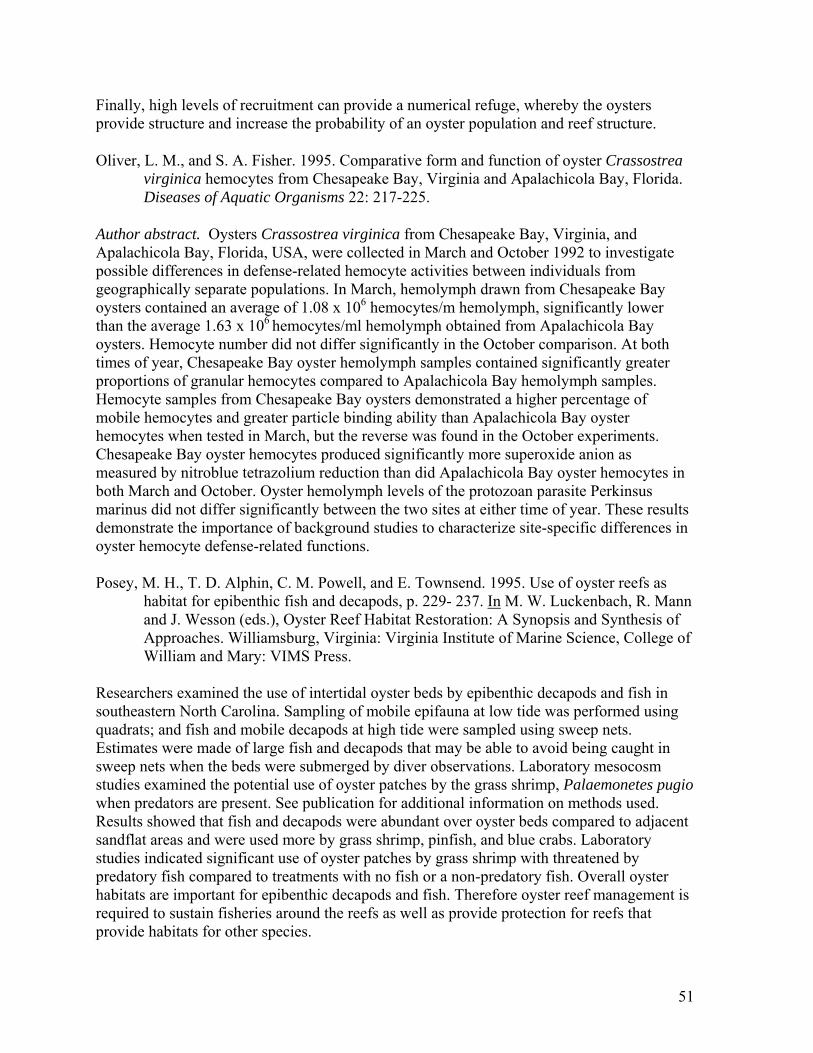
Finally, high levels of recruitment can provide a numerical refuge, whereby the oysters provide structure and increase the probability of an oyster population and reef structure.
Oliver, L. M., and S. A. Fisher. 1995. Comparative form and function of oyster Crassostrea virginica hemocytes from Chesapeake Bay, Virginia and Apalachicola Bay, Florida. Diseases of Aquatic Organisms 22: 217-225.
Author abstract. Oysters Crassostrea virginica from Chesapeake Bay, Virginia, and Apalachicola Bay, Florida, USA, were collected in March and October 1992 to investigate possible differences in defense-related hemocyte activities between individuals from geographically separate populations. In March, hemolymph drawn from Chesapeake Bay oysters contained an average of 1.08 x 10⁶ hemocytes/m hemolymph, significantly lower than the average 1.63 x 10⁶ hemocytes/ml hemolymph obtained from Apalachicola Bay oysters. Hemocyte number did not differ significantly in the October comparison. At both times of year, Chesapeake Bay oyster hemolymph samples contained significantly greater proportions of granular hemocytes compared to Apalachicola Bay hemolymph samples. Hemocyte samples from Chesapeake Bay oysters demonstrated a higher percentage of mobile hemocytes and greater particle binding ability than Apalachicola Bay oyster hemocytes when tested in March, but the reverse was found in the October experiments. Chesapeake Bay oyster hemocytes produced significantly more superoxide anion as measured by nitroblue tetrazolium reduction than did Apalachicola Bay oyster hemocytes in both March and October. Oyster hemolymph levels of the protozoan parasite Perkinsus marinus did not differ significantly between the two sites at either time of year. These results demonstrate the importance of background studies to characterize site-specific differences in oyster hemocyte defense-related functions. Posey, M. H., T. D. Alphin, C. M. Powell, and E. Townsend. 1995. Use of oyster reefs as
habitat for epibenthic fish and decapods, p. 229- 237. In M. W. Luckenbach, R. Mann and J. Wesson (eds.), Oyster Reef Habitat Restoration: A Synopsis and Synthesis of Approaches. Williamsburg, Virginia: Virginia Institute of Marine Science, College of William and Mary: VIMS Press.
Researchers examined the use of intertidal oyster beds by epibenthic decapods and fish in southeastern North Carolina. Sampling of mobile epifauna at low tide was performed using quadrats; and fish and mobile decapods at high tide were sampled using sweep nets. Estimates were made of large fish and decapods that may be able to avoid being caught in sweep nets when the beds were submerged by diver observations. Laboratory mesocosm studies examined the potential use of oyster patches by the grass shrimp, Palaemonetes pugio when predators are present. See publication for additional information on methods used. Results showed that fish and decapods were abundant over oyster beds compared to adjacent sandflat areas and were used more by grass shrimp, pinfish, and blue crabs. Laboratory studies indicated significant use of oyster patches by grass shrimp with threatened by predatory fish compared to treatments with no fish or a non-predatory fish. Overall oyster habitats are important for epibenthic decapods and fish. Therefore oyster reef management is required to sustain fisheries around the reefs as well as provide protection for reefs that provide habitats for other species.
51

Saoud, I. G., D. B. Rouse, R. K. Wallace, J. E. Supan, and S. Rikard. 2000. An in situ study
on the survival and growth of Crassostrea virginica juveniles in Bon Secour Bay, Alabama. Journal of Shellfish Research 19: 809-814.
Author abstract. For this study experimental plots were established at a relic oyster reef on the eastern side of Mobile Bay, Alabama between July 1998 and November 1999 to determine whether elevated beds might improve oyster survival and growth. Oysters (Crassostrea virginica) were spawned in a hatchery and the spat were allowed to settle on small oyster shell fragments and on whole oyster shell. Two-month-old juveniles (15-18 mm) were deployed in polyethylene oyster bags on bottom and on underwater shell pads 20 cm and 40 cm above bottom. Oysters on whole shells were deployed outside bags in order to evaluate predation. Remote sensing data loggers were used to measure temperature, salinity, and oxygen concentration. Growth (increase in height), survival, and condition of oysters in bags at the three experimental depths were compared. Temperature and salinity varied between 11.8º C - 32.8º C and 4.4 ppt - 29.7 ppt, respectively. The results showed that oysters at the three experimental levels grew to approximately 55 mm during the first year. Total mortality was observed at all three levels during the second summer when oxygen levels dropped to 0 mg L -1 for five consecutive days while water temperature was 28º C. See publication for more information on techniques used. Soniat, T. M., E. N. Powell, E. E. Hofmann, and J .M. Klinck. 1998. Understanding the
success and failure of oyster populations: The importance of sampled variables and sample timing. Journal of Shellfish Research 17: 1149-1165.
Author abstract. One of the primary obstacles to understanding why some oyster populations are successful and others are not is the complex interaction of environmental variables with oyster physiology and with such population variables as the rates of recruitment and juvenile mortality. A numerical model is useful in investigating how population structure originates out of this complexity. We have monitored a suite of environmental conditions over an environmental gradient to document the importance of short time-scale variations in such variables as food supply, turbidity, and salinity. Then, using a coupled oyster disease population dynamics model, we examine the need for short time-scale monitoring. We evaluate the usefulness of several measures of food supply by comparing field observations and model simulations. Finally, we evaluate the ability of a model to reproduce field observations that derive from a complex interplay of environmental variables and address the problem of the time-history of populations. Our results stress the need to evaluate the complex interactions of environmental variables with a numerical model and, conversely, the need to evaluate the success of modeling against field observations of the results of complex processes. Model simulations of oyster populations only approached field observations when the environmental variables were measured weekly, rather than monthly. Oyster food supply was estimated from measures of total particulate organic matter, phytoplankton biomass estimated from chlorophyll a, and total labile organic matter estimated from a regression between chlorophyll a and total labile carbohydrate, lipid, and protein. Only the third measure provided simulations comparable to field observations. Model simulations also only approached field observations when a multiyear time series was used. The simulations show
52
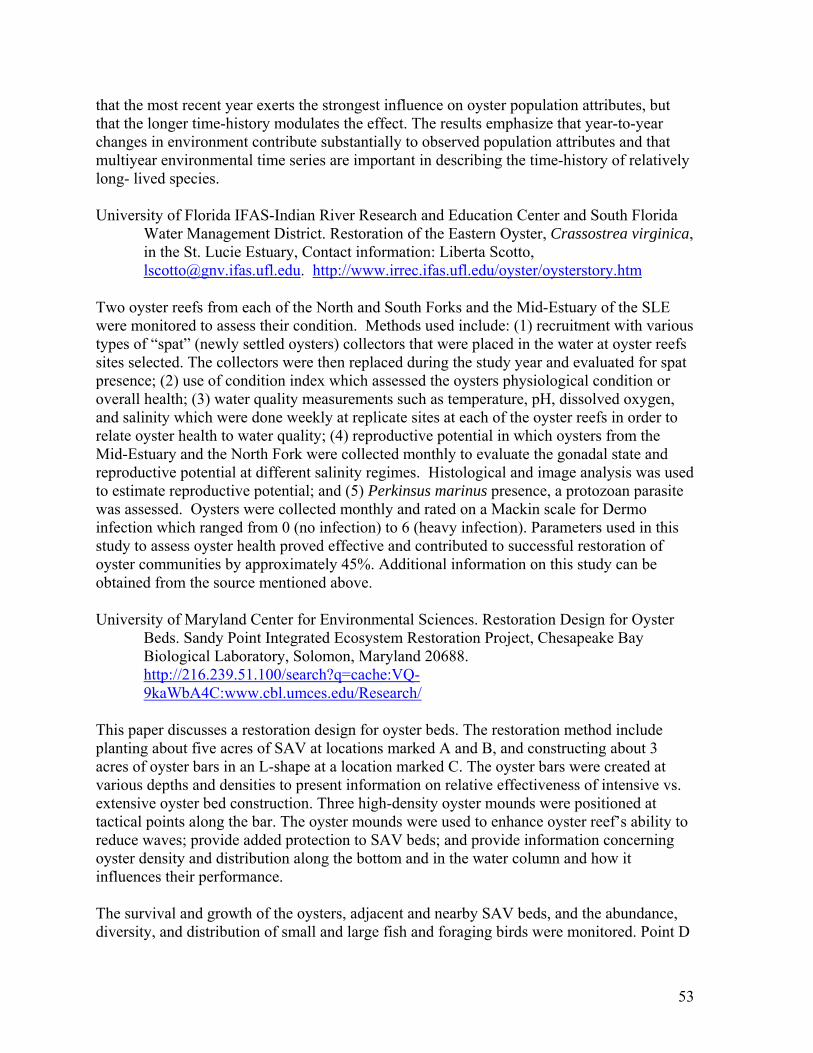
that the most recent year exerts the strongest influence on oyster population attributes, but that the longer time-history modulates the effect. The results emphasize that year-to-year changes in environment contribute substantially to observed population attributes and that multiyear environmental time series are important in describing the time-history of relatively long- lived species. University of Florida IFAS-Indian River Research and Education Center and South Florida
Water Management District. Restoration of the Eastern Oyster, Crassostrea virginica, in the St. Lucie Estuary, Contact information: Liberta Scotto, [email protected]. http://www.irrec.ifas.ufl.edu/oyster/oysterstory.htm
Two oyster reefs from each of the North and South Forks and the Mid-Estuary of the SLE were monitored to assess their condition. Methods used include: (1) recruitment with various types of “spat” (newly settled oysters) collectors that were placed in the water at oyster reefs sites selected. The collectors were then replaced during the study year and evaluated for spat presence; (2) use of condition index which assessed the oysters physiological condition or overall health; (3) water quality measurements such as temperature, pH, dissolved oxygen, and salinity which were done weekly at replicate sites at each of the oyster reefs in order to relate oyster health to water quality; (4) reproductive potential in which oysters from the Mid-Estuary and the North Fork were collected monthly to evaluate the gonadal state and reproductive potential at different salinity regimes. Histological and image analysis was used to estimate reproductive potential; and (5) Perkinsus marinus presence, a protozoan parasite was assessed. Oysters were collected monthly and rated on a Mackin scale for Dermo infection which ranged from 0 (no infection) to 6 (heavy infection). Parameters used in this study to assess oyster health proved effective and contributed to successful restoration of oyster communities by approximately 45%. Additional information on this study can be obtained from the source mentioned above.
University of Maryland Center for Environmental Sciences. Restoration Design for Oyster Beds. Sandy Point Integrated Ecosystem Restoration Project, Chesapeake Bay Biological Laboratory, Solomon, Maryland 20688. http://216.239.51.100/search?q=cache:VQ-9kaWbA4C:www.cbl.umces.edu/Research/
This paper discusses a restoration design for oyster beds. The restoration method include planting about five acres of SAV at locations marked A and B, and constructing about 3 acres of oyster bars in an L-shape at a location marked C. The oyster bars were created at various depths and densities to present information on relative effectiveness of intensive vs. extensive oyster bed construction. Three high-density oyster mounds were positioned at tactical points along the bar. The oyster mounds were used to enhance oyster reef’s ability to reduce waves; provide added protection to SAV beds; and provide information concerning oyster density and distribution along the bottom and in the water column and how it influences their performance. The survival and growth of the oysters, adjacent and nearby SAV beds, and the abundance, diversity, and distribution of small and large fish and foraging birds were monitored. Point D
53

showed uncertain position of onshore oyster setting tanks where oyster larvae acquired from off-site would attach to cultch before being relocated to a protected shallow-water oyster nursery at Point E. The spat was kept at that position and allowed to solidify for numerous days/weeks before being transported to site C for final seeding. See resource mentioned above for additional information on methods used and results for this study.
Virginia Institute of Marine Sciences (VIMS). 1994. Monitoring Programs for Oyster Beds. Virginia Institute of Marine Science, P.O. Box 1346, Gloucester Point, Virginia U.S.A., 23062-1346. Contact information: Dr. Roger Mann, Department. of Fisheries Science, Virginia Institute of Marine Science. http://www.vims.edu/mollusc/monrestoration/monoyster.htm#modern
Data was collected by the VIMS Spatfall Survey and the VIMS Dredge Survey on oyster bed health in Virginia waters. The VIMS Spatfall Survey organized shell strings weekly from May to September at stations within the Chesapeake Bay to provide an annual index of oyster settlement and recruitment. Shell strings were suspended 0.5 m from the bottom to provide settlement substrate for oyster veligers. After retrieval, oyster spat (recently settled oysters) on the undersides of ten shells were counted under a dissecting microscope. The average number of spat per shell was calculated for each time and place.
The VIMS Dredge Survey monitored the status of Virginia's public oyster fishery, encompasses more than 243,000 acres. Oyster bars were sampled throughout the state annually to assess trends in oyster growth, mortality, and recruitment using a dredge. At each location three samples of bottom material were dredged. Half-bushel aliquots (25 quarts) were taken from each sample for processing. Researchers then counted the number of spat, small, and market oysters. Averages of counts per bushel of bottom material were calculated so that comparisons can be made between areas and years in which study was conducted. The Patent Tong survey was then initiated in 1993 to provide more quantitative estimates of oyster standing stock in Virginia tributaries. At each station, a patent tong was used to sample one square meter of bottom. Oysters from each sample were examined. Researchers stated that the surveys used to assist in monitoring oyster health was efficient in providing data that support management and restoration of Virginia's oyster resource.
Wenner, E., H. R. Beatty, and L. Coen. 1996. A method for quantitatively sampling nekton on intertidal oyster reefs. Journal of Shellfish Research 15: 769-775.
Author abstract. We developed a sampling methodology using a 24-m super(2) lift net to quantitatively sample intertidal oyster (Crassostrea virginica) reefs as a part of a long-term study of their functional ecology. This method can also be used in restoration monitoring of oyster reefs to evaluate reef functionality. The method involved surrounding an area of oyster reef with a buried net at low tide, allowing the water level to rise, raising the net at high tide to trap motile organisms, allowing the water to recede, and collecting the entrapped nekton. Natural and artificially constructed reefs were sampled, monitored and efficiency (mark-recapture) studies were performed to evaluate the method. The advantages of this method are: (1) the habitat in the area to be sampled receives minimal damage; (2) the size and shape of the net system are flexible and can be adapted to fit a variety of habitats; (3) no permanent
54

structures, other than a shallow perimeter trench, are present to act as attractants; and (4) it is relatively inexpensive to purchase and maintain gear. One disadvantage to the method is that it is very labor intensive, typically using three to five people. This method proved more efficient on natural reefs than artificial reefs, and the return rate was slightly better for Fundulus heteroclitus than for Palaemonetes spp. Seventeen decapod and 24 fish taxa were collected from initial spring, summer, and fall 1995 sampling.
Abstracts:
Bushek, D., J. Keesee, B. Jones, M. Neet, and D. Porter. 2000. Shellfish health management: A system level perspective for Perkinsus marinus. Marine Science Program and Department of Environmental Health Sciences, University of South Carolina, Columbia, SC 29208. Journal of Shellfish Research 19: 642-643.
Author abstract. This paper provides information on a study conducted on 2 South Carolina estuaries on shellfish health. See publication for additional information on this study. The paper presents data from three years of spatial seasonal monitoring of P. marinus infection intensities in the 2 estuaries. The data include El Nino, La Nina and normal rainfall years and indicate that water residence time and flushing rates, are primary determinants of infection intensity. Landscape-level anthropogenic impacts that alter these hydrological processes (e.g., upland ditching and drainage, channel dredging, jetty construction, etc) may be more important factors in intensifying oyster mortality from P. marinus than pollutants commonly associated with development. Shellfish health management should include, 1) via site selection for planting, cultivating and harvesting oysters, 2) for selecting sanctuaries and reserves, and 3) to identify potential management regulations and mitigation efforts for coastal development. Additional information can be retrieved from contacts listed above. Coen, L. D., E .L. Wenner, D. M. Knott, B. Stender, N. H. Hadley, M.Y. Bobo, D. L.
Richardson, M. A. Thompson, and R. E. Giotta. 1997. Intertidal oyster reef habitat assessment and restoration: Evaluating habitat use, development and function. Journal of Shellfish Research 16: 262.
Author abstract. This abstract presents a study conducted in South Carolina 1994 where researchers evaluated the role of intertidal oyster reefs in southeastern estuarine ecosystems. This information was then used to formulate strategies for habitat management and restoration and mitigation methods. The authors experimented in constructing replicate experimental reefs to follow habitat recruitment and succession, using transient and resident species. Two sites were studied, each with three replicate experimental reefs of 23 m2. Environmental data was collected (DO, salinity, pH, turbidity, intertidal and subtidal temperatures), monitoring of oyster diseases (monthly Dermo and MSX) and other life history parameters (SPF growth, spat set, reproduction) on experimental, and adjacent natural reefs. Results at this time showed more than 34 species of fish and decapod crustaceans that were transient were collected, with densities often exceeding 5,600 individuals/23 m2 reef. Within seven months (May, 1995), large densities of xanthid crab recruits (<1.5-3 mm cw) were observed on both natural and experimental reefs.
55

Dame, R. F., E. Koepfler, L. Gregory, T. Prins, D. Allen, D. Bushek, C. Corbett, D. Edwards, B. Kjerfve, A. Lewitus, J. Schubauer-Berigan, and S. Thomas. 1998. Testing the role of oyster reefs in the structure and function of tidal creeks with a replicated ecosystem scale experiment: System level variability and response to removal of oysters. Journal of Shellfish Research 17: 1297.
Author abstract. Data from an ongoing replicated ecosystem level study that addresses the ecological role of oyster reefs in tidal creeks. The geomorphology and hypsometry were determined for eight similar tidal creek systems in North Inlet Estuary, South Carolina, U.S.A. Oyster biomass, which ranged from 2 to 24 g dry wt. m-3 of water, was standardized to 8 g dry weight m-3. Afterward, water quality, phytoplankton and bacterial productivity, oyster growth and recruitment, nekton utilization, total creek metabolism and nutrient cycling were monitored in each creek for one year to determine system variability. After the first year of monitoring was complete (Jan. 1998), oyster reefs were removed from four of the eight creeks in a randomized block design. Monitoring continued so that the before and after reef removal data can be compared among control (no reefs removed) and impact (reefs removed) creeks in completely replicated BACI design. Pre-reef removal data indicated high seasonal variability and significant variability among creeks. Relative differences among creeks were stable - creeks generally maintained the same rankings throughout the year. Analysis of subsequent monitoring viewed changes in the behavior of creek attributes before and after oyster reef removal. The BACI design accounts for such overriding effects, enabling only the impacts of removing oysters to be examined, but also enabling differences in system response to major perturbations when oyster reefs are present or absent to be examined. Ellis, M. S., J. Song, and E. N. Powell. 1993. Status and trends analysis of oyster reef habitat
in Galveston Bay, Texas, Journal of Shellfish Research 12: 154. Author abstract. This study was conducted to test a new technique for determining the status and trends of oysters (Crassostrea virginica) populations in Galveston Bay, Texas. An acoustic profiler was used to differentiate substrate type, a fathometer to assess bottom relief and a global positioning system to accurately establish position. The acoustic profiler chart interpreted sediment characteristics and reefal according to the amount of return generated. Researchers were able to distinguish oyster reef from mud, sand and shell hash. The bathymetry, sediment type and geographic position data were computerized and processed for use by a Geographic Information System (GIS) to produce the maps. Arc/Info software was used to produce maps covering the majority of Galveston Bay, Trinity Bay, East Bay, and West Bay. The reefs were then compared to those in the late '60s and early '70s by the Texas Parks and Wildlife Department. See publication for additional information on techniques used. The amount of oyster reef and oyster bottom recorded in this study was higher than that depicted on the TPWD charts. Harris, C. S., and K. T. Jr. Paynter. 2001. The effect of local population density on growth
and condition in the eastern oyster Crassostrea virginica, p. 279. Aquaculture 2001: Book of Abstracts. World Aquaculture Society, 143 J. M Parker Coliseum, Louisiana State University, Baton Rouge, Louisiana 70803 USA.
56

Author abstract. The restoration of oysters and oyster reefs is an important component in the restoration of the Chesapeake Bay estuary. The impact of oyster stocking density on oyster growth, mortality, condition and parasite prevalence has not been widely studied. In order to maximize the effectiveness of oyster restoration, it is important to determine how stocking density may affect these parameters. In addition, the effect of increased oyster reef habitat on the surrounding benthic community is important to understand. In the fall of 1999, twelve 0.2 acre experimental plots were constructed in the Patuxent River by placing fossilized oyster shell on a former, but now barren, natural oyster bar. The plots were randomly assigned one of four treatments, including zero oysters/m super(2), 124 oysters/m super(2), 247 oysters/m super(2) or 494 oysters/m super(2), in a randomized design. Samples were collected by divers using quadrats from each site in November 1999 and May 2000. In May 2000, shell height of high-density oysters (mean 37(± 1.6 SEM) mm) was not significantly different than that of low density oysters (40 ± 1.4 mm). However, low-density oysters had a mean condition index of 13.2(± 0.65) but the mean condition index of the high density oysters was sign)ficantly lower at 11.1 (± 0.62). Condition index is a measure of dry tissue weight unit per pallial volume and is often used as an indicator of oyster health. This may suggest that density may play a role in the health of oysters and that oysters in high densities may be stressed by limiting environmental factors such as food or dissolved oxygen. The results of this study will provide further insight on the importance of local population density in oyster restoration projects. Jordan, S. J., K. Greenhawk, and G. F. Smith. 1995. Maryland oyster geographical
information system: Management and scientific applications. Journal of Shellfish Research 14: 269.
Author abstract. A microcomputer geographical information system (GIS) has been developed to manage and interpret data from Maryland's oyster monitoring and management programs. The GIS was initiated to portray annual monitoring information geographically, but has been expanded to include physical and chemical habitat data, management-related information, and data from special studies. Complete biological and physical information about an individual oyster bar, a region, or the entire Maryland Chesapeake Bay can be retrieved to a user's specification almost instantaneously, and portrayed in a variety of graphical and tabular formats. The system has proved especially useful in supporting the information needs of the state's Oyster Recovery Action Plan. For example, we have provided managers, scientists, and policy-makers with clear, graphical portrayals of oyster habitat, population and disease status, salinity gradients, and management history with a minimum of effort. As new experimental management efforts develop, the GIS maintained a standard, geographically precise database for documenting and tracking their performance. The use of GIS with biological monitoring data greatly simplifies the spatial aspects of analysis, allowing the analyst to focus on temporal variations: the GIS tested hypotheses about historical changes in the areal extent of oyster physical habitat, spatfall and diseases. Besides its utility for management and scientific investigations, the GIS proved to be a valuable educational tool for students and tour groups.
57

Koles, T., and K. T. Paynter. 1999. Oyster restoration in Maryland: Measuring progress and productivity. National Shell Fisheries Association. Journal of Shellfish Research 18: 330.
Author abstract. A study conducted in 1997, in cooperation with the Maryland Department of Natural Resources and the Army Corps of Engineers, in which five sites in both the Choptank and Patuxent Rivers, extending from the mouth of each river to approximately eight miles upstream, were identified for restoration. At each site, fossil oyster shells were deposited in a configuration of two 0.5-acre flat areas and one mound approximately three to four meters high. Some of these areas were then planted with hatchery reared spat (1 million/acre; 247/m2) while the rest were left unplanted. Divers obtained quadrat samples from each of the flats and mounds and YSI 6000 continuous water quality monitors to measure ambient water temperature, salinity, pH, and dissolved oxygen. The samples were analyzed for oyster size, abundance, mortality, fouling community and parasite (Perkinsus marinus) prevalence and intensity. In both rivers, the oysters appeared to be growing dynamically. Parasitic activity was very low with only a few oysters in each river infected with P. marinus. Mortality was also low overall and the unplanted mounds in both rivers recruited higher numbers of natural spat set than the unplanted flat areas nearby. Results were used to evaluate the differences in bottom morphology and differing water characteristics (i.e. salinity) on oyster recruitment, growth, mortality, and disease pressures. Luckenbach, M. W., J. Harding, R. Mann, J. Nestlerode, F. O. Beirn, and J. A. Wesson.
1999. Oyster reef restoration in Virginia, USA: Rehabilitating habitats and restoring ecological functions. Journal of Shellfish Research 18: 720-721.
Author abstract. Repletion efforts in response to declines in abundance of the eastern oyster, Crassostrea virginica, have historically relied upon transplanting of oyster seed and planting of a suitable settlement substrate. These efforts have generally failed to revitalize the fishery because they (1) failed to rehabilitate degraded reef habitat and (2) placed little emphasis upon reestablishing a population age structure capable of sustaining a self-supporting reef. More recently restoration efforts in Virginia have focused on reconstructing 3-dimensional reef habitats and establishing brood stock sanctuaries with an emphasis on restoring lost ecological functions of reefs. Manipulative studies of reef placement, construction material and interstitial space have lead to the development of design criteria for maximizing oyster recruitment, growth and survival on constructed reefs. Further, we have characterized the successional development of resident macrofaunal communities on restored reefs and have begun to relate that development to specific habitat characteristics. Utilization of these restored reef habitats by transient species has been characterized through extensive field collections and underwater video observations; gut analyses of finfish are beginning to elucidate trophic linkages between the reefs and adjacent habitats. In addition, these structures appear important to the early developmental stages of juvenile fishes, some of which have considerable recreational and commercial importance. These studies are helping us to (1) clarify the ecological functions supported by oyster reef habitat, (2) define design criteria for reconstructing reefs and (3) establish success criteria for such restoration projects. While destructive fishing of oyster reefs appears inconsistent with meeting these goals, an emerging paradigm is that reef sanctuaries can be used to support desired ecological
58

functions as well as supply recruits to adjacent areas which can be managed from a fisheries perspective. McCollough, C., S. J. Jordan, and M. L. Homer. 2000. Chesapeake bay oysters: Trends in
relative abundance and biomass. Journal of Shellfish Research 19: 623. Author abstract. Oyster populations are distributed patchily over more than 400,000 acres in Chesapeake Bay, so it is not feasible to assess their absolute numbers or biomass. Traditionally, landings data, with their inherent inaccuracies and biases, have been the only consistent means of estimating trends. A long term monitoring program in Maryland has recorded relative numbers and size distributions of oysters, along with other population and disease data annually; 43 fixed sites have been monitored consistently since 1990, with many records from these sites available from earlier years. In 1999, we obtained shell height measurements and dry tissue weights from samples of 10 oysters from each site (selected to represent the range of sizes present). By applying the resulting length: weight equation to size-frequency data from earlier surveys, we computed an index of relative biomass that varied from year to year according to the relative abundance and size distribution of the oyster populations. The index is useful for portraying trends and tracking the performance of restoration efforts. It reflects interannual variations in recruitment and growth, as well as mortality caused by the oyster parasites Haplosporidium nelsoni and Perkinsus marinus. Paynter, K. T. Jr. 2001. Oyster restoration in Maryland: Results from Choptank and Patuxent
River experiments, p. 519. Aquaculture 2001: Book of Abstracts, World Aquaculture Society, 143 J.M Parker Coliseum Louisiana State University, Baton Rouge, Louisiana 70803 USA.
Author abstract. In 1997, this study was conducted in which oysters were planted in the Choptank and Patuxent rivers in Maryland as the initiation of a large scale oyster restoration effort undertaken by the Army Corps of Engineers and the Maryland Department of Natural Resources. Three plots of approximately 1/2 acre in area were prepared by placing fossil shell on the bottom. Two of the three plots were created as flat, rectangular shells beds while the third was constructed as a large mound approximately 10 m in diameter and about 2 m high. Five sites of three plots each were constructed in each river sited from the mouth upstream to the low salinity. In the Choptank, seed was produced from Louisiana brood-stock and in the Patuxent, seed was produced from larvae purchased from Oregon. In 1998 Perkinsus marinus prevalence was low throughout the Maryland portion of Chesapeake Bay. In the Patuxent, oyster growth was poor and mortalities were very high due to parasitic activity. However, in the Choptank most stocks planted from the hatchery remained uninfected while natural transplants and local populations acquired significant levels of the disease. Growth and condition index remained vigorous in the planted oysters while the health of natural local populations declined. Researchers concluded that these experiments provide evidence that disease levels may be managed in lower salinity regions like in the central and northern parts of the Maryland's portion of the Chesapeake Bay. Southworth, M., and R. Mann. 1998. Oyster reef broodstock enhancement as a mechanism
for rapid oyster reef replenishment. Journal of Shellfish Research. 17: (np).
59

Author abstract. Natural oyster populations in the Chesapeake Bay have become severely depleted due to a combination of overfishing and disease. Replenishment programs in the form of artificial reefs are currently in effect throughout most of the Virginia portion of the Chesapeake Bay. Shell Bar reef, built in the Great Wicomico River, Virginia in 1996 was supplemented with reproductively active broodstock oysters from Tangier and Pocomoke Sounds. The Great Wicomico River was historically a high seed producing river, but production has decreased in recent years. Oyster larval concentrations (plankton tows), gonad development, and circulation data were collected in the river throughout the 1997 reproductive season. The broodstock oysters spawned from mid-June through mid-August, with a peak occurring from mid-June through mid-July. Larval concentrations were several orders of magnitude higher than the highest reported in the literature over the past 25 years. Larvae were significantly more abundant on the flood tidal stage, suggesting some vertical migration with the changing tide, thus aiding in their retention in the system. Settlement of larvae on shellstrings and on bottom substrate, was higher than in recent years. The most abundant settlement occurred near the reef and upriver of the reef. Circulation patterns observed are favorable for local retention of larvae in the system. Reef building, and subsequent transplants of broodstock onto these reefs, can be an effective management option provided the circulation patterns of the system are similar to the Great Wicomico. Wallace, R. K., D. B. Rouse, and M. Van Hoose. 1998. Restoring oyster reefs in Alabama: A
program to enhance sport fishing and increase oyster production, Journal of Shellfish Research 17: (np).
Author abstract. Researchers discuss the enhancement of three unproductive oyster reefs totaling 30 ha in Mobile Bay in order to provide both angling opportunities and to re-establish oyster production. Reef areas were marked with pilings and encircled by a low (1 m), irregular line of concrete rubble to protect the remaining cultch material and to create structure for fishing with Wallop-Breaux funding The three reefs and a productive reef were surveyed and assessed for standing crops of live oysters and available cultch to establish baseline data prior to additional restoration efforts. One of the unproductive reef areas is used to test hypotheses relative to restoration. Hatchery produced oysters (spat and seed) were placed on the existing bottom and on oyster shell pads constructed 20 and 40 cm above bottom to determine relative growth and survival. Recordings were made continuously monitoring oxygen at two levels (bottom and 40 cm) and spat set is being checked at all three sites. The largest reef, which was productive as recently as 10 years ago, was planted half in oyster shell and half in limestone while the remaining two reefs were planted based on findings from the experiments. From this study, results have shown that these two reefs are already being heavily utilized and anecdotal reports on fishing success have been good.
MONITORING PROTOCOLS AND TECHNIQUES MANUALS
Adamus, P. R., L. T. Stockwell, E. J. Clairain, Jr., M. E. Morrow, L. P. Rozas, and R. D.
Smith. 1991. Wetland Evaluation Technique. United States Army Corps of Engineers, Waterways Experiment Station. Technical Report WRP-DE-2.
60

The Wetland Evaluation Technique (WET) provides information on predictors of wetland functions. The target audience for this manual includes: persons such as community groups, NGO’s and anyone who has no contact on a regular basis with technical experts. The manual is presented into two volumes. Volume one presents: conceptual fundamentals for WET, wetland functions in relation to their processes and interactions with other functions, a review of technical literature on each function of a wetland and how functions vary depending on wetland type, the predictors used for verifying the probability ratings for wetland functions; and a discussion on the concept of wetland social significance as used in WET. Volume two of the manual outlines steps that are to be followed when performing the WET method, discusses its application and limitations in detail, and shows documentation for a computer program that is designed to support data analysis in WET. Detailed information on methods and procedures described here can be obtained from the manual. Bartol I. K., and R. Mann. 1995. Small scale patterns of recruitment on a constructed
intertidal reef: the role of spatial refugia, p. 159-170. In M. W. Luckenbach, R. Mann, and J. Wesson (eds.), Oyster Reef Habitat Restoration: A Synopsis and Synthesis of Approaches. Williamsburg, Virginia: Virginia Institute of Marine Science, College of William and Mary: VIMS Press.
Researchers constructed a three-dimensional oyster reef using oyster shell in the Piankatank River, Virginia, and evaluated settlement and mortality patterns of oysters from June 1993 to September 1994. The reef extended from 2.5 m below mean low water (MLW) to 0.75 m above MLW and covered 150 x 30 m. In 1993 twelve intertidal hummocks were sampled along upstream and downstream transects using transects on two mounds (one sheltered from wave currents and one exposed to wave currents) during each period of sampling. On the reefs transects were marked to prevent re-sampling. In 1994, eight hummocks were partitioned into 64 x 20 cm plots using rope and reinforced bars, and experimental sites. Three tidal heights were considered, 25 cm above MLW, MLW and 90 cm below MLW. Sampling was then conducted at each of these levels. In intertidal and subtidal locations, settlement and mortality occurrences were monitored at the reef surface and within the reef depths interstices of 10cm. In subtidal locations settlement was greater and showed no difference in settlement intensity between surface and subsurface environments. Along the intertidal-subtidal continuum survival rates for most of the year were highest at MLW. At this location, physical and predatory influences were minimal. The results indicate that both reef tidal elevation and substrate thickness provide microscale refugia for settlement and survival of early oyster life history stages. Brooks, R. P., D. H. Wardrop, and J. K. Perot. 1998. Development and Application of
Assessment Protocols for Determining the Ecological Condition of Wetlands in the Juniata River Watershed. Environmental Monitoring and Assessment Program. Grant EPA-R-826662.
Author abstract. This study contributes to the development of a means to accurately, efficiently, and fairly assess a wetland's condition in the context of the surrounding watershed can then be used to implement protective and restorative strategies that are
61
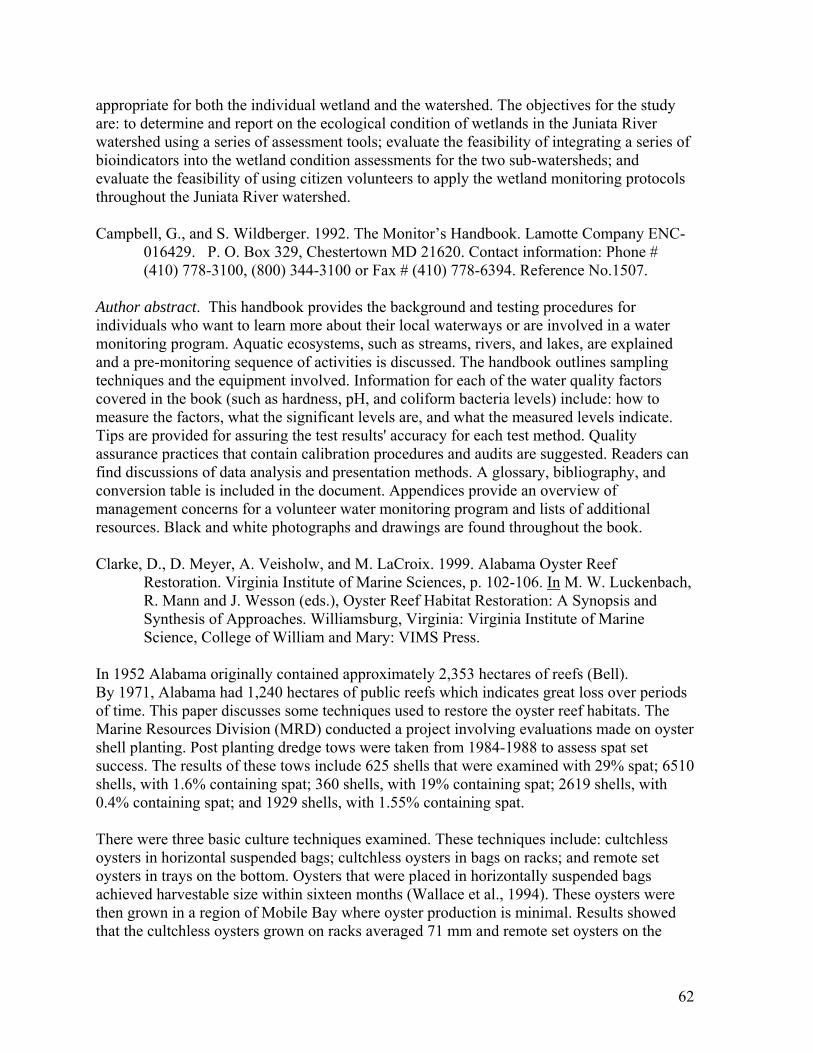
appropriate for both the individual wetland and the watershed. The objectives for the study are: to determine and report on the ecological condition of wetlands in the Juniata River watershed using a series of assessment tools; evaluate the feasibility of integrating a series of bioindicators into the wetland condition assessments for the two sub-watersheds; and evaluate the feasibility of using citizen volunteers to apply the wetland monitoring protocols throughout the Juniata River watershed. Campbell, G., and S. Wildberger. 1992. The Monitor’s Handbook. Lamotte Company ENC-
016429. P. O. Box 329, Chestertown MD 21620. Contact information: Phone # (410) 778-3100, (800) 344-3100 or Fax # (410) 778-6394. Reference No.1507.
Author abstract. This handbook provides the background and testing procedures for individuals who want to learn more about their local waterways or are involved in a water monitoring program. Aquatic ecosystems, such as streams, rivers, and lakes, are explained and a pre-monitoring sequence of activities is discussed. The handbook outlines sampling techniques and the equipment involved. Information for each of the water quality factors covered in the book (such as hardness, pH, and coliform bacteria levels) include: how to measure the factors, what the significant levels are, and what the measured levels indicate. Tips are provided for assuring the test results' accuracy for each test method. Quality assurance practices that contain calibration procedures and audits are suggested. Readers can find discussions of data analysis and presentation methods. A glossary, bibliography, and conversion table is included in the document. Appendices provide an overview of management concerns for a volunteer water monitoring program and lists of additional resources. Black and white photographs and drawings are found throughout the book. Clarke, D., D. Meyer, A. Veisholw, and M. LaCroix. 1999. Alabama Oyster Reef
Restoration. Virginia Institute of Marine Sciences, p. 102-106. In M. W. Luckenbach, R. Mann and J. Wesson (eds.), Oyster Reef Habitat Restoration: A Synopsis and Synthesis of Approaches. Williamsburg, Virginia: Virginia Institute of Marine Science, College of William and Mary: VIMS Press.
In 1952 Alabama originally contained approximately 2,353 hectares of reefs (Bell). By 1971, Alabama had 1,240 hectares of public reefs which indicates great loss over periods of time. This paper discusses some techniques used to restore the oyster reef habitats. The Marine Resources Division (MRD) conducted a project involving evaluations made on oyster shell planting. Post planting dredge tows were taken from 1984-1988 to assess spat set success. The results of these tows include 625 shells that were examined with 29% spat; 6510 shells, with 1.6% containing spat; 360 shells, with 19% containing spat; 2619 shells, with 0.4% containing spat; and 1929 shells, with 1.55% containing spat. There were three basic culture techniques examined. These techniques include: cultchless oysters in horizontal suspended bags; cultchless oysters in bags on racks; and remote set oysters in trays on the bottom. Oysters that were placed in horizontally suspended bags achieved harvestable size within sixteen months (Wallace et al., 1994). These oysters were then grown in a region of Mobile Bay where oyster production is minimal. Results showed that the cultchless oysters grown on racks averaged 71 mm and remote set oysters on the
62

bottom averaged 82 mm after sixteen months. Despite success with this technique, Alabama is no longer utilizing these techniques.
Cook Inlet Keeper. 1998. Volunteer training manual. Contact information: Cook Inlet Keeper, P. O. Box 3269, Homer, AK 99603, Phone # (907) 235-4068 and Fax # (907) 235-4069. http://www.inletkeeper.org/training.htm.
This Manual provides Cook Inlet Keeper volunteers with information needed to monitor water quality in the Cook Inlet watershed. It also provides guidelines for monitoring procedures that are currently include: in the Keeper’s Citizens’ Environmental Monitoring Program (CEMP). Outlined in this document are safety and access issues; a monitoring overview which discusses areas such as water quality test methods, test parameters and sampling schedule; monitoring procedures which include: field procedure checklist, field observations, collecting the samples, testing procedures, sample custody and completing data sheets; equipment care and waste disposal; data management and reporting; and quality control. Additional information for methods and procedures used can be obtained from this manual.
Davies, J., J. Baxter, M. Bradley, D. Connor, J. Khan, E. Murray, W. Sanderson, C. Turnbull, and M. Vincent. 2001. Marine Monitoring Handbook. UK Marine Science Project, and Scottish Association of Marine Science. Joint Nature conservation Committee, English Nature, Scottish Natural Heritage, Environment and Heritage Services. http://www.jncc.gov.uk/marine/mmh/Introduction.pdf.
The UK Marine Science Project developed this hand book to provide guidelines for recording, monitoring and reporting characteristics and conditions of marine habitats. However based on location and other environmental conditions methodologies will have to be modified to suit the structural characteristics of the habitat. This manual addresses the fundamentals and procedures for monitoring different parameters in marine habitats, management tools, and benefits and costs for developing a monitoring project. Topics presented in this document include establishing marine monitoring programs highlighting what needs to be measured and methods to use; provides guidance when developing a monitoring program; selecting proper monitoring techniques to attain precision and accuracy; and procedural guidelines for monitoring a specific marine habitat. Detailed information on the tools needed for monitoring marine habitats are described within the marine monitoring handbook.
Davis, G. E., K. R. Faulkner, and W. L. Halvorson. 1994. Ecological monitoring in Channel Islands National Park, California, p. 465-482. In W. L. Halvorson, and G. J. Maender (eds.), The 4th California Islands Symposium: Update on the Status of Resources.
Author abstract. Natural resource managers need to understand the natural functioning of and threats to ecosystems under their management. They need a long-term monitoring program to gather information on ecosystem health, establish empirical limits of variation, diagnose abnormal conditions, and identify potential agents of change. The approach used to design such a program at Channel Islands National Park, California, may be applied to other
63

ecosystems worldwide. The design of the monitoring program began with a conceptual model of the park ecosystem. Indicator species from each ecosystem component were selected using a Delphi approach. Scientists identified parameters of population dynamics to measure, such as abundance, distribution, age structure, reproductive effort, and growth rate. Short-term design studies were conducted to develop monitoring protocols for pinnipeds, seabirds, rocky intertidal communities, kelp forest communities, terrestrial vertebrates, land birds, terrestrial vegetation, fishery harvest, visitors, weather, sand beach and coastal lagoon, and terrestrial invertebrates (indicated in priority order set by park staff). Monitoring information provides park and natural resource managers with useful products for planning, program evaluation, and critical issue identification. It also provides the scientific community with an ecosystem-wide framework of population information.
Halse, S. A., D. J. Cale, E. J. Jasinska, and R. J. Shiel. 2002. Monitoring change in aquatic invertebrate biodiversity: sample size, faunal elements and analytical methods. Aquatic Ecology 36: 395-410.
Author abstract. Replication is usually regarded as an integral part of biological sampling, yet the cost of extensive within-wetland replication prohibits its use in broad-scale monitoring of trends in aquatic invertebrate biodiversity. In this paper, we report results of testing an alternative protocol, whereby only two samples are collected from a wetland per monitoring event and then analyzed using ordination to detect any changes in invertebrate biodiversity over time. Simulated data suggested ordination of combined data from the two samples would detect 20% species turnover and be a cost-effective method of monitoring changes in biodiversity, whereas power analyses showed about 10 samples were required to detect 20% change in species richness using ANOVA. Errors will be higher if years with extreme climatic events (e.g., drought), which often have dramatic short-term effects on invertebrate communities, are include: in analyses. We also suggest that protocols for monitoring aquatic invertebrate biodiversity should include: microinvertebrates. Almost half the species collected from the wetlands in this study were microinvertebrates and their biodiversity was poorly predicted by macroinvertebrate data.
McCobb, T. D., and P. K. Wieskel. 2003. Long-Term Hydrologic Monitoring Protocol for Coastal Ecosystems, 94p. United States Geological Survey Open-File Report 02-497. http://water.usgs.gov/pubs/of/2002/ofr02497/
The United States Geological Survey (USGS) and the National Park Service have designed and tested monitoring protocols implemented at Cape Cod National Seashore. The monitoring protocols are divided into two parts. Part one of the protocol discusses the objectives of the monitoring protocol and presents rationale for the recommended sampling program. The second part describes the field, data-analysis, and data-management, and variables that are to be taken inot consideration when monitoring (e.g., sea level rise, climate change and urbanization). This protocol provides consistency when monitoring changes in ground-water levels, pond levels, and stream discharge. The monitoring protocol not only establishes a hydrologic sampling network but provides reasoning for measurement methods selected and spatial and temporal sampling frequency. Data collected during the first year of monitoring and hydrologic analyses for selected sites are presented. Long-term hydrologic
64

monitoring procedures performed at the Cape Cod National Seashore may also assist set a template for deciphering findings of other monitoring programs. Miller, T., C. Bertolotto, J. Martin, and L. Storm. 1996. Monitoring Wetlands: A Manual for
Training Volunteers, 106 p. Adopt-a-beach, P.O. Box 21486, Seattle, WA 98111-3486. Contact information: Phone # (206) 624-6013 and Fax # (206) 682-0722.
This manual provides quantitative and qualitative methods for monitoring structural and functional characteristics in natural and created wetlands. Volunteers identify major vegetation communities, locate photo points, identify surrounding land uses, and establish locations of transects. Data collected serves as a baseline for future monitoring. The manual presents protocols for monitoring hydrology; wetland buffer condition; soil types; vegetation; topography (determining elevations); and wildlife.
Methods described in this manual include plant survival counts, vegetation assessment, and percent cover surveys. Plants surveys are designed for use in wetlands or wetland mitigation sites. Data collected can be used to evaluate planting success, mark areas for replanting, and identify species that should not be replanted in an area, given their low survival rates. Vegetation assessment surveys provide qualitative information on the wetland vegetation characteristics. Plots used are circular, with the radius depending on the predominant type of vegetation in the plot (10 meters for forested, 5 meters for scrub-shrub, and 1 meter for herbaceous). For each plot, volunteers record three to five of the most dominant species in each vegetation layer (tree, shrub, and herb). Data collected can be associated with other data (for example, hydrology or soil types) in order to understand wetland functions and how it should be managed and protected. Percent cover vegetation surveys uses similar plot sizes in vegetation assessment survey but the plots are placed every 50 feet along five transects over the wetland. In each plot, volunteers identify all species and estimate the area in which they covered.
Molano-Flores, B. 2002. Critical Trends Assessment Program: Monitoring Protocols. Critical Trends Assessment Program (CTAP), 607 Peabody Drive, Champaign Illinois, 61820. Contact information: CTAP, Phone # (217) 244-1489 and Fax # (217) 265-5110. Technical Report 2002-2. http://ctap.inhs.uiuc.edu/mp/pdf/mp.htm
The Critical Trends Assessment Program (CTAP) monitors the conditions of forests, grasslands, wetlands and streams throughout Illinois. CTAP also assesses current and future trends in ecological conditions for state, regional and site specific basis. The CTAP document presents standardized monitoring protocols for the habitat types previously mentioned. Wetland habitat criteria as well as wetland sampling protocols are discussed in this document. Highlighted in this section are methods used to monitor ecological changes occurring in wetlands. These methods include establishing study plots, GPS data, general site characteristics, slope and aspects, ground cover and woody vegetation measurements, big plot and collection of voucher specimens. Each method used and parameters measured provide data on the structural and functional characteristic of the habitat as well as the habitat’s condition.
65

Olin, T. J., J. C. Fischenich, M. R. Palermo, and D. F. Hayes. 2000. Wetlands Engineering Handbook: Monitoring. U. S. Army Engineer Research and Development Center, Vicksburg, MS. Technical Report ERDC/EL TR-WRP-RE-21.
The wetlands engineering handbook presents methods for monitoring and evaluating success. Authors emphasize that local expertise and data bases for particular wetland types must be used together with the guide to ensure monitoring plans for a specific project are effectively developed. Chapter eight of this report provides a guide for developing evaluation criteria and monitoring projects for wetland restoration and creation. Also presented is guidance for monitoring and success evaluation on basic monitoring concepts, assessing wetland hydrology, evaluating soils and vegetation, and fauna usage. The authors also outline an approach to determining project goals and evaluation criteria, basic considerations related to monitoring, provide detailed information on how to assess wetland structure and function regarding hydrology, soils and vegetation, and fauna (e.g. macroinvertebrates, birds and fish). Additional information needed on assessment, monitoring and evaluating success are described within this report. Oregon Watershed Enhancement Board. 1999. Oregon Aquatic Habitat: Restoration and
Enhancement Guide. Contact information: 775 Summer street, suite 360, Salem Oregon, 97301, Phone # (503) 986-0178. http://www.oweb.state.or.us/publications/habguide99.shtml
This guide was developed to provide guidance on restoration and enhancement measures that would assist in aquatic ecosystem recovery. The guide is divided into five sections: An overview of Restoration activities, activity guidelines, overview of agency regulatory functions and sources of assistance, grants and assistance, and monitoring and reporting. The purpose of this document is to provide information that will assist in developing effective restoration projects; to define standards and priorities that will be approve by state and receive funding or authorized restoration projects; to identify state and federal regulatory requirements and receive assistance in restoration projects. Additional information on monitoring techniques for salmonid restoration and guidelines and considerations for reporting restoration progress over time are described within the document.
Pacific Estuarine Research Laboratory. 1990. A Manual for Assessing Restored and Natural Coastal Wetlands with Examples from Southern California. La Jolla, California. California Sea Grant Report -T-CSGCP-021.
This manual provides information for assessing the structure and functions of coastal wetlands. The main purpose of this document is to standardize methods of assessing restored, enhanced or constructed wetlands in order to maintain biodiversity. However the function of this manual emphasizes use for salt marshes and tidal creeks. The document provides strategies for wetland construction, restoration and enhancement. In addition the author states that the practitioners must present rationale for functional assessment, objectives of assessment, criteria, and reference wetlands and reference data sets and sampling methods that will be used. Comparative data is collected from natural wetlands include: hydrologic functions, water quality, soil substrate quality and nutrient dynamics, vegetation composition
66

and growth, and fauna presence and abundance. Additional information on methods used for coastal wetlands are described in this document.
Posey, M. H., T. D. Alphin, C. M. Powell and E. Townsend. 1995. Use of oyster reefs as habitat for epibenthic fish and decapods, p. 229- 237. In M. W. Luckenbach, R. Mann and J. Wesson (eds.), Oyster Reef Habitat Restoration: A Synopsis and Synthesis of Approaches. Williamsburg, Virginia: Virginia Institute of Marine Science, College of William and Mary: VIMS Press.
In this study researchers examined the use of intertidal oyster beds by epibenthic decapods and fish in southeastern North Carolina through low tide quadrat sampling of mobile epifauna; sampling of fish and mobile decapods at high tide using sweep nets; and diver observations to estimate usage by large fish and decapods that may be able to evade sweeps when the beds were submerged. Laboratory mesocosm studies examined the potential importance of predation in explaining preferential use of oyster patches by the grass shrimp, Palaemonetes pugio. Fish and decapods were more abundant over oyster beds compared to adjacent sandflat areas, with significantly greater use by grass shrimp, pinfish, and blue crabs. See publication for additional information. Laboratory studies indicated significantly greater use of oyster patches by grass shrimp in the presence of a predatory fish compared to treatments with no fish or a non-predatory fish. The results indicated that oyster habitats is important for epibenthic decapods and fish presence and abundance.
Raposa, K. B., and C. T. Roman. 2001. Monitoring nekton in shallow estuarine habitats, 39p. A Protocol for the Long Term Monitoring Program at Cape Cod National Seashore. Narragansett Bay National Estuarine Research Reserve Prudence Island, RI 028721 and National Park Service, Graduate School of Oceanography, University of Rhode Island, Narragansett, RI 028822. Contact information: [email protected]. http://www.nature.nps.gov/im/monitor/protocoldb.cfm
Author abstract. Long term monitoring of estuarine nekton has many practical and ecological benefits but efforts are hampered by a lack of standardized sampling procedures. This study develops a protocol for monitoring nekton in shallow (<1m) estuarine habitats for use in the Long term Coastal Monitoring Program at Cape Cod National Seashore. Sampling in seagrass and salt marsh habitats is emphasized due to the susceptibility of each habitat to anthropogenic stress and to the abundant and rich nekton assemblages that each habitat supports. Extensive sampling with quantitative enclosure traps that estimate nekton density is suggested. These gears have a high capture efficiency in most habitats and are small enough (typically 1m2 ) to permit sampling in specific microhabitats. Other aspects of nekton monitoring are discussed, including seasonal sampling considerations, sample allocation, station selection, sample size estimation, parameter selection, and associated environmental data sampling. Developing and initiating long term nekton monitoring programs will help track natural and human-induced changes in estuarine nekton over time and advance our understanding of the interactions between nekton and the dynamic estuarine environments.
Shafer, D. J., and D. J. Yozzo. 1998. National Guidebook for Application of Hydrogeomorphic Assessment of Tidal Fringe Wetlands, U.S. Army Engineer,
67

Waterways Experiment Station, Vicksburg, Mississippi. Technical Report WRP-DE-16.
Authors described in the regional guidebook the HGM Approach used for assessing tidal wetlands. The procedures used to asses wetland functions in relation to regulatory, planning or management programs are described (Smith et al. 1995). The Application Phase includes characterization, assessment analysis, and application components. Characterization describes the wetland ecosystem and the surrounding landscape, describes the planned project and potential impacts, and identifies wetland areas to be assessed. Assessment and analysis involves collecting field data that is needed to run the assessment models and calculating the functional indices for the wetland assessment areas under the existing conditions. The Tidal Wetland HGM Approach Application Phase involves determining the wetland assessment area (WAA) and the indirect wetland assessment area (IWAA) and, determining wetland type. The boundaries of the area and the type of tidal wetland to be assessed are identified. The WAA is the wetland area impacted by a proposed project. The WAA defines specific boundaries where many of the model variables are ascertained and directly contributes to calculations for other variables (e.g. maximum aquatic and upland edge). Methods for determining WAA are discussed in detail in the procedural manual of the HGM Approach (Smith et al. 1995). The IWAA is any adjacent portions of hydrologic unit that may not be affected by the project directly but indirectly affected through hydrologic flow alterations. Wetland types are determined by comparing the hydroperiod, salinity regime, and vegetation community structure with those described in the wetland type profiles for each region. Plant communities react to change in the environment (e.g., salinity and hydrologic alterations) so are considered good indicators of a wetland type. Descriptions of the vegetation present, salinity levels, and hydrological conditions for each wetland type are presented in each regional wetland type profile. To determine the salinity regime of an area, one can refer to available references on salinity and or wetland distribution. Data collected on average salinity or the range of salinity helps to sort each site into one of the four categories of the Cowardin system. Shafer, D. J., B. Herczeg, D. W. Moulton, A. Sipocz, K. Jaynes, L. P. Rozas, C. P. Onuf, and
W. Miller. 2002. Regional Guidebook for Applying the Hydrogeomorphic Approach to Assessing Wetland Functions of Northwest Gulf of Mexico Tidal Fringe Wetlands, U.S. Army Engineer Research and Development Center, Vicksburg, Mississippi. Technical Report ERDC/EL TR-02-5.
This manual is designed to provide practitioners with guidelines for monitoring and assessing wetland functions. The manual outlines protocols used for collecting and analyzing data needed to assess wetland functions in the context of a 404 permit review or comparable assessment setting. When assessing tidal fringe wetlands in the northwestern Gulf of Mexico the researcher must define the assessment objectives by stating the purpose (for e.g. assessment determines how the project impacts wetland functions); characterize the project area by providing a description of the structural characteristics of the project area (for e.g., tidal flooding regime, soil type, vegetation and geomorphic setting); use screen for redflags;
68

define the wetland assessment area; collect field data using a 30-m measuring tape, quadrats and color infrared aerial photography; analyze field data; and apply assessment results. This document provides additional detail information on criteria selection and methods used for assessing tidal fringe wetlands. Steyer, G. D., C. E. Sasser, J. M. Visser, E. M. Swenson, J. A. Nyman, and R. C. Raynie.
2003. A proposed coast-wide reference monitoring system for evaluating wetland restoration trajectories. Journal of Environmental Monitoring and Assessment 81:107-117.
Author abstract. Wetland restoration efforts conducted in Louisiana under the Coastal Wetlands Planning, Protection and Restoration Act require monitoring the effectiveness of individual projects as well as monitoring the cumulative effects of all projects in restoring, creating, enhancing, and protecting the coastal landscape. The effectiveness of the traditional paired-reference monitoring approach in Louisiana has been limited because of difficulty in finding comparable reference sites. A multiple reference approach is proposed that uses aspects of hydrogeomorphic functional assessments and probabilistic sampling. This approach include: a suite of sites that encompass the range of ecological condition for each stratum, with projects placed on a continuum of conditions found for that stratum. Trajectories in reference sites through time are then compared with project trajectories through time. Plant community zonation complicated selection of indicators, strata, and sample size. The approach proposed could serve as a model for evaluating wetland ecosystems. Thorsteinson, L. K., and D. L. Taylor. 1997. Watershed approach to ecosystem monitoring in
Denali National Park and Preserve, Alaska. Journal of the American Water Resources Association 33: 795-810.
Author abstract. The National Park Service and the National Biological Service initiated research in Denali National Park and Preserve, a 2.4 million-hectare park in south central Alaska, to develop ecological monitoring protocols for national parks in the Arctic/Subarctic biogeographic area. We are focusing pilot studies on design questions, on scaling issues and regionalization, ecosystem structure and function, indicator selection and evaluation, and monitoring technologies. Rock Creek, a headwater stream near Denali headquarters, is the ecological scale for initial testing of a watershed ecosystem approach. Our conceptual model embraces principles of the hydrological cycle, hypotheses of global climate change, and biological interactions of organisms occupying intermediate, but poorly studied, positions in Alaskan food webs. The field approach include: hydrological and depositional considerations and a suite of integrated measures linking key aquatic and terrestrial biota, environmental variables, or defined ecological processes, in order to establish ecological conditions and detect, track, and understand mechanisms of environmental change. Our sampling activities include: corresponding measures of physical, chemical, and biological attributes in four Rock Creek habitats believed characteristic of the greater system diversity of Denali. This paper gives examples of data sets, program integration and scaling, and research needs.
69

Trippel, E. A. 2001. Marine Biodiversity Monitoring: Protocol for Monitoring of Fish Communities. A Report by the Marine Biodiversity Monitoring Committee (Atlantic Maritime Ecological Science Cooperative, Huntsman Marine Science Centre) to the Ecological Monitoring and Assessment Network of Environment Canada. http://www.eman-rese.ca/eman/ecotools/protocols/marine/fishes/intro.html#Rationale
This document presents a monitoring protocol for estimating species diversity of bottom dwelling or demersal fish species inhabiting the Canadian continental shelf regions. Monitoring protocols presented in this document can be used to monitor and evaluate fish communities in regions other than the Canadian continental shelf. Methods used to estimate the abundance of different demersal fish species include random stratified sampling and fixed station sampling. Using these standardized procedures helps to maintain precision. Some factors taken into consideration when monitoring fish communities include depth, temperature, salinity, seasonal shifts and diurnal behavior patterns. Additional information found in this document includes size of area and sampling intensity, sampling gear, sampling procedures, and treatment of data. United States Environmental Protection Agency (USEPA). 1992. Monitoring Guidance for
the National Estuary Program. United States Environmental Protection Agency, Office of Water, Office of Wetlands, Washington D.C. EPA Report 842-B-92-004.
This document provides guidance on the design, implementation, and evaluation of the required monitoring programs. It also identifies steps to be taken when developing and implementing estuarine monitoring programs and provides technical basis for discussions on the development of monitoring program objectives, the selection of monitoring program components, and the allocation of sampling effort. Some of the criteria listed for developing a monitoring program and described in this document include: monitoring program objectives, performance criteria, establish testable hypotheses, selection of statistical methods, alternative sampling designs, use of existing monitoring programs, and evaluate monitoring program performance. Additional information on guidelines for developing a monitoring program is described in this document.
United States Environmental Protection Agency (USEPA). 1993. Volunteer Estuary Monitoring, 176 p. In R. L. Ohrel, Jr., and K. M. Register (eds.), A Methods Manual. U.S. Environmental Protection Agency, Washington, D.C., Office of Water. EPA Report- 842-B-93-004. http://www.epa.gov/owow/estuaries/monitor/
This document presents information and methodologies specific to estuarine water quality. Information presented in the first eight chapters include: understanding estuaries and what makes them unique, impacts to estuarine habitats and human’s role in solving the problems; guidance on how to establish and maintain a volunteer monitoring program; guidance for working with volunteers and ensuring that they are well-positioned to collect water quality data safely and effectively; ensuring that the program consistently produces high quality data; and managing the data and making it readily available to data users. Also presented are water quality measures that determine the condition of the estuary are physical (e.g., substrate
70

texture), chemical (e.g., dissolved oxygen) and biological parameters (e.g., plant and animal presence and abundance). The importance of each parameter and methods used to monitor the conditions are described in a gradual process. Proper quality assurance and quality control techniques must also be described in detail to ensure that the data are beneficial to state agencies and other data users.
Virginia Institute of Marine Sciences (VIMS). 1994. Monitoring programs for oyster beds. Virginia Institute of Marine Science, P.O. Box 1346, Gloucester Point, Virginia U.S.A. 23062-1346. Contact information: Dr. Roger Mann, Dept. of Fisheries Science, Virginia Institute of Marine Science, Virginia U.S.A. http://www.vims.edu/mollusc/monrestoration/monoyster.htm#modern
Data was collected by the VIMS Spatfall Survey and the VIMS Dredge Survey oyster bed health in Virginia waters. The VIMS Spatfall Survey deployed shell strings weekly from May through September at stations throughout the Chesapeake Bay to provide an annual index of oyster settlement and recruitment. Shell strings were suspended 0.5 m from the bottom to provide settlement substrate for oyster veligers. After retrieval, oyster spat (recently settled oysters) on the undersides of 10 shells were counted under a dissecting microscope. The average number of spat per shell was calculated for each time and place.
The VIMS Dredge Survey monitored the status of Virginia's public oyster fishery, comprising over 243,000 acres. Oyster bars were sampled annually and dredge was used to assess trends in oyster growth, mortality, and recruitment. Three samples of bottom material were dredged at each location. Half-bushel aliquots (25 quarts) were taken from each sample for processing. The number of spat, small, and market oysters were counted. Averages counts per bushel of bottom material were calculated for comparisons between areas over periods of time. Patent Tong survey was performed in 1993 to provide quantitative estimates of oyster standing stock in Virginia tributaries. At each station a patent tong samples one square meter of bottom. All of the oysters from each sample were examined. The surveys provided data that support management and restoration of Virginia's oyster resource.
Wenner, E. L., and M. Geist. 2001. The National Estuarine Research Reserves Program to Monitor and Preserve Estuarine Waters. Coastal Management 29: 1-17.
The National Estuarine Research Reserve (NERR) sites in 1992 coordinated a program that would attempt to identify and track short-term variability and long-term changes in representative estuarine ecosystems and coastal watersheds. Water quality parameters that were monitored include: pH, conductivity, temperature, dissolved oxygen, turbidity, and water level. Standardized protocols were also used at each site so that sampling, processing, and data management techniques were consistent among sites. Statistical techniques are being used to identify periodicity in water quality variables. Periodic regression analysis indicated that diel periodicity in dissolved oxygen is a larger source of variation than tidal periodicity at sites with less tidal amplitude. Authors of this document stress how understanding the functions of estuaries and how they change over time will help predict how these systems respond to change in climate and anthropogenic sources.
71

Wenzel, T. A. 1992. Minnesota Wetland Restoration Guide. Design Engineer Minnesota Board of Water and Soil Resources, St. Paul, Minnesota. Contact information: Phone # (651) 296-0883, [email protected].
The Minnesota Wetland Restoration Guide provides a comprehensive reference for effective planning, surveying, design, construction, management and maintenance of wetland restoration projects. Information presented in this guide was provided by some experts in the field so that wetland efforts can be improved yielding more precise results. The guide is designed primarily for Minnesota use however the basis for restoring drained wetlands can be used by other states or regions, of course with some modifications being made such as the hydrologic design data to correspond to local or regional conditions. The document focuses on tools needed for site selection, planning of the project, surveying methods used at the site, developing the restoration design, construction of the restoration project, and site management. Additional information on guidelines for wetland restoration can be obtained from the guide.
Zedler, J. B. 2001. Handbook for Restoring Tidal Wetlands, 464p. CRC Press, Boca Raton.
This handbook provides a collection of case studies and principle guidelines to guide tidal restoration management. In this hand book Zedler describes the conceptual planning for coastal wetlands restoration, strategies for management of hydrology and soils, the restoration of vegetation and assemblages of fishes and invertebrates, and the process of evaluating, monitoring, and sustaining restored wetlands. Zedler also highlights parameters that should be monitored and techniques that can be used during restoration. Such parameters that are addressed include: hydrology and topography, water quality, soils, substrate qualities, nutrient dynamics, elevation, species abundance and diversity (vegetation, invertebrates and fishes). Techniques that used to monitor certain parameters include: Global Positioning Systems (GPS) and Geographic Information Systems (GIS). Additional information on parameters monitored and techniques used are described in this handbook.
72