Embed Size (px)
Citation preview
Restoration of Guyton Diagram for Regulation of the Circulation as a Basis for Quantitative Physiological Model Development
J. KOFRÁNEK1, J. RUSZ1,2 1Charles University in Prague, 1st Faculty of Medicine, Department of Pathophysiology, Laboratory of Biocybernetics, Czech Republic
2Czech Technical University in Prague, Faculty of Electrical Engineering, Department of Circuit Theory, Czech Republic
Corresponding author Jan Rusz Department of Circuit Theory Faculty of Electrical Engineering Czech Technical University Technicka 2 166 27 Prague 6 Czech Republic EU e-mail: [email protected]
Short title Restoration of Guyton Diagram
1
Summary
We present the current state of complex circulatory dynamics model development based on
Guyton’s famous diagram. The aim is to provide an open-source model that will allow the
simulation of a number of pathological conditions on a virtual patient including cardiac,
respiratory, and kidney failure. The model will also simulate the therapeutic influence of
various drugs, infusions of electrolytes, blood transfusion, etc. As a current result of
implementation, we describe a core model of human physiology targeting the systemic
circulation, arterial pressure and body fluid regulation, including short- and long-term
regulations. The model can be used for educational purposes and general reflection on
physiological regulation in pathogenesis of various diseases.
Key words
Body fluid homeostasis; Blood pressure regulation; Physiological modelling; Guyton diagram
2
Introduction
The landmark achievement closely associated with integrative physiology development
was the circulatory dynamics model published by prof. A. C. Guyton and his collaborators in
1972 (Guyton et al. 1972). Subsequently, its more detailed description was published in the
monograph one year later (Guyton et al. 1973). This model represents the first large-scale
mathematical description of the body’s interconnected physiological subsystems. The model
was described by a sophisticated graphic diagram with various computing blocks symbolizing
quantitative physiological feedback connections. The diagram was published as a picture and
the actual realization of the model was implemented in the FORTRAN language.
Although the FORTRAN implementation worked correctly, the diagram contains a
number of errors that cause wrong model behaviour. Moreover, FORTRAN implementation is
not in correspondence with this famous graphic diagram, it is almost unavailable nowadays,
and contains several programming and computation-related features that require special
treatment (Thomas et al. 2008). Despite the fact that the model was published over 30 years
ago, it is currently used as a base for a number of research studies in the field of physiology
(Montani and Van Vliet 2009, Osborn et al. 2009) and physiological modelling
(Bassingthwaighte 2000, Hunter et al. 2002, Thomas et al. 2008, Bassingthwaighte 2009),
including research on the physiological consequences of weightlessness in manned space
flight (White et al. 1991, White et al. 2003), or in a new approach to automation in medicine
(Nguyen et al. 2008). In addition, the diagram is still reprinted with the original errors (Hall
2004, Bruce and Montani 2005). The overall revision of the diagram requires exhaustive
search for errors and sophisticated analyses of physiological regulations system.
Here, we present a prototype of a core model of human physiology based on the original
Guyton diagram targeting the short- and long-term regulation of blood pressure, body fluids
and homeostasis of the major solutes. This model also includes the hormonal (antidiuretic
3
hormone, aldosterone and angiotensine) and nervous regulators (autonomic control), and the
main regulatory sensors (baro- and chemo-receptors). Our complex circulatory dynamics
model corresponds to the same graphic notation of the original Guyton diagram and keeps
adheres to its basic physiological principles. While new models are continuously being
developed (Srinivasan et al. 1996, Abram et al. 2007, Hester et al. 2008), our model finally
brings a fully functional modification to the original Guyton diagram, which is more suitable
for a better and deeper understanding of the importance of physiological regulations and their
use in development of many pathophysiological conditions by using simulation experiments.
The resulting model can be used as a baseline for the quantitative physiological model
development designated for physicians’ e-learning and acute care medicine simulators.
Another use of the model is as an effective learning aid for physiological regulation systems
education, connected with biomedical engineering specialization. The model is provided as an
open-source and it is downloadable at <http://physiome.cz/guyton/>.
Methods
Mathematical model of global physiological regulation of blood pressure
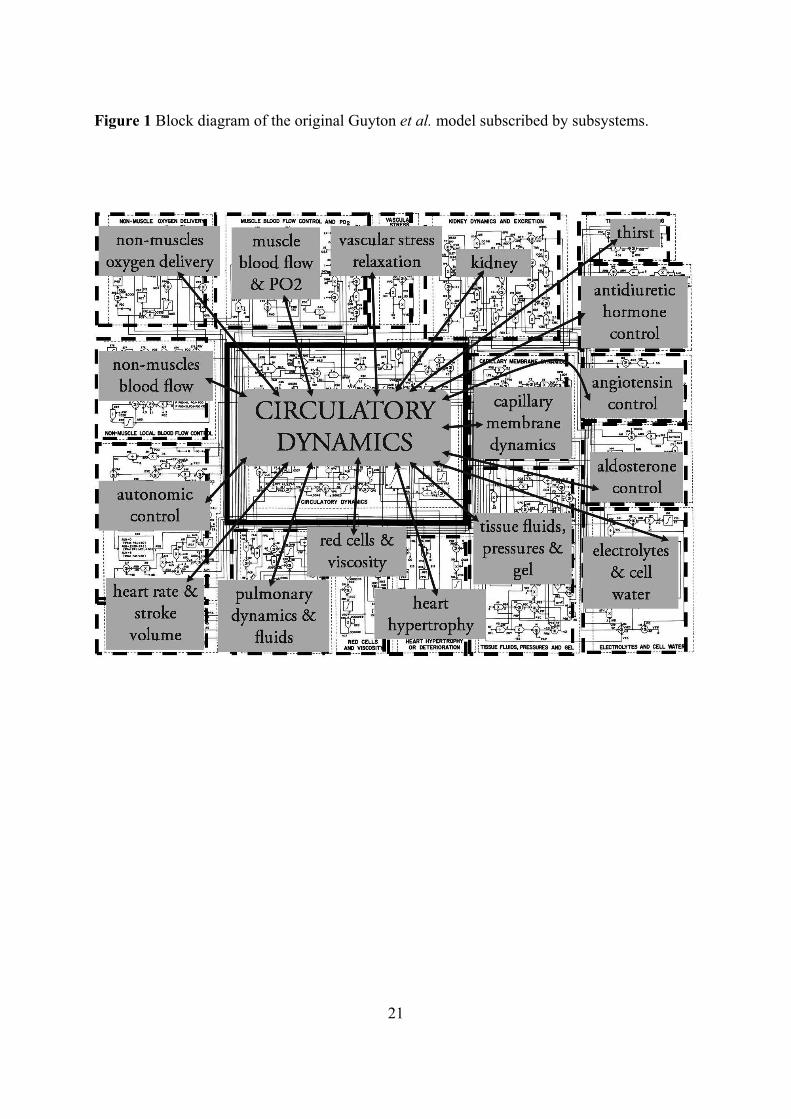
The model consists of 18 modules containing approximately 160 variables and including
36 state variables (see Table 1 for more details). Each module represents an interconnected
physiological subsystem (kidney, tissue fluid, electrolytes, autonomous nervous regulation
and hormonal control including antidiuretic hormone, angiotensine and aldosterone). The
model is constructed around a ‘central’ circulatory dynamics module in interaction with 17
‘peripheral’ modules corresponding to physiological functions (see figure 1) and complete
model targeting the systemic circulation, arterial pressure and body fluid regulation, including
short- and long-term regulations. A graphic presentation of the model allows a display of the
connectivity among all physiological relationships. In essence, the model contains a total of
4
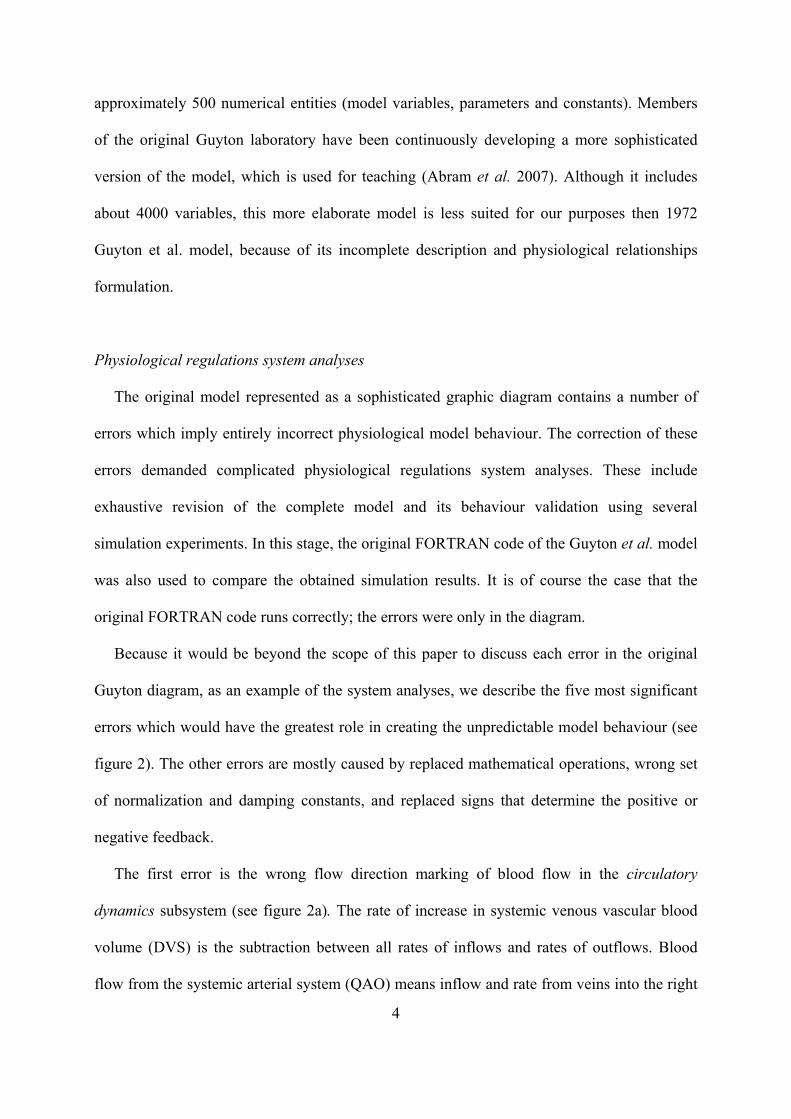
approximately 500 numerical entities (model variables, parameters and constants). Members
of the original Guyton laboratory have been continuously developing a more sophisticated
version of the model, which is used for teaching (Abram et al. 2007). Although it includes
about 4000 variables, this more elaborate model is less suited for our purposes then 1972
Guyton et al. model, because of its incomplete description and physiological relationships
formulation.
Physiological regulations system analyses
The original model represented as a sophisticated graphic diagram contains a number of
errors which imply entirely incorrect physiological model behaviour. The correction of these
errors demanded complicated physiological regulations system analyses. These include
exhaustive revision of the complete model and its behaviour validation using several
simulation experiments. In this stage, the original FORTRAN code of the Guyton et al. model
was also used to compare the obtained simulation results. It is of course the case that the
original FORTRAN code runs correctly; the errors were only in the diagram.
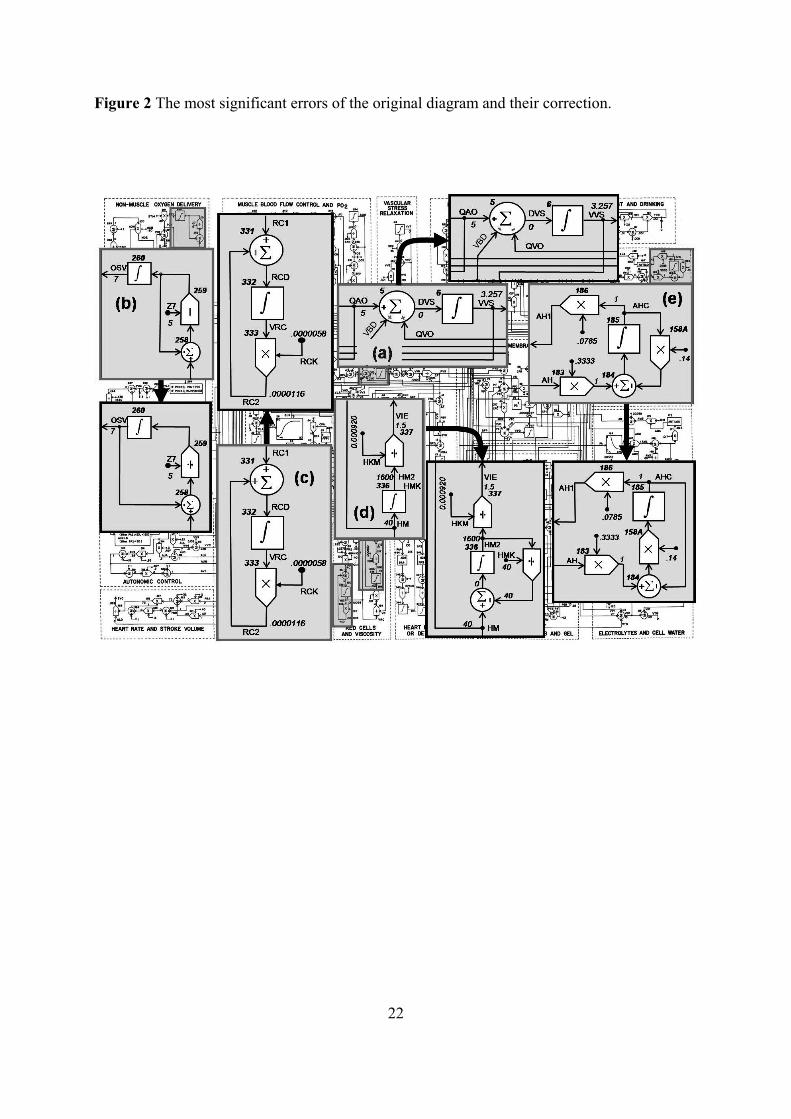
Because it would be beyond the scope of this paper to discuss each error in the original
Guyton diagram, as an example of the system analyses, we describe the five most significant
errors which would have the greatest role in creating the unpredictable model behaviour (see
figure 2). The other errors are mostly caused by replaced mathematical operations, wrong set
of normalization and damping constants, and replaced signs that determine the positive or
negative feedback.
The first error is the wrong flow direction marking of blood flow in the circulatory
dynamics subsystem (see figure 2a). The rate of increase in systemic venous vascular blood
volume (DVS) is the subtraction between all rates of inflows and rates of outflows. Blood
flow from the systemic arterial system (QAO) means inflow and rate from veins into the right
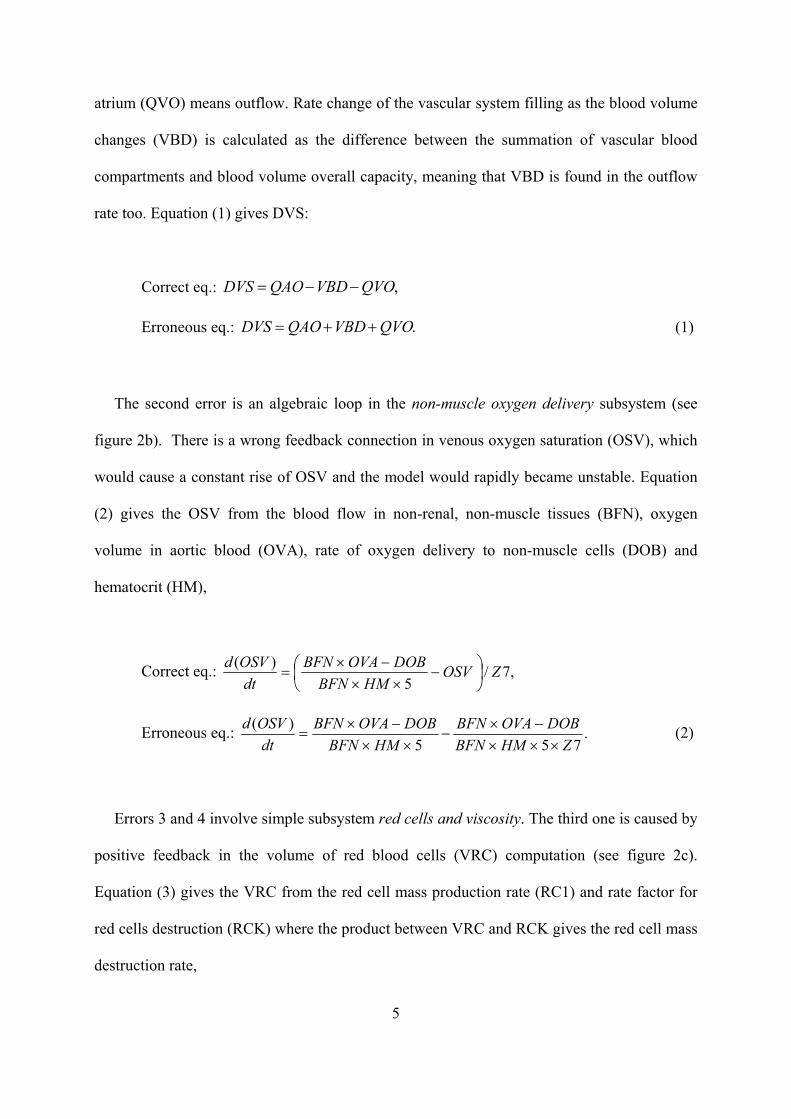
5
atrium (QVO) means outflow. Rate change of the vascular system filling as the blood volume
changes (VBD) is calculated as the difference between the summation of vascular blood
compartments and blood volume overall capacity, meaning that VBD is found in the outflow
rate too. Equation (1) gives DVS:
Correct eq.: ,QVOVBDQAODVS
Erroneous eq.: .QVOVBDQAODVS (1)
The second error is an algebraic loop in the non-muscle oxygen delivery subsystem (see
figure 2b). There is a wrong feedback connection in venous oxygen saturation (OSV), which
would cause a constant rise of OSV and the model would rapidly became unstable. Equation
(2) gives the OSV from the blood flow in non-renal, non-muscle tissues (BFN), oxygen
volume in aortic blood (OVA), rate of oxygen delivery to non-muscle cells (DOB) and
hematocrit (HM),
Correct eq.:
,7/5
)(ZOSV
HMBFN
DOBOVABFN
dt
OSVd
Erroneous eq.:
.755
)(
ZHMBFN
DOBOVABFN
HMBFN
DOBOVABFN
dt
OSVd
(2)
Errors 3 and 4 involve simple subsystem red cells and viscosity. The third one is caused by
positive feedback in the volume of red blood cells (VRC) computation (see figure 2c).
Equation (3) gives the VRC from the red cell mass production rate (RC1) and rate factor for
red cells destruction (RCK) where the product between VRC and RCK gives the red cell mass
destruction rate,
6
Correct eq.:
,1)(
RCKVRCRCdt
VRCd
Erroneous eq.:
.1)(
RCKVRCRCdt
VRCd
(3)
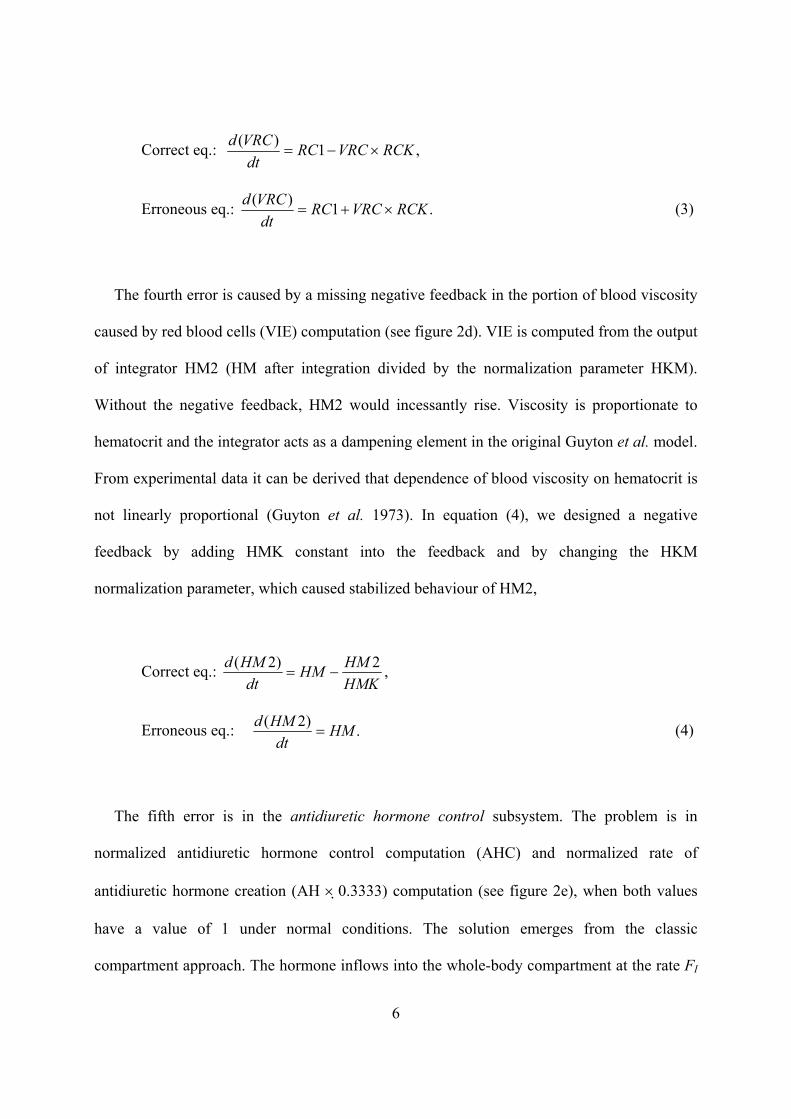
The fourth error is caused by a missing negative feedback in the portion of blood viscosity
caused by red blood cells (VIE) computation (see figure 2d). VIE is computed from the output
of integrator HM2 (HM after integration divided by the normalization parameter HKM).
Without the negative feedback, HM2 would incessantly rise. Viscosity is proportionate to
hematocrit and the integrator acts as a dampening element in the original Guyton et al. model.
From experimental data it can be derived that dependence of blood viscosity on hematocrit is
not linearly proportional (Guyton et al. 1973). In equation (4), we designed a negative
feedback by adding HMK constant into the feedback and by changing the HKM
normalization parameter, which caused stabilized behaviour of HM2,
Correct eq.: HMK
HMHM
dt
HMd 2)2( ,
Erroneous eq.: .
)2(HM
dt
HMd (4)
The fifth error is in the antidiuretic hormone control subsystem. The problem is in
normalized antidiuretic hormone control computation (AHC) and normalized rate of
antidiuretic hormone creation (AH 0.3333) computation (see figure 2e), when both values
have a value of 1 under normal conditions. The solution emerges from the classic
compartment approach. The hormone inflows into the whole-body compartment at the rate FI
7
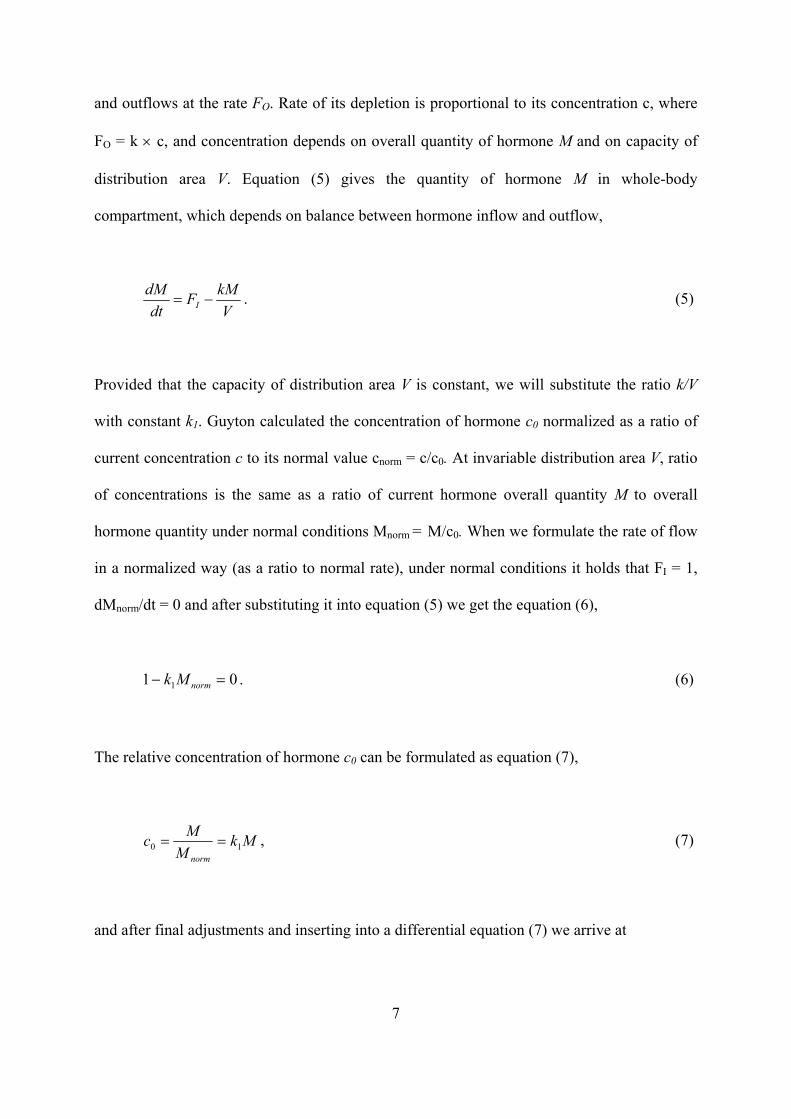
and outflows at the rate FO. Rate of its depletion is proportional to its concentration c, where
FO = k c, and concentration depends on overall quantity of hormone M and on capacity of
distribution area V. Equation (5) gives the quantity of hormone M in whole-body
compartment, which depends on balance between hormone inflow and outflow,
V
kMF
dt
dMI . (5)
Provided that the capacity of distribution area V is constant, we will substitute the ratio k/V
with constant k1. Guyton calculated the concentration of hormone c0 normalized as a ratio of
current concentration c to its normal value cnorm = c/c0. At invariable distribution area V, ratio
of concentrations is the same as a ratio of current hormone overall quantity M to overall
hormone quantity under normal conditions Mnorm = M/c0. When we formulate the rate of flow
in a normalized way (as a ratio to normal rate), under normal conditions it holds that FI = 1,
dMnorm/dt = 0 and after substituting it into equation (5) we get the equation (6),
01 1 normMk . (6)
The relative concentration of hormone c0 can be formulated as equation (7),
Mk
M
Mc
norm10 , (7)
and after final adjustments and inserting into a differential equation (7) we arrive at
8
Correct eq.:
,100 kcF
dt
dcI
(8)
Erroneous eq.: .100 kcF
dt
dcI (9)
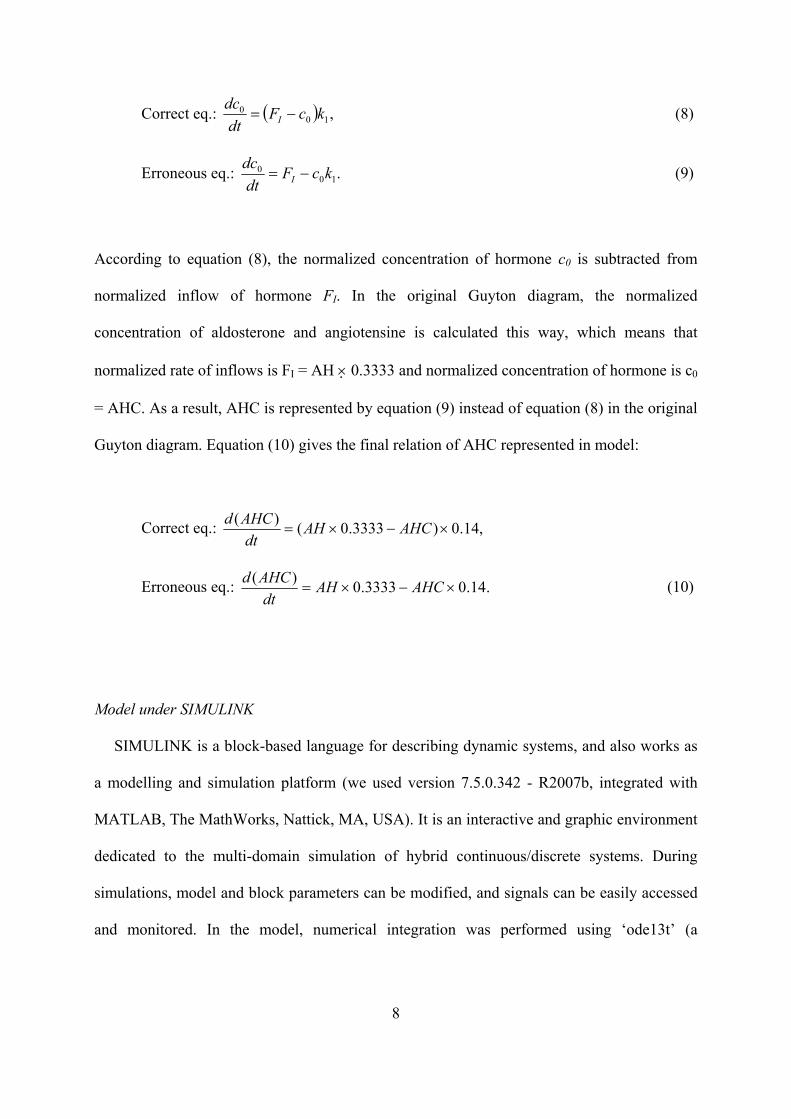
According to equation (8), the normalized concentration of hormone c0 is subtracted from
normalized inflow of hormone FI. In the original Guyton diagram, the normalized
concentration of aldosterone and angiotensine is calculated this way, which means that
normalized rate of inflows is FI = AH 0.3333 and normalized concentration of hormone is c0
= AHC. As a result, AHC is represented by equation (9) instead of equation (8) in the original
Guyton diagram. Equation (10) gives the final relation of AHC represented in model:
Correct eq.:
,14.0)3333.0()(
AHCAHdt
AHCd
Erroneous eq.: .14.03333.0)(
AHCAHdt
AHCd
(10)
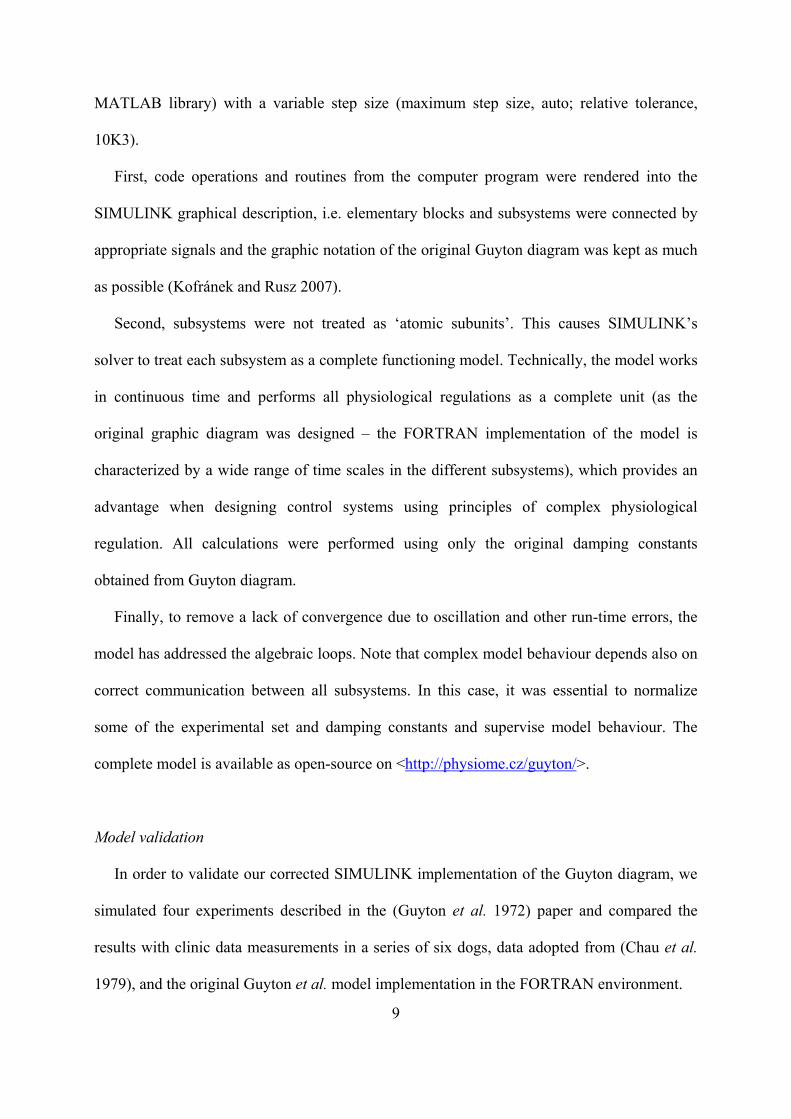
Model under SIMULINK
SIMULINK is a block-based language for describing dynamic systems, and also works as
a modelling and simulation platform (we used version 7.5.0.342 - R2007b, integrated with
MATLAB, The MathWorks, Nattick, MA, USA). It is an interactive and graphic environment
dedicated to the multi-domain simulation of hybrid continuous/discrete systems. During
simulations, model and block parameters can be modified, and signals can be easily accessed
and monitored. In the model, numerical integration was performed using ‘ode13t’ (a
9
MATLAB library) with a variable step size (maximum step size, auto; relative tolerance,
10K3).
First, code operations and routines from the computer program were rendered into the
SIMULINK graphical description, i.e. elementary blocks and subsystems were connected by
appropriate signals and the graphic notation of the original Guyton diagram was kept as much
as possible (Kofránek and Rusz 2007).
Second, subsystems were not treated as ‘atomic subunits’. This causes SIMULINK’s
solver to treat each subsystem as a complete functioning model. Technically, the model works
in continuous time and performs all physiological regulations as a complete unit (as the
original graphic diagram was designed – the FORTRAN implementation of the model is
characterized by a wide range of time scales in the different subsystems), which provides an
advantage when designing control systems using principles of complex physiological
regulation. All calculations were performed using only the original damping constants
obtained from Guyton diagram.
Finally, to remove a lack of convergence due to oscillation and other run-time errors, the
model has addressed the algebraic loops. Note that complex model behaviour depends also on
correct communication between all subsystems. In this case, it was essential to normalize
some of the experimental set and damping constants and supervise model behaviour. The
complete model is available as open-source on <http://physiome.cz/guyton/>.
Model validation
In order to validate our corrected SIMULINK implementation of the Guyton diagram, we
simulated four experiments described in the (Guyton et al. 1972) paper and compared the
results with clinic data measurements in a series of six dogs, data adopted from (Chau et al.
1979), and the original Guyton et al. model implementation in the FORTRAN environment.
10
The first experiment is the simulation of hypertension in a salt-loaded, renal-deficient
patient by decreasing the functional renal mass to ~ 30% of normal and increasing the salt
intake to about five times normal on day 0. This is a very fundamental experiment revealing
the importance of the kidneys in blood-pressure control and their influence in the
development of essential hypertension (Langston et al. 1963, Douglas et al. 1964, Coleman
and Guyton 1969, Cowley and Guyton 1975). The duration of the whole experiment is 12
days.
The second benchmark experiment represents sudden severe muscle exercise and takes
place over a much shorter time scale than other experiments (5 min). The exercise activity
was increased to sixty times the normal resting level by setting the exercise activity-ratio with
respect to activity at rest after 30 second, corresponding to an approximately 15-fold increase
in the whole-body metabolic rate (in this case, the time constant for the local vascular
response to metabolic activity was reduced by 1/40).
The third benchmark experiment simulates the progress of nephrotic edema by increasing
seven-fold the rate of plasma-protein loss on day 1. After seven days, the rate of plasma-
protein loss is reduced to three-times above the norm. The duration of the whole experiment is
12 days.
The fourth benchmark experiment simulates the atrioventricular fistula by opening the
fistula on day 1 (the constant that represents fistula is set to 5%) and closing the fistula on day
5. The duration of the whole experiment is 9 days.
The goodness-of-fit of the model was also compared in terms of the chi-square (χ2) test
between observed simulation results and predicted clinical data.
11
Results
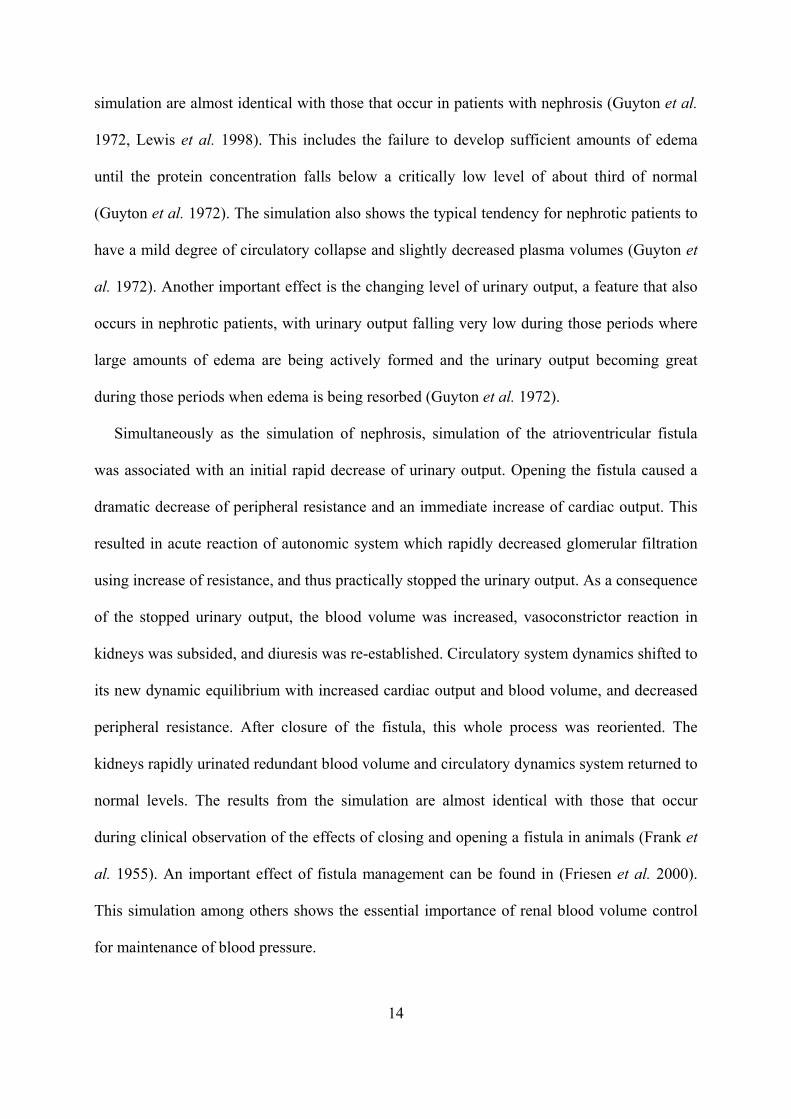
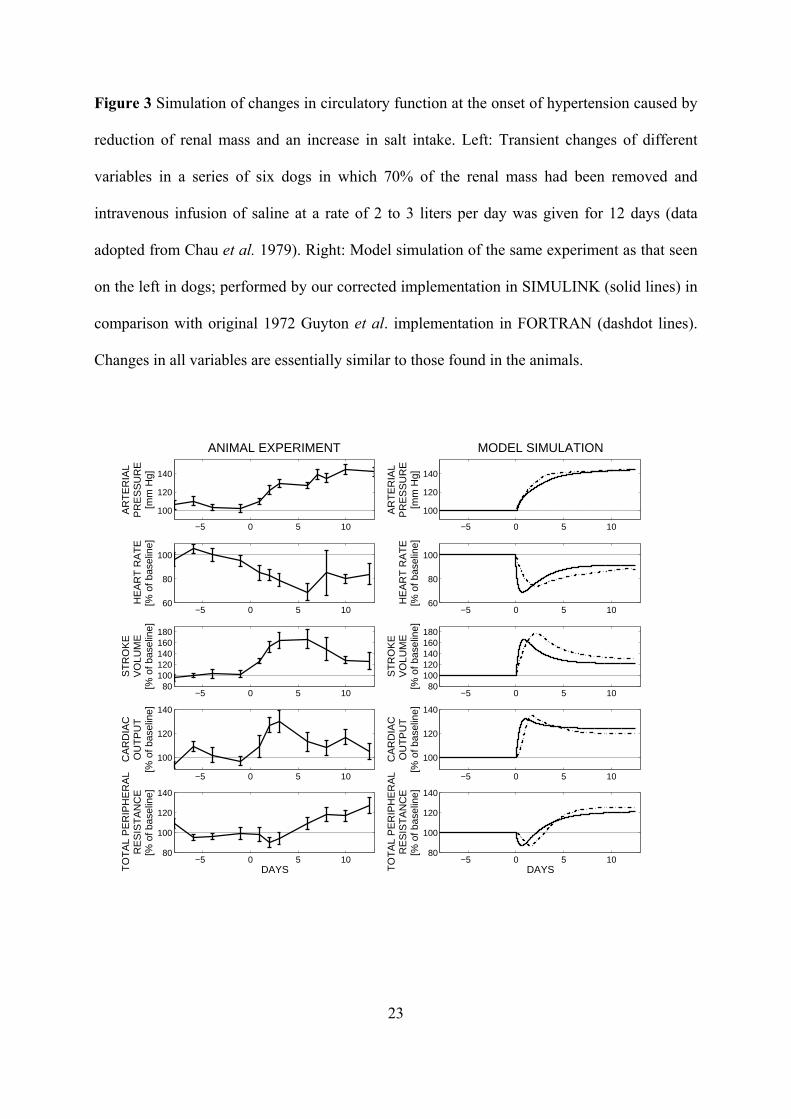
Figure 3 represents the results of the simulation of hypertension (1. experiment). The
cardiac output rose at first to ~ 30% above normal but then was stabilized by the end of 12
days. The arterial pressure rises more slowly, requiring several days to reach high elevation.
During the next days it remained at its new high level indefinitely, as long as the high salt
intake was maintained. The simulation is quite sufficient to predict the available data with
high statistical significances of χ2 (11) = 1445; p < 0.001 for simulation of the arterial
pressure, χ2 (10) = 939; p < 0.001 for simulation of the heart rate, χ2 (10) = 1388; p < 0.001
for simulation of the stroke volume, χ2 (10) = 1189; p < 0.001 for simulation of the cardiac
output, and χ2 (10) = 1304; p < 0.001 for simulation of the total peripheral resistance.
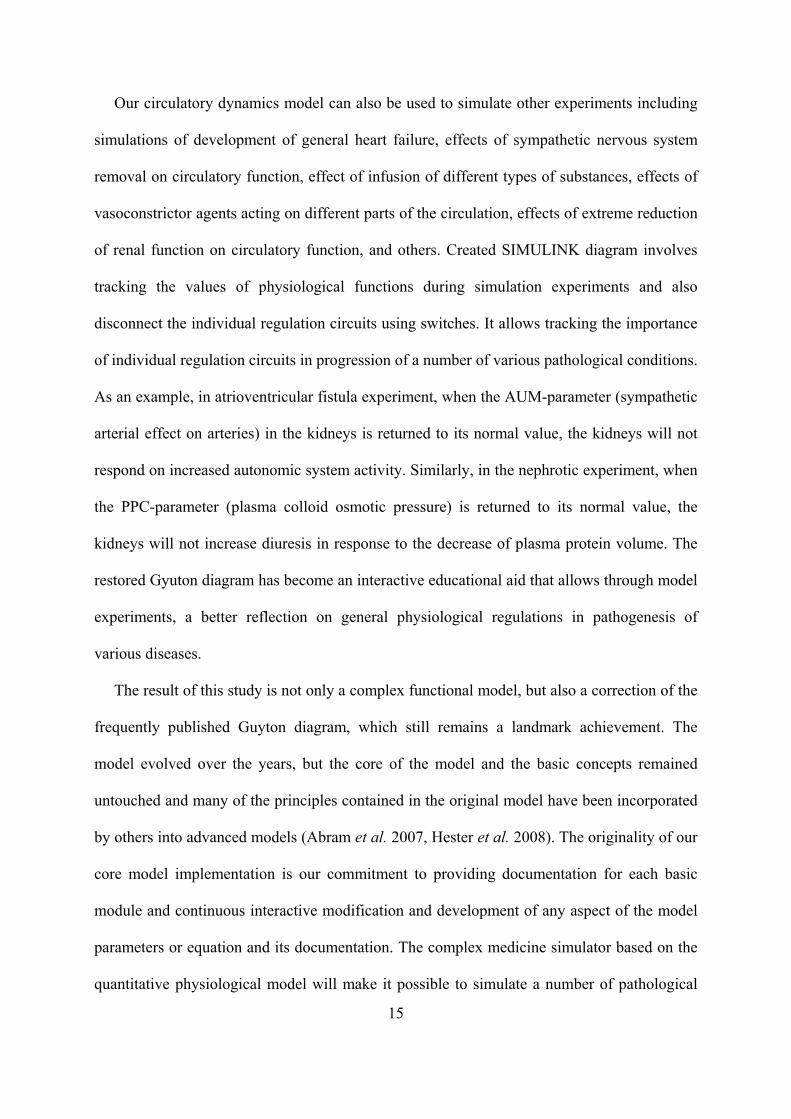
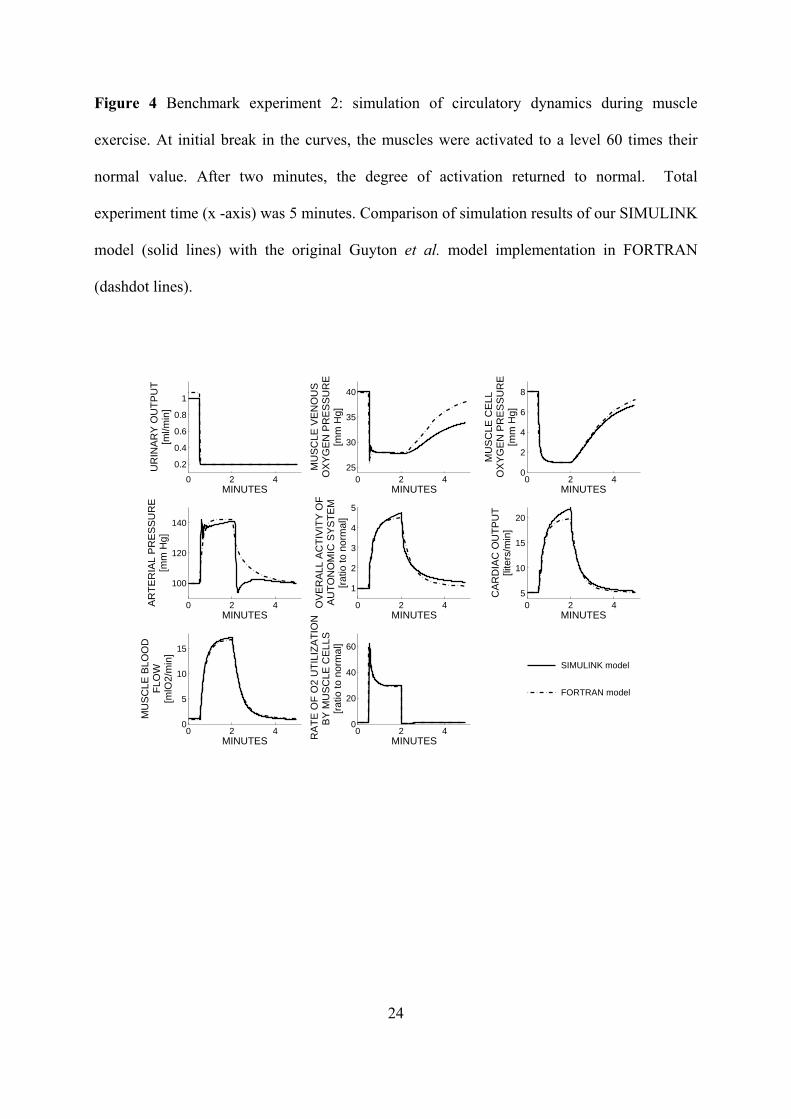
Figure 4 presents the results of the muscle exercise simulation (2. benchmark experiment).
At the onset of exercise, cardiac output and muscle blood flow increased considerably and
within a second. Urinary output fell to its minimal level, while arterial pressure rose
moderately. Muscle cell and venous PO2 fell rapidly. Muscle metabolic activity showed an
instantaneous increase but then decreased considerably because of the development of a
metabolic deficit in the muscles. When exercise was stopped, muscle metabolic activity fell
below normal, but cardiac output, muscle blood flow and arterial pressure remained elevated
for a while as the person was repaying their oxygen dept.
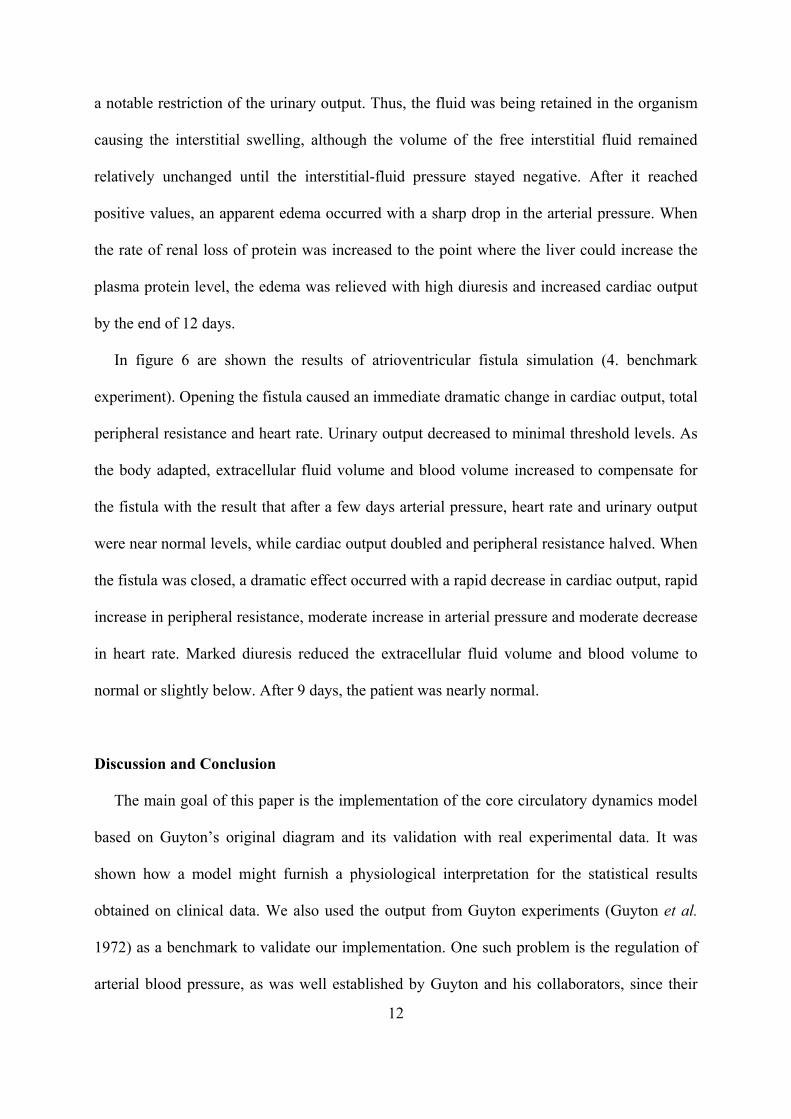
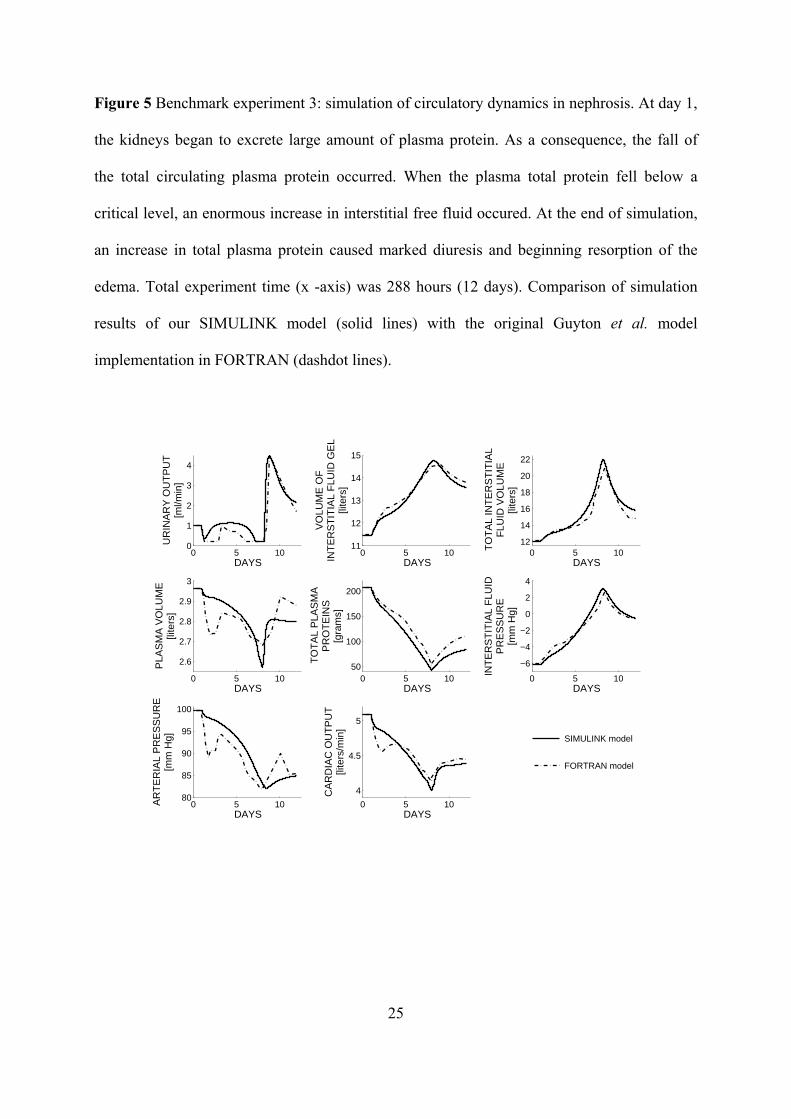
Figure 5 illustrates the results of the nephrosis simulation (3. benchmark experiment). The
principal effect of nephrosis consists of urine protein excretion that may or may not be
associated with any significant changes in other renal functions. A deficit of the total plasma
protein reduces the oncotic pressure, resulting in a fluid redistribution from the blood to the
interstitial compartment and an increase of the (mostly free-) interstitial-fluid volume.
Another effect is mild decreases of cardiac output and arterial pressure. The initial
hypoproteinemia only slightly decreased both arterial pressure and cardiac output but induced
12
a notable restriction of the urinary output. Thus, the fluid was being retained in the organism
causing the interstitial swelling, although the volume of the free interstitial fluid remained
relatively unchanged until the interstitial-fluid pressure stayed negative. After it reached
positive values, an apparent edema occurred with a sharp drop in the arterial pressure. When
the rate of renal loss of protein was increased to the point where the liver could increase the
plasma protein level, the edema was relieved with high diuresis and increased cardiac output
by the end of 12 days.
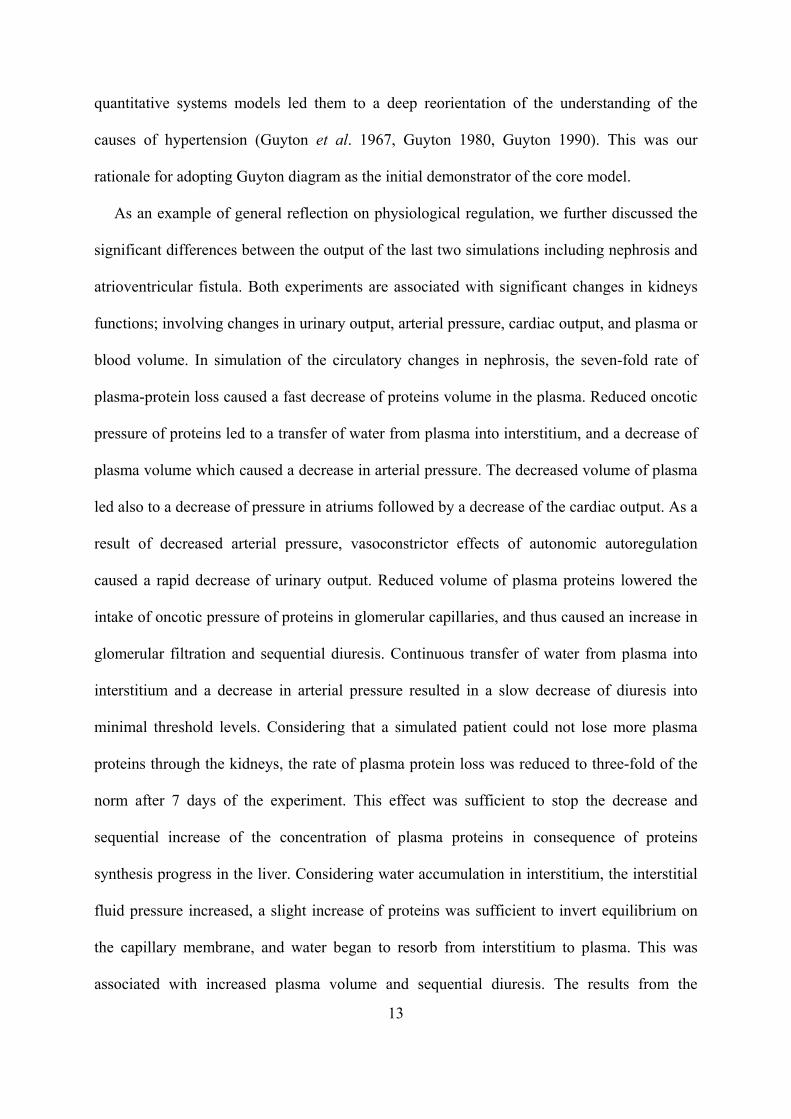
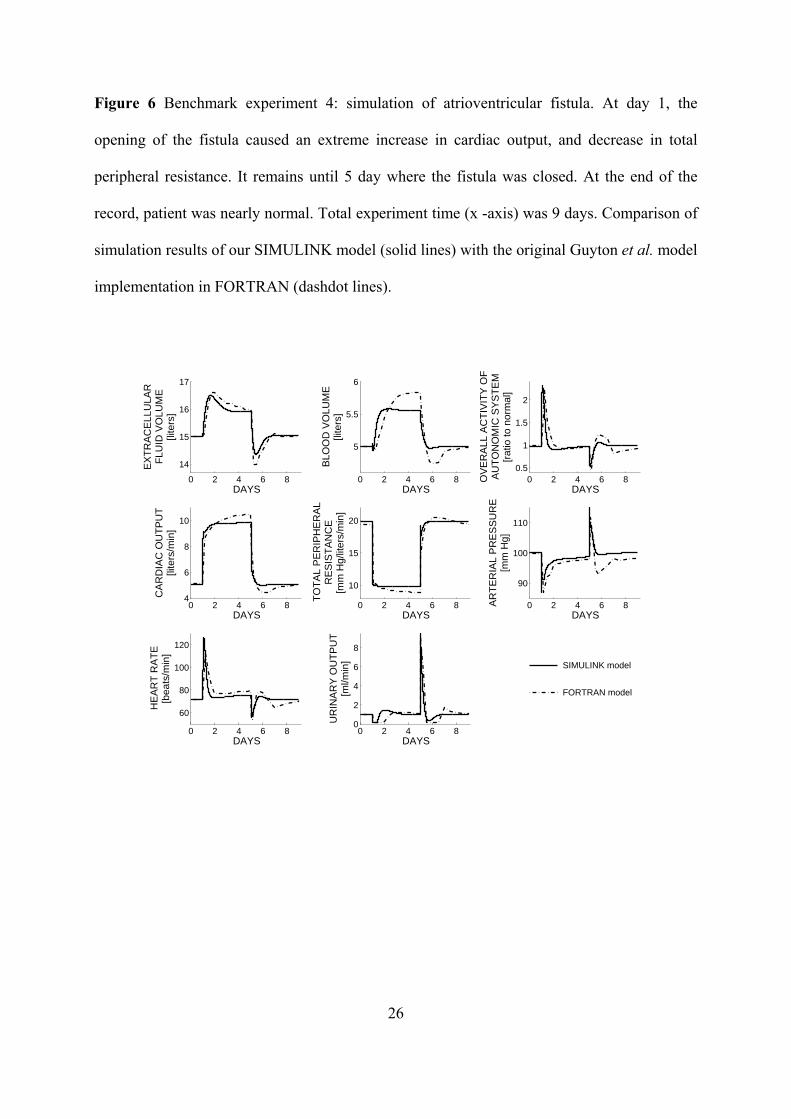
In figure 6 are shown the results of atrioventricular fistula simulation (4. benchmark
experiment). Opening the fistula caused an immediate dramatic change in cardiac output, total
peripheral resistance and heart rate. Urinary output decreased to minimal threshold levels. As
the body adapted, extracellular fluid volume and blood volume increased to compensate for
the fistula with the result that after a few days arterial pressure, heart rate and urinary output
were near normal levels, while cardiac output doubled and peripheral resistance halved. When
the fistula was closed, a dramatic effect occurred with a rapid decrease in cardiac output, rapid
increase in peripheral resistance, moderate increase in arterial pressure and moderate decrease
in heart rate. Marked diuresis reduced the extracellular fluid volume and blood volume to
normal or slightly below. After 9 days, the patient was nearly normal.
Discussion and Conclusion
The main goal of this paper is the implementation of the core circulatory dynamics model
based on Guyton’s original diagram and its validation with real experimental data. It was
shown how a model might furnish a physiological interpretation for the statistical results
obtained on clinical data. We also used the output from Guyton experiments (Guyton et al.
1972) as a benchmark to validate our implementation. One such problem is the regulation of
arterial blood pressure, as was well established by Guyton and his collaborators, since their
13
quantitative systems models led them to a deep reorientation of the understanding of the
causes of hypertension (Guyton et al. 1967, Guyton 1980, Guyton 1990). This was our
rationale for adopting Guyton diagram as the initial demonstrator of the core model.
As an example of general reflection on physiological regulation, we further discussed the
significant differences between the output of the last two simulations including nephrosis and
atrioventricular fistula. Both experiments are associated with significant changes in kidneys
functions; involving changes in urinary output, arterial pressure, cardiac output, and plasma or
blood volume. In simulation of the circulatory changes in nephrosis, the seven-fold rate of
plasma-protein loss caused a fast decrease of proteins volume in the plasma. Reduced oncotic
pressure of proteins led to a transfer of water from plasma into interstitium, and a decrease of
plasma volume which caused a decrease in arterial pressure. The decreased volume of plasma
led also to a decrease of pressure in atriums followed by a decrease of the cardiac output. As a
result of decreased arterial pressure, vasoconstrictor effects of autonomic autoregulation
caused a rapid decrease of urinary output. Reduced volume of plasma proteins lowered the
intake of oncotic pressure of proteins in glomerular capillaries, and thus caused an increase in
glomerular filtration and sequential diuresis. Continuous transfer of water from plasma into
interstitium and a decrease in arterial pressure resulted in a slow decrease of diuresis into
minimal threshold levels. Considering that a simulated patient could not lose more plasma
proteins through the kidneys, the rate of plasma protein loss was reduced to three-fold of the
norm after 7 days of the experiment. This effect was sufficient to stop the decrease and
sequential increase of the concentration of plasma proteins in consequence of proteins
synthesis progress in the liver. Considering water accumulation in interstitium, the interstitial
fluid pressure increased, a slight increase of proteins was sufficient to invert equilibrium on
the capillary membrane, and water began to resorb from interstitium to plasma. This was
associated with increased plasma volume and sequential diuresis. The results from the
14
simulation are almost identical with those that occur in patients with nephrosis (Guyton et al.
1972, Lewis et al. 1998). This includes the failure to develop sufficient amounts of edema
until the protein concentration falls below a critically low level of about third of normal
(Guyton et al. 1972). The simulation also shows the typical tendency for nephrotic patients to
have a mild degree of circulatory collapse and slightly decreased plasma volumes (Guyton et
al. 1972). Another important effect is the changing level of urinary output, a feature that also
occurs in nephrotic patients, with urinary output falling very low during those periods where
large amounts of edema are being actively formed and the urinary output becoming great
during those periods when edema is being resorbed (Guyton et al. 1972).
Simultaneously as the simulation of nephrosis, simulation of the atrioventricular fistula
was associated with an initial rapid decrease of urinary output. Opening the fistula caused a
dramatic decrease of peripheral resistance and an immediate increase of cardiac output. This
resulted in acute reaction of autonomic system which rapidly decreased glomerular filtration
using increase of resistance, and thus practically stopped the urinary output. As a consequence
of the stopped urinary output, the blood volume was increased, vasoconstrictor reaction in
kidneys was subsided, and diuresis was re-established. Circulatory system dynamics shifted to
its new dynamic equilibrium with increased cardiac output and blood volume, and decreased
peripheral resistance. After closure of the fistula, this whole process was reoriented. The
kidneys rapidly urinated redundant blood volume and circulatory dynamics system returned to
normal levels. The results from the simulation are almost identical with those that occur
during clinical observation of the effects of closing and opening a fistula in animals (Frank et
al. 1955). An important effect of fistula management can be found in (Friesen et al. 2000).
This simulation among others shows the essential importance of renal blood volume control
for maintenance of blood pressure.
15
Our circulatory dynamics model can also be used to simulate other experiments including
simulations of development of general heart failure, effects of sympathetic nervous system
removal on circulatory function, effect of infusion of different types of substances, effects of
vasoconstrictor agents acting on different parts of the circulation, effects of extreme reduction
of renal function on circulatory function, and others. Created SIMULINK diagram involves
tracking the values of physiological functions during simulation experiments and also
disconnect the individual regulation circuits using switches. It allows tracking the importance
of individual regulation circuits in progression of a number of various pathological conditions.
As an example, in atrioventricular fistula experiment, when the AUM-parameter (sympathetic
arterial effect on arteries) in the kidneys is returned to its normal value, the kidneys will not
respond on increased autonomic system activity. Similarly, in the nephrotic experiment, when
the PPC-parameter (plasma colloid osmotic pressure) is returned to its normal value, the
kidneys will not increase diuresis in response to the decrease of plasma protein volume. The
restored Gyuton diagram has become an interactive educational aid that allows through model
experiments, a better reflection on general physiological regulations in pathogenesis of
various diseases.
The result of this study is not only a complex functional model, but also a correction of the
frequently published Guyton diagram, which still remains a landmark achievement. The
model evolved over the years, but the core of the model and the basic concepts remained
untouched and many of the principles contained in the original model have been incorporated
by others into advanced models (Abram et al. 2007, Hester et al. 2008). The originality of our
core model implementation is our commitment to providing documentation for each basic
module and continuous interactive modification and development of any aspect of the model
parameters or equation and its documentation. The complex medicine simulator based on the
quantitative physiological model will make it possible to simulate a number of pathological
16
conditions on a virtual patient and the effect of using an artificial organ on normal
physiological function can also be simulated. These include artificial heart, artificial
ventilator, dialysis, and others.
Acknowledgement
This research was supported by the research programs “Studies at the molecular and
cellular levels in normal and in selected clinically relevant pathologic states” MSM
0021620806, and “Transdisciplinary Research in Biomedical Engineering” MSM
6840770012, and by the grants “e-Golem: medical learning simulator of human physiological
functions as a background of e-learning teaching of critical care medicine” MSM 2C06031,
„Analysis and Modelling Biological and Speech Signals” GAČR 102/08/H008, and by the
Grant Agency of the Czech Technical University in Prague SGS10/180/OHK3/2T/13, and by
Creative Connection Ltd.
We are obliged to R. J. White for provision of FORTRAN implementation of the original
Guyton et al. model.
17
References
ABRAM SR, HODNETT BL, SUMMERS RL, COLEMAN TG, HESTER RL: Quantitative
circulatory physiology: an integrative mathematical model of human physiology for
medical education. Adv. Physiol. Educ. 31: 202–210, 2007.
BASSINGTHWAIGHTE JB: Strategies for the Physiome Project. Ann. Biomed. Eng. 28:
1043-1058, 2000.
BASSINGTHWAIGHTE J, HUNTER P, NOBLE D: The Cardiac Physiome: perspectives for
the future. Exp. Physiol. 94: 597-605, 2009.
BRUCE NVV, MONTANI J-P: Circulation and Fluid Volume Control. In: Integrative
Physiology in the Proteomics and Post-Genomics Age. W. Walz (eds), Humana Press,
Totowa, NJ, 2005, pp. 43-66.
CHAU NP, SAFAR ME, LONDON GM, WEISS YA: Essential Hypertension: An Approach
to Clinical data by the Use of Models. Hypertension. 1: 86-97, 1979.
COLEMAN TG, GUYTON AC: Hypertension caused by salt loading in the dog. III. Onset
transients of cardiac output and other circulatory variables. Circ. Res. 25: 152-160,
1969.
COWLEY AW, GUYTON AC: Baroreceptor reflex effects on transient and steady-state
hemodynamics of salt-loading hypertension in dogs. Circ. Res. 36: 536-546, 1975.
DOUGLAS BH, GUYTON AC, LANGSTON JB., BISHOP VS: Hypertension caused by salt
loading. II. Fluid volume and tissue pressure changes. Am. J. Physiol. 207: 669-671,
1964.
FRANK CV, WANG H-H, LAMMERANT J, MILLER R, WEGRIA R: An experimental
study of the immediate hemodynamic adjustments to acute arteriovenous fistulae of
various sizes. J. Clin, Invest. 34: 722-731, 1955.
18
FRIESEN CH, HOWLETT JG, ROSS DB: Traumatic coronary artery fistula management.
Ann. Thorac. Surg. 69: 1973-1982, 2000.
GUYTON AC, COLEMAN TG: Long-term regulation of the circulation: interrelationships
with body fluid volumes. In Physical bases of Circulatory Transport Regulation and
Exchange, edited by E. B. Reeve and A. C. Guyton. Philadelphia, PA: Saunders, 1967,
pp. 179-201.
GUYTON AC, COLEMAN TG, GRANDER HJ: Circulation: Overall Regulation. Ann. Rev.
Physiol. 41:13-41, 1972.
GUYTON AC, JONES CE, COLEMAN TG: Circulatory Physiology: Cardiac Output and Its
Regulation. WB Saunders Company, Philadelphia, 1973, p. 486.
GUYTON AC: Arterial Pressure and Hypertension. Philadelphia, PA: Saunders, 1980.
GUYTON AC: The suprising kidney-fluid mechanism for pressure control—its infinite gain!
Hypertension. 16: 725-730, (1990).
HALL JE: The pioneering use of system analysis to study cardiac output regulation. Am. J.
Physiol. Regul. Integr. Comp. Physiol. 287: 1009-1001, 2004.
HESTER RL, COLEMAN T, SUMMERS R: A multilevel open source integrative model of
human physiology. The FASEB Journal. 22: 756.8, 2008.
HUNTER PJ, ROBINS P, NOBLE D: The IUPS Physiome Project. Pflugers Archiv -
European Journal of Physiology. 445: 1-9, 2002.
KOFRÁNEK J, RUSZ J: From graphic diagrams to educational models. Cesk. Fysiol. 56: 69–
78, 2007.
LANGSTON JB, GUYTON AC, DOUGLAS BH, DORSETT PE: Effect of changes in salt
intake on arterial pressure and renal function in nephrectomized dogs. Circ. Res. 12:
508-513, 1963.
19
LEWIS DM, TOOKE JE, BEAMAN M, GAMBLE H, SHORE AC: Peripheral microvascular
parameters in the nephrotic syndrome. Kidney Int. 54: 1261-1266, 1998.
MANNING RD, COLEMAN TG, GUYTON AC, NORMAN RA, McCAA RE: Essential
role of mean circulatory filling pressure in salt-induced hypertension. Am. J. Physiol.
236: 40-R7, 1979.
MONTANI J-P, VAN VLIET BN: Understanding the contribution of Guyton’s large
circulatory model to long-term control of arterial pressure. Exp. Physiol. 94: 382-388,
2009.
NGUYEN CN, SIMANSKI O, KAHLER R, et al.: The benefits of using Guyton’s model in a
hypotensive control system. Comput. Meth. Prog. Bio. 89: 153-161, 2008.
OSBORN JW, AVERINA VA, FINK GD: Current computational models do not reveal the
importance of the nervous system in long-term control of arterial pressure. Exp.
Physiol. 94: 389-396, 2009.
SRINISAVAN RS, LEONARD JI, WHITE RJ: Mathematical modelling of physiological
states. Space biology and medicine. 3: 559-594, 1996.
THOMAS SR, BACONNIER P, FONTECAVE J, et al.: SAPHIR: a physiome core model of
body fluid homeostasis and blood pressure regulation. Phil. Trans. R. Soc. A. 366:
3175-3197, 2008.
WHITE RJ, LEONARD JI, SRINIVASAN RS, CHARLES JB: Mathematical modelling of
acute and chronic cardiovascular changes during extended duration orbiter (EDO)
flights. Acta Astronaut. 23: 41–51, 1991.
WHITE RJ, BASSINGTHWAIGHTE JB, CHARLES JB, KUSHMERICK MJ, NEWMAN
DJ: Issues of exploration: human health and wellbeing during a mission to Mars. Adv.
Space Res. 31: 7–16, 2003.
20
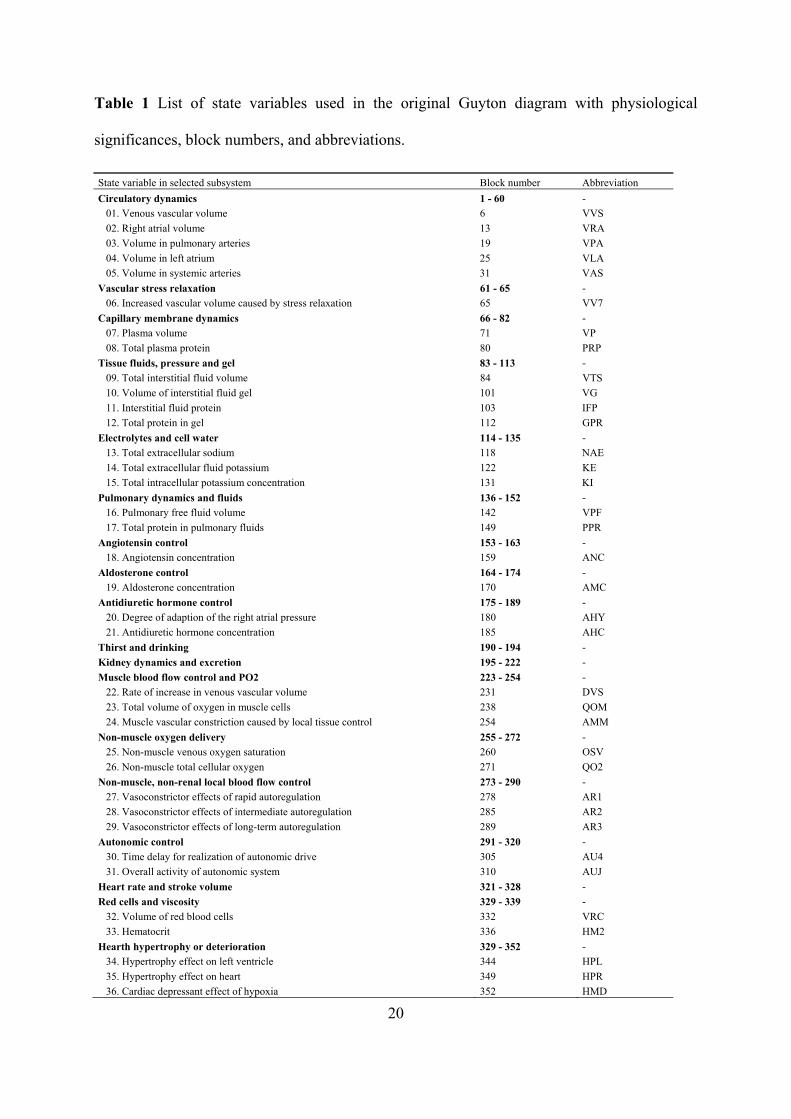
Table 1 List of state variables used in the original Guyton diagram with physiological
significances, block numbers, and abbreviations.
State variable in selected subsystem Block number Abbreviation
Circulatory dynamics 1 - 60 -
01. Venous vascular volume 6 VVS
02. Right atrial volume 13 VRA
03. Volume in pulmonary arteries 19 VPA
04. Volume in left atrium 25 VLA
05. Volume in systemic arteries 31 VAS
Vascular stress relaxation 61 - 65 -
06. Increased vascular volume caused by stress relaxation 65 VV7
Capillary membrane dynamics 66 - 82 -
07. Plasma volume 71 VP
08. Total plasma protein 80 PRP
Tissue fluids, pressure and gel 83 - 113 -
09. Total interstitial fluid volume 84 VTS
10. Volume of interstitial fluid gel 101 VG
11. Interstitial fluid protein 103 IFP
12. Total protein in gel 112 GPR
Electrolytes and cell water 114 - 135 -
13. Total extracellular sodium 118 NAE
14. Total extracellular fluid potassium 122 KE
15. Total intracellular potassium concentration 131 KI
Pulmonary dynamics and fluids 136 - 152 -
16. Pulmonary free fluid volume 142 VPF
17. Total protein in pulmonary fluids 149 PPR
Angiotensin control 153 - 163 -
18. Angiotensin concentration 159 ANC
Aldosterone control 164 - 174 -
19. Aldosterone concentration 170 AMC
Antidiuretic hormone control 175 - 189 -
20. Degree of adaption of the right atrial pressure 180 AHY
21. Antidiuretic hormone concentration 185 AHC
Thirst and drinking 190 - 194 -
Kidney dynamics and excretion 195 - 222 -
Muscle blood flow control and PO2 223 - 254 -
22. Rate of increase in venous vascular volume 231 DVS
23. Total volume of oxygen in muscle cells 238 QOM
24. Muscle vascular constriction caused by local tissue control 254 AMM
Non-muscle oxygen delivery 255 - 272 -
25. Non-muscle venous oxygen saturation 260 OSV
26. Non-muscle total cellular oxygen 271 QO2
Non-muscle, non-renal local blood flow control 273 - 290 -
27. Vasoconstrictor effects of rapid autoregulation 278 AR1
28. Vasoconstrictor effects of intermediate autoregulation 285 AR2
29. Vasoconstrictor effects of long-term autoregulation 289 AR3
Autonomic control 291 - 320 -
30. Time delay for realization of autonomic drive 305 AU4
31. Overall activity of autonomic system 310 AUJ
Heart rate and stroke volume 321 - 328 -
Red cells and viscosity 329 - 339 -
32. Volume of red blood cells 332 VRC
33. Hematocrit 336 HM2
Hearth hypertrophy or deterioration 329 - 352 -
34. Hypertrophy effect on left ventricle 344 HPL
35. Hypertrophy effect on heart 349 HPR
36. Cardiac depressant effect of hypoxia 352 HMD
21
Figure 1 Block diagram of the original Guyton et al. model subscribed by subsystems.
22
Figure 2 The most significant errors of the original diagram and their correction.
23
Figure 3 Simulation of changes in circulatory function at the onset of hypertension caused by
reduction of renal mass and an increase in salt intake. Left: Transient changes of different
variables in a series of six dogs in which 70% of the renal mass had been removed and
intravenous infusion of saline at a rate of 2 to 3 liters per day was given for 12 days (data
adopted from Chau et al. 1979). Right: Model simulation of the same experiment as that seen
on the left in dogs; performed by our corrected implementation in SIMULINK (solid lines) in
comparison with original 1972 Guyton et al. implementation in FORTRAN (dashdot lines).
Changes in all variables are essentially similar to those found in the animals.
−5 0 5 10
100
120
140
AR
TE
RIA
LP
RE
SS
UR
E[m
m H
g]
ANIMAL EXPERIMENT
−5 0 5 1060
80
100
HE
AR
T R
AT
E[%
of b
asel
ine]
−5 0 5 1080
100120140160180
ST
RO
KE
VO
LUM
E[%
of b
asel
ine]
−5 0 5 10
100
120
140
CA
RD
IAC
OU
TP
UT
[% o
f bas
elin
e]
−5 0 5 1080
100
120
140
TO
TA
L P
ER
IPH
ER
AL
RE
SIS
TA
NC
E[%
of b
asel
ine]
DAYS
−5 0 5 10
100
120
140
AR
TE
RIA
LP
RE
SS
UR
E[m
m H
g]
MODEL SIMULATION
−5 0 5 1060
80
100
HE
AR
T R
AT
E[%
of b
asel
ine]
−5 0 5 1080
100120140160180
ST
RO
KE
VO
LUM
E[%
of b
asel
ine]
−5 0 5 10
100
120
140
CA
RD
IAC
OU
TP
UT
[% o
f bas
elin
e]
−5 0 5 1080
100
120
140
DAYSTO
TA
L P
ER
IPH
ER
AL
RE
SIS
TA
NC
E[%
of b
asel
ine]
24
Figure 4 Benchmark experiment 2: simulation of circulatory dynamics during muscle
exercise. At initial break in the curves, the muscles were activated to a level 60 times their
normal value. After two minutes, the degree of activation returned to normal. Total
experiment time (x -axis) was 5 minutes. Comparison of simulation results of our SIMULINK
model (solid lines) with the original Guyton et al. model implementation in FORTRAN
(dashdot lines).
0 2 4
0.2
0.4
0.6
0.8
1
UR
INA
RY
OU
TP
UT
[ml/m
in]
MINUTES0 2 4
25
30
35
40
MU
SC
LE V
EN
OU
SO
XY
GE
N P
RE
SS
UR
E[m
m H
g]
MINUTES0 2 4
0
2
4
6
8
MU
SC
LE C
ELL
OX
YG
EN
PR
ES
SU
RE
[mm
Hg]
MINUTES
0 2 4
100
120
140
AR
TE
RIA
L P
RE
SS
UR
E[m
m H
g]
MINUTES0 2 4
1
2
3
4
5
OV
ER
ALL
AC
TIV
ITY
OF
AU
TO
NO
MIC
SY
ST
EM
[rat
io to
nor
mal
]
MINUTES0 2 4
5
10
15
20
CA
RD
IAC
OU
TP
UT
[lite
rs/m
in]
MINUTES
0 2 40
5
10
15
MU
SC
LE B
LOO
DF
LOW
[mlO
2/m
in]
MINUTES0 2 4
0
20
40
60
RA
TE
OF
O2
UT
ILIZ
AT
ION
BY
MU
SC
LE C
ELL
S[r
atio
to n
orm
al]
MINUTES
FORTRAN model
SIMULINK model
25
Figure 5 Benchmark experiment 3: simulation of circulatory dynamics in nephrosis. At day 1,
the kidneys began to excrete large amount of plasma protein. As a consequence, the fall of
the total circulating plasma protein occurred. When the plasma total protein fell below a
critical level, an enormous increase in interstitial free fluid occured. At the end of simulation,
an increase in total plasma protein caused marked diuresis and beginning resorption of the
edema. Total experiment time (x -axis) was 288 hours (12 days). Comparison of simulation
results of our SIMULINK model (solid lines) with the original Guyton et al. model
implementation in FORTRAN (dashdot lines).
0 5 100
1
2
3
4
UR
INA
RY
OU
TP
UT
[ml/m
in]
DAYS0 5 10
11
12
13
14
15
VO
LUM
E O
FIN
TE
RS
TIT
IAL
FLU
ID G
EL
[lite
rs]
DAYS0 5 10
12
14
16
18
20
22
TO
TA
L IN
TE
RS
TIT
IAL
FLU
ID V
OLU
ME
[lite
rs]
DAYS
0 5 10
2.6
2.7
2.8
2.9
3
PLA
SM
A V
OLU
ME
[lite
rs]
DAYS0 5 10
50
100
150
200
TO
TA
L P
LAS
MA
PR
OT
EIN
S[g
ram
s]
DAYS0 5 10
−6
−4
−2
0
2
4
INT
ER
ST
ITIA
L F
LUID
PR
ES
SU
RE
[mm
Hg]
DAYS
0 5 1080
85
90
95
100
AR
TE
RIA
L P
RE
SS
UR
E[m
m H
g]
DAYS0 5 10
4
4.5
5
CA
RD
IAC
OU
TP
UT
[lite
rs/m
in]
DAYS
FORTRAN model
SIMULINK model
26
Figure 6 Benchmark experiment 4: simulation of atrioventricular fistula. At day 1, the
opening of the fistula caused an extreme increase in cardiac output, and decrease in total
peripheral resistance. It remains until 5 day where the fistula was closed. At the end of the
record, patient was nearly normal. Total experiment time (x -axis) was 9 days. Comparison of
simulation results of our SIMULINK model (solid lines) with the original Guyton et al. model
implementation in FORTRAN (dashdot lines).
0 2 4 6 8
14
15
16
17
EX
TR
AC
ELL
ULA
RF
LUID
VO
LUM
E[li
ters
]
DAYS0 2 4 6 8
5
5.5
6
BLO
OD
VO
LUM
E[li
ters
]
DAYS0 2 4 6 8
0.5
1
1.5
2
OV
ER
ALL
AC
TIV
ITY
OF
AU
TO
NO
MIC
SY
ST
EM
[rat
io to
nor
mal
]
DAYS
0 2 4 6 84
6
8
10
CA
RD
IAC
OU
TP
UT
[lite
rs/m
in]
DAYS0 2 4 6 8
10
15
20
TO
TA
L P
ER
IPH
ER
AL
RE
SIS
TA
NC
E[m
m H
g/lit
ers/
min
]
DAYS0 2 4 6 8
90
100
110
AR
TE
RIA
L P
RE
SS
UR
E[m
m H
g]
DAYS
0 2 4 6 8
60
80
100
120
HE
AR
T R
AT
E[b
eats
/min
]
DAYS0 2 4 6 8
0
2
4
6
8
UR
INA
RY
OU
TP
UT
[ml/m
in]
DAYS
FORTRAN model
SIMULINK model