Embed Size (px)
Citation preview

Restorative Justice Victim Satisfaction Survey
Research report
Research and Evaluation, Ministry of Justice
September 2016

Acknowledgements
The Ministry of Justice would like to thank:
• Those who shared their experiences and views of restorative justice with us. We are
extremely grateful for your willingness to participate. Without your support this research
would not have been possible.
• Restorative Practices Aotearoa and the restorative justice providers around New Zealand
who supported this research.
• Gravitas Research and Strategy Ltd who were contracted to carry out the fieldwork for
this research.
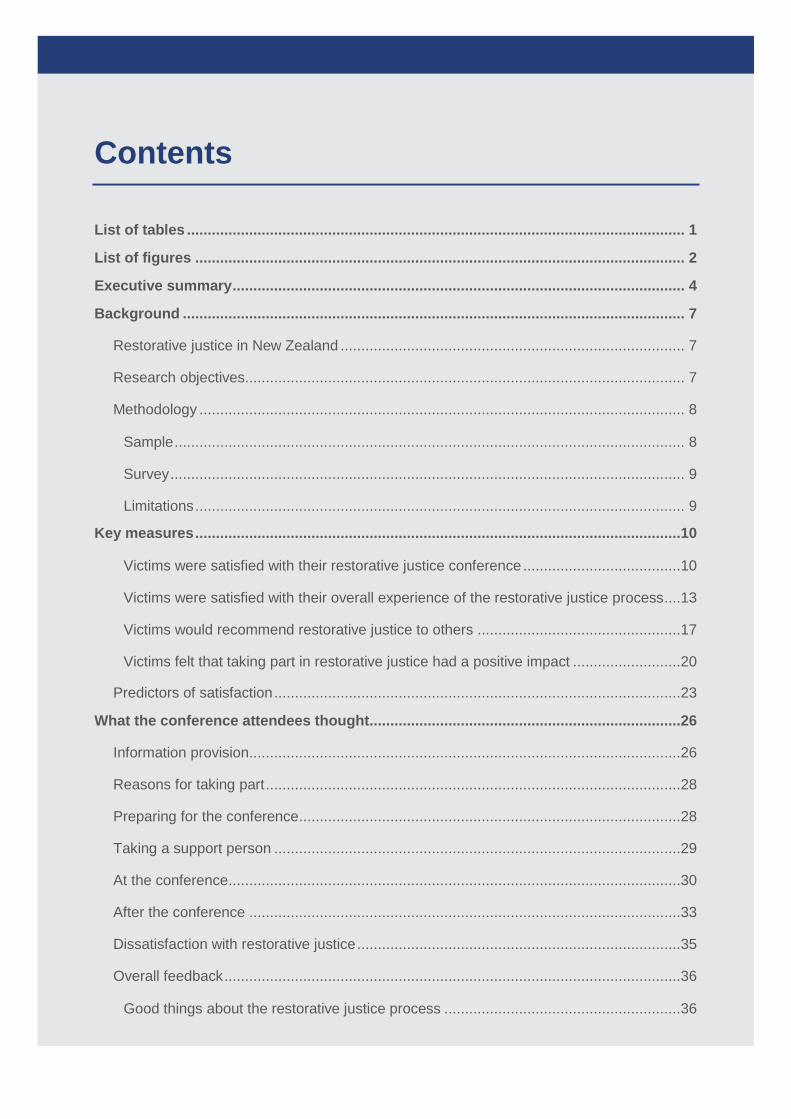
Contents
List of tables ........................................................................................................................ 1
List of figures ...................................................................................................................... 2
Executive summary ............................................................................................................. 4
Background ......................................................................................................................... 7
Restorative justice in New Zealand ................................................................................... 7
Research objectives.......................................................................................................... 7
Methodology ..................................................................................................................... 8
Sample ........................................................................................................................... 8
Survey ............................................................................................................................ 9
Limitations ...................................................................................................................... 9
Key measures .....................................................................................................................10
Victims were satisfied with their restorative justice conference ......................................10
Victims were satisfied with their overall experience of the restorative justice process ....13
Victims would recommend restorative justice to others .................................................17
Victims felt that taking part in restorative justice had a positive impact ..........................20
Predictors of satisfaction ..................................................................................................23
What the conference attendees thought ...........................................................................26
Information provision........................................................................................................26
Reasons for taking part ....................................................................................................28
Preparing for the conference ............................................................................................28
Taking a support person ..................................................................................................29
At the conference .............................................................................................................30
After the conference ........................................................................................................33
Dissatisfaction with restorative justice ..............................................................................35
Overall feedback ..............................................................................................................36
Good things about the restorative justice process .........................................................36
Areas for improvement ..................................................................................................37
What those not attending the conference thought ..........................................................38
Appendices .........................................................................................................................40
Appendix 1: Restorative justice providers ........................................................................40
Appendix 2: Methodology ................................................................................................42
Research design ...........................................................................................................42
Data collection ...............................................................................................................43
Analysis and reporting ...................................................................................................44
Cultural considerations ..................................................................................................49
Ethical considerations ...................................................................................................50
Limitations .....................................................................................................................50
Appendix 3: Sample description .......................................................................................52
Appendix 4: Correlation between selected variables ........................................................54

1
List of tables
Table 1: Factors associated with attendees being less likely to recommend restorative justice
to others compared to all conference attendees ...................................................................35
Table 2: What were good things about victims’ experience of restorative justice ..................36
Table 3: What victims thought could be improved about restorative justice ..........................37
Table 4: Restorative justice providers ...................................................................................40
Table 5: Satisfaction with the restorative justice conference – regression modelling ............46
Table 6: Recommending restorative justice to others – regression modelling .......................47
Table 7: Overall satisfaction with the restorative justice process – regression modelling ......48
Table 8: Positive impact from taking part in restorative justice – regression modelling .........49
Table 9: Description and demographics of respondents .......................................................52
Table 10: Correlation between selected variables ................................................................54
2
List of figures
Figure 1: Victim satisfaction with the restorative justice conference they attended ...............10
Figure 2: Victim satisfaction with restorative justice conference, FV v. non-FV cases ...........11
Figure 3: Victim satisfaction with restorative justice conference by ethnicity .........................11
Figure 4: Victim satisfaction with restorative justice conference by gender ...........................12
Figure 5: Victim satisfaction with restorative justice conference by age group ......................12
Figure 6: Victim satisfaction with overall restorative justice process .....................................13
Figure 7: Victim satisfaction with overall restorative justice process, FV v. non-FV cases ....14
Figure 8: Victim satisfaction with overall restorative justice process by ethnicity ...................14
Figure 9: Victim satisfaction with overall restorative justice process by gender .....................15
Figure 10: Victim satisfaction with overall restorative justice process by age group ..............16
Figure 11: Likelihood of victims recommending restorative justice to others .........................17
Figure 12: Likelihood of victims recommending restorative justice to others, FV v. non-FV
cases ....................................................................................................................................17
Figure 13: Likelihood of victims recommending restorative justice to others by ethnicity ......18
Figure 14: Likelihood of victims recommending restorative justice to others by gender ........18
Figure 15: Likelihood of victims recommending restorative justice to others by age group ...19
Figure 16: How victims felt as a result of taking part in their restorative justice conference ..20
Figure 17: How victims felt as a result of taking part in their restorative justice conference, FV
v. non-FV cases ...................................................................................................................21
Figure 18: How victims felt as a result of taking part in their restorative justice conference by
ethnicity ................................................................................................................................21
Figure 19: How victims felt as a result of taking part in their restorative justice conference by
gender ..................................................................................................................................22
Figure 20: How victims felt as a result of taking part in their restorative justice conference by
age group .............................................................................................................................22
Figure 21: Who first explained restorative justice to the respondent .....................................26
Figure 22: Victim satisfaction with what they were told about restorative justice ...................27

3
Figure 23: Reasons for attending the conference that were rated as important ....................28
Figure 24: Whether respondents took a support person to the conference ...........................29
Figure 25: How victims felt before their restorative justice conference with the offender .......30
Figure 26: Statements about the conference that attendees agreed with .............................31
Figure 27: Percentage of victims who agreed with statements about the facilitator ...............32
Figure 28: Victim satisfaction with the list of suggestions for offender to complete ...............33
Figure 29: Victims’ views of the criminal justice system as a whole after taking part in
restorative justice .................................................................................................................34
Figure 30: How victims felt after meeting with their restorative justice provider .....................39

4
Executive summary
The Restorative Justice Victim Satisfaction Survey measures victims’ experiences of, and
satisfaction with Ministry of Justice-funded restorative justice processes.
What is restorative justice?
Restorative justice is a community-based approach to responding to crime that aims to hold
offenders to account for their offending and, to the extent possible, repair the harm caused to
the victims and community. It aims to give victims a voice in the criminal justice system and
may enable them to receive answers, apologies and reparation. Participation in restorative
justice is voluntary, and usually involves a facilitated face-to face meeting between the victim
and offender.
Who was surveyed?
For this research, victims or their representatives from 24 restorative justice providers around
New Zealand were interviewed via telephone. Of the 329 respondents, most (n=289; 88%)
attended the conference that was held.
The methodology we used
Gravitas Research and Strategy Ltd was commissioned to telephone interview victims for
whom a restorative justice process had been held between 1 January 2015 and 31
December 2015.
The interviews were conducted between 6 May 2016 and 13 June 2016, and were on
average 28 minutes long. It should be noted that the survey findings represent the
experiences and views of the respondents and cannot be extrapolated to represent those of
all victims involved with restorative justice.
Key measures: Most victims were satisfied and would recommend restorative justice
A large majority (84%) of victims were satisfied with the restorative justice conference they
attended. More than three-quarters (80%) said they were satisfied with their overall
experience of restorative justice, before, during and after the conference, and 81% said they
would be likely to recommend restorative justice to others in a similar situation. Almost two-
thirds (64%) reported that the restorative justice meeting made them feel better.

5
Victims felt well prepared for the conference
The majority of victims who attended the conference felt well prepared and well informed.
Most said they were given enough information about what would happen at the conference
(93%) and either had all their questions answered or did not have any questions (87%). Most
attendees were asked for their preference of where (57%) and when (89%) the conference
would occur, and who would be present (95%).
Victims wanted the offender to know the impact of the offence on them
When rating reasons for attending the conference, victims placed the highest importance on
wanting the offender to know what the impact of the offence had been on them (84%).
Victims also felt it was important to express their feelings directly to the offender (84%) and
hoped that it would bring closure (80%).
Most victims thought the conference was well managed
The majority of victims thought the conference was well managed and for 95% it was as had
been described in advance. Most victims (91%) felt safe at the conference, and a further 4%
felt neither safe nor unsafe. In most cases (95%) the victim said the offender had the
opportunity to explain how the offence came about; 56% of victims said they received a full
explanation. The majority (75%) of attendees said they were satisfied with the plan of actions
developed for the offender to complete, and most (85%) victims felt involved in how the
meeting was run.
Follow-up after the conference was important to victims
The majority (61%) of conference attendees said they were contacted by the facilitator after
the conference and most (88%) thought the contact was useful. People who received follow
up contact from the facilitator were significantly more likely to report satisfaction with their
conference and to recommend restorative justice to others.
Benefits of restorative justice
A majority (75%) of respondents were able to name at least one way that restorative justice
had benefited them. A quarter (25%) felt benefit in having their say and telling the offender
how the offence affected them. Other benefits included: ‘I got to hear offender’s point of view
and understand what happened’ (21%) and ‘I feel that I can move on / I got closure’ (17%).
Satisfaction was increased when victims’ voices were heard
Overall satisfaction with restorative justice appeared to be mostly associated with what
happened at the conference. The factors found to best predict overall satisfaction were
wanting to express feelings and speak directly to the offender; being listened to carefully;

6
having concerns and questions treated seriously; and feeling the offender was sincere in
their participation. Gender (women were more satisfied overall than men) and age (victims
aged 20 years or under were more satisfied overall than any other age group) were also
predictive of overall satisfaction.
Victims who did not attend the conference were also satisfied with their contact with the provider
Most (20 of the 29) victims who chose not to attend the conference that was held were
satisfied with the contact they had about potentially attending it, and another 20 said they
would recommend restorative justice to others in a similar situation.

7
Background
Restorative justice in New Zealand
At the time of this research, there were 27 restorative justice providers1 delivering services
for the Ministry of Justice around New Zealand. This report presents findings from a survey
of a sample of victims who had gone through the restorative justice process.
Restorative justice is a community-based approach to responding to crime that aims to hold
offenders to account for their offending and, to the extent possible, repair the harm caused to
the victims and community. It aims to give victims a voice in the criminal justice system and
may enable them to receive answers, apologies and reparation. Participation in restorative
justice is voluntary, and only takes place with the consent of both the victim and offender at
each point in the process.
In New Zealand, restorative justice usually occurs in eligible cases prior to sentencing, after a
guilty plea is entered. Ministry-funded restorative justice typically begins with a court referral
to a restorative justice provider. A restorative justice facilitator will then contact the victim and
offender to assess whether restorative justice is appropriate in the circumstances. The
facilitator considers a number of factors when considering appropriateness, including
whether: all participants will be and feel safe during the restorative justice process, the
offender shows genuine remorse for the offence committed, and the offender shows a desire
to put things right or repair the harm caused. If the facilitator decides it should proceed, then
a conference can be convened between the facilitator, victim and offender, and any other
people approved by the facilitator (such as interpreters or support people).
The restorative justice conference itself usually includes a discussion of what happened, its
impact, and what can be done to put things right and prevent further offending. Facilitators
manage the interaction between the victim and/or community representatives and the
offender, and the development of any agreement or plan between them. After the
conference, the facilitator reports back to the judge about how it went and any agreements
made. The judge can then take this into account in sentencing the offender.
Research objectives
The research objective is to understand victims’ experience of, and level of satisfaction with,
the restorative justice process. In keeping with government priorities, particular comparisons
will be made between:
1 See Appendix 1, page 61.

8
• Family violence (FV) cases and non-FV cases
• Experiences of Māori and non-Māori victims
The research findings will be used to:
• Identify any improvements that can be made to the restorative justice service
• Identify any broader impacts or benefits that victims have experienced as a result of
participating in restorative justice
• Review the quality and effectiveness of the restorative justice service that victims receive
The ministry undertook similar research into victim satisfaction with restorative justice in
2011. This research showed that a large majority (82%) of victims were satisfied with the
restorative justice conference they attended. More than three-quarters (77%) said they were
satisfied with their overall experience of restorative justice, before, during and after the
conference and 80% said they would be likely to recommend restorative justice to others in a
similar situation.
A Sentencing Act amendment came into force in 2014. Before this, people would generally
request a referral to restorative justice if they wanted to engage in the service. The
amendment introduced a new requirement where all district court cases meeting certain
criteria be adjourned prior to sentencing while the appropriateness of restorative justice can
be assessed. As a result of these changes, victims in 2015 may have had a different
experience compared to those who were surveyed in 2011. This may affect comparability
between the 2011 and 2016 surveys.
Methodology
A more detailed methodology is set out in Appendix 2 on page 42.
Sample
A telephone survey was undertaken with 329 victims from 24 of the 27 ministry-funded
restorative justice providers. Of these, 289 had attended a restorative justice conference, 29
had attended a pre-conference meeting but declined to attend the conference, and 11 had
attended the pre-conference meeting and agreed to attend the conference but found that it
did not go ahead for other reasons.
Most of the analysis in this report is limited to the 289 who went through the entire restorative
justice process. Analysis for the group of 29 who chose not to attend is laid out on page 37.
A very small number of people did not answer particular questions and have been excluded
from that particular analysis.
Detailed demographic breakdown is set out in Appendix 3 on page 52.

9
Survey
Victims were eligible for participation if they went through a restorative justice process
between 1 January 2015 and 31 December 2015. Victims were invited to take part in the
telephone survey and these were conducted between 6 May 2016 and 13 June 2016.
Those that chose to take part were asked questions about their initial contact with the
provider, their experience of the restorative justice meeting and any follow-up after the
meeting. Victims were not asked about any offence(s) committed against them.
Limitations
The findings in this report represent the experiences and views of the respondents alone and
should not be used to generalise the experiences of all victims involved with restorative
justice.
Several comparisons or trends reported are not statistically significant at p<0.05. Where
differences are statistically significant these have been explicitly noted in the text as such.
The section ‘What those not attending the conference thought’ (page 39) reports on the
experiences of 29 victims who attended a pre-conference meeting but did not attend a
restorative justice conference. The very small sample size and disparate responses of this
group limits analysis of it. To avoid any misrepresentation of data, the raw numbers of pre-
conference attendees (rather than percentages) have been used in this section.

10
Key measures
This section reports on the four key measures of restorative justice: satisfaction with the
conference, the positive impact of restorative justice, victims’ overall experience, and
whether victims would recommend restorative justice to others.
Victims were satisfied with their restorative justice conference
A large majority (84%) of victims were satisfied with the restorative justice conference they
had attended (Figure 1). This compares to 82% from 2011.
Figure 1: Victim satisfaction with the restorative justice conference they attended
Percentages do not always add to 100% due to rounding. Base number = 288. One respondent did not answer this question.
51%
33%
8%
3%5%
0%
10%
20%
30%
40%
50%
60%
Very satisfied Fairly satisfied Neither satisfied nor dissatisfied
Fairy dissatisfied Very dissatisfied
% o
f co
nfe
ren
ce a
tte
nd
ee
s
11
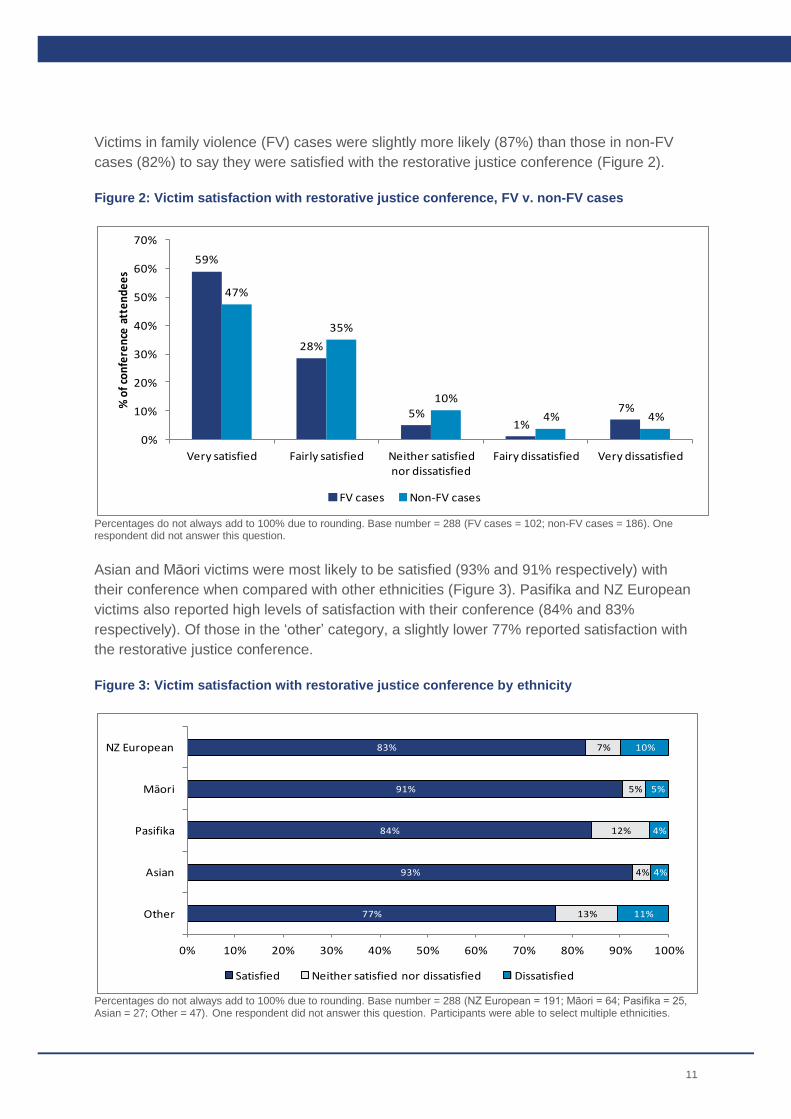
Victims in family violence (FV) cases were slightly more likely (87%) than those in non-FV
cases (82%) to say they were satisfied with the restorative justice conference (Figure 2).
Figure 2: Victim satisfaction with restorative justice conference, FV v. non-FV cases
Percentages do not always add to 100% due to rounding. Base number = 288 (FV cases = 102; non-FV cases = 186). One respondent did not answer this question.
Asian and Māori victims were most likely to be satisfied (93% and 91% respectively) with
their conference when compared with other ethnicities (Figure 3). Pasifika and NZ European
victims also reported high levels of satisfaction with their conference (84% and 83%
respectively). Of those in the ‘other’ category, a slightly lower 77% reported satisfaction with
the restorative justice conference.
Figure 3: Victim satisfaction with restorative justice conference by ethnicity
Percentages do not always add to 100% due to rounding. Base number = 288 (NZ European = 191; Māori = 64; Pasifika = 25, Asian = 27; Other = 47). One respondent did not answer this question. Participants were able to select multiple ethnicities.
59%
28%
5%1%
7%
47%
35%
10%
4% 4%
0%
10%
20%
30%
40%
50%
60%
70%
Very satisfied Fairly satisfied Neither satisfied nor dissatisfied
Fairy dissatisfied Very dissatisfied
% o
f co
nfe
ren
ce a
tte
nd
ee
s
FV cases Non-FV cases
77%
93%
84%
91%
83%
13%
4%
12%
5%
7%
11%
4%
4%
5%
10%
0% 10% 20% 30% 40% 50% 60% 70% 80% 90% 100%
Other
Asian
Pasifika
Māori
NZ European
Satisfied Neither satisfied nor dissatisfied Dissatisfied

12
Figure 4 shows satisfaction levels broken down by gender. Men were more likely (88%) than
women (82%) to be satisfied with their restorative justice conference.
Figure 4: Victim satisfaction with restorative justice conference by gender
Percentages do not always add to 100% due to rounding. Base number = 287 (men = 113; women = 174). One respondent did not answer this question.
There were inconsistent patterns when broken down by age group (Figure 5), with the
highest satisfaction levels among those aged 19 or under (93%), 30-39 years (89%) and over
60 years (88%). Comparatively lower levels were reported among those aged 40-49 (83%),
20-29 (82%) and 50-59 (77%).
Figure 5: Victim satisfaction with restorative justice conference by age group
Percentages do not always add to 100% due to rounding. Base number = 288 (<19 = 15; 20-29 = 60; 30-39 = 64; 40-49 = 64; 50-59 = 52; 60+ = 33). One respondent did not answer this question.
49%
39%
8%
3% 2%
53%
29%
9%
3%7%
0%
10%
20%
30%
40%
50%
60%
Very satisfied Fairly satisfied Neither satisfied or dissatisfied
Fairy dissatisfied Very dissatisfied
% o
f co
nfe
ren
ce a
tte
nd
ee
s
Men Women
88%
77%
83%
89%
82%
93%
6%
8%
11%
5%
13%
6%
15%
6%
6%
5%
7%
0% 10% 20% 30% 40% 50% 60% 70% 80% 90% 100%
60+
50-59
40-49
30-39
20-29
<19
Age
gro
up
Satisfied Neither satisfied nor dissatisfied Dissatisfied

13
Correlation of interest
Facilitator contact after the conference was significantly correlated with satisfaction with the
restorative justice conference. In other words, people who received follow up contact from
the facilitator were more likely to report satisfaction with their conference.
Victims were satisfied with their overall experience of the restorative justice process
Victims were asked how they felt about the overall restorative justice process; before, during
and after the meeting. For this question, 80% of victims reported feeling satisfied (Figure 6).
This compares to 77% from 2011.
Figure 6: Victim satisfaction with overall restorative justice process
Base number = 285. Four respondents did not answer this question. Note: due to rounding the proportion of satisfied respondents appears not to add to 80% (the figure reported).
51%
30%
8%5% 6%
0%
10%
20%
30%
40%
50%
60%
Very satisfied Fairly satisfied Neither satisfied nor dissatisfied
Fairy dissatisfied Very dissatisfied
% o
f co
nfe
ren
ce a
tte
nd
ee
s

14
Victims in family violence cases were more likely (86%) to express overall satisfaction,
compared to 77% of victims in non-family violence cases (Figure 7).
Figure 7: Victim satisfaction with overall restorative justice process, FV v. non-FV cases
Percentages do not always add to 100% due to rounding. Base number = 285 (FV cases = 103; non-FV cases = 182). Four respondents did not answer this question.
The ethnic groups most like to report overall satisfaction were Pasifika (96%), Asian (96%)
and Māori (89%) (Figure 8). Comparatively lower levels of overall satisfaction were reported
by ‘other’ (79%) and by NZ Europeans (77%).
Figure 8: Victim satisfaction with overall restorative justice process by ethnicity
Percentages do not always add to 100% due to rounding. Base number = 285 (NZ European = 190; Māori = 64; Pasifika = 25; Asian = 25; other = 47). Four respondents did not answer this question. Participants were able to select multiple ethnicities.
57%
29%
4% 4% 6%
47%
30%
10%6% 7%
0%
10%
20%
30%
40%
50%
60%
70%
Very satisfied Fairly satisfied Neither satisfied nor dissatisfied
Fairy dissatisfied Very dissatisfied
% o
f co
nfe
ren
ce a
tte
nd
ee
s
FV cases Non-FV cases
79%
96%
96%
89%
77%
9%
4%
3%
9%
13%
4%
8%
14%
0% 10% 20% 30% 40% 50% 60% 70% 80% 90% 100%
Other
Asian
Pasifika
Māori
NZ European
Satisfied Neither satisfied nor dissatisfied Dissatisfied

15
There was a statistically significant difference between NZ European and Māori respondents
in terms of overall satisfaction, with Māori victims expressing higher satisfaction.
When broken down by gender, 74% of men and 85% of women were satisfied with their
overall experience of the restorative justice process — a difference which is statistically
significant (Figure 9).
Figure 9: Victim satisfaction with overall restorative justice process by gender
Percentages do not always add to 100% due to rounding. Base number = 284 (men = 109; women = 175). Four respondents did not answer this question.
44%
30%
9% 8% 8%
55%
30%
7%3% 5%
0%
10%
20%
30%
40%
50%
60%
Very satisfied Fairly satisfied Neither yes nor no Fairy dissatisfied Very dissatisfied
% o
f co
nfe
ren
ce a
tte
nd
ee
s
Men Women

16
By age group, the highest satisfaction levels were among people aged 19 years or under,
with 100% reporting satisfaction with the overall restorative justice process (Figure 10).
Those aged 30-39 were also highly satisfied (87%) with the overall process. Comparatively
lower levels were reported in other age groups; 78% of 20-29 year olds, 78% of 60+ year
olds, 77% of 40-49 year olds, and 75% of 50-59 year olds reported satisfaction with the
overall restorative justice process.
Figure 10: Victim satisfaction with overall restorative justice process by age group
Percentages do not always add to 100% due to rounding. Base number = 285 (<19 = 15; 20-29 = 60; 30-39 = 63; 40-49 = 62; 50-59 = 53; 60+ = 32). Four respondents did not answer this question.
Correlation of interest
There was a strong positive linear correlation between overall satisfaction with restorative
justice and victims’ likelihood of recommending it to others. In other words, those who were
most satisfied with their overall experience were, understandably, more likely to say they
would recommend it to others in a similar situation.
78%
74%
77%
87%
78%
100%
16%
9%
3%
5%
13%
6%
17%
19%
8%
8%
0% 10% 20% 30% 40% 50% 60% 70% 80% 90% 100%
60+
50-59
40-49
30-39
20-29
<19
Age
gro
up
Satisfied Neither satisfied nor dissatisfied Dissatisfied

17
Victims would recommend restorative justice to others
A majority (81%) of victims said they would be likely to recommend restorative justice to
others (Figure 11). This is almost unchanged from 80% in 2011.
Figure 11: Likelihood of victims recommending restorative justice to others
Percentages do not always add to 100% due to rounding. Base number = 284. Five respondents did not answer this question.
Victims in family violence cases were more likely (85%) than those in non-FV cases (78%) to
say they would recommend restorative justice to others in a similar situation (Figure 12).
Figure 12: Likelihood of victims recommending restorative justice to others, FV v. non-FV cases
Percentages do not always add to 100% due to rounding. Base number = 284 (FV cases = 102; non-FV cases = 182). Five respondents did not answer this question.
57%
24%
7%5%
7%
0%
10%
20%
30%
40%
50%
60%
Very likely Fairly likely Neither likely nor unlikely
Fairy unlikely Very unlikely
% o
f co
nfe
ren
ce a
tte
nd
ee
s
62%
24%
5% 4% 6%
54%
24%
9%5%
8%
0%
10%
20%
30%
40%
50%
60%
70%
Very likely Fairly likely Neither likely nor unlikely
Fairy unlikely Very unlikely
% o
f co
nfe
ren
ce a
tte
nd
ee
s
FV cases Non-FV cases

18
Asian and Pasifika victims were also more likely (both 96%) to recommend restorative
justice. This compares to 78% for NZ Europeans and 86% for Māori (Figure 13). Those in the
‘other’ category were comparatively less likely (80%) to recommend restorative justice to
others.
Figure 13: Likelihood of victims recommending restorative justice to others by ethnicity
Percentages do not always add to 100% due to rounding. Base number = 284 (NZ European = 189; Māori = 63; Pasifika = 25; Asian = 26; other = 46). Five respondents did not answer this question. Participants were able to select multiple ethnicities.
When broken down by gender, females were more likely (82%) than males (79%) to
recommend restorative justice to others (Figure 14).
Figure 14: Likelihood of victims recommending restorative justice to others by gender
Percentages do not always add to 100% due to rounding. Base number = 283 (men = 110; women = 173). Five respondents did not answer this question.
80%
96%
96%
86%
78%
7%
4%
6%
8%
13%
4%
8%
14%
0% 10% 20% 30% 40% 50% 60% 70% 80% 90% 100%
Other
Asian
Pasifika
Māori
NZ European
Likely Neither likely nor unlikely Unlikely
49%
30%
6% 5%9%
62%
20%
8%4%
6%
0%
10%
20%
30%
40%
50%
60%
70%
Very likely Fairly likely Neither likely nor unlikely
Fairy unlikely Very unlikely
% o
f co
nfe
ren
ce a
tte
nd
ee
s
Men Women

19
Young people aged 19 years or under were most likely (93%) to recommend restorative
justice to others in a similar situation (Figure 15). People aged 20-29 were very likely (85%)
to recommend restorative justice to others, despite having the second lowest satisfaction
with their restorative justice conference (refer Figure 5). Victims aged 30-39 were also very
likely (84%) to recommend restorative justice, compared to 78% of 60+ year olds, 76% of
50-59 year olds, and 75% of 40-49 year olds.
Figure 15: Likelihood of victims recommending restorative justice to others by age group
Percentages do not always add to 100% due to rounding. Base number = 284 (<19 = 15; 20-29 = 59; 30-39 = 64; 40-49 = 63; 50-59 = 51; 60+ = 32). Five respondents did not answer this question.
Correlations of interest
As expected, there was a strong positive linear correlation between overall satisfaction with
restorative justice and likelihood of recommending it to others.
Other factors that increased victims’ likelihood of recommending restorative justice to others
included:
• Satisfaction with what the offender agreed to do (moderate positive linear correlation)
• Feeling like they had enough information about what was going to happen at the
conference (statistically significant relationship)
• Receiving follow-up contact from the facilitator after the conference (statistically
significant relationship)
• Expressing that restorative justice made them feel better (strong positive linear
correlation)
78%
76%
75%
84%
85%
93%
9%
4%
11%
6%
7%
7%
13%
20%
14%
9%
8%
0% 10% 20% 30% 40% 50% 60% 70% 80% 90% 100%
60+
50-59
40-49
30-39
20-29
<19
Age
gro
up
Likely Neither likely nor unlikely Unlikely

20
Victims felt that taking part in restorative justice had a positive impact
Taking part in the restorative justice conference usually had a positive impact, with 64%
reporting they felt better afterwards (Figure 16). This was down from 2011, when 74% of
victims reported a positive impact, a decrease that is statistically significant.
Figure 16: How victims felt as a result of taking part in their restorative justice conference
Percentages do not always add to 100% due to rounding. Base number = 288. One respondent did not answer this question.
42%
22%25%
3%
8%
0%
5%
10%
15%
20%
25%
30%
35%
40%
45%
A lot better Slightly better No different Slightly worse A lot worse
% o
f co
nfe
ren
ce a
tte
nd
ee
s

21
Victims in family violence cases were more likely (71%) to report feeling better after their
conference, compared to 61% for non-family violence cases (Figure 17).
Figure 17: How victims felt as a result of taking part in their restorative justice conference, FV v. non-FV cases
Percentages do not always add to 100% due to rounding. Base number = 288 (FV cases = 102; non-FV cases = 186). One respondent did not answer this question.
In addition, 74% of Asian and 70% of Māori reported that the restorative justice conference
had a positive impact (Figure 18). This compared to 68% of Pasifika, 61% of NZ European
and 59% of ‘other’ ethnicities.
Figure 18: How victims felt as a result of taking part in their restorative justice conference by ethnicity
Percentages do not always add to 100% due to rounding. Base number = 288 (NZ European = 192; Māori = 63; Pasifika = 25; Asian = 27; other = 46). One respondent did not answer this question. Participants were able to select multiple ethnicities.
46%
25%23%
1%
6%
40%
21%
26%
4%
9%
0%
5%
10%
15%
20%
25%
30%
35%
40%
45%
50%
A lot better Slightly better No different Slightly worse A lot worse
% o
f co
nfe
ren
ce a
tte
nd
ee
s
FV cases Non-FV cases
59%
74%
68%
70%
61%
30%
19%
32%
22%
26%
11%
7%
8%
13%
0% 10% 20% 30% 40% 50% 60% 70% 80% 90% 100%
Other
Asian
Pasifika
Māori
NZ European
Better No different Worse

22
There was a statistically significant difference between genders, with only 53% of men
reporting a positive impact compared to 71% of women (Figure 19).
Figure 19: How victims felt as a result of taking part in their restorative justice conference by gender
Percentages do not always add to 100% due to rounding. Base number = 287 (men = 113; women = 174). One respondent did not answer this question.
Again, there were inconsistent patterns when broken down by age group (Figure 20), with
positive impact experienced by 73% those aged 19 years or under and 72% of those aged
30-39. Positive impact was also reported by 67% of those aged 40-49, 61% of 60+ year olds,
and 60% of 50-59 year olds. Victims aged 20-29 years reported the lowest levels of positive
impact (57%).
Figure 20: How victims felt as a result of taking part in their restorative justice conference by age group
Percentages do not always add to 100% due to rounding. Base number = 288 (<19 = 15; 20-29 = 60; 30-39 = 64; 40-49 = 64; 50-59 = 52; 60+ = 33). One respondent did not answer this question.
33%
20%
31%
4%
12%
48%
24%21%
2%6%
0%
10%
20%
30%
40%
50%
60%
A lot better Slightly better No different Slightly worse A lot worse
% o
f co
nfe
ren
ce a
tte
nd
ee
s
Men Women
61%
60%
67%
72%
57%
73%
21%
27%
17%
25%
35%
20%
18%
13%
16%
3%
8%
7%
0% 10% 20% 30% 40% 50% 60% 70% 80% 90% 100%
60+
50-59
40-49
30-39
20-29
<19
Age
gro
up
Better No different Worse

23
Correlation of interest
There was a strong positive linear relationship between victims who reported that restorative
justice made them feel better and those who said they would recommend restorative justice
to others in a similar situation.
Predictors of satisfaction
Multiple linear regression modelling2 was used to find independent variables that could best
predict the four key measures analysed in this report.
Some of the findings in this section seem counterintuitive and have been marked with an
asterisk. In particular, this relates to two factors: being treated with respect and having the
chance to explain how the offence affected them. Ministry analysts are unable to speculate
why there seems to be reduced satisfaction levels for seemingly positive or beneficial
aspects of the restorative justice process.
Satisfaction with the restorative justice conference
The factors found to best predict satisfaction with the restorative justice conference were:
• Gender (men were more likely than women to report satisfaction with the conference)3
• Having concerns and questions treated seriously (victims whose concerns and questions
were treated seriously were more likely to be satisfied with the conference)
• Feeling the offender was sincere in their participation (victims who felt the offender was
sincere were more likely to be satisfied with the conference)
• Expressing satisfaction with what the offender agreed to do (victims who were satisfied
with what the offender agreed to do were more likely to be satisfied with the conference).
One factor was predictive of reduced levels of satisfaction with the restorative justice
conference:
• Feeling pressured during the meeting (victims who felt pressured during the meeting
were less likely to be satisfied with the conference).
Recommending restorative justice to others
The factors found to predict the likelihood of recommending restorative justice to others
were:
2 The process is outlined in Appendix 2 on page 44.
3 Although women were more likely to report satisfaction with the overall restorative justice process.

24
• Age (victims aged 20 years or under were more likely to recommend restorative justice
than any other age group)
• Wanting to express feelings and speak directly to the offender (the more importance
placed on this, the more likely they were to recommend restorative justice)
• Being listened to carefully (the more victims felt they were listened to, the more likely they
were to recommend restorative justice)
• Having concerns and questions treated seriously (the more victims’ concerns and
questions were treated seriously, the more likely they were to recommend restorative
justice)
• Feeling the offender was sincere in their participation (the more victims felt the offender
was sincere, the more likely they were to recommend restorative justice)
• Expressing satisfaction with what the offender agreed to do (the more satisfied victims
were with what the offender agreed to do, the more likely they were to recommend
restorative justice).
One factor was predictive of reduced likelihood of recommending restorative justice:
• Being treated with respect* (the more victims were treated with respect, the less likely
they were to recommend restorative justice)
Overall satisfaction with the restorative justice process
The factors found to best predict overall satisfaction were:
• Gender (women were more satisfied overall than men)
• Age (victims aged 20 years or under were more satisfied overall than any other age
group)
• Wanting to express feelings and speak directly to the offender (the more importance
placed on this, the more satisfied they were overall)
• Being listened to carefully (the more victims felt they were listened to, the more satisfied
they were overall)
• Having concerns and questions treated seriously (the more victims’ concerns and
questions were treated seriously, the more satisfied they were overall)
• Feeling the offender was sincere in their participation (the more victims felt the offender
was sincere, the more satisfied they were overall)
• Expressing satisfaction with what the offender agreed to do (the more satisfied with what
the offender agreed to do, the more satisfied they were overall).
Two factors were predictive of reduced rates of overall satisfaction:
• Being treated with respect* (the more victims were treated with respect, the less satisfied
they were overall)
• Having the chance to explain how the offence affected them* (the more victims felt they
had a chance to explain the effect of the offence, the less satisfied they were overall).

25
Positive impact from taking part in restorative justice
The factors found to best predict positive impact from taking part in restorative justice were:
• Gender (women were more likely than men to report feeling better as a result of taking
part in the restorative justice conference)
• Hoping that the conference would bring closure (victims who strongly believed the
restorative justice conference would bring closure were more likely to report feeling better
as a result of taking part)
• Feeling the offender was sincere in their participation (victims who felt the offender was
sincere were more likely to report feeling better as a result of taking part in the restorative
justice conference)
• Expressing satisfaction with what the offender agreed to do (victims who were satisfied
with what the offender agreed to do were more likely to report feeling better as a result of
taking part in the restorative justice conference).

26
What the conference attendees thought
This section of the report is about the experiences of the 289 survey respondents who
attended the restorative justice conference that was held.
The majority of attendees were satisfied with the restorative justice process, rated the
facilitators highly and would recommend restorative justice to others in a similar situation.
However a small group of attendees were dissatisfied.
Information provision
Victims found out about restorative justice from a variety of sources, but most (58%) said it
was their provider who first explained it to them (Figure 21).
Figure 21: Who first explained restorative justice to the respondent
Note: an additional 16% of people said they were unable to remember or did not want to answer this question. The ‘other’ category was made up of family member (n=3), already aware of the process (n=3), social worker (n=3), facilitator (n=2), friend (n=1), lawyer, (n=1), magistrate (n=1), boss (n=1), offender (n=1), probation (n=1), Victim Support (n=1) and Work Safe (n=1). Percentages do not always add to 100% due to rounding. Base number = 289.
Victims were also asked who else they had contact with about attending the restorative
justice meeting. There were a variety of additional sources, with 80% of victims speaking with
the restorative justice facilitator, 35% with a victim advisor who worked at the court, and 31%
with the Police.
58%
9% 10%7%
0%
10%
20%
30%
40%
50%
60%
70%
Provider Victim advisor Police Other
% o
f co
nfe
ren
ce a
tte
nd
ee
s
27
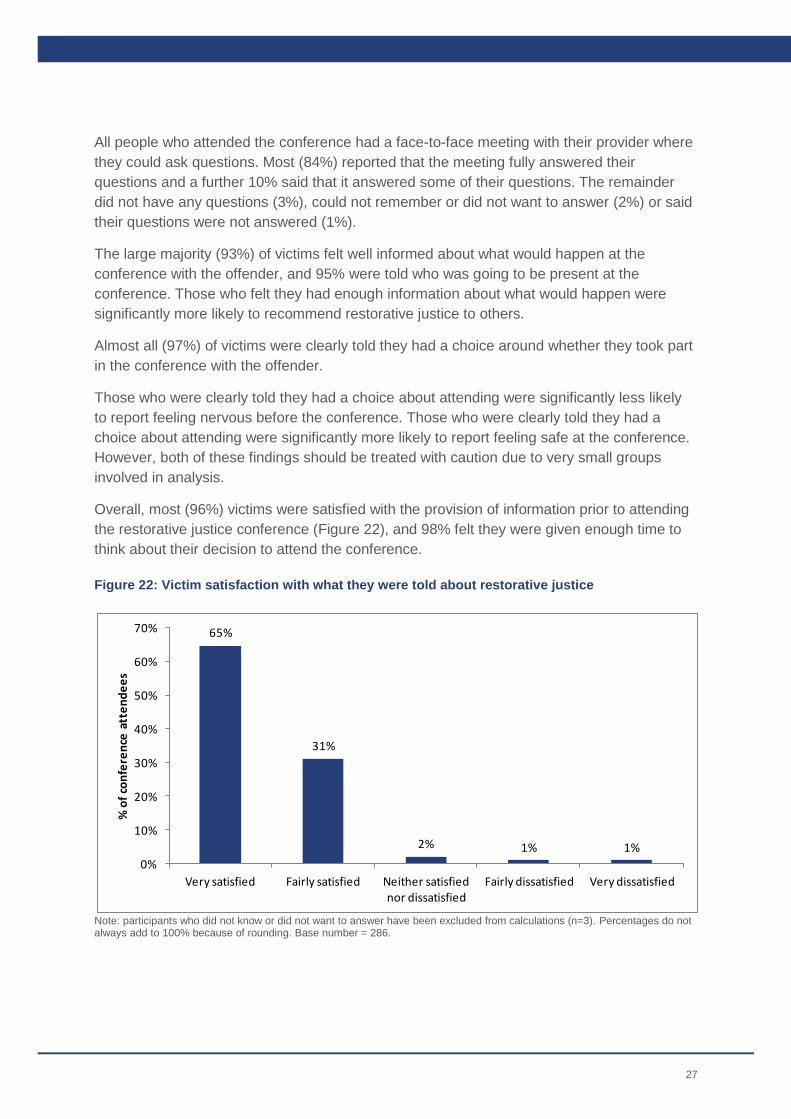
All people who attended the conference had a face-to-face meeting with their provider where
they could ask questions. Most (84%) reported that the meeting fully answered their
questions and a further 10% said that it answered some of their questions. The remainder
did not have any questions (3%), could not remember or did not want to answer (2%) or said
their questions were not answered (1%).
The large majority (93%) of victims felt well informed about what would happen at the
conference with the offender, and 95% were told who was going to be present at the
conference. Those who felt they had enough information about what would happen were
significantly more likely to recommend restorative justice to others.
Almost all (97%) of victims were clearly told they had a choice around whether they took part
in the conference with the offender.
Those who were clearly told they had a choice about attending were significantly less likely
to report feeling nervous before the conference. Those who were clearly told they had a
choice about attending were significantly more likely to report feeling safe at the conference.
However, both of these findings should be treated with caution due to very small groups
involved in analysis.
Overall, most (96%) victims were satisfied with the provision of information prior to attending
the restorative justice conference (Figure 22), and 98% felt they were given enough time to
think about their decision to attend the conference.
Figure 22: Victim satisfaction with what they were told about restorative justice
Note: participants who did not know or did not want to answer have been excluded from calculations (n=3). Percentages do not always add to 100% because of rounding. Base number = 286.
65%
31%
2% 1% 1%
0%
10%
20%
30%
40%
50%
60%
70%
Very satisfied Fairly satisfied Neither satisfied nor dissatisfied
Fairly dissatisfied Very dissatisfied
% o
f co
nfe
ren
ce a
tte
nd
ee
s

28
Reasons for taking part
To try and determine why conference attendees chose to take part in the restorative justice
conference, they were asked to rate the importance of 11 statements (Figure 23). The
highest importance was placed on wanting to express the impact of the offence (84%) and
wanting to express feelings and speak to the offender (84%).
Figure 23: Reasons for attending the conference that were rated as important
Base number = 289.
Differences between FV and non-FV cases were also examined. Victims in FV cases were
significantly more likely (81%) to emphasise the importance of receiving an explanation from
the offender when compared to non-FV cases (69%). FV victims were also significantly more
likely to value bringing closure (89% versus 75%).
There was no statistically significant difference between Māori and non-Māori respondents in
how they answered this question.
Preparing for the conference
A majority (82%) of victims had a face-to-face meeting with their facilitator to prepare for their
restorative justice conference with the offender. At this meeting, more than half (57%) were
asked where they would like the conference to be held and most (89%) were asked when
would suit them.
39%
47%
63%
66%
68%
70%
72%
73%
80%
84%
84%
0% 10% 20% 30% 40% 50% 60% 70% 80% 90%
To avoid going to court
To have the offender make reparation
To help the offender
Felt a duty to take part
To have a say in what happenend to the offender
To have questions about the offence answered
To receive an apology from the offender
To receive an explanation from the offender
To bring closure
To express feelings and speak to the offender
To express the impact of the offence
% of conference attendees

29
Taking a support person
A large majority (91%) of victims were encouraged to take a support person to their
restorative justice conference. However, slightly more than half (53%) actually took a support
person with them. The relationship between family violence referrals and bringing a support
person was found to be significant when compared to other referral types (Figure 24).
Figure 24: Whether respondents took a support person to the conference
Percentages do not always add to 100% because of rounding. Base number = 289 (FV cases = 103; non-FV cases = 186).
There were no statistically significant differences between Māori and non-Māori respondents
in whether they took a support person.
People who took a support person
Of those who did take a support person to the conference, 76% said it made the process
easier and 18% said it had no effect. Only 4% said that it made it harder to attend the
restorative justice conference. However, 8% of victims in FV cases said that taking a support
person made it harder for them to attend the conference — a difference that is statistically
significant. This means that while FV victims were more likely to take a support person, they
were also more likely to say that having a support person made it harder to attend the
conference.
There were no significant differences between Māori and non-Māori respondents in whether
they took a support person.
When asked to explain why having a support person made the restorative justice conference
easier, victims gave a variety of responses. The most common were ‘they knew what I had
been through / it affected us both’ (24%), ‘they could support me emotionally’ (22%) and ‘I
was more comfortable/secure having them there’ (20%).
61%
48%53%
39%
52%47%
0%
10%
20%
30%
40%
50%
60%
70%
FV cases Non-FV cases Total
% o
f co
nfe
ren
ce a
tte
nd
ee
s
Took support person Did not take support person

30
Only six people said having a support person made things harder. Their reasons were varied
but included: ‘there were things I didn’t want them to hear’ (n=2), ‘it was harder to open up’
(n=1) and ‘I didn’t want them involved’ (n=1). Twenty-seven people said that having a
support person had no effect. The most common explanation was ‘I am a strong person and
didn’t need emotional support’ (n=8). Notably, those who took a support person to the
conference were significantly more likely to report feeling nervous before the meeting.
People who didn’t take a support person
Those who did not take a support person to the conference mostly said they did not want or
need a support person (65%), that it was their private business (10%), and they were
comfortable and confident without one (8%). Of note, one person reported that their facilitator
had said a support person would not be necessary.
Most (68%) respondents who did not take a support person thought it would have had no
effect if they had taken one; 16% thought it would have made the conference harder and
10% said it would have made it easier. When asked to explain this response, participants
said: ‘I didn’t feel like I needed a support person / could resolve it without one’ (20%), ‘I am
confident / a strong person’ (17%), and ‘I prefer to do things by myself / it’s a personal matter’
(14%).
At the conference
Over half (58%) of participants reported some degree of nervousness prior to their
conference with the offender (Figure 25). However, a reasonable proportion (40%) said they
did not feel at all nervous.
Figure 25: How victims felt before their restorative justice conference with the offender
Percentages do not always add to 100% because of rounding. Base number = 289.
20%
38%40%
1%
0%
5%
10%
15%
20%
25%
30%
35%
40%
45%
Very nervous Nervous Not at all nervous Don't know / can't remember
% o
f co
nfe
ren
ce a
tte
nd
ee
s

31
Those who were clearly told they had a choice about attending were more likely to report
feeling nervous before the conference. However, this finding should be treated with caution
due to very small groups involved in analysis.
Taking a support person to the conference was positively correlated with feeling nervous (a
statistically significantly relationship).
Most (61%) people had two facilitators running their restorative justice conference, with 26%
having only one facilitator and 10% having more than two facilitators. Respondents were able
to remember and identify a variety of people who attended the conference in addition to the
victim, offender and facilitator/s. These included, but were not limited to:
Supporters for the victim (49%)
Supporters for the offender (45%)
Another victim (6%)
Police (4%)
Community representatives or panel members (3%)
Statements about the conference
Attendees were asked whether they agreed or disagreed with 11 statements about how the
conference was run. Attendees were happy with most aspects of the conference, with 96%
feeling they had the chance to explain the offence’s effect and 96% having the opportunity to
say what they wanted (Figure 26).
Figure 26: Statements about the conference that attendees agreed with
Base number = 289.
11%
17%
63%
84%
85%
87%
91%
91%
95%
96%
96%
0% 10% 20% 30% 40% 50% 60% 70% 80% 90%100%
You felt pressured during the meeting
You were scared to say what you really felt
You felt the offender was sincere
You were listened to carefully
You felt involved in how the meeting was run
Your concerns / questions were treated seriously
You were treated with respect
You felt safe
You understood what was going on
You had the opportunity to say what you wanted
You had the chance to explain the offence's effect
32
A large majority (95%) of attendees said that the conference ended up being the same as it
was described to them in the pre-conference meeting.
Those who were clearly told they had a choice about attending were significantly more likely
to report feeling safe at the conference. However, this finding should be treated with caution
due to very small groups involved in analysis.
A proportion (17%) of attendees said they felt scared to say what they really felt at the
conference. It is worth noting that 61% of these respondents said they had a support person
with them at the conference (compared to 53% for all conference attendees), and this group
was more likely to have felt nervous about attending the meeting (67% versus 58% for all
attendees).
There were no significant differences between FV and non-FV cases in how they responded
to the statements in Figure 26. Similarly, Māori and non-Māori groups showed no significant
differences.
In nearly all (95%) cases victims said that offenders were given a chance to explain how the
offence came about. Of this group, 56% of victims said they received a full explanation and a
further 34% received a partial explanation. Of note, 4% received an explanation but did not
trust it or think the explanation was true. More than half (57%) of victims were happy with the
explanation they received from the offender.
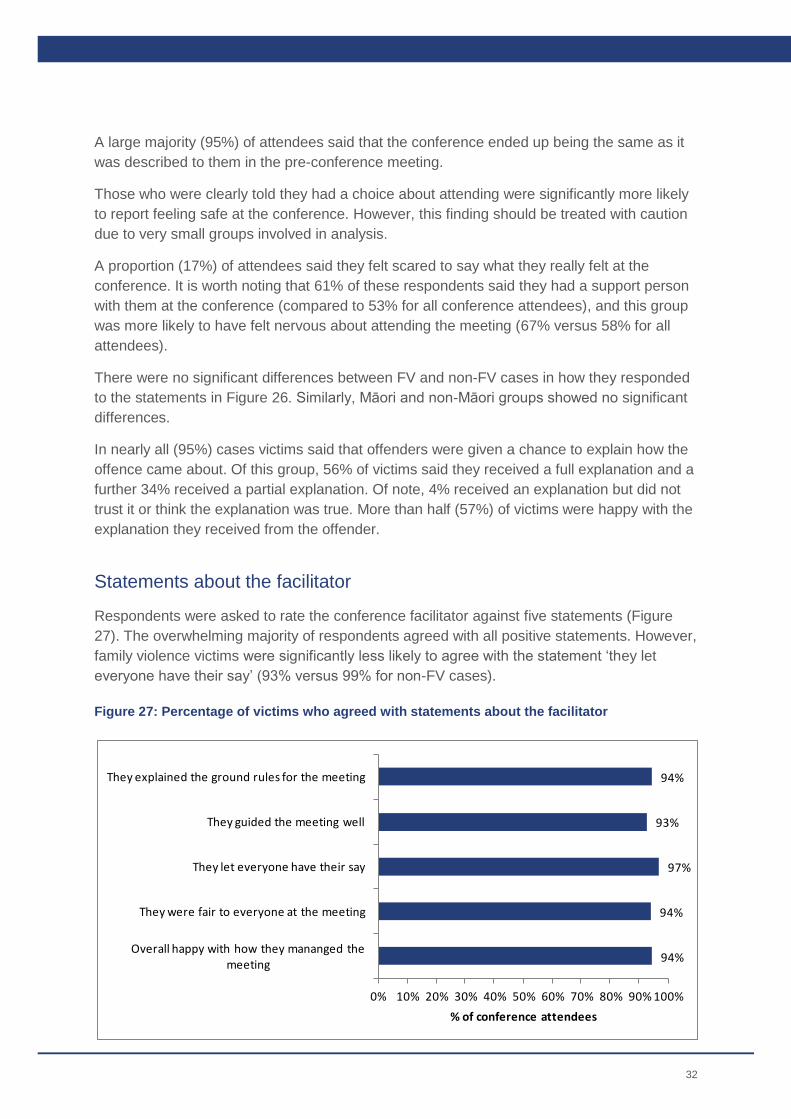
Statements about the facilitator
Respondents were asked to rate the conference facilitator against five statements (Figure
27). The overwhelming majority of respondents agreed with all positive statements. However,
family violence victims were significantly less likely to agree with the statement ‘they let
everyone have their say’ (93% versus 99% for non-FV cases).
Figure 27: Percentage of victims who agreed with statements about the facilitator
94%
94%
97%
93%
94%
0% 10% 20% 30% 40% 50% 60% 70% 80% 90% 100%
Overall happy with how they mananged the meeting
They were fair to everyone at the meeting
They let everyone have their say
They guided the meeting well
They explained the ground rules for the meeting
% of conference attendees
33
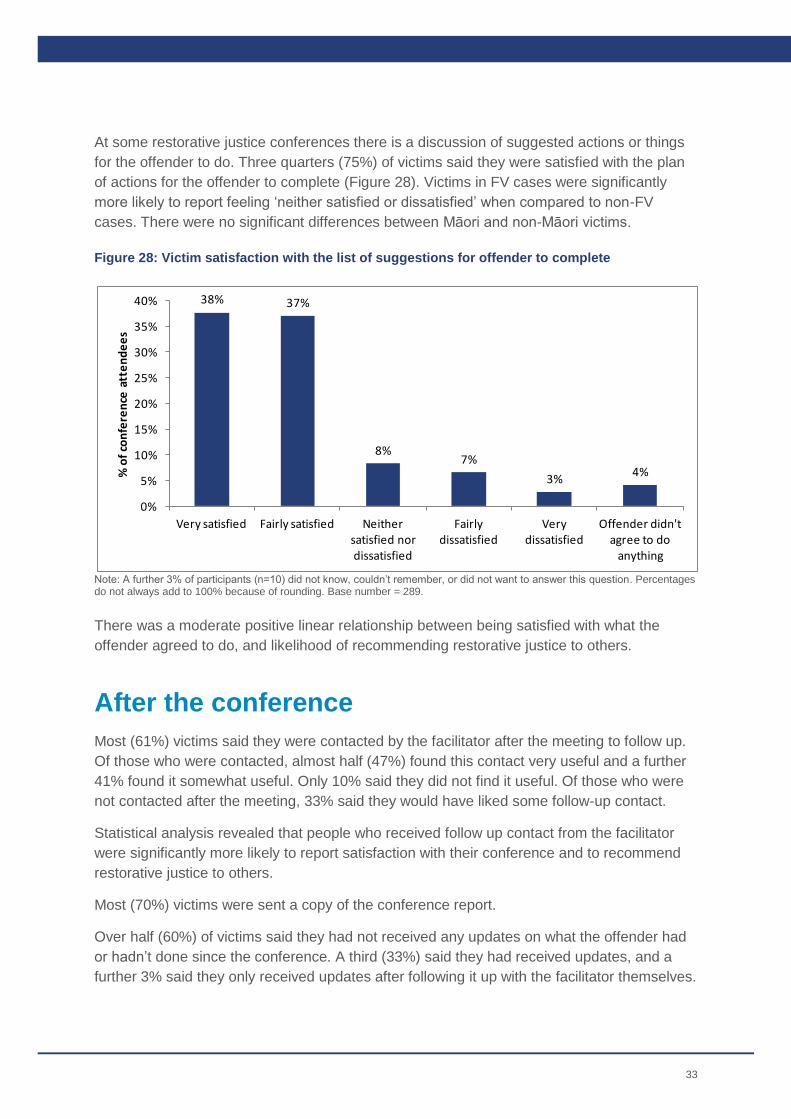
At some restorative justice conferences there is a discussion of suggested actions or things
for the offender to do. Three quarters (75%) of victims said they were satisfied with the plan
of actions for the offender to complete (Figure 28). Victims in FV cases were significantly
more likely to report feeling ‘neither satisfied or dissatisfied’ when compared to non-FV
cases. There were no significant differences between Māori and non-Māori victims.
Figure 28: Victim satisfaction with the list of suggestions for offender to complete
Note: A further 3% of participants (n=10) did not know, couldn’t remember, or did not want to answer this question. Percentages do not always add to 100% because of rounding. Base number = 289.
There was a moderate positive linear relationship between being satisfied with what the
offender agreed to do, and likelihood of recommending restorative justice to others.
After the conference
Most (61%) victims said they were contacted by the facilitator after the meeting to follow up.
Of those who were contacted, almost half (47%) found this contact very useful and a further
41% found it somewhat useful. Only 10% said they did not find it useful. Of those who were
not contacted after the meeting, 33% said they would have liked some follow-up contact.
Statistical analysis revealed that people who received follow up contact from the facilitator
were significantly more likely to report satisfaction with their conference and to recommend
restorative justice to others.
Most (70%) victims were sent a copy of the conference report.
Over half (60%) of victims said they had not received any updates on what the offender had
or hadn’t done since the conference. A third (33%) said they had received updates, and a
further 3% said they only received updates after following it up with the facilitator themselves.
38% 37%
8%7%
3%4%
0%
5%
10%
15%
20%
25%
30%
35%
40%
Very satisfied Fairly satisfied Neither satisfied nor dissatisfied
Fairly dissatisfied
Very dissatisfied
Offender didn't agree to do
anything
% o
f co
nfe
ren
ce a
tte
nd
ee
s

34
Victims were also asked how the restorative justice process had influenced their view of the
criminal justice system as a whole. Most (60%) said their view had become more positive
(Figure 29).
Figure 29: Victims’ views of the criminal justice system as a whole after taking part in restorative justice
Note: A further 3% of participants (n=9) did not know, couldn’t remember, or did not want to answer this question. Percentages do not always add to 100% because of rounding. Base number = 289.
Most (81%) victims thought that the restorative justice conference was a good way to deal
with the offence committed against them with only 5% feeling that it was a bad way to deal
with the offence. There were no significant differences for FV cases or Māori participants.
Respondents were also asked how taking part in the restorative justice conference had
benefited them, if at all. A majority (75%) of respondents were able to name at least one way
that restorative justice had benefited them. Responses included:
I got to have my say / the offender heard how the offence affected me (25%)
I got to hear offender’s point of view and understand what happened (21%)
I feel that I can move on / I got closure (17%)
Healed emotionally (7%)
I’ve learned about the restorative justice process (6%)
Victims in FV cases were significantly more likely to say that restorative justice had helped
them have a better relationship with family or friends (n=10) when compared with non-FV
cases (n=6). They were also more likely to say that restorative justice helped them know help
and support is available (n=11 versus n=4). Māori victims (n=8) were also more likely than
non-Māori (n=11) to say they felt healed emotionally after the restorative justice conference.
28%
32%
21%
7%
9%
0%
5%
10%
15%
20%
25%
30%
35%
A lot more positive A little more positive
Not changed A little less positive
Much less positive
% o
f co
nfe
ren
ce a
tte
nd
ee
s

35
Dissatisfaction with restorative justice
Overall experience
Thirty-three attendees (12%) were dissatisfied with their overall experience of restorative
justice. As could be expected, a majority (n=21; 64%) of the dissatisfied attendees said they
would be unlikely to recommend restorative justice to others in a similar situation.
Likelihood of recommending restorative justice to others
Overall, 34 conference attendees (12%) said they would be unlikely to recommend
restorative justice to others in a similar situation. This group was compared with all other
conference attendees and the key results are summarised in Table 1.
Table 1: Factors associated with attendees being less likely to recommend restorative justice to others compared to all conference attendees
Factors Unlikely to recommend
All others*
Clear that you had a choice in attending 85% 98%
Enough information about what would happen 82% 94%
Satisfied with what you were told would happen 79% 97%
Satisfied with what the offender agreed to do 38% 80%
Satisfied with the meeting itself 41% 89%
Given enough time to think about attending 97% 98%
Told who would be present at the meeting 94% 95%
Contacted by facilitator after the meeting 53% 62%
Bold indicates a difference that is statistically significant. *All others includes those who answered neutrally and positively.
Satisfaction with the contents of the plan developed for the offender appeared to be strongly
associated with the likelihood of recommending restorative justice. Those unlikely to
recommend restorative justice were less than half as likely as other conference attendees to
be satisfied with what the offender agreed to do.

36
Overall this group of discontented attendees appears to have been less well informed
throughout the restorative justice process and were significantly less likely to have been
satisfied with the conference and provided enough information about what would happen.
Overall feedback
Good things about the restorative justice process
Victims were asked to think about the process of restorative justice, the people involved, and
any positive impacts or longer term benefits it may have had on their day to day life. The ten
most common answers are summarised in Table 2.
Table 2: What were good things about victims’ experience of restorative justice
Statement % of respondents
Good facilitators (including: very polite, easy to talk to, made me feel comfortable, caring, supportive, respectful, professional)
30%
I was able to have my say 19%
Clear process / information clearly explained / organised 15%
Provided me with closure / I could move on 12%
I was able to talk openly about the offence 10%
The offender gave me an explanation and answered my questions, I could relate to the offender and got a better understanding of their side of the story 10%
Safe / controlled environment 7%
The fact they have restorative justice 7%
The ability to meet face-to-face with the offender 6%
Receiving feedback / communication before and after the conference 6%
Base number = 289.

37
Areas for improvement
Victims were also given the opportunity to identify things that were not so good about
restorative justice, or areas that could be improved. The ten most common replies are
summarised in Table 3.
Table 3: What victims thought could be improved about restorative justice
Statement % of respondents
None – nothing was poor or needed to be improved 47%
Need feedback / updates on what happened to the offender after the conference 9%
The offender didn’t do what was agreed at the conference 4%
They should follow up offenders to pay reparation money / do what they agreed to do 3%
It took too long between offence and the first meeting with the facilitator 2%
Facilitator didn’t listen to me / would cut me or the offender off when talking / the facilitator talked too much 2%
They need to explain the process better / information provided is not comprehensive enough / hard to follow 2%
Meeting needed to be better planned / more structured 2%
The facilitator couldn’t get their point across / needed more training 2%
The conference was rushed 2%
Base number = 289.

38
What those not attending the conference thought
This section of the report is about the 29 respondents who attended a pre-conference
meeting with the provider but chose not to attend the restorative justice conference that was
held. They are referred to as pre-conference attendees.4
The small size and disparate responses of this group limits analysis of it. To avoid any
misrepresentation of data, the raw numbers of pre-conference attendees (rather than
percentages) have been used in this section.
Preparations for the conference
Nearly half (n=12) of those who did not attend the conference received their first description
of restorative justice from the restorative justice provider. Other sources of information
included a victim advisor who worked at the court (n=7), the Police (n=4) and a family
member (n=2).
At the pre-conference meeting, 28 of 29 said they received information about the restorative
justice process. Of these, 12 received only verbal information and another 12 received both
verbal and written information.
Most (n=24) said that their questions about restorative justice were fully answered at this
meeting and most (n=23) felt they had enough information about what would happen during
the conference with the offender. Nearly everyone (n=24) was told who would be present and
were informed they could bring a support person or whānau to the conference. Overall, the
majority (n=23) felt they were given enough time to think about their decision to attend the
conference with the offender.
Most people (n=20) said they were satisfied with what they were told about restorative
justice. Of those who were dissatisfied (n=6), three said the meeting wasn’t how they had
4 There were a further 11 respondents who attended the pre-conference meeting and agreed to attend
the conference but found that it did not go ahead for other reasons. Due to the complexity of their
situation, these respondents were not assigned to the appropriate pre-conference questionnaire and
thus answered the same questionnaire as the 289 respondents who did attend the conference. For
this reason they could not be analysed along with the other 29 pre-conference attendees.

39
been led to believe, and two said that the facilitator was angry, rude or made inappropriate
remarks.
Two thirds (n=19) said it was recommended they attend the conference with the offender,
and 25 agreed it was made clear they had a choice to participate.
Reasons for not taking part
Only 10 respondents explained why they decided not to proceed with the restorative justice
conference. The most common reasons for this were ‘I did not want to meet the offender’
(n=4), ‘I was scared / anxious to meet the offender’ (n=3), ‘I was too busy with work’ (n=2),
‘the crime was too trivial’ (n=2), ‘the meeting was mainly for the offender and not aimed at the
victim’ (n=2) and ‘the matter had already been resolved’ (n=2).
Most (n=16) said nothing could have changed or needed to happen that would have enabled
them to attend the meeting. Most (n=16) reported feeling better after their meeting with the
provider (Figure 30) and 13 said their view of the criminal justice system as a whole had
improved.
Figure 30: How victims felt after meeting with their restorative justice provider
Note: Two people could not remember or did not want to answer this question. Base number = 29.
Overall, most (n=18) people were satisfied with the contact they had about attending a
restorative justice conference and the majority (n=20) were likely to recommend restorative
justice to others in a similar situation.
9
7
6
4
1
0
1
2
3
4
5
6
7
8
9
10
A lot better Slightly better No different Slightly worse A lot worse
Nu
mb
er
of
pre
-co
nfe
ren
ce a
tte
nd
ee
s

40
Appendices
Appendix 1: Restorative justice providers
The providers of restorative justice services from 1 January to 31 December 2015 are set out
in Table 4.
Table 4: Restorative justice providers
Provider
Ashburton Safer Community Council
Auckland Restorative Justice Trust
Hawke’s Bay Restorative Justice Te Puna Wai Ora Inc
He Korowai Trust
Hoani Waititi Marae Trust
Komiti Marae Orakei Trust
Mana Social Services Trust
Manawatu Community Justice Trust
Marlborough District Council
National Urban Maori Authority
Nelson Restorative Justice Trust
Nga Kete Matauranga Pounamu Charitable Trust
Ngāti Hine Health Trust
Presbyterian Support Central
Project Restore
Project Turnaround (Timaru District Council)

41
Restorative Justice Otago (Anglican Family Care Inc)
Restorative Justice Services Ōtautahi Christchurch
Taranaki Restorative Justice Trust
Tauranga Moana Restorative Justice Trust
Te Runanganui o Ngāti Porou Trustee Ltd
Waitakere Restorative Justice Community Group Trust
Waitaki Safer Community Trust
Wellbeing North Canterbury Trust
Wellington and Hutt Valley Community Law
West Coast Restorative Justice
Whanganui Restorative Justice Trust

42
Appendix 2: Methodology
The Ministry of Justice commissioned Gravitas Research and Strategy Ltd to collaborate on
the development of a survey of victims involved in the restorative justice process and then to
conduct the survey.
Research design
Following scoping discussions between the ministry and Gravitas, a questionnaire was
developed. This questionnaire included rating questions to benchmark current levels of
performance on relevant service attributes but also provided opportunities (through open-
ended questions) for respondents to express in their own words, what they saw as the
benefits and drawbacks of the restorative justice experience and to offer suggestions to
improve the service and processes.
Cognitive testing
The questionnaire was tested with victims who had experienced restorative justice to
establish respondent comprehension, judgement and response – specifically how
participants understood a question and how they arrived at their answer. In addition, the
impact of the survey on respondents, in terms of it asking for review of potentially difficult and
emotional experiences was considered.
The cognitive testing interviews were conducted by experienced members of the Gravitas
interviewing team and included a mix of both face to face and telephone interviews. This
helped to engage with participants fully and understand possible implications of the method.
Gravitas undertook 10 cognitive interviews. This included 4 participants who had only
experienced the restorative justice pre-conference plus 6 who had proceeded to the
restorative justice conference. For both groups, an incentive was provided to thank people
for their time.
Pilot testing
Once the changes/enhancements to the cognitive testing version of the questionnaire were
made and signed off, a live pilot was conducted with a selection of 13 clients (3 pre-
conference only, 10 conference). The aim of this pilot was to further check comprehension
and respondent comfort, check interview length, accuracy of programming, and to further
develop code-frames to be used for open-ended questions.
At the end of the survey they were also asked to provide feedback on the survey via a series
of additional questions. These questions aimed to understand any elements of the
questionnaire that were not satisfactory to respondents, any questions that were not clear
and anything they felt they were unable to say.

43
Following the pilot, all final changes were submitted to the ministry’s research and evaluation
team for approval, and no live interviewing took place until the final version of the
questionnaire was signed off.
Data collection
In total, 400 interviews with victims were sought. This comprised a target sample of 300
interviews with clients who had experienced a full restorative justice conference (conference
sample) and 100 interviews with clients who experienced a pre-conference meeting but did
not proceed to full conference (pre-conference sample).
Prior to being contacted by telephone, all potential respondents in the survey sample were
sent a pre-notification letter informing them that the survey was taking place and providing
them the opportunity to opt-out of the survey. Those who opted out of the survey (n=92) were
removed from the live survey sample.
The full available sample for the telephone survey (excluding duplicate records and the
sample used for the cognitive testing) was 1,838 clients, comprising 299 pre-conference and
1,539 conference. The sample records covered the victims participating in restorative justice
from January to December 2015. During this time an estimated total of 2,800 victims
participated in full conferences.
Interviews
Telephone interviews were conducted exclusively from Gravitas’ in-house survey centre by
experienced interviewers using computer-assisted telephone interviewing (CATI). CATI
proved a suitable survey approach as interviewers could engage well with respondents and
probe for clarification and further information as appropriate.
The survey was conducted via telephone between 6 May 2016 and 13 June 2016. A total of
329 victims were interviewed from 24 of the 27 ministry-funded restorative justice providers.
Of these, 289 had attended a restorative justice conference, 29 had attended a pre-
conference meeting but declined to attend the conference, and 11 had attended the pre-
conference meeting and agreed to attend the conference but found that it did not go ahead
for other reasons.
The average interview length across n=329 interviews was 28 minutes.
The response rate was calculated by dividing the number of completed interviews by the total
number of eligible pieces of sample attempted – including those sent an invitation letter who
opted out of the survey in advance. The response rate for the full sample was 41.1%, with
the response rate for the pre-conference interviews being 33.0% and 42.5% for the
conference sample interviews.

44
Analysis and reporting
All variables in the final data set were coded by the contractor. No weighting was applied to
the data set. All open-ended responses, as well as those entered into ‘other’ categories,
were ‘back coded’ to allow statistical analysis. This involved fitting responses into existing
categories, and where necessary, creating new categories so that all results had a numeric
code. Coding was undertaken by an experienced member of Gravitas’ coding team and
code-frames developed collaboratively with the ministry’s research team.
The final dataset was comprehensively checked and peer reviewed internally, to ensure its
integrity. All identifiers were removed to protect respondent’s anonymity.
Ministry researchers analysed the survey data and wrote this report. Statistical analysis was
undertaken for each survey question and differences were tested at the p<0.05 level. Where
significant, the report has expressly noted this. However, non-significant differences have
also been reported in some places.
Correlation analysis was undertaken between selected variables and is summarised in
Appendix 4 on page 54.
The following scale has been used for Pearson’s correlation coefficient (r):
r<0.2 very weak linear correlation
0.2<r<0.4 weak linear correlation
0.4<r<0.6 moderate linear correlation
0.6<r<0.8 strong linear correlation
r>0.8 very strong linear correlation
Multiple linear regression analysis
A multiple linear regression model was used to find independent variables that could best
predict the four key measures5 analysed in this report, namely:
1. Satisfaction with the restorative justice conference
2. Recommending restorative justice to others
3. Overall satisfaction with the restorative justice process
4. Positive impact from taking part in restorative justice
Accordingly, four multiple regression models have been developed to identify the best
predictors for the above measures (dependent variables).
5 Refer to page 9.

45
To allow inclusion in the models, all variables were re-coded so that responses such as ‘don’t
know/can’t remember’ and ‘don’t want to answer this question’ were combined into a neutral
category between the scores for positive and negative values (ie for 5-point response
categories these responses were included in the middle category).
The overall number of predicting variables available from survey data exceeded 500
(significantly more than the number of observations) so ministry analysts applied a phased
procedure for variable selection — combining a data-driven approach with expert knowledge.
Firstly, ministry subject matter experts were asked to prioritise groups of potentially predictive
variables that hold significant interest for survey users.
The following groups were selected:
1. Gender
2. Ethnicity
3. Age
4. Income source
5. FV cases versus non-FV cases
6. Actual participation of support people
7. Follow-up contact after the restorative justice conference
8. Reasons for taking part in the restorative justice conference
9. Statements about the conference
10. Satisfaction with what the offender agreed to do
11. The number of facilitators at the restorative justice conference
Secondly, all variables (from the first step) that significantly correlated with the four
dependent variables were selected for inclusion in the models. Non-binary variables were
considered to meet the eligibility criteria if their correlation coefficient (Pearson’s r value) with
dependent variables exceeded 0.2. Binary variables have been selected if their association
with dependent variables (measured by a chi-square test) was significant at the 0.05
confidence level.
Considering the reasonably small sample size (n=288)6, ministry analysts limited the number
of predicting variables in regression models to 16; where more than 16 variables met the
above criteria, those with the smallest Pearson’s r value were excluded.
Finally, four multiple regression models, each with its own set of 16 selected predictive
variables, were run in Excel.
The modelling outcomes are presented in Table 5 to Table 8.
6 One respondent did not answer the questions about satisfaction.

46
Table 5: Satisfaction with the restorative justice conference – regression modelling
Regression statistics
Multiple R 0.7149
R square 0.5111
Adjusted R square 0.4822
Standard error 0.7437
Observations 288
ANOVA df SS MS F Significance F
Regression 16 160.9193 10.0575 17.7036 1.53E-33
Residual 271 153.9557 0.5681
Total 287 314.8750
Best predictors Regression coefficients P-value
Gender 0.2046 0.0450
Your concerns and questions were treated seriously -0.2773 0.0004
You felt the offender was sincere in their participation -0.1541 0.0004
You felt pressured during the meeting 0.0829 0.0467
Satisfaction with what the offender agreed to do 0.2261 5.8277E-05

47
Table 6: Recommending restorative justice to others – regression modelling
Regression statistics
Multiple R 0.6796
R square 0.4618
Adjusted R square 0.4301
Standard error 0.9140
Observations 288
ANOVA df SS MS F Significance F
Regression 16 194.2736 12.1421 14.5354 3.5565E-28
Residual 271 226.3792 0.8353
Total 287 420.6528
Best predictors Regression coefficients P-value
Age <20 -0.5162 0.0380
You wanted to express your feelings and speak directly to the offender -0.1789 0.0005
You were listened to carefully -0.2169 0.0222
Your concerns and questions were treated seriously -0.1952 0.0361
You were treated with respect 0.2478 0.0265
You felt the offender was sincere in their participation -0.1912 0.0003
Satisfaction with what the offender agreed to do 0.1808 0.0073

48
Table 7: Overall satisfaction with the restorative justice process – regression modelling
Regression statistics
Multiple R 0.6980
R square 0.4872
Adjusted R square 0.4570
Standard error 0.8582
Observations 288
ANOVA df SS MS F Significance F
Regression 16 189.6399 11.8525 16.0940 6.9435E-31
Residual 271 199.5788 0.7365
Total 287 389.2187
Best predictors Regression coefficients P-value
Gender -0.2502 0.0360
Age <20 -0.6028 0.0102
You wanted to express your feelings and speak directly to the offender -0.1244 0.0100
You had the chance to explain how the offence affected you 0.2389 0.0309
You were listened to carefully -0.2472 0.0058
Your concerns and questions were treated seriously -0.2898 0.0010
You were treated with respect 0.2107 0.0439
You felt the offender was sincere in their participation -0.1260 0.0101
Satisfaction with what the offender agreed to do 0.1899 0.0028

49
Table 8: Positive impact from taking part in restorative justice – regression modelling
Regression statistics
Multiple R 0.6315
R square 0.3988
Adjusted R square 0.3633
Standard error 0.9733
Observations 288
ANOVA df SS MS F Significance F
Regression 16 170.2752 10.6422 11.2346 4.0512E-22
Residual 271 256.7109 0.9473
Total 287 426.9861
Best predictors Regression coefficients P-value
Gender -0.3241 0.0166
You hoped that the conference would bring closure -0.1178 0.0468
You felt the offender was sincere in their participation -0.2204 8.8337E-05
Satisfaction with what offenders agreed to do 0.2367 0.0010
Cultural considerations
This research was undertaken with an emphasis on the needs and entitlements of the target
participants for the survey, including cultural awareness and culturally appropriate
responses. This was considered:
• In the testing and piloting stages
• In the selection of interviewers with suitable levels of experience and sensitivity
• By ministry subject matter experts and restorative justice facilitator
• In the briefing and training processes
• By listening-in to all interviewing staff to ensure interviewers were taking suitable
approaches.
50
Ethical considerations
Gravitas Research and Strategy Ltd has experience conducting surveys with victims of
crime, and is required, under contract and the Privacy Act, to protect the confidentiality of all
information related to the survey and participants.
The researchers at the Ministry of Justice and Gravitas Research and Strategy Ltd are bound
by the ethical requirements of a range of research organisations to which they belong,
including the Association of Social Science Researchers, the Australasian Evaluation Society
and the Research Association of New Zealand.
Before approaching participants, the ministry asked each restorative justice provider to let
them know if they felt it would be unsafe to contact particular victims about the survey for any
reason. These victims were not contacted about the research.
Participation in the survey was entirely voluntary, and victims were given the opportunity to
decline to participate, or not answer particular questions. Victims were clearly told this study
would focus only on the restorative justice process they participated in, and not on the
offence or their feelings about the offence. Respondents who showed any signs of
unresolved feelings were offered contact details for the Victims of Crime Contact Line,
Victims Support and Citizen’s Advice Bureau.
Interviewers were comprehensively briefed that they must not disclose who they were calling
on behalf of, nor any specifics in relation to the nature of the survey to anyone, other than the
person whose name appears in the sample. Once interviewers had firmly established they
were speaking with the person named in the sample, they:
• explained the nature and purpose of the research;
• asked if it is a good time for the interview, and arranged a call-back if necessary;
• offered the name and toll-free contact number of a Gravitas supervisor and a contact at
the ministry if the respondent wished to check the legitimacy of the research; and
• informed the respondent that a supervisor may listen in to check the quality of the
interview.
Limitations
The findings in this report represent the experiences and views of the respondents alone and
should not be used to generalise the experiences of all victims involved with restorative
justice.
The survey obtained a 41.1% response rate and we are unable to describe the
characteristics of the non-responders. As such, care should be taken about generalising
these results. This study describes a sample of victims with current contact details who
agreed to participate. Additional analyses at an individual provider level were not possible
due to the sample sizes obtained.
The willingness of victims to share their experience with the interviewers was integral to the
success of this project. However, the extended interval between the restorative justice

51
conference and interviewing (up to 17 months) resulted in relatively high levels of ineligible
contacts and disconnected numbers.
Finally, this research did not consider or control for the type or severity of the offence
experienced by each respondent.
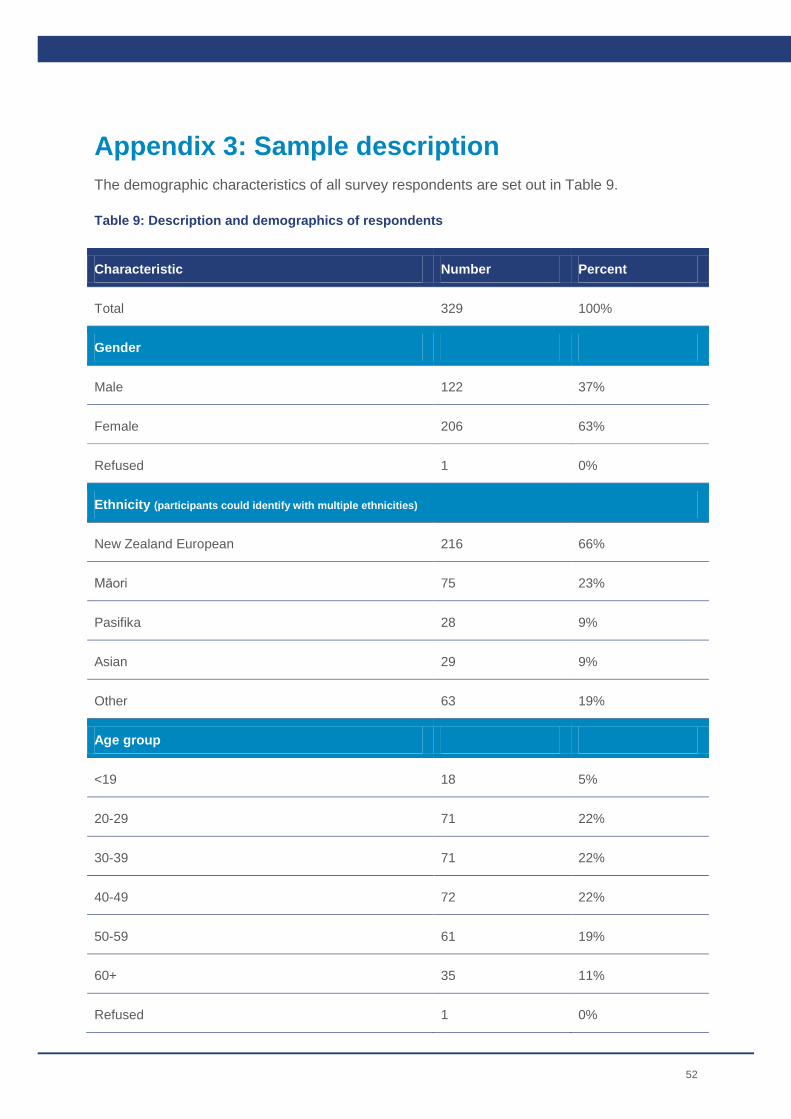
52
Appendix 3: Sample description
The demographic characteristics of all survey respondents are set out in Table 9.
Table 9: Description and demographics of respondents
Characteristic Number Percent
Total 329 100%
Gender
Male 122 37%
Female 206 63%
Refused 1 0%
Ethnicity (participants could identify with multiple ethnicities)
New Zealand European 216 66%
Māori 75 23%
Pasifika 28 9%
Asian 29 9%
Other 63 19%
Age group
<19 18 5%
20-29 71 22%
30-39 71 22%
40-49 72 22%
50-59 61 19%
60+ 35 11%
Refused 1 0%

53
Victim status
Victim 318 97%
Representative of victim (family member) 7 2%
Representative of victim (other than family member) 4 1%
Income
I receive wages / salary paid by an employer 181 55%
I am self-employed or a business owner 42 13%
I am on superannuation or other pension 18 5%
I receive a student allowance 7 2%
I receive government income support (eg benefit) 64 19%
I have no source of income 8 2%
Refused 3 1%
Partners income / shared income 4 1%
Parents income 2 1%
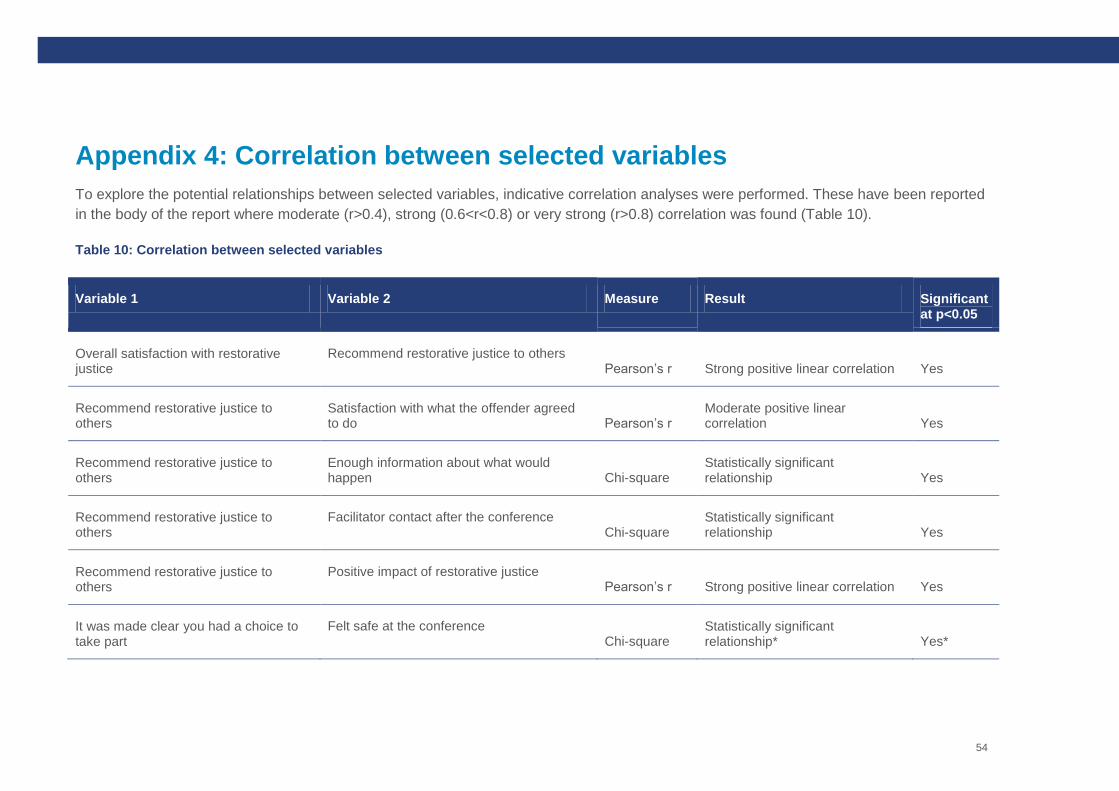
54
Appendix 4: Correlation between selected variables
To explore the potential relationships between selected variables, indicative correlation analyses were performed. These have been reported
in the body of the report where moderate (r>0.4), strong (0.6<r<0.8) or very strong (r>0.8) correlation was found (Table 10).
Table 10: Correlation between selected variables
Variable 1 Variable 2 Measure Result Significant at p<0.05
Overall satisfaction with restorative justice
Recommend restorative justice to others Pearson’s r Strong positive linear correlation Yes
Recommend restorative justice to others
Satisfaction with what the offender agreed to do Pearson’s r
Moderate positive linear correlation Yes
Recommend restorative justice to others
Enough information about what would happen Chi-square
Statistically significant relationship Yes
Recommend restorative justice to others
Facilitator contact after the conference Chi-square
Statistically significant relationship Yes
Recommend restorative justice to others
Positive impact of restorative justice Pearson’s r Strong positive linear correlation Yes
It was made clear you had a choice to take part
Felt safe at the conference Chi-square
Statistically significant relationship* Yes*

55
It was made clear you had a choice to take part
You were scared to say what you felt at the conference Chi-square
No statistically significant relationship No
It was made clear you had a choice to take part
Nervous before the conference Chi-square
Statistically significant relationship Yes*
Number of facilitators running the conference
Satisfaction with the conference Pearson’s r Very weak linear relationship No
Took a support person to the conference
Nervous before the conference Chi-square
Statistically significant relationship Yes
Took a support person to the conference
Felt safe at the conference Chi-square
No statistically significant relationship No
Took a support person to the conference
Scared to say what you felt at the conference Chi-square
No statistically significant relationship No
Nervous before the conference Felt safe at the conference Pearson’s r Very weak linear relationship Yes
Nervous before the conference Scared to say what you felt at the conference Pearson’s r Very weak linear relationship No
Facilitator contact after the conference Satisfaction with the conference
Chi-square Statistically significant relationship Yes
Facilitator contact after the conference Positive impact of restorative justice
Chi-square No statistically significant relationship No
Facilitator contact after the conference Overall satisfaction with restorative justice
Chi-square No statistically significant relationship No

56
Facilitator contact after the conference Recommend restorative justice to others
Chi-square Statistically significant relationship Yes
*Note: treat finding with caution due to very small groups involved in analysis.

Ministry of Justice
Tāhū o te Ture
justice.govt.nz
0800 COURTS
0800 268 787
National Office
Justice Centre | 19 Aitken St
DX SX10088 | Wellington | New Zealand