Embed Size (px)
Citation preview
Restoring the Carbon Balance- Session 2: The TechnologiesFebruary 1, 2017 1
# #carbonbalance, 2016
Edward Saltzberg, Ph.D.Managing Director
Security & Sustainability Forum
Joel Makower
Chairman GreenBiz Group Inc.
1

Restoring the Carbon Balance Series
December 15 - Webinar 1: The Imperative
February 1 - Webinar 2: The Technologies
Spring 2017 - Webinar 3: Policies, Financing, Regulations (Registration
opens soon)
Register at www.ssfonline.org
1. Follow “Restoring the Carbon Balance” at
www.lightspeedsolutions.org
Register, Watch Recordings, Access Collateral Material
2. Participate in the RCB Discussions
Join: Restoring the Carbon Balance LinkedIn Group
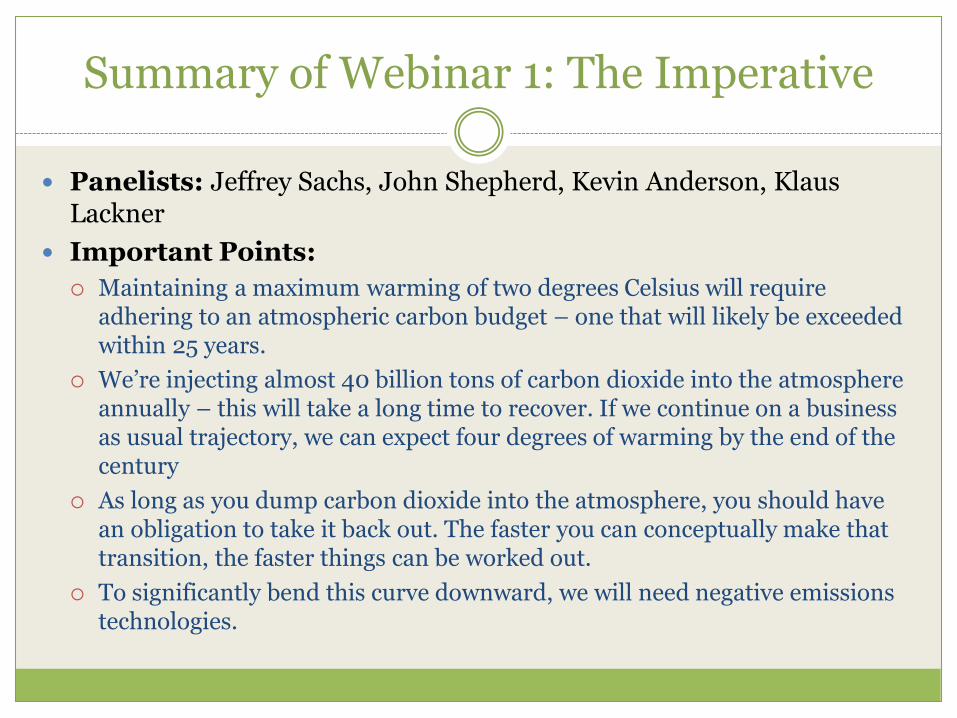
Summary of Webinar 1: The Imperative
Panelists: Jeffrey Sachs, John Shepherd, Kevin Anderson, Klaus Lackner
Important Points:
Maintaining a maximum warming of two degrees Celsius will require adhering to an atmospheric carbon budget – one that will likely be exceeded within 25 years.
We’re injecting almost 40 billion tons of carbon dioxide into the atmosphere annually – this will take a long time to recover. If we continue on a business as usual trajectory, we can expect four degrees of warming by the end of the century
As long as you dump carbon dioxide into the atmosphere, you should have an obligation to take it back out. The faster you can conceptually make that transition, the faster things can be worked out.
To significantly bend this curve downward, we will need negative emissions technologies.

Agenda
Introduction: Joel Makower
Presentations:
Klaus Lackner, Arizona State University
Eric Larson, Princeton
Susan Hovorka, University of Texas
Discussion Moderated by Joel Makower
Audience Q&A: Use the box in the go to Webinar window
Summary
Download Today’s Slides From the Window
(Please Take the Brief Exit Survey)

Moderator
Joel Makower, chairman and executive editor of GreenBiz Group Inc., creator of GreenBiz.com as well as research reports and events on the corporate sustainability strategy and trends, will moderate the session. Joel hosts the annual GreenBiz Forums and VERGE conferences around the world, and is author of the annual State of Green Business report.

www.GreenBiz.com
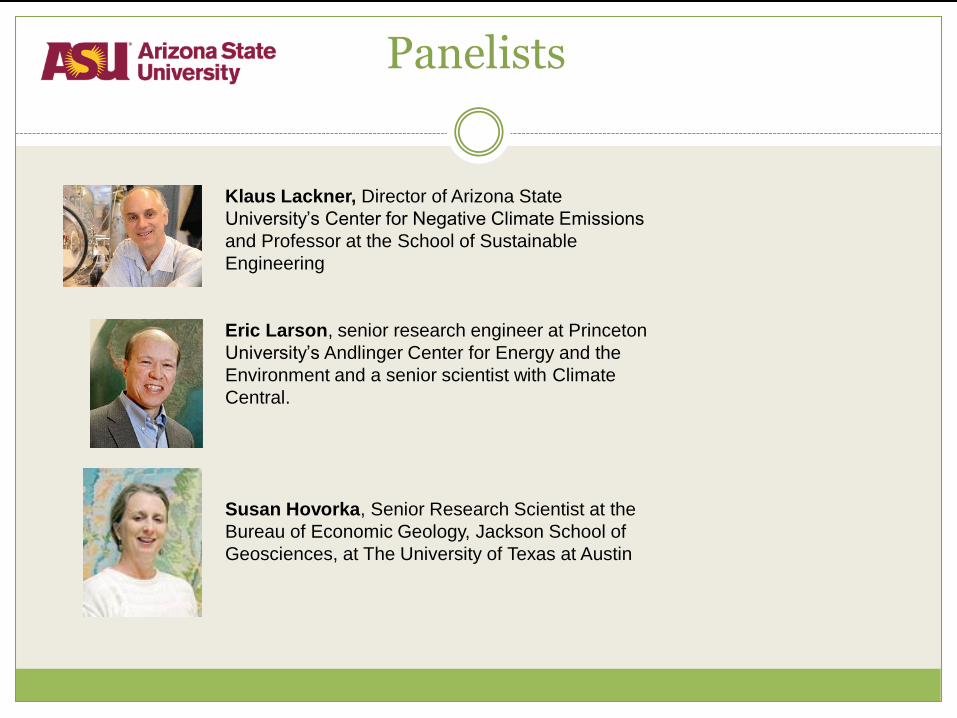
Panelists
Klaus Lackner, Director of Arizona State
University’s Center for Negative Climate Emissions
and Professor at the School of Sustainable
Engineering
Eric Larson, senior research engineer at Princeton
University’s Andlinger Center for Energy and the
Environment and a senior scientist with Climate
Central.
Susan Hovorka, Senior Research Scientist at the
Bureau of Economic Geology, Jackson School of
Geosciences, at The University of Texas at Austin

Technologies for
Carbon Disposal
Klaus S. Lackner
Arizona State University
February 2017
8
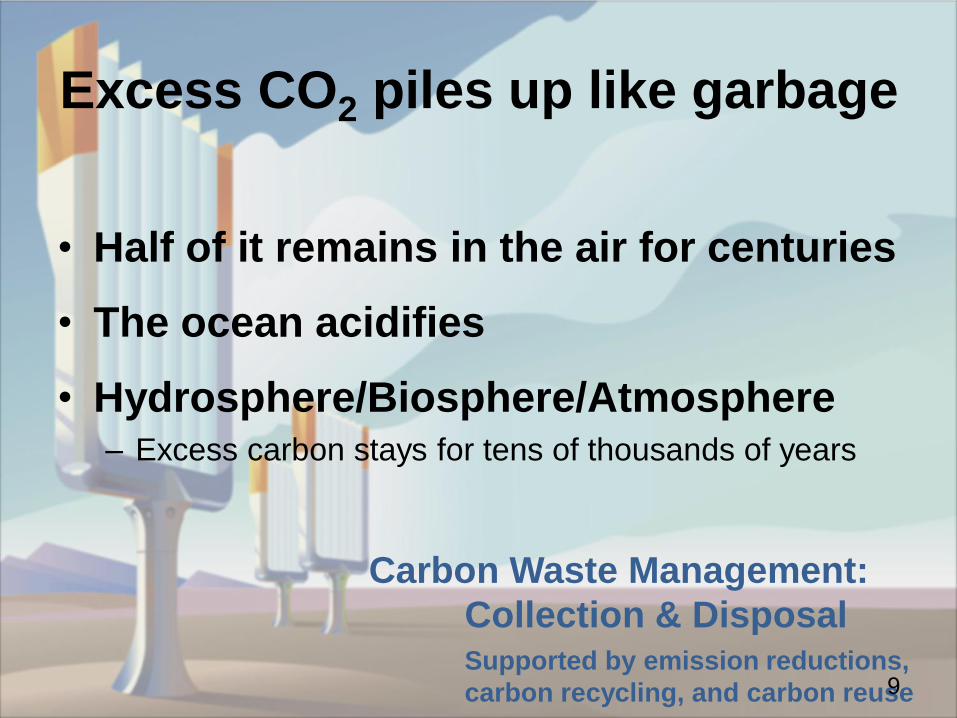
Excess CO2 piles up like garbage
• Half of it remains in the air for centuries
• The ocean acidifies
• Hydrosphere/Biosphere/Atmosphere– Excess carbon stays for tens of thousands of years
Carbon Waste Management:
Collection & DisposalSupported by emission reductions,
carbon recycling, and carbon reuse9
Picking up after point sources(Power plants, steel and cement plants, refineries)
• Smart first step, but limited in scope
– Necessarily incomplete
– What about …
• homes using gas?
• cars using fuel?
• trucks, ships, and planes?
• residual emissions from point sources?
• accidental losses from storage?
• past emissions?
Necessary but insufficient10
Point source capture
• Technically feasible
– Flue gas scrubbing and innovative designs
– Demonstrated in retrofits and new plants
• Economic viability of retrofits is challenging
– Good argument for more renewable energy
– But some plants will be hard to replace
• Peak power generators covering intermittency of renewable
• Steel production
• Cement production
Point source capture is feasible and affordable,
but not always competitive11
Cleaning up everything else
• Distributed capture
– Recovering mobilized carbon
• Atmosphere, ocean, biosphere
– Biological and chemical approaches
• Initially cost and state-of-the-art favor bio-mass
• Expect technology to get cheaper
• Technology is easier to scale up
– “Trees on steroids”
12
Air capture is sorbent based
• Sorbents bind CO2 without spending energy
– Concentration ratio is 1 : 2500
• Sorbents postpone work to the regeneration step
• Only do work on CO2
• All air capture sorbents are chemical sorbents
– At 400 ppm only chemical bonds are strong enough
– Minimum free energy of binding: ΔG > 22 kJ/mol
• Regeneration options vary with sorbent
– Thermal, vacuum or reaction-based recovery
– Humidity swing takes advantage of H2O – CO2 – sorbent reactions
Thermodynamics works out, passive or near
passive filtration reduces air handling cost13
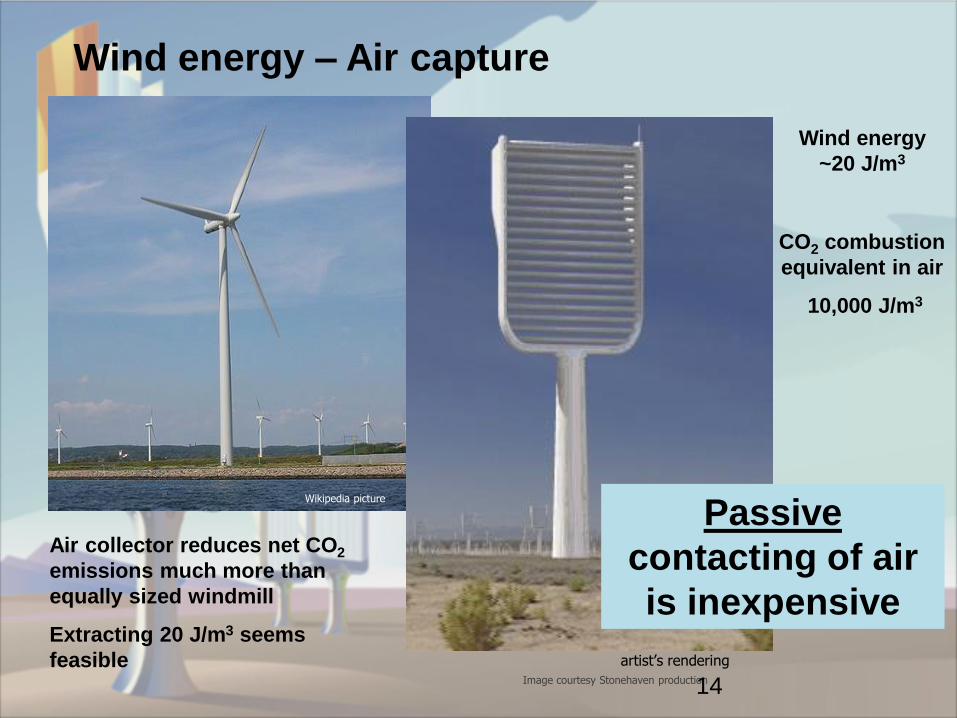
Wind energy – Air capture
artist’s rendering
Air collector reduces net CO2
emissions much more than
equally sized windmill
Extracting 20 J/m3 seems
feasible
Wind energy
~20 J/m3
CO2 combustion
equivalent in air
10,000 J/m3
Passive
contacting of air
is inexpensive
Wikipedia picture
Image courtesy Stonehaven production14
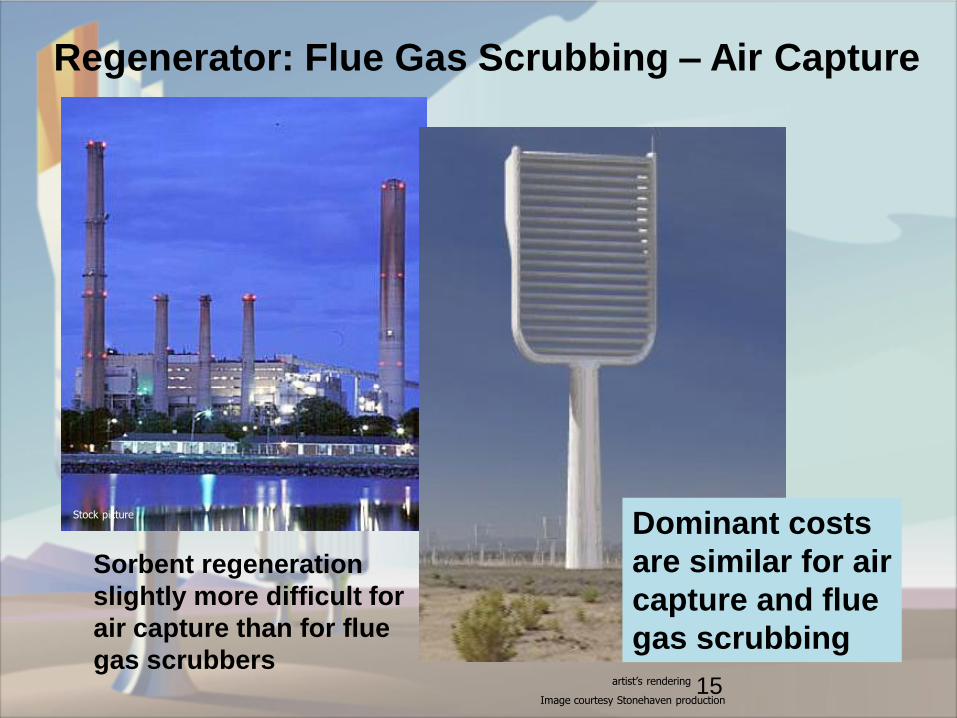
Regenerator: Flue Gas Scrubbing – Air Capture
artist’s rendering
Sorbent regeneration
slightly more difficult for
air capture than for flue
gas scrubbers
Stock picture
Image courtesy Stonehaven production
Dominant costs
are similar for air
capture and flue
gas scrubbing
15

Mass-produced factory-built one-ton-per-day units100 million units would cancelcurrent world emissions
Production capacity needed:10 million per year
Cost target:
25¢ per
gallon of
gasoline
($30/ton CO2)
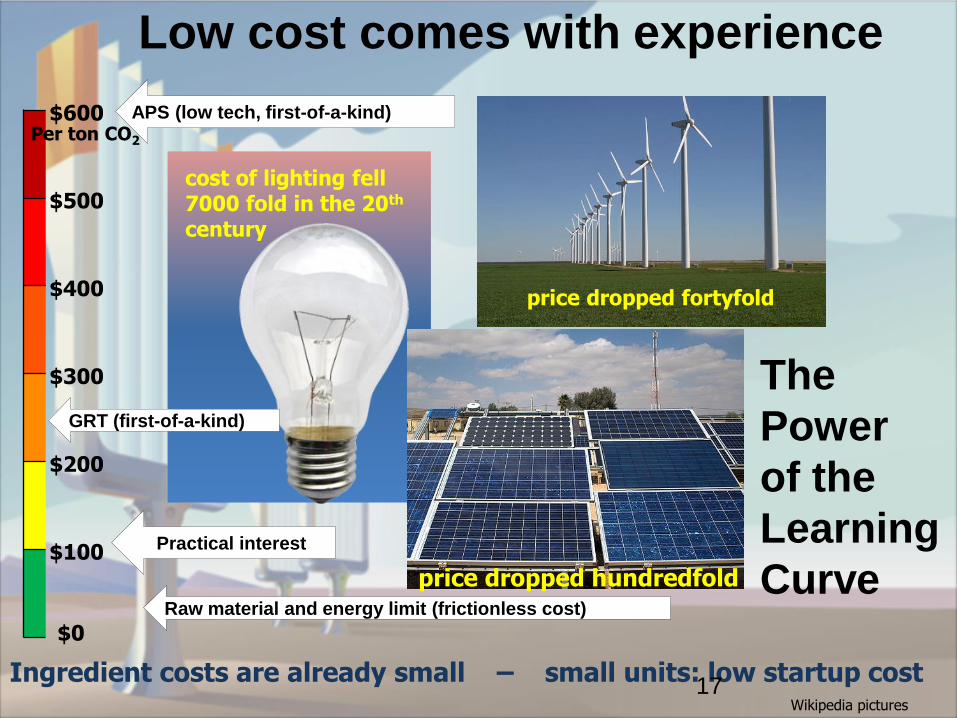
Low cost comes with experience
price dropped fortyfold
price dropped hundredfold
cost of lighting fell7000 fold in the 20th
century
Wikipedia pictures
Ingredient costs are already small – small units: low startup cost
$600
$500
$400
$300
$200
$100
$0
APS (low tech, first-of-a-kind)
GRT (first-of-a-kind)
Practical interest
Per ton CO2
Raw material and energy limit (frictionless cost)
The
Power
of the
Learning
Curve
17

Negative emissions need storage
• 100 ppm reduction
– 1500 Gt of CO2
– More than all 20th century emissions
– 50 years of current emissions
• Sequestration (when not if)
– Need to build a proven reserve
– Large demand will support high price
– Negative emissions support renewable energy
18
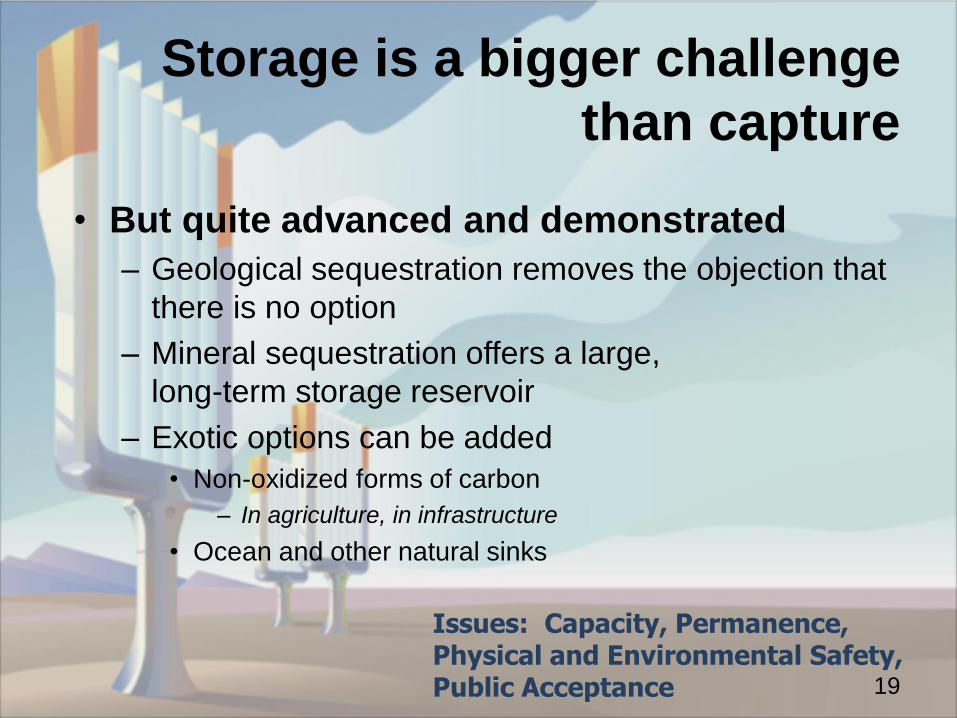
Storage is a bigger challenge
than capture
• But quite advanced and demonstrated
– Geological sequestration removes the objection that
there is no option
– Mineral sequestration offers a large,
long-term storage reservoir
– Exotic options can be added
• Non-oxidized forms of carbon
– In agriculture, in infrastructure
• Ocean and other natural sinks
Issues: Capacity, Permanence,Physical and Environmental Safety,Public Acceptance 19
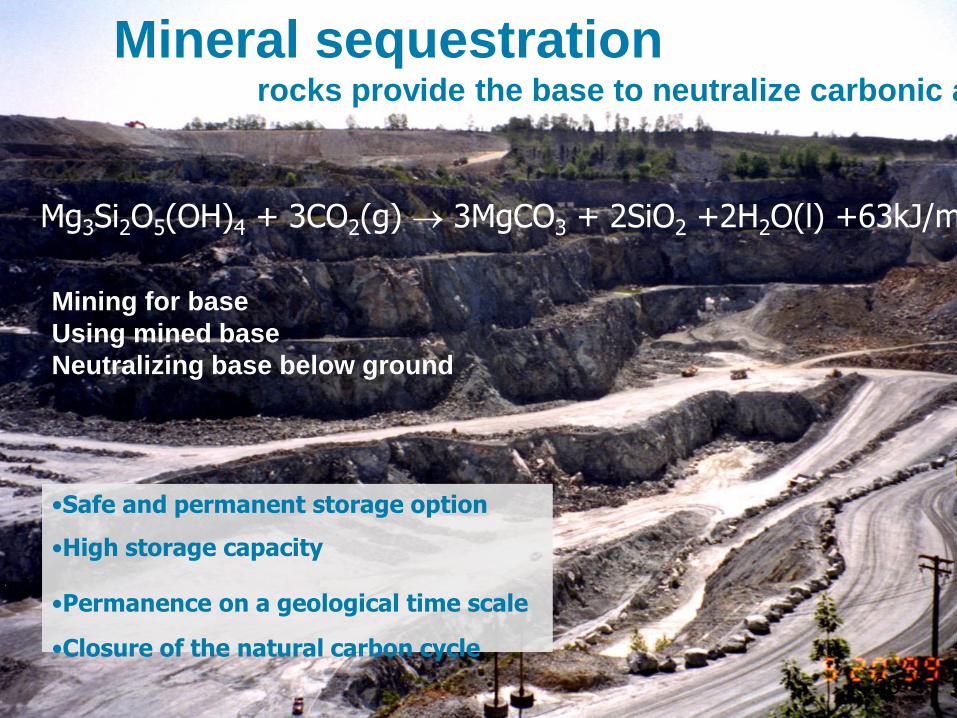
Mineral sequestrationrocks provide the base to neutralize carbonic acid
Mg3Si2O5(OH)4 + 3CO2(g) 3MgCO3 + 2SiO2 +2H2O(l) +63kJ/mol CO
•Safe and permanent storage option
•High storage capacity
•Permanence on a geological time scale
•Closure of the natural carbon cycle
Mining for base
Using mined base
Neutralizing base below ground
20
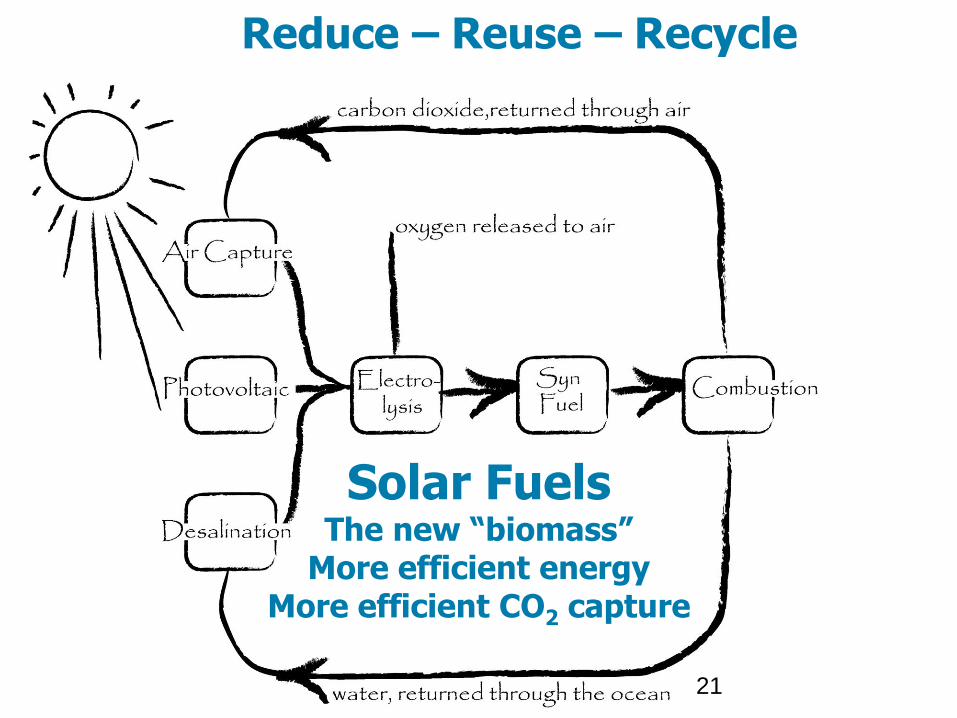
Solar FuelsThe new “biomass”
More efficient energyMore efficient CO2 capture
Reduce – Reuse – Recycle
21
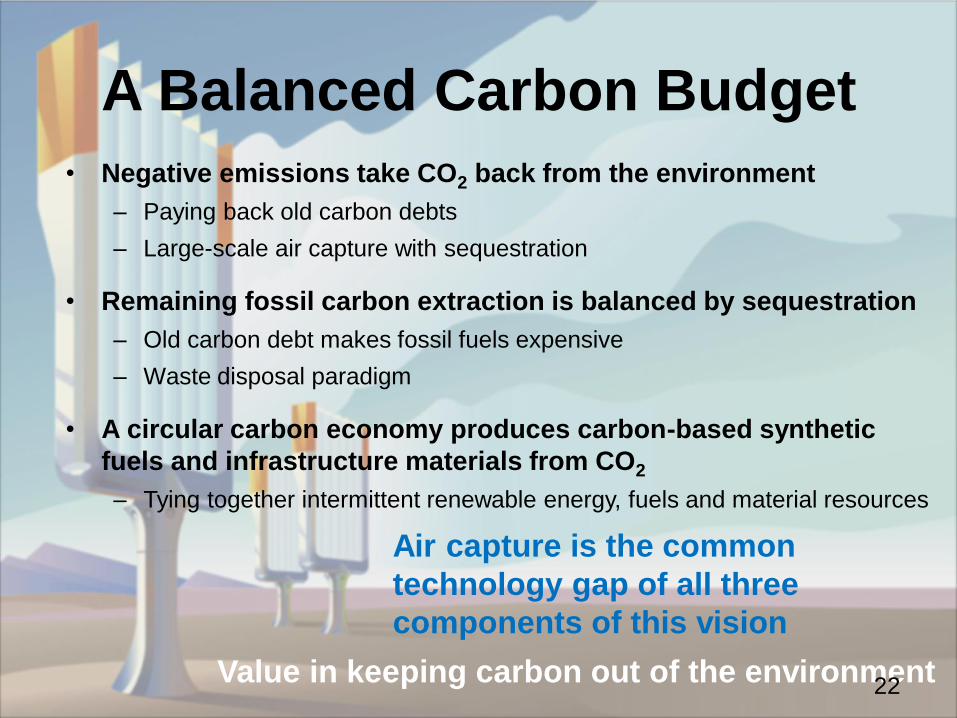
A Balanced Carbon Budget
• Negative emissions take CO2 back from the environment
– Paying back old carbon debts
– Large-scale air capture with sequestration
• Remaining fossil carbon extraction is balanced by sequestration
– Old carbon debt makes fossil fuels expensive
– Waste disposal paradigm
• A circular carbon economy produces carbon-based synthetic
fuels and infrastructure materials from CO2
– Tying together intermittent renewable energy, fuels and material resources
Air capture is the common
technology gap of all three
components of this vision
Value in keeping carbon out of the environment22
Negative Emissions via Bioenergy
with CO2 Capture and Storage (BECCS)
Eric D. Larson
Senior Research Engineer
Energy Systems Analysis Group
Andlinger Center for Energy and the Environment
School of Engineering and Applied Science, Princeton University
www.princeton.edu/~energy
Senior Scientist
Climate Central, Inc.
www.climatecentral.org
Security and Sustainability Forum webinar:
Restoring the Carbon Balance- Session 2: The Technologies
1 February 2017
1. What are BECCS technologies?
2. What do integrated assessment models like about BECCS technologies?
3. Can the world produce enough biomass sustainably for BECCS in a 2oC scenario?
4. What are key challenges to BECCS deployment?
5. What is needed going forward?
24
Questions I will address

What are BECCS technologies?
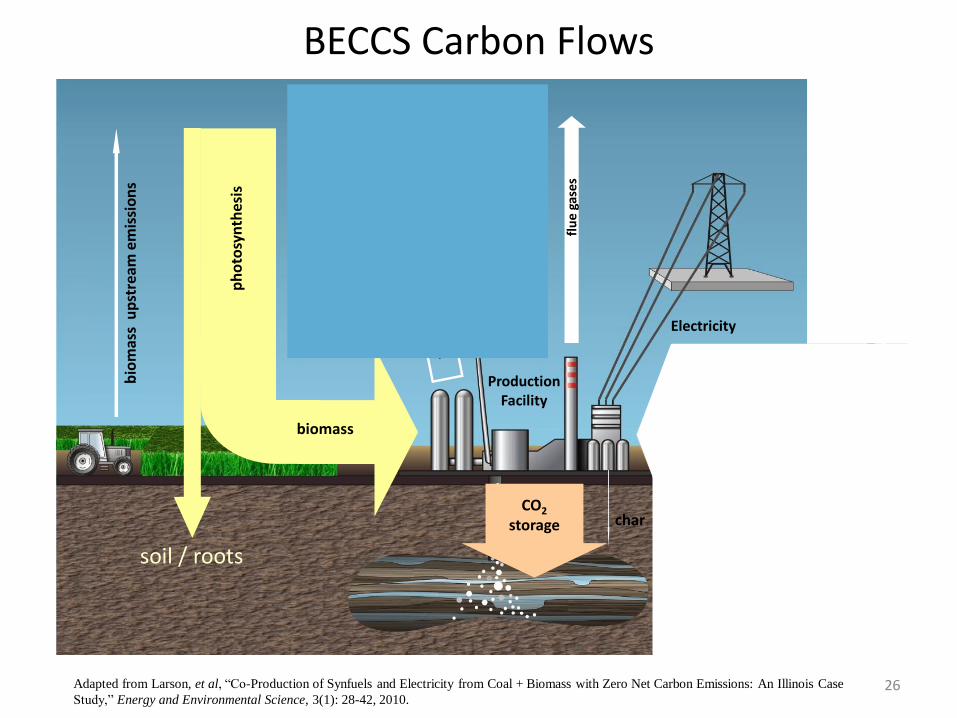
BECCS Carbon Flowsb
iom
ass
up
stre
am e
mis
sio
ns
coal
up
stre
am e
mis
sio
ns
char
coalve
hic
le t
ailp
ipe
CO2
storage
fue
l
Coal/biomass conversion to fuels and electricity with CCS
flu
e ga
ses
ph
oto
syn
the
sis
biomassem
issi
on
s
bio
mas
s u
pst
ream
em
issi
on
s
coal
up
stre
am e
mis
sio
ns
char
coal
veh
icle
tai
lpip
e
CO2
storage
fue
l
Coal/biomass conversion to fuels and electricity with CCS
flu
e ga
ses
ph
oto
syn
the
sis
biomass
bio
mas
s u
pst
ream
em
issi
on
s
coal
up
stre
am e
mis
sio
ns
char
coalve
hic
le t
ailp
ipe
CO2
storage
fue
l
Coal/biomass conversion to fuels and electricity with CCS
flu
e g
ase
s
ph
oto
syn
the
sis
biomass
bio
mas
s u
pst
ream
em
issi
on
s
coal
up
stre
am e
mis
sio
ns
char
coal
veh
icle
tai
lpip
eCO2
storagefu
el
Coal/biomass conversion to fuels and electricity with CCS
flu
e g
ase
s
ph
oto
syn
the
sis
biomass
Production Facility
bio
mas
s u
pst
ream
em
issi
on
s
coal
up
stre
am e
mis
sio
ns
char
coal
veh
icle
tai
lpip
e
CO2
storage
fue
l
Coal/biomass conversion to fuels and electricity with CCS
flu
e g
ase
s
ph
oto
syn
the
sis
biomass
fuel
co
mb
ust
ion
26Adapted from Larson, et al, “Co-Production of Synfuels and Electricity from Coal + Biomass with Zero Net Carbon Emissions: An Illinois Case
Study,” Energy and Environmental Science, 3(1): 28-42, 2010.
soil / roots
Electricity
BECCS Carbon Flowsb
iom
ass
up
stre
am e
mis
sio
ns
coal
up
stre
am e
mis
sio
ns
char
coalve
hic
le t
ailp
ipe
CO2
storage
fue
l
Coal/biomass conversion to fuels and electricity with CCS
flu
e ga
ses
ph
oto
syn
the
sis
biomassem
issi
on
s
bio
mas
s u
pst
ream
em
issi
on
s
coal
up
stre
am e
mis
sio
ns
char
coal
veh
icle
tai
lpip
e
CO2
storage
fue
l
Coal/biomass conversion to fuels and electricity with CCS
flu
e ga
ses
ph
oto
syn
the
sis
biomass
bio
mas
s u
pst
ream
em
issi
on
s
coal
up
stre
am e
mis
sio
ns
char
coalve
hic
le t
ailp
ipe
CO2
storage
fue
l
Coal/biomass conversion to fuels and electricity with CCS
flu
e g
ase
s
ph
oto
syn
the
sis
biomass
bio
mas
s u
pst
ream
em
issi
on
s
coal
up
stre
am e
mis
sio
ns
char
coal
veh
icle
tai
lpip
eCO2
storagefu
el
Coal/biomass conversion to fuels and electricity with CCS
flu
e g
ase
s
ph
oto
syn
the
sis
biomass
Production Facility
bio
mas
s u
pst
ream
em
issi
on
s
coal
up
stre
am e
mis
sio
ns
char
coal
veh
icle
tai
lpip
e
CO2
storage
fue
l
Coal/biomass conversion to fuels and electricity with CCS
flu
e g
ase
s
ph
oto
syn
the
sis
biomass
fuel
co
mb
ust
ion
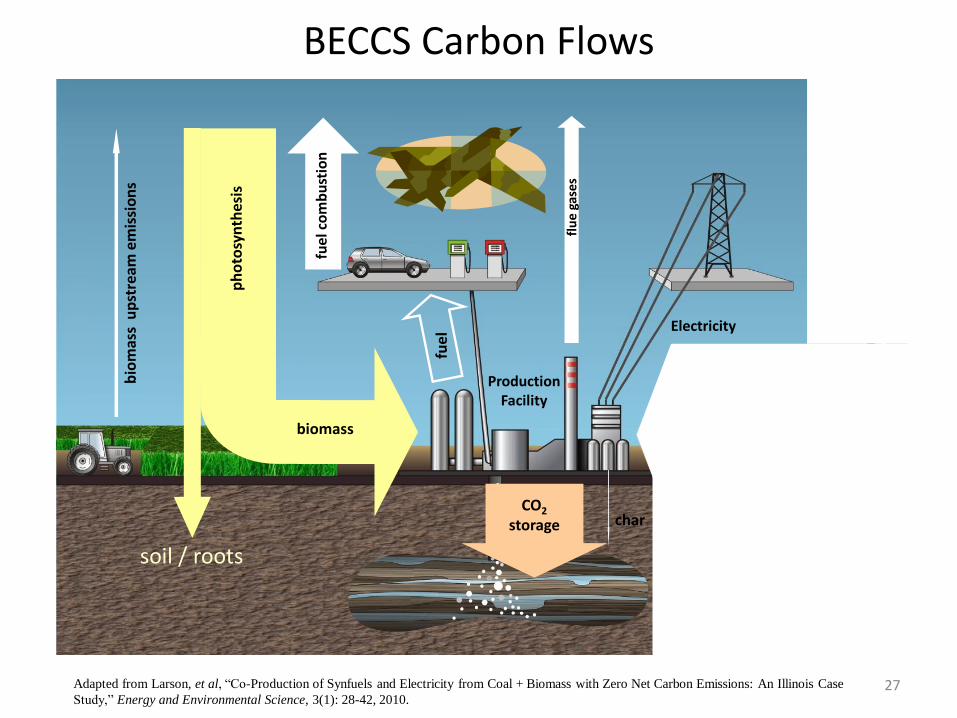
27Adapted from Larson, et al, “Co-Production of Synfuels and Electricity from Coal + Biomass with Zero Net Carbon Emissions: An Illinois Case
Study,” Energy and Environmental Science, 3(1): 28-42, 2010.
soil / roots
Electricity
BECCS Carbon Flowsb
iom
ass
up
stre
am e
mis
sio
ns
coal
up
stre
am e
mis
sio
ns
char
coalve
hic
le t
ailp
ipe
CO2
storage
fue
l
Coal/biomass conversion to fuels and electricity with CCS
flu
e ga
ses
ph
oto
syn
the
sis
biomassem
issi
on
s
bio
mas
s u
pst
ream
em
issi
on
s
coal
up
stre
am e
mis
sio
ns
char
coal
veh
icle
tai
lpip
e
CO2
storage
fue
l
Coal/biomass conversion to fuels and electricity with CCS
flu
e ga
ses
ph
oto
syn
the
sis
biomass
bio
mas
s u
pst
ream
em
issi
on
s
coal
up
stre
am e
mis
sio
ns
char
coalve
hic
le t
ailp
ipe
CO2
storage
fue
l
Coal/biomass conversion to fuels and electricity with CCS
flu
e g
ase
s
ph
oto
syn
the
sis
biomass
bio
mas
s u
pst
ream
em
issi
on
s
coal
up
stre
am e
mis
sio
ns
char
coal
veh
icle
tai
lpip
eCO2
storagefu
el
Coal/biomass conversion to fuels and electricity with CCS
flu
e g
ase
s
ph
oto
syn
the
sis
biomass
Production Facility
bio
mas
s u
pst
ream
em
issi
on
s
coal
up
stre
am e
mis
sio
ns
char
coal
veh
icle
tai
lpip
e
CO2
storage
fue
l
Coal/biomass conversion to fuels and electricity with CCS
flu
e g
ase
s
ph
oto
syn
the
sis
biomass
fuel
co
mb
ust
ion
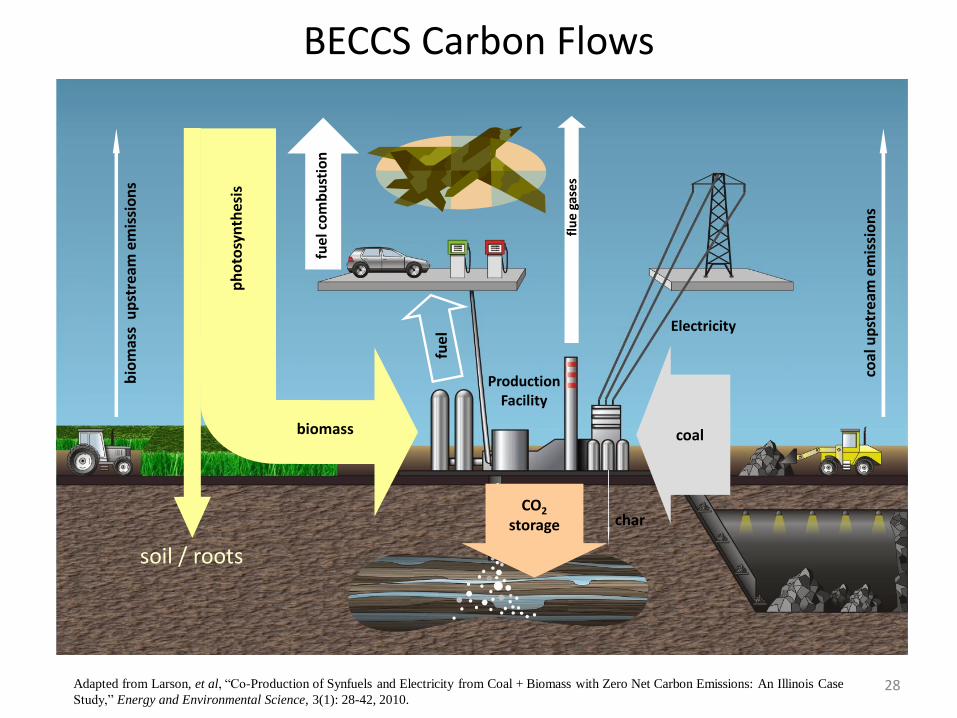
28Adapted from Larson, et al, “Co-Production of Synfuels and Electricity from Coal + Biomass with Zero Net Carbon Emissions: An Illinois Case
Study,” Energy and Environmental Science, 3(1): 28-42, 2010.
soil / roots
Electricity
29
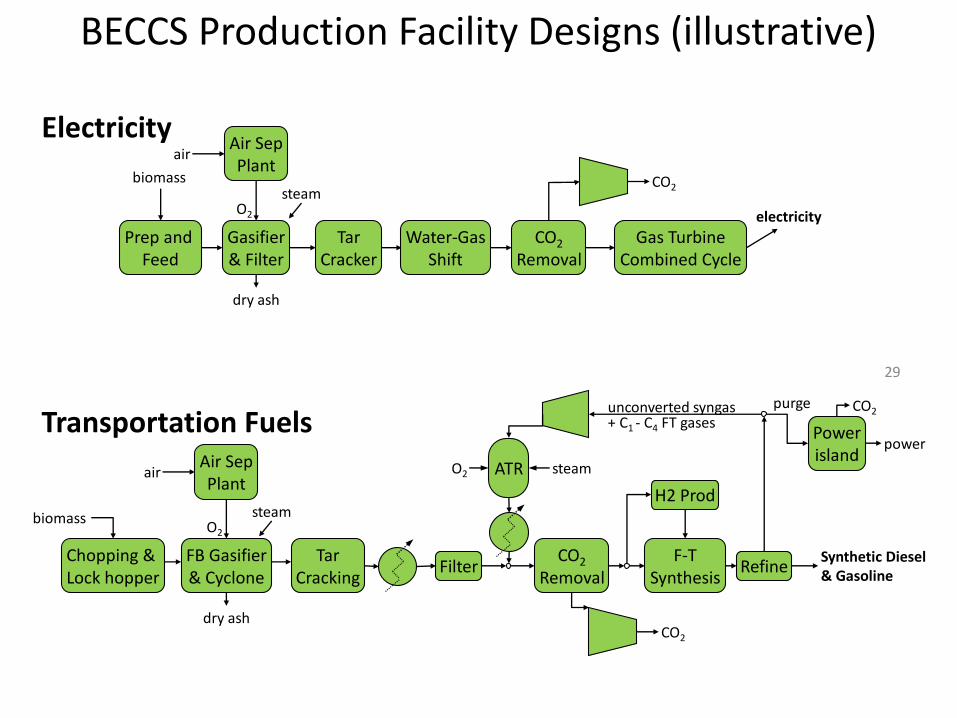
Transportation Fuels
Electricity
CO2
RemovalGas Turbine
Combined Cycle
CO2
Gasifier& Filter
Prep and Feed
biomass
TarCracker
steam
dry ash
O2
Air SepPlant
air
electricity
Water-GasShift
CO2
RemovalRefine
F-TSynthesis
CO2
Synthetic Diesel & Gasoline
unconverted syngas+ C1 - C4 FT gases
H2 Prod
purge
Powerisland
power
ATRO2 steam
FB Gasifier& Cyclone
Chopping & Lock hopper
biomass
TarCracking
steam
dry ash
Filter
O2
Air SepPlant
air
CO2
BECCS Production Facility Designs (illustrative)

What do integrated assessment models like about BECCS technologies?
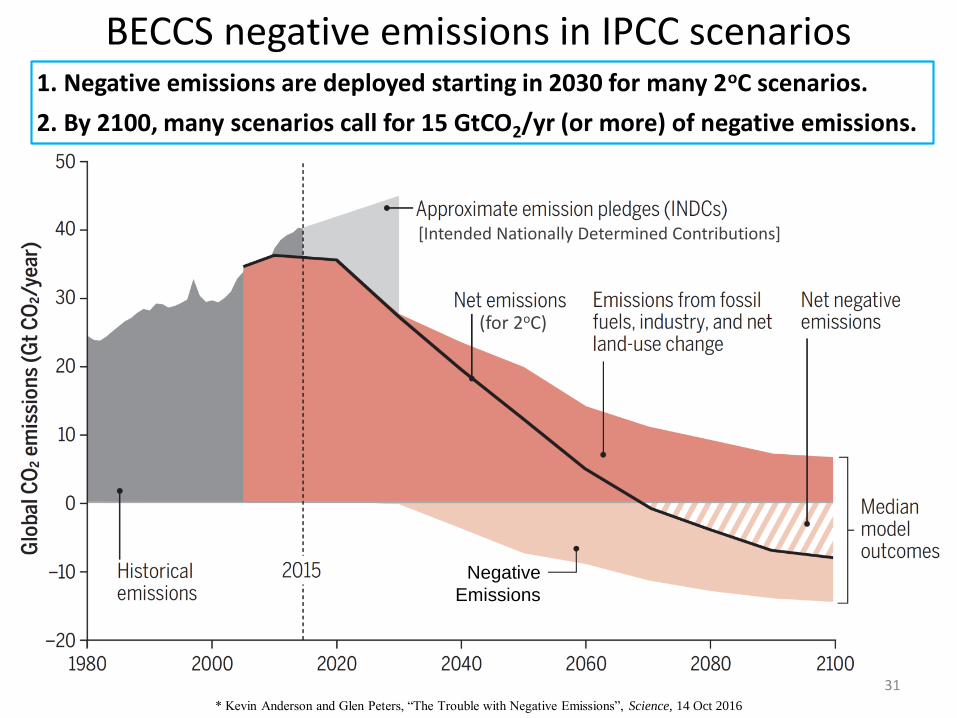
31
1. Negative emissions are deployed starting in 2030 for many 2oC scenarios.
2. By 2100, many scenarios call for 15 GtCO2/yr (or more) of negative emissions.
[Intended Nationally Determined Contributions]
* Kevin Anderson and Glen Peters, “The Trouble with Negative Emissions”, Science, 14 Oct 2016
(for 2oC)
BECCS negative emissions in IPCC scenarios
Negative
Emissions
0
25
50
75
100
125
150
0 20 40 60 80 100 120 140 160
Leve
lized
Co
st o
f El
ectr
icit
y (2
01
2$
/ M
Wh
e)
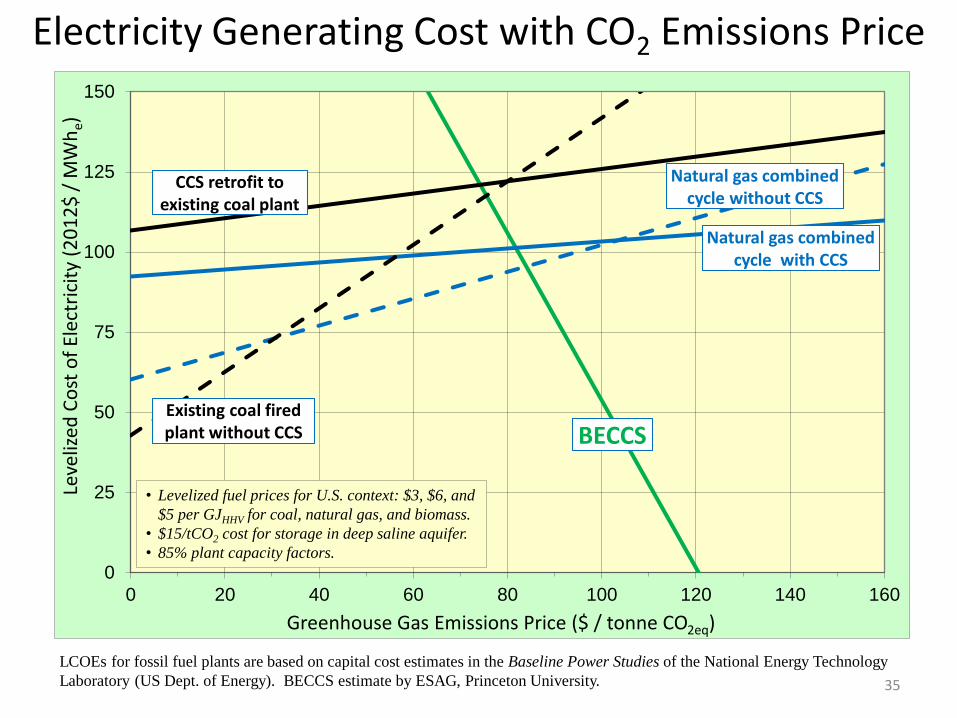
Greenhouse Gas Emissions Price ($ / tonne CO2eq)
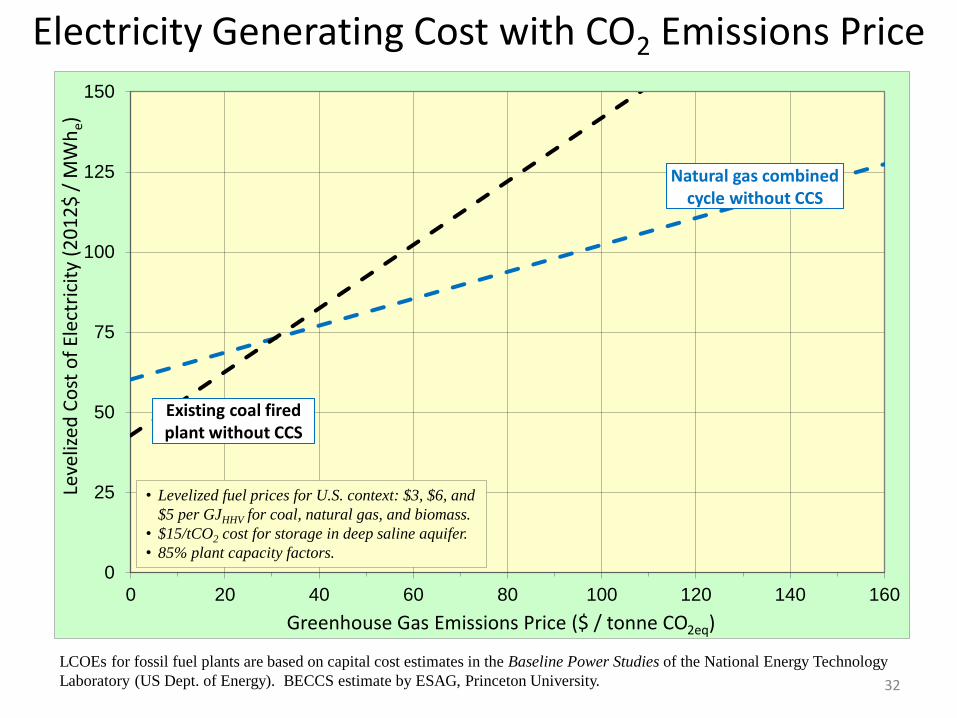
Existing coal fired plant without CCS
Electricity Generating Cost with CO2 Emissions Price
LCOEs for fossil fuel plants are based on capital cost estimates in the Baseline Power Studies of the National Energy Technology
Laboratory (US Dept. of Energy). BECCS estimate by ESAG, Princeton University.
• Levelized fuel prices for U.S. context: $3, $6, and
$5 per GJHHV for coal, natural gas, and biomass.
• $15/tCO2 cost for storage in deep saline aquifer.
• 85% plant capacity factors.
Natural gas combined cycle without CCS
32
0
25
50
75
100
125
150
0 20 40 60 80 100 120 140 160
Leve
lized
Co
st o
f El
ectr
icit
y (2
01
2$
/ M
Wh
e)
Greenhouse Gas Emissions Price ($ / tonne CO2eq)
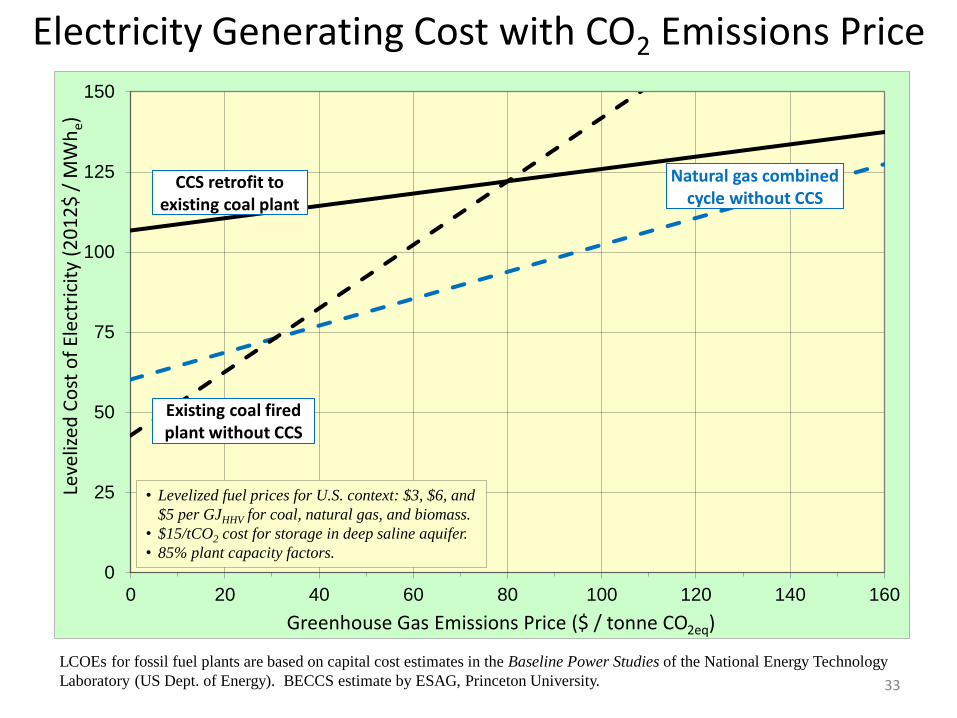
CCS retrofit to existing coal plant
Existing coal fired plant without CCS
Electricity Generating Cost with CO2 Emissions Price
LCOEs for fossil fuel plants are based on capital cost estimates in the Baseline Power Studies of the National Energy Technology
Laboratory (US Dept. of Energy). BECCS estimate by ESAG, Princeton University.
• Levelized fuel prices for U.S. context: $3, $6, and
$5 per GJHHV for coal, natural gas, and biomass.
• $15/tCO2 cost for storage in deep saline aquifer.
• 85% plant capacity factors.
Natural gas combined cycle without CCS
33

0
25
50
75
100
125
150
0 20 40 60 80 100 120 140 160
Leve
lized
Co
st o
f El
ectr
icit
y (2
01
2$
/ M
Wh
e)
Greenhouse Gas Emissions Price ($ / tonne CO2eq)
CCS retrofit to existing coal plant
Existing coal fired plant without CCS
Natural gas combined cycle with CCS
Electricity Generating Cost with CO2 Emissions Price
LCOEs for fossil fuel plants are based on capital cost estimates in the Baseline Power Studies of the National Energy Technology
Laboratory (US Dept. of Energy). BECCS estimate by ESAG, Princeton University.
• Levelized fuel prices for U.S. context: $3, $6, and
$5 per GJHHV for coal, natural gas, and biomass.
• $15/tCO2 cost for storage in deep saline aquifer.
• 85% plant capacity factors.
Natural gas combined cycle without CCS
34
0
25
50
75
100
125
150
0 20 40 60 80 100 120 140 160
Leve
lized
Co
st o
f El
ectr
icit
y (2
01
2$
/ M
Wh
e)
Greenhouse Gas Emissions Price ($ / tonne CO2eq)
BECCS
CCS retrofit to existing coal plant
Existing coal fired plant without CCS
Natural gas combined cycle with CCS
Electricity Generating Cost with CO2 Emissions Price
LCOEs for fossil fuel plants are based on capital cost estimates in the Baseline Power Studies of the National Energy Technology
Laboratory (US Dept. of Energy). BECCS estimate by ESAG, Princeton University.
• Levelized fuel prices for U.S. context: $3, $6, and
$5 per GJHHV for coal, natural gas, and biomass.
• $15/tCO2 cost for storage in deep saline aquifer.
• 85% plant capacity factors.
Natural gas combined cycle without CCS
35
Can the world produce enough biomass sustainably for BECCS in a 2oC scenario?
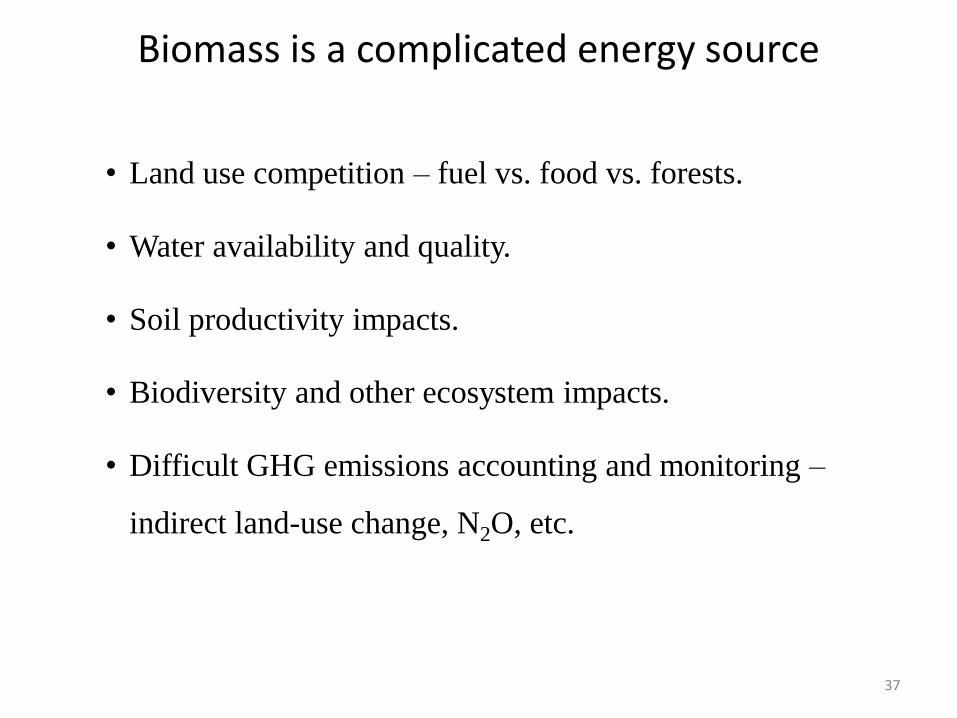
Biomass is a complicated energy source
37
• Land use competition – fuel vs. food vs. forests.
• Water availability and quality.
• Soil productivity impacts.
• Biodiversity and other ecosystem impacts.
• Difficult GHG emissions accounting and monitoring –
indirect land-use change, N2O, etc.
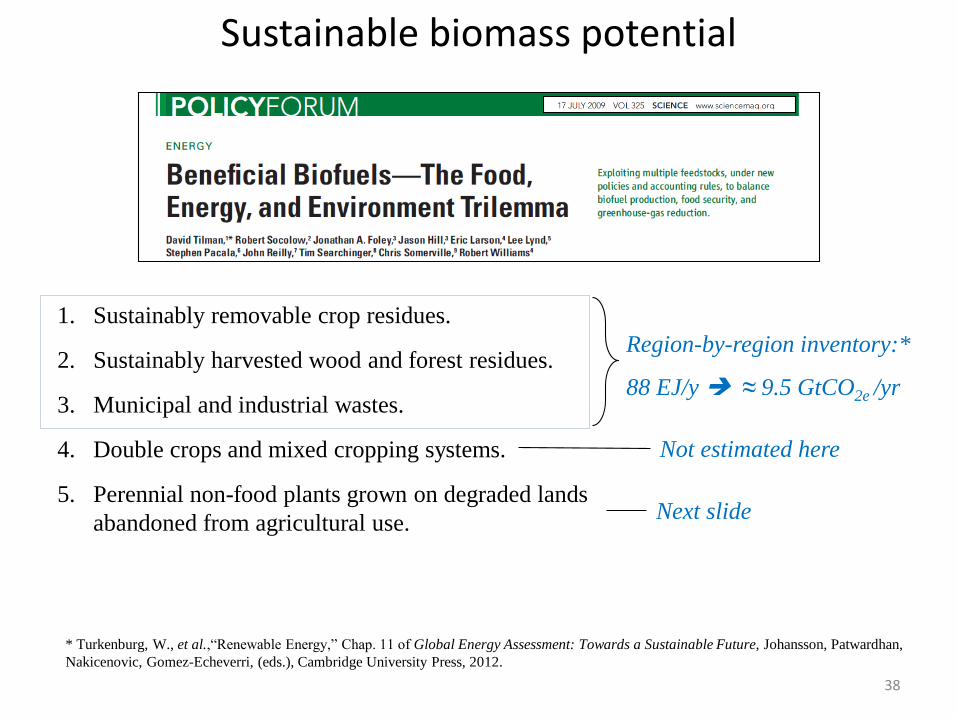
Sustainable biomass potential
1. Sustainably removable crop residues.
2. Sustainably harvested wood and forest residues.
3. Municipal and industrial wastes.
4. Double crops and mixed cropping systems.
5. Perennial non-food plants grown on degraded lands
abandoned from agricultural use.
* Turkenburg, W., et al.,“Renewable Energy,” Chap. 11 of Global Energy Assessment: Towards a Sustainable Future, Johansson, Patwardhan,
Nakicenovic, Gomez-Echeverri, (eds.), Cambridge University Press, 2012.
Region-by-region inventory:*
88 EJ/y ≈ 9.5 GtCO2e /yr
Not estimated here
Next slide
38
39
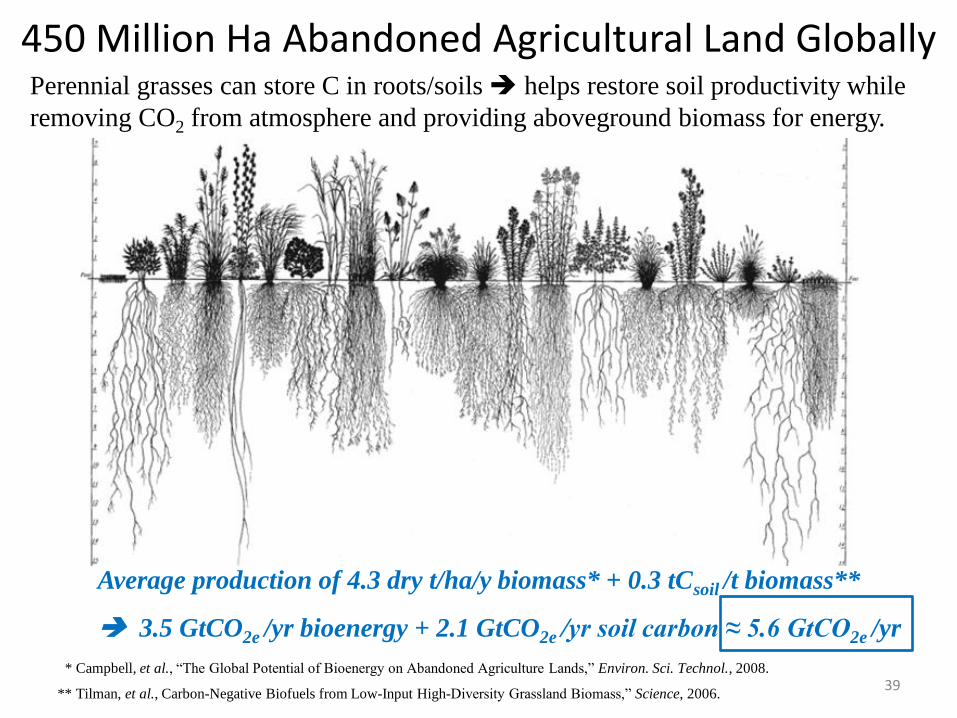
Perennial grasses can store C in roots/soils helps restore soil productivity while
removing CO2 from atmosphere and providing aboveground biomass for energy.
* Campbell, et al., “The Global Potential of Bioenergy on Abandoned Agriculture Lands,” Environ. Sci. Technol., 2008.
** Tilman, et al., Carbon-Negative Biofuels from Low-Input High-Diversity Grassland Biomass,” Science, 2006.
450 Million Ha Abandoned Agricultural Land Globally
Average production of 4.3 dry t/ha/y biomass* + 0.3 tCsoil /t biomass**
3.5 GtCO2e /yr bioenergy + 2.1 GtCO2e /yr soil carbon ≈ 5.6 GtCO2e /yr
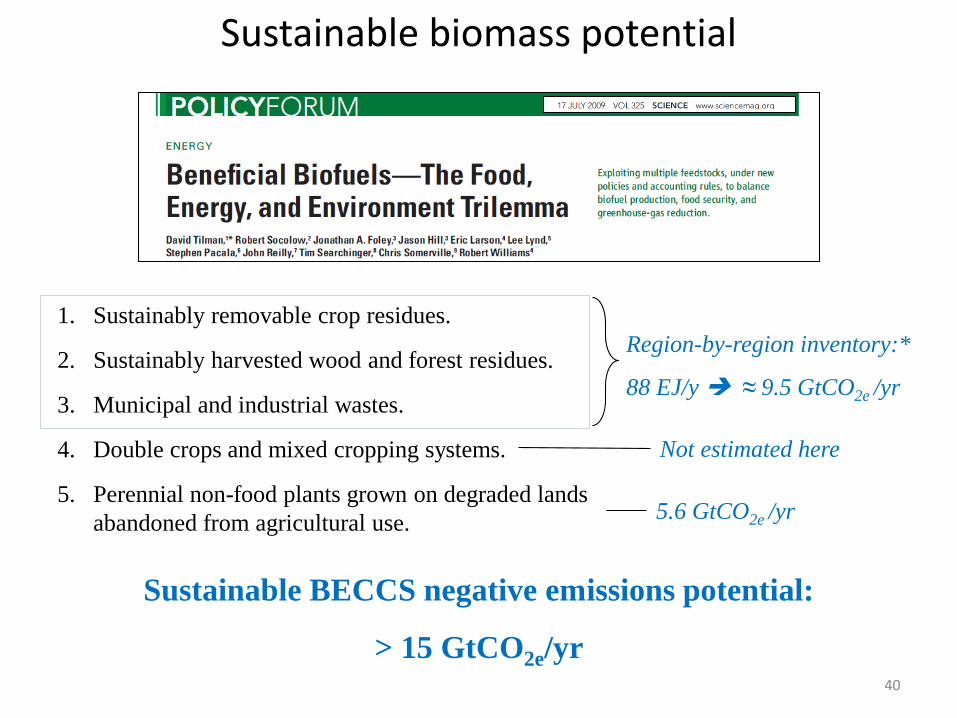
Sustainable biomass potential
1. Sustainably removable crop residues.
2. Sustainably harvested wood and forest residues.
3. Municipal and industrial wastes.
4. Double crops and mixed cropping systems.
5. Perennial non-food plants grown on degraded lands
abandoned from agricultural use.
Region-by-region inventory:*
88 EJ/y ≈ 9.5 GtCO2e /yr
Not estimated here
5.6 GtCO2e /yr
Sustainable BECCS negative emissions potential:
> 15 GtCO2e/yr40

What are key challenges to BECCS deployment?
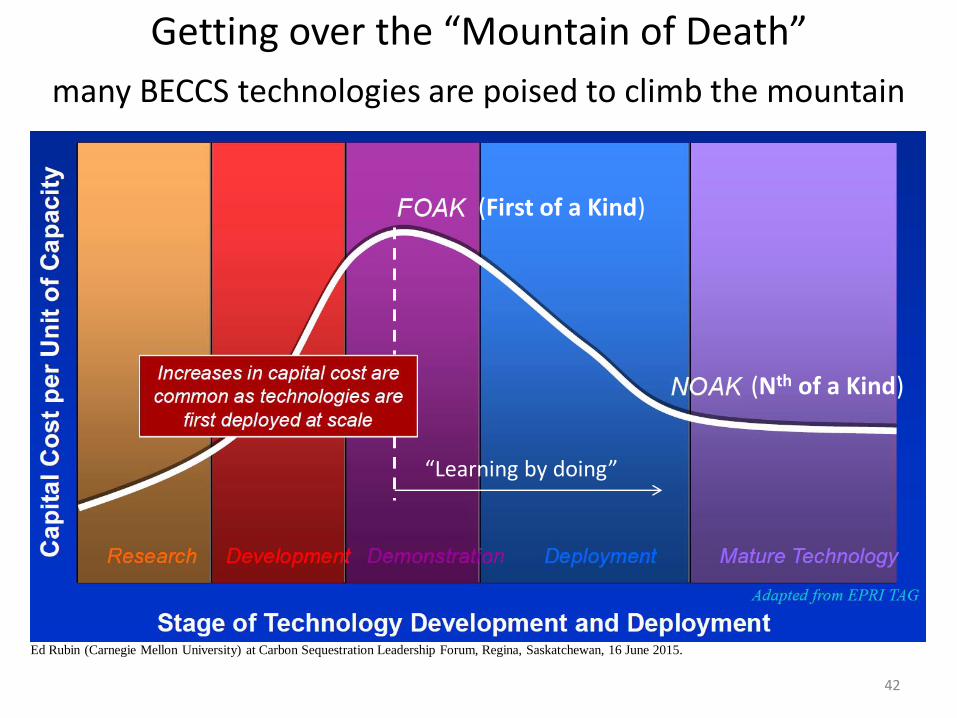
42
Ed Rubin (Carnegie Mellon University) at Carbon Sequestration Leadership Forum, Regina, Saskatchewan, 16 June 2015.
Getting over the “Mountain of Death”
many BECCS technologies are poised to climb the mountain
“Learning by doing”
(First of a Kind)
(Nth of a Kind)
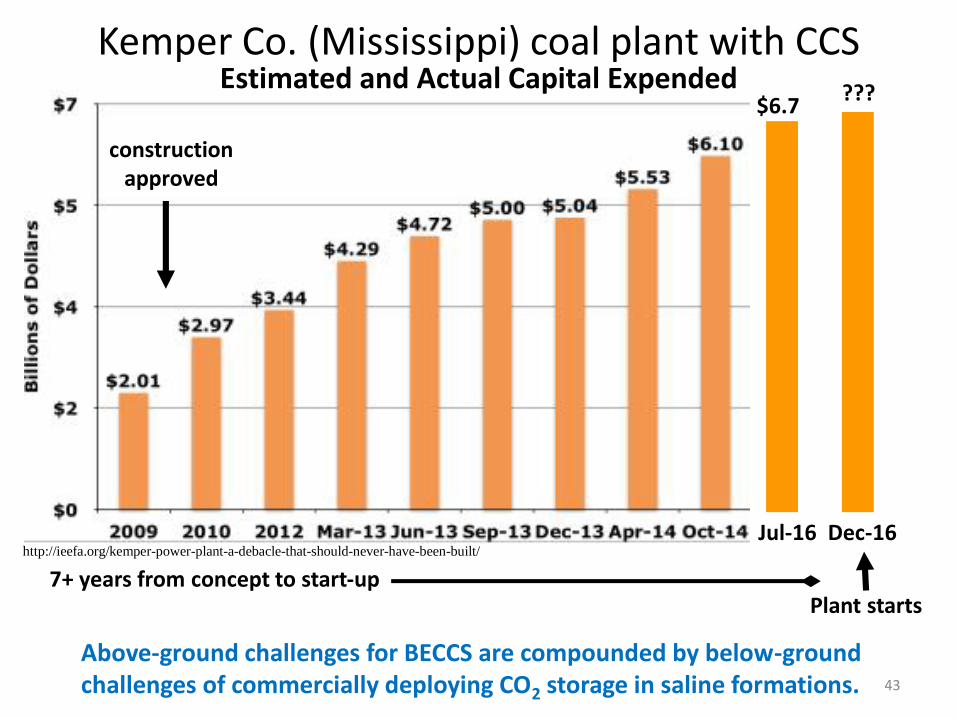
http://ieefa.org/kemper-power-plant-a-debacle-that-should-never-have-been-built/
$6.7
Jul-16
Kemper Co. (Mississippi) coal plant with CCS
construction approved
Plant starts
Dec-16
???
7+ years from concept to start-up
Estimated and Actual Capital Expended
Above-ground challenges for BECCS are compounded by below-ground challenges of commercially deploying CO2 storage in saline formations. 43
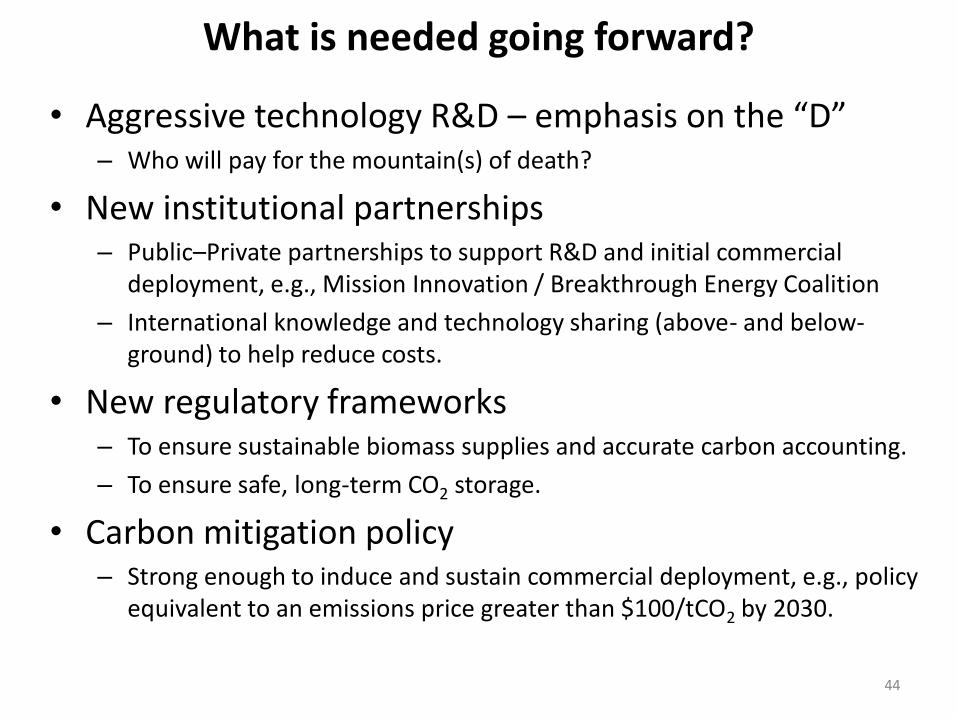
• Aggressive technology R&D – emphasis on the “D” – Who will pay for the mountain(s) of death?
• New institutional partnerships– Public–Private partnerships to support R&D and initial commercial
deployment, e.g., Mission Innovation / Breakthrough Energy Coalition
– International knowledge and technology sharing (above- and below-ground) to help reduce costs.
• New regulatory frameworks– To ensure sustainable biomass supplies and accurate carbon accounting.
– To ensure safe, long-term CO2 storage.
• Carbon mitigation policy– Strong enough to induce and sustain commercial deployment, e.g., policy
equivalent to an emissions price greater than $100/tCO2 by 2030.
44
What is needed going forward?
Geologic Storage of Carbon DioxideUsing Geoscience to Predict the Future:
How to assure what goes down stays down
Susan HovorkaGulf Coast Carbon Center
Bureau of Economic GeologyJackson School of Geosciences
The University of Texas at Austin
Presented February 1, 2017, To Restoring the Climate Balance Webinar

What is Geologic Sequestration?To reduce CO2 emissions
to air from point sources..
Carbon extracted
from a coal or other
fossil fuel…
is currently burned and
emitted to air
CO2 is captured as concentrated
high pressure fluid by one of several
methods..
CO2 is shipped as supercritical
fluid via pipeline to a selected,
permitted injection site
CO2 injected at pressure into
pore space at depths
below and isolated (sequestered)
from potable water.
CO2 stored in pore space
over geologically
significant time frames.
46
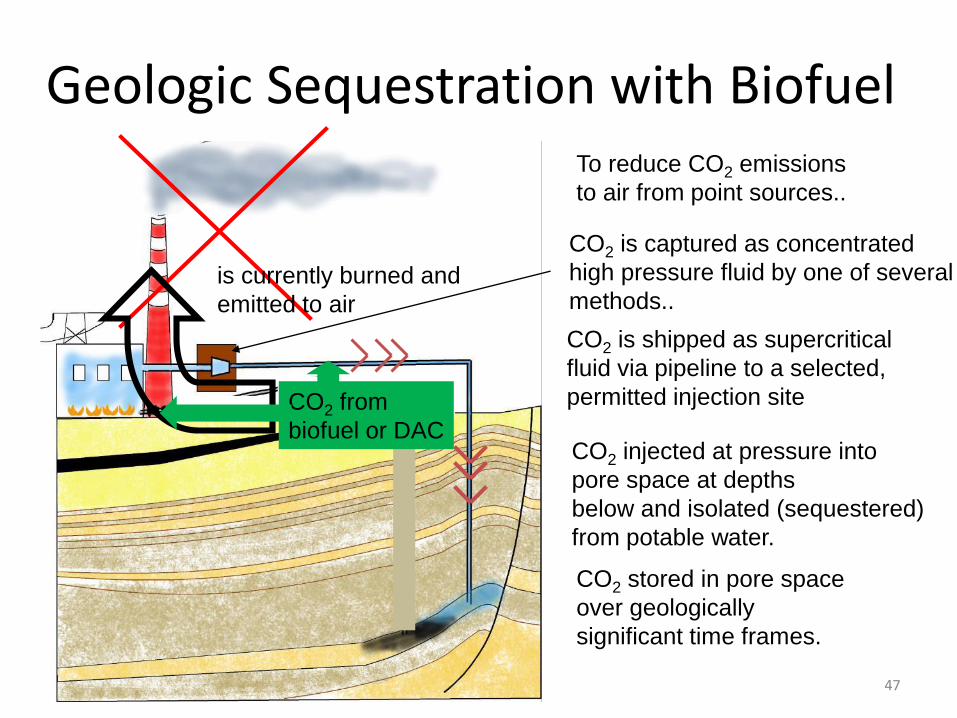
Geologic Sequestration with BiofuelTo reduce CO2 emissions
to air from point sources..
is currently burned and
emitted to air
CO2 is captured as concentrated
high pressure fluid by one of several
methods..
CO2 is shipped as supercritical
fluid via pipeline to a selected,
permitted injection site
CO2 injected at pressure into
pore space at depths
below and isolated (sequestered)
from potable water.
CO2 stored in pore space
over geologically
significant time frames.
CO2 from
biofuel or DAC
47
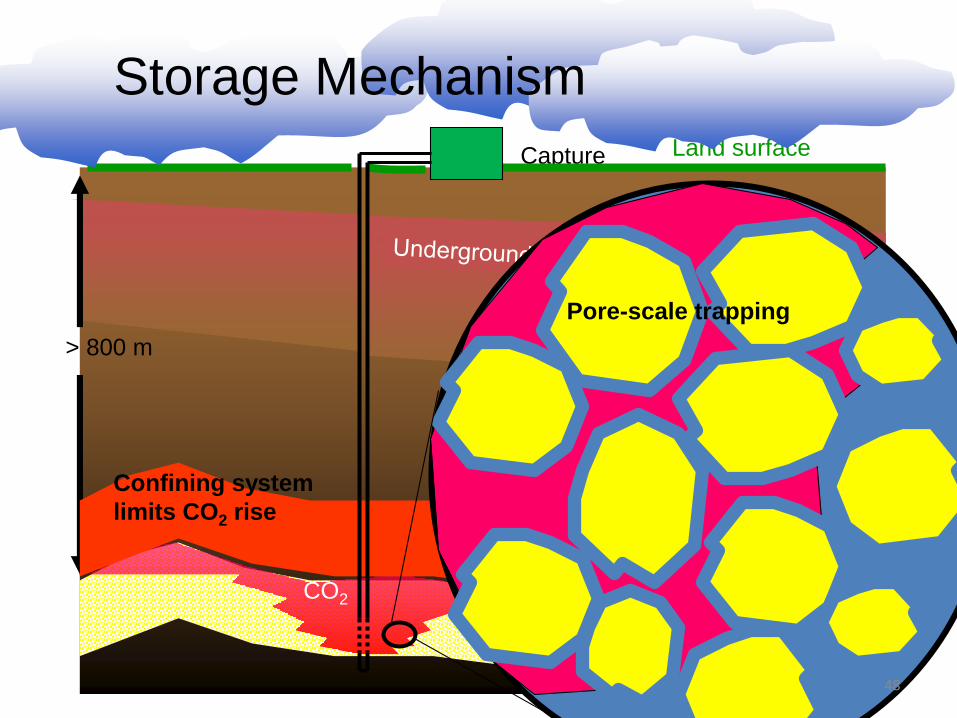
Capture Land surface
> 800 m
Injection Zone
CO2
Confining system
limits CO2 rise
Injection zone
Brine displaced
Pore-scale trapping
Storage Mechanism
48

G. Laske and G. Masters, A Global Digital Map of Sediment Thickness, EOS Trans. AGU, 78, F483, 1997 GIS by Ruth Costly, BEG
Where can this storage occur: Thickness of Sedimentary Cover
Prospect under studyProspect No prospect
49

Predicting the future: Will what goes down stay down?
• Analog studies
– Hydrocarbon migration and trapping
– Injected CO2 for EOR
• Reservoir characterization and fluid flow modeling
– Research projects to test value of models
• Monitoring to provide assurance of correctness of models
50
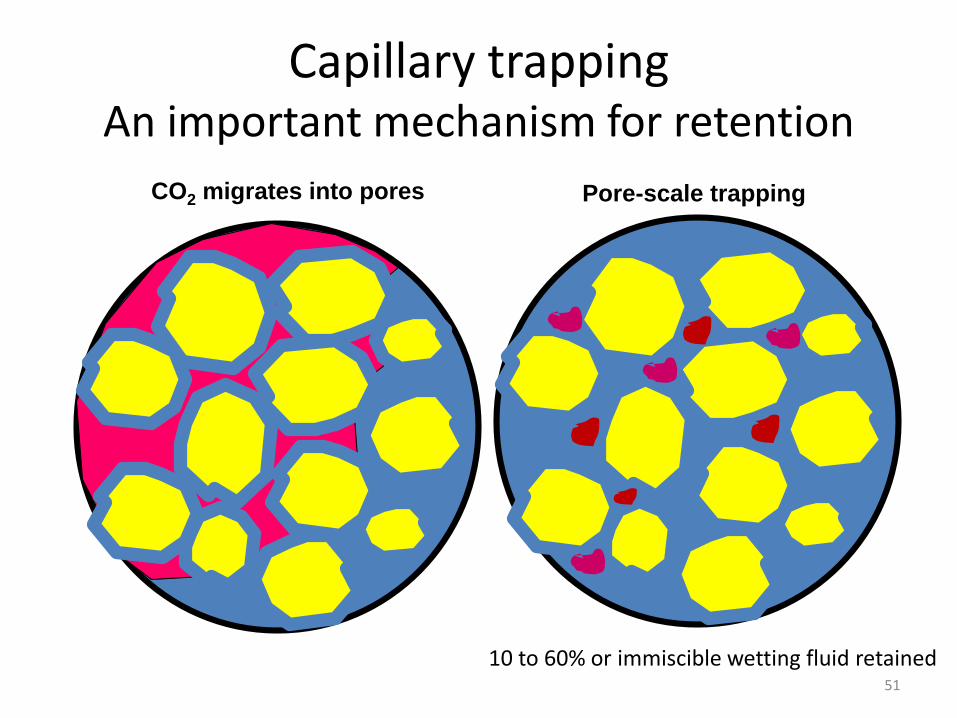
Capillary trappingAn important mechanism for retention
Pore-scale trappingCO2 migrates into pores
10 to 60% or immiscible wetting fluid retained51
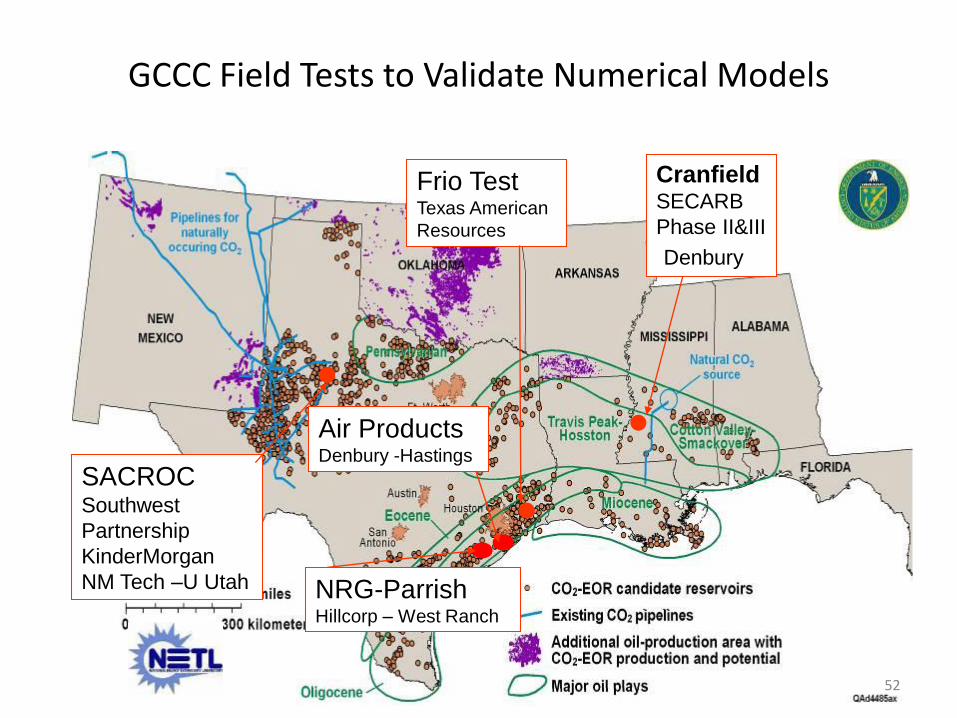
GCCC Field Tests to Validate Numerical Models
CranfieldSECARB
Phase II&III
Denbury
Frio Test Texas American
Resources
SACROCSouthwest
Partnership
KinderMorgan
NM Tech –U Utah
Air ProductsDenbury -Hastings
NRG-ParrishHillcorp – West Ranch
52
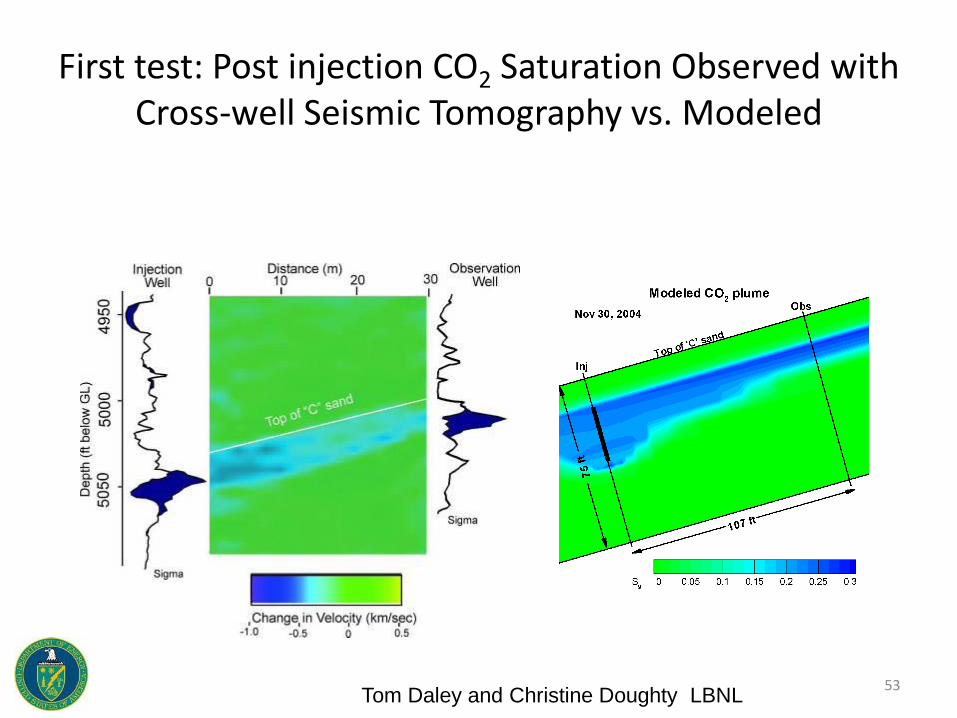
First test: Post injection CO2 Saturation Observed with Cross-well Seismic Tomography vs. Modeled
Tom Daley and Christine Doughty LBNL53

Measurement at a Well:Saturation logging (RST ) Observation well to measure
changes in CO2 saturation – match to model
Shinichi Sakurai, Jeff Kane, Christine Doughty
LithologyV/V0 1
5010
5020
5030
5040
5050
5000
DEPTHFEET
RST gas sat.V/V1 0
Model gas sat.V/V1 0
RST gas sat.V/V1 0
V/V1 0
RST gas sat.V/V1 0
V/V1 0
RST gas sat.V/V1 0
V/V1 0
RST gas sat.V/V1 0
V/V1 0
RST gas sat.V/V1 0
Log porosityV/V0.4 0
Model porosityV/V0.4 0
Model permmD10000 1
Day 4 Day 10 Day 29 Day 69 Day 142 Day 474
Model gas sat. Model gas sat. Model gas sat. Model gas sat.
Post injection
54
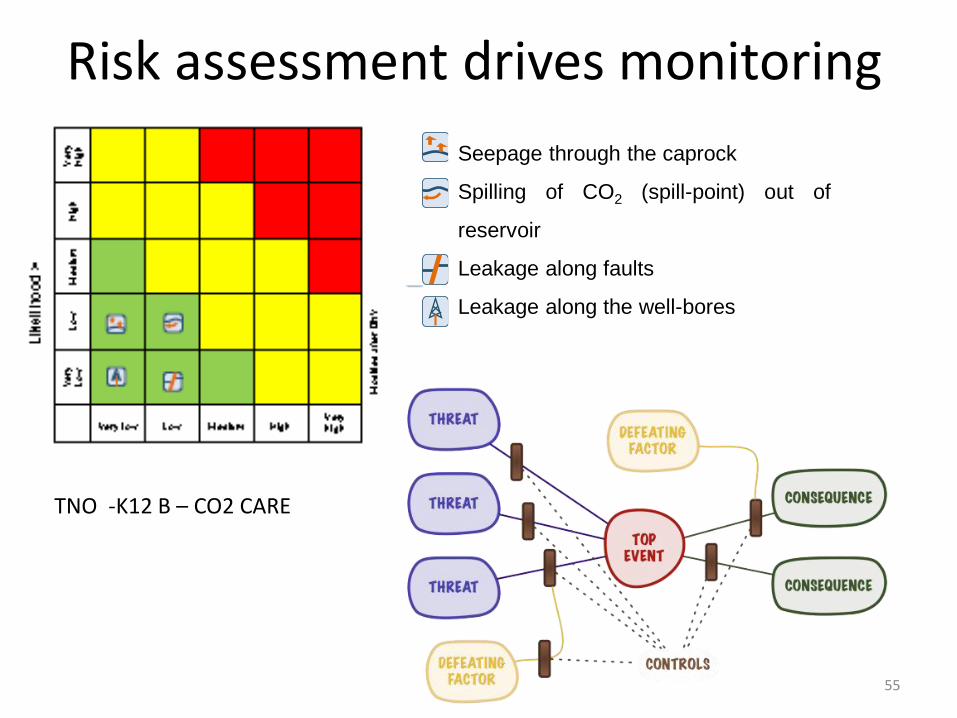
Risk assessment drives monitoring
Seepage through the caprock
Spilling of CO2 (spill-point) out of
reservoir
Leakage along faults
Leakage along the well-bores
TNO -K12 B – CO2 CARE
55
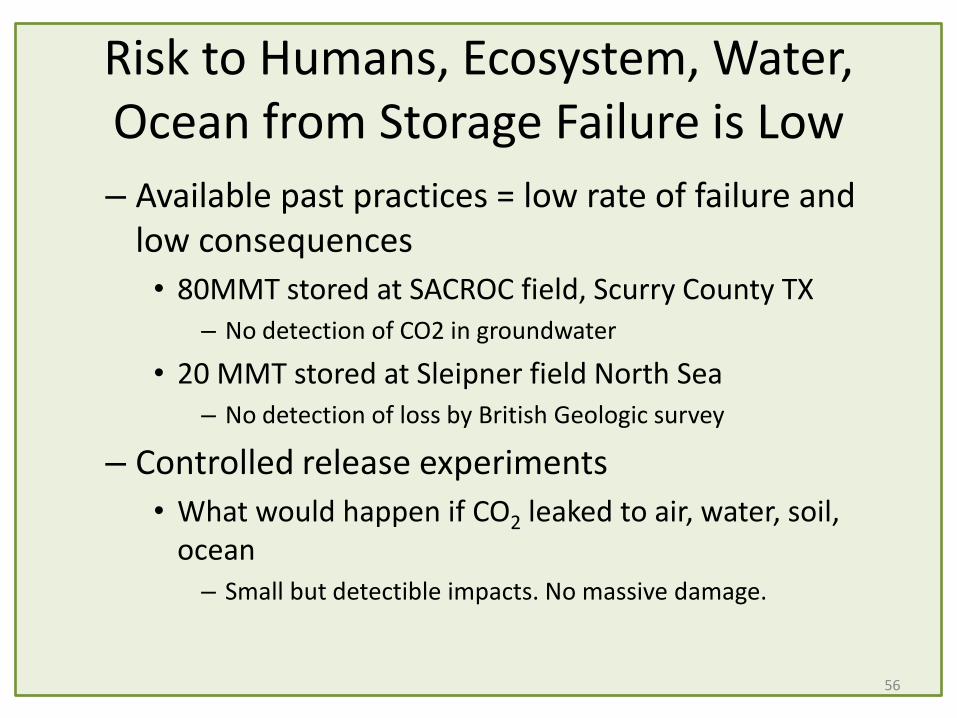
Risk to Humans, Ecosystem, Water, Ocean from Storage Failure is Low
– Available past practices = low rate of failure and low consequences
• 80MMT stored at SACROC field, Scurry County TX– No detection of CO2 in groundwater
• 20 MMT stored at Sleipner field North Sea– No detection of loss by British Geologic survey
– Controlled release experiments
• What would happen if CO2 leaked to air, water, soil, ocean
– Small but detectible impacts. No massive damage.
56
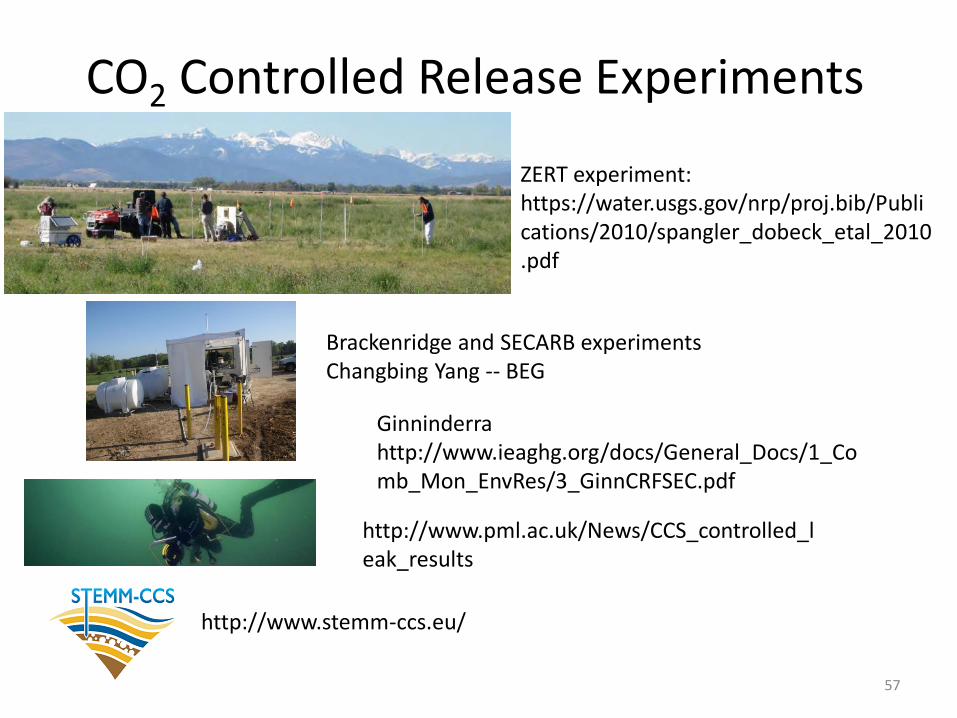
CO2 Controlled Release Experiments
http://www.stemm-ccs.eu/
http://www.pml.ac.uk/News/CCS_controlled_leak_results
Ginninderra http://www.ieaghg.org/docs/General_Docs/1_Comb_Mon_EnvRes/3_GinnCRFSEC.pdf
ZERT experiment: https://water.usgs.gov/nrp/proj.bib/Publications/2010/spangler_dobeck_etal_2010.pdf
Brackenridge and SECARB experimentsChangbing Yang -- BEG
57

Global Research Community
– IEA GHG R&D Program: http://ieaghg.org/
– Global CCS Institute https://www.globalccsinstitute.com/
– US DOE National Energy Technology Lab https://www.netl.doe.gov/research/coal/carbon-storage
– Other major participants globally
58
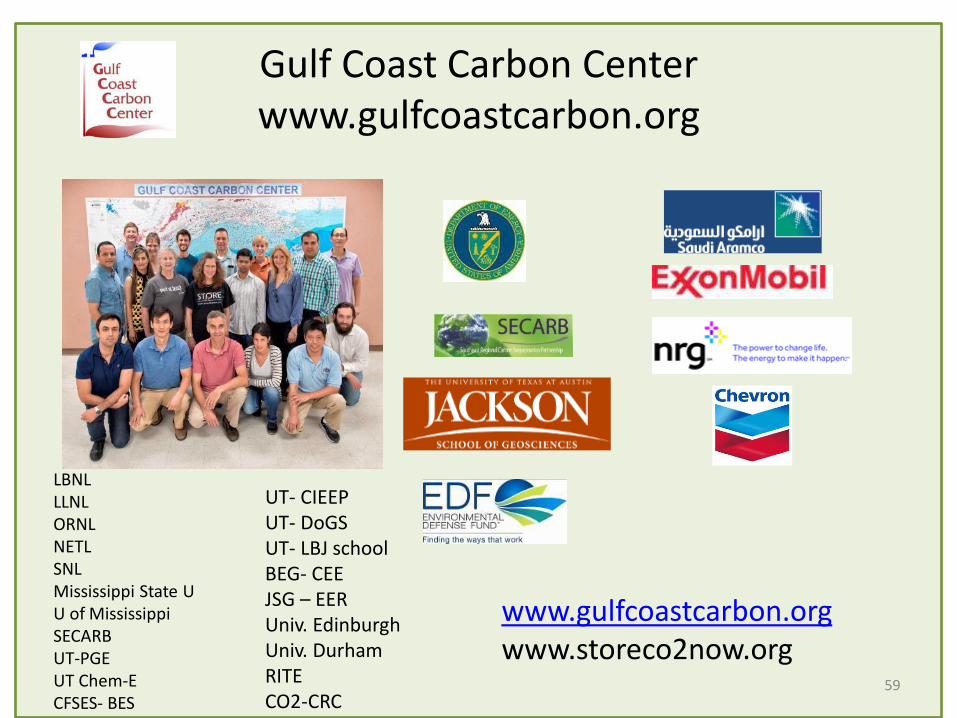
Gulf Coast Carbon Centerwww.gulfcoastcarbon.org
LBNLLLNLORNLNETLSNLMississippi State UU of MississippiSECARBUT-PGE UT Chem-ECFSES- BES
UT- CIEEPUT- DoGSUT- LBJ schoolBEG- CEEJSG – EERUniv. EdinburghUniv. DurhamRITECO2-CRC
www.gulfcoastcarbon.orgwww.storeco2now.org
59
Discussion
Klaus Lackner
Eric Larson
Susan Hovorka
Joel Makower

Thank you for attending! A recording of thiswebinar and the slide presentation will be availablesoon in the SSF Archives at www.ssfonline.org.
(and please take the brief exit survey)
Restoring the Carbon Balance Series
December 15 - Webinar 1: The Imperative
February 1 - Webinar 2: The Technologies
Spring 2017 - Webinar 3: Policies, Financing, Regulations (Registration
opens soon)
Register at www.ssfonline.org
1. Follow “Restoring the Carbon Balance” at
www.lightspeedsolutions.org
Register, Watch Recordings, Access Collateral Material
2. Participate in the RCB Discussions
Join: Restoring the Carbon Balance LinkedIn Group