Embed Size (px)
Citation preview
ICED15
RESULT VISUALIZATION AND DOCUMENTATION OF TOLERANCE SIMULATIONS OF MECHANISMS Walter, Michael Simon Josef; Pribek, Michael; Spruegel, Tobias Constantin; Wartzack, Sandro Friedrich-Alexander-Universität Erlangen-Nürnberg, Germany
Abstract Imprecise manufacturing processes lead to products which differ in their dimensions and shape. As a consequence, the product developer has to specify appropriate tolerances to limit these deviations and thus to ensure the adequate functional and aesthetic quality of the final products. These tolerances, however, affect several departments of a company, such as manufacturing, technical procurement, metrology or quality control. Hence, insights gained during tolerance analysis and tolerance synthesis must be documented and visualized in a clear and comprehensive manner toward all departments involved. This paper presents an academic recommendation on a comprehensive visualization and documentation of the results of statistical tolerance simulations, focusing on systems in motion which underlie different kinds of deviations. These so-called mechanisms demand a more detailed result visualization than common static (non-moving) systems. The implemented academic tool called “Tol/Mech–insight” provides a comprehensive result visualization and documentation for tolerance simulations of mechanisms and may serve as a sufficient basis for decision-making among experts in various departments. Keywords: Robust design, Tolerance representation and management, result visualization Contact: Michael Walter Friedrich-Alexander-Universität Erlangen-Nürnberg Chair of Engineering Design Germany [email protected]
INTERNATIONAL CONFERENCE ON ENGINEERING DESIGN, ICED15 27-30 JULY 2015, POLITECNICO DI MILANO, ITALY
Please cite this paper as: Surnames, Initials: Title of paper. In: Proceedings of the 20th International Conference on Engineering Design
(ICED15), Vol. nn: Title of Volume, Milan, Italy, 27.-30.07.2015
1
ICED15
1 INTRODUCTION
The omnipresent imperfection of current state-of-the-art manufacturing and assembly processes results in products whose parts underlie geometrical and dimensional deviations (Wartzack et al., 2011). Hence, even two products from the same lot – manufactured and assembled in the same plant, under similar conditions, etc. – will differ in geometry and thus in performance and quality. Since such random deviations are inevitable, the product developer has to accept the fact that each artifact of a single part will contain underlies deviations (Sander and Wartzack, 2011; Walter et al., 2014). As a consequence, the responsibility arises for the product developer to analyze the effects of deviations and, if required, to limit these deviations by specifying certain tolerances. However, the corresponding "tolerance management" activities are not very popular among product developers and designers (Krogstie et al., 2015). Even worse, upcoming generations of engineers and designers will be not qualified enough, since "courses on tolerance design have been gradually removed from university curriculums" (Watts, 2007). The consequences may be catastrophic. Excessive tightening of tolerances (e.g., due to an individual's pursuit of safety) causes dramatic increases in manufacturing costs. On the other hand, larger tolerances may reduce the corresponding manufacturing costs, but can lead to functional problems, significantly higher scrap rates as well as decreased customer satisfaction and even sinking reputation. Recently, an example from the automotive industry impressively illustrated the relevance of tolerances and the corresponding consequences for a company's success. In 2014 General Motors announced the recall of 8.4 million cars to correct an issue with the ignition switch (General Motors LLC, 2014). This recall gained huge attention in both national and international media. The effects on their reputation and financial situation were dramatic. Fortune (2014) reported an 86% drop in GM's profit compared with the same quarter in 2013. The said quarter in 2014 has been the worst quarterly result since GM emerged from bankruptcy. In a letter to the US National Highway Traffic Safety Administration, GM stated that “a tolerance stack up condition exists between components internal to the cylinder which will allow some keys to be removed” (General Motors LLC, 2014). Therefore, in the authors' opinion, tolerance management as well as robust design methods (Eifler et al., 2013; Krogstie et al. 2014; Krogstie, 2015) are highly recommended to the design departments of companies worldwide. Nevertheless, it must be stated that tolerance analysis and tolerance synthesis are first and foremost methods which should be in the hands of qualified and well-trained tolerance engineers. However, tolerances affect several departments of a company, such as manufacturing, assembly process planning, technical procurement, metrology, quality control, customer service, and maintenance. Consequently, insights gained during tolerance analysis and tolerance synthesis must be documented and visualized in a clear and comprehensive manner toward all involved departments (Krogstie et al., 2015). The authors claim that an appropriate, objective, intuitive and easy-to-use documentation and visualization of the results is essential for successful tolerance management and thus for fruitful discussions among involved departments in industrial practice and academics. This paper's contribution to the current state of the art is seen in an academic recommendation on a comprehensive visualization and documentation of the results of statistical tolerance analysis and tolerance synthesis. The tolerance engineer is henceforth able to provide detailed, but still comprehensive, result visualization and documentation for tolerance simulations, which may serve as an appropriate basis for decision-making among experts from various departments of a company. The paper focuses on the results of tolerance analyses and tolerance syntheses of systems in motion which underlie different kinds of deviations. These so-called mechanisms are highly complex systems which require more detailed result visualization than common static (non-moving) systems. Henceforth, the visualization is referred to as Tol/Mech – insight. The current status on result visualization and documentation of tolerance simulations is discussed in section 2. Afterwards, the motivation of this work is detailed (section 3). The final visualization tool will be presented in section 4, while a closer view on selected features is given in section 5. The paper closes with a discussion of Tol/Mech – insight and future research activities.
2 STATUS OF TOLERANCE ANALYSIS RESULT VISUALIZATION
The majority of existing works on tolerance management deal with methods and tools in one way or another (Krogstie et al., 2015). The visualization and documentation of results is hardly discussed in publications (Krogstie, 2015). Current software solutions on statistical tolerance analysis only provide
2
ICED15
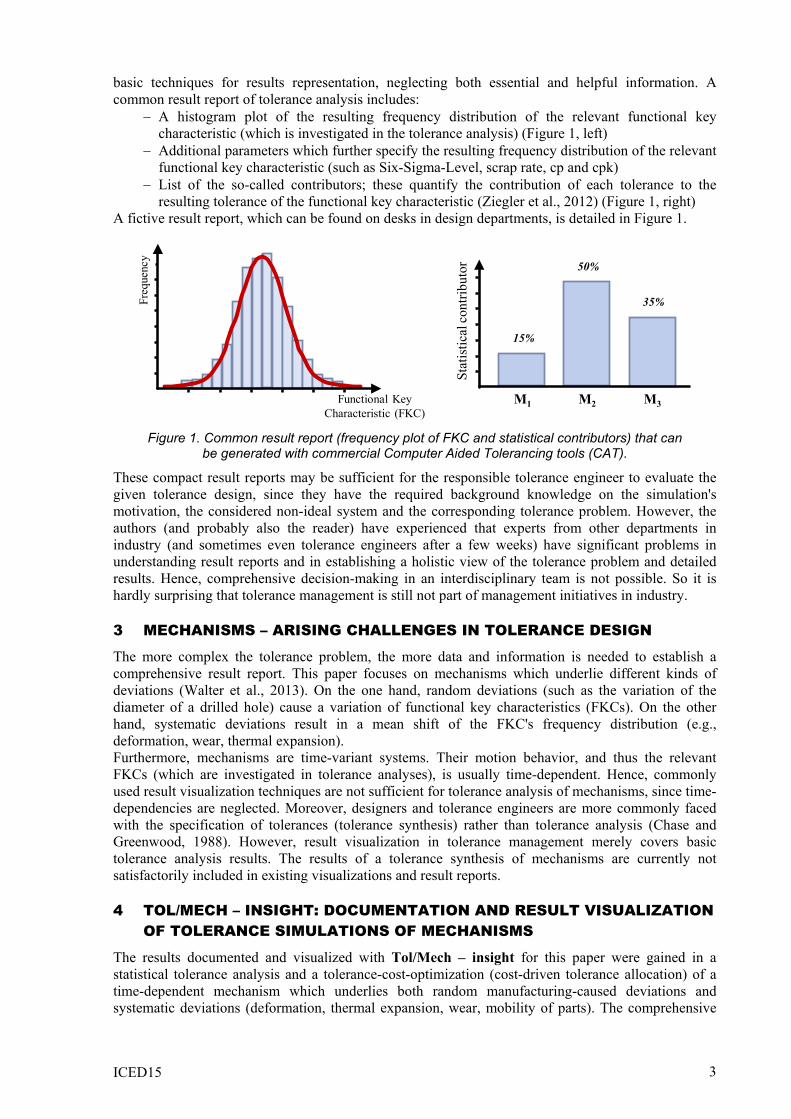
basic techniques for results representation, neglecting both essential and helpful information. A common result report of tolerance analysis includes:
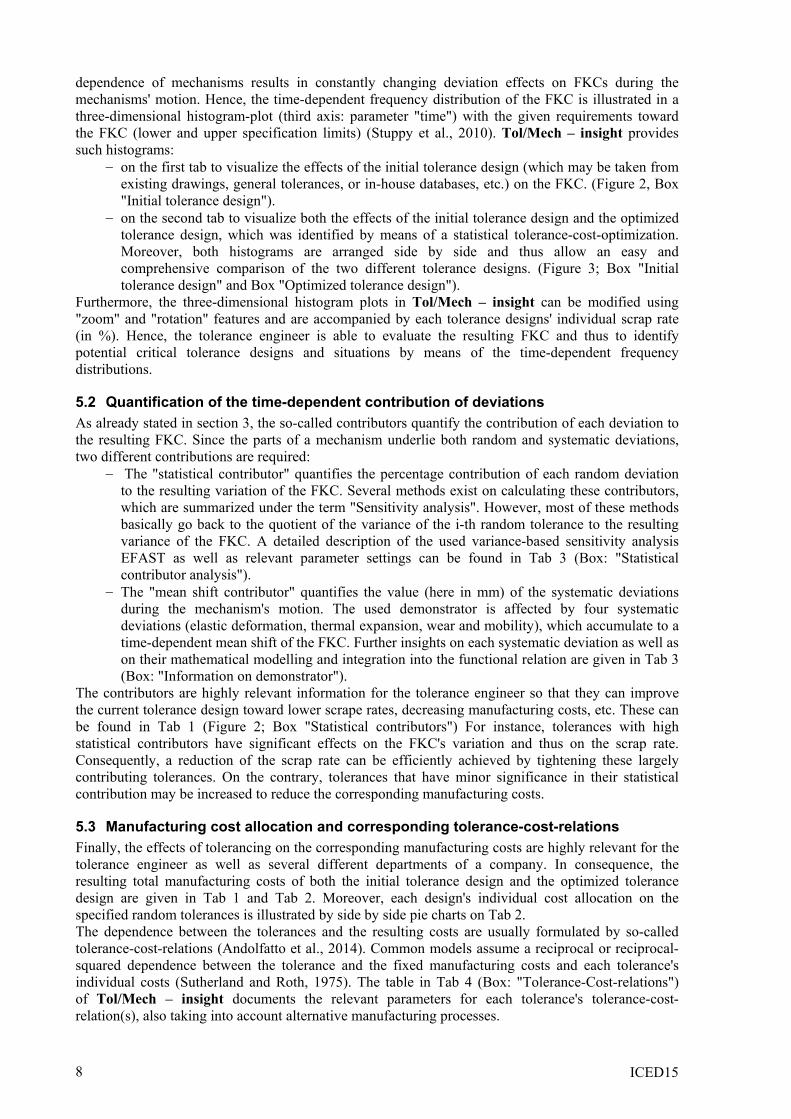
– A histogram plot of the resulting frequency distribution of the relevant functional key characteristic (which is investigated in the tolerance analysis) (Figure 1, left)
– Additional parameters which further specify the resulting frequency distribution of the relevant functional key characteristic (such as Six-Sigma-Level, scrap rate, cp and cpk)
– List of the so-called contributors; these quantify the contribution of each tolerance to the resulting tolerance of the functional key characteristic (Ziegler et al., 2012) (Figure 1, right)
A fictive result report, which can be found on desks in design departments, is detailed in Figure 1.
Figure 1. Common result report (frequency plot of FKC and statistical contributors) that can
be generated with commercial Computer Aided Tolerancing tools (CAT).
These compact result reports may be sufficient for the responsible tolerance engineer to evaluate the given tolerance design, since they have the required background knowledge on the simulation's motivation, the considered non-ideal system and the corresponding tolerance problem. However, the authors (and probably also the reader) have experienced that experts from other departments in industry (and sometimes even tolerance engineers after a few weeks) have significant problems in understanding result reports and in establishing a holistic view of the tolerance problem and detailed results. Hence, comprehensive decision-making in an interdisciplinary team is not possible. So it is hardly surprising that tolerance management is still not part of management initiatives in industry.
3 MECHANISMS – ARISING CHALLENGES IN TOLERANCE DESIGN
The more complex the tolerance problem, the more data and information is needed to establish a comprehensive result report. This paper focuses on mechanisms which underlie different kinds of deviations (Walter et al., 2013). On the one hand, random deviations (such as the variation of the diameter of a drilled hole) cause a variation of functional key characteristics (FKCs). On the other hand, systematic deviations result in a mean shift of the FKC's frequency distribution (e.g., deformation, wear, thermal expansion). Furthermore, mechanisms are time-variant systems. Their motion behavior, and thus the relevant FKCs (which are investigated in tolerance analyses), is usually time-dependent. Hence, commonly used result visualization techniques are not sufficient for tolerance analysis of mechanisms, since time-dependencies are neglected. Moreover, designers and tolerance engineers are more commonly faced with the specification of tolerances (tolerance synthesis) rather than tolerance analysis (Chase and Greenwood, 1988). However, result visualization in tolerance management merely covers basic tolerance analysis results. The results of a tolerance synthesis of mechanisms are currently not satisfactorily included in existing visualizations and result reports.
4 TOL/MECH – INSIGHT: DOCUMENTATION AND RESULT VISUALIZATION OF TOLERANCE SIMULATIONS OF MECHANISMS
The results documented and visualized with Tol/Mech – insight for this paper were gained in a statistical tolerance analysis and a tolerance-cost-optimization (cost-driven tolerance allocation) of a time-dependent mechanism which underlies both random manufacturing-caused deviations and systematic deviations (deformation, thermal expansion, wear, mobility of parts). The comprehensive
Functional Key Characteristic (FKC)
Stat
istic
al co
ntrib
utor
M1 M2 M3
15%
50%
35%Freq
uenc
y
3
ICED15
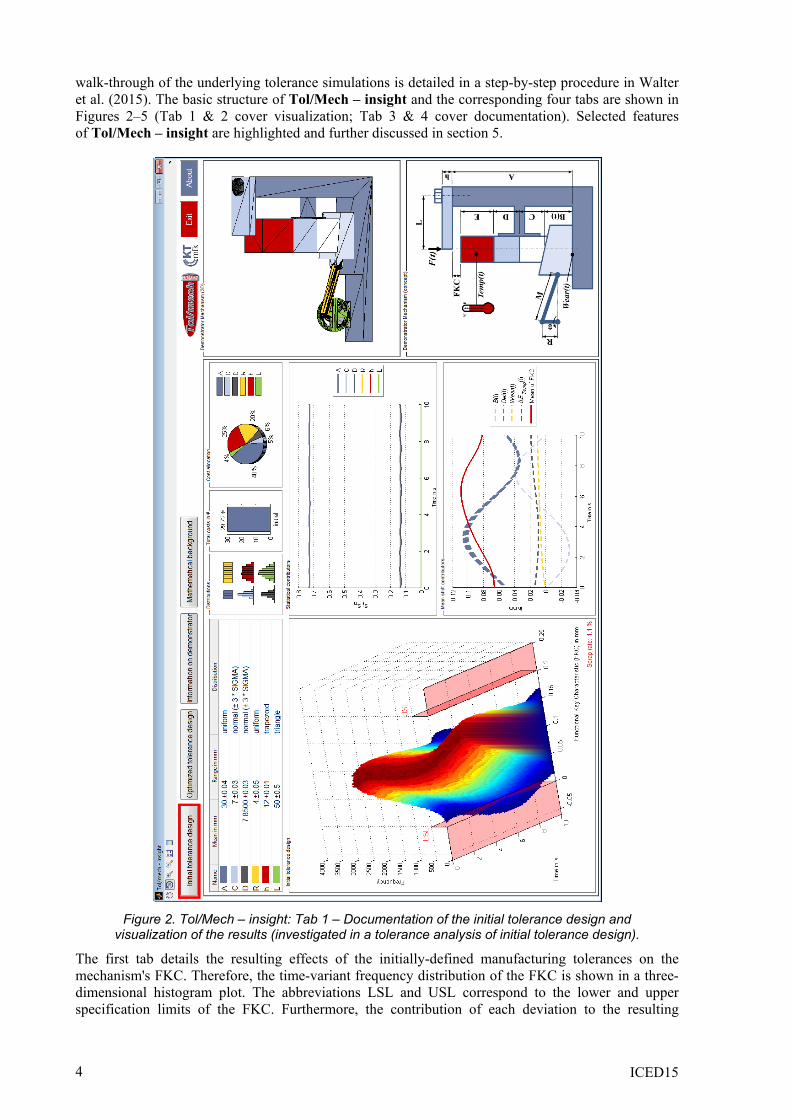
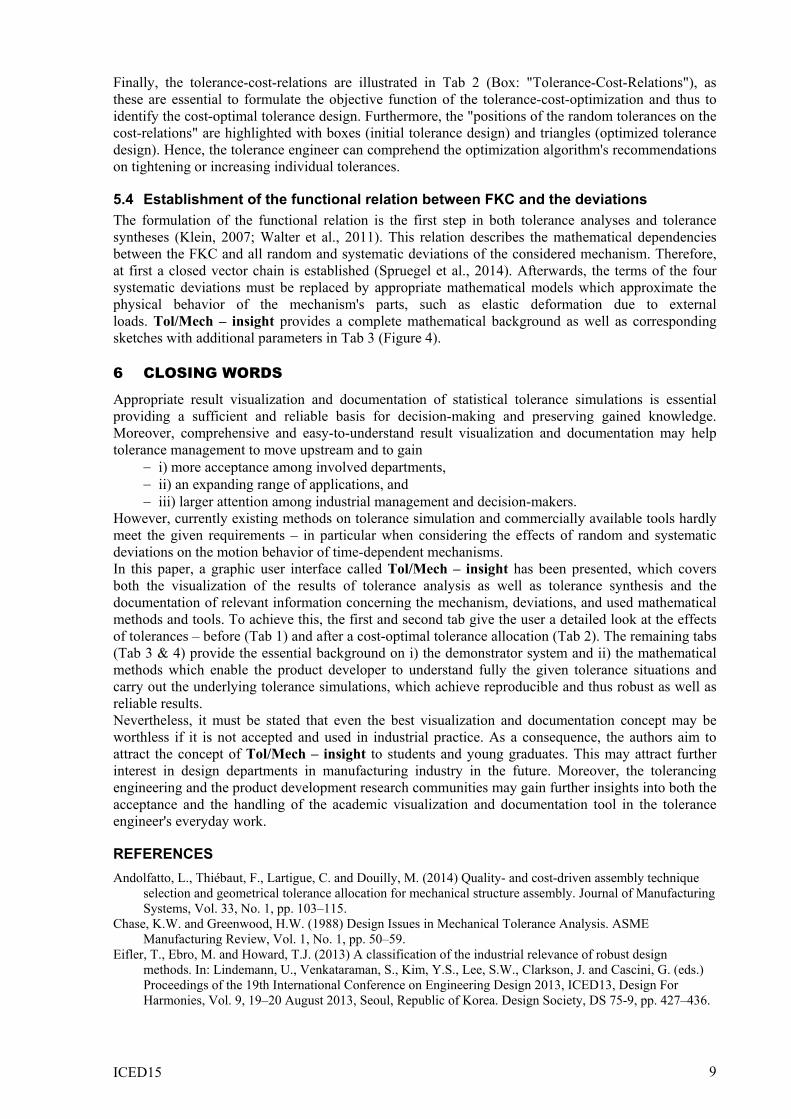
walk-through of the underlying tolerance simulations is detailed in a step-by-step procedure in Walter et al. (2015). The basic structure of Tol/Mech – insight and the corresponding four tabs are shown in Figures 2–5 (Tab 1 & 2 cover visualization; Tab 3 & 4 cover documentation). Selected features of Tol/Mech – insight are highlighted and further discussed in section 5.
Figure 2. Tol/Mech – insight: Tab 1 – Documentation of the initial tolerance design and
visualization of the results (investigated in a tolerance analysis of initial tolerance design).
The first tab details the resulting effects of the initially-defined manufacturing tolerances on the mechanism's FKC. Therefore, the time-variant frequency distribution of the FKC is shown in a three-dimensional histogram plot. The abbreviations LSL and USL correspond to the lower and upper specification limits of the FKC. Furthermore, the contribution of each deviation to the resulting
4
ICED15
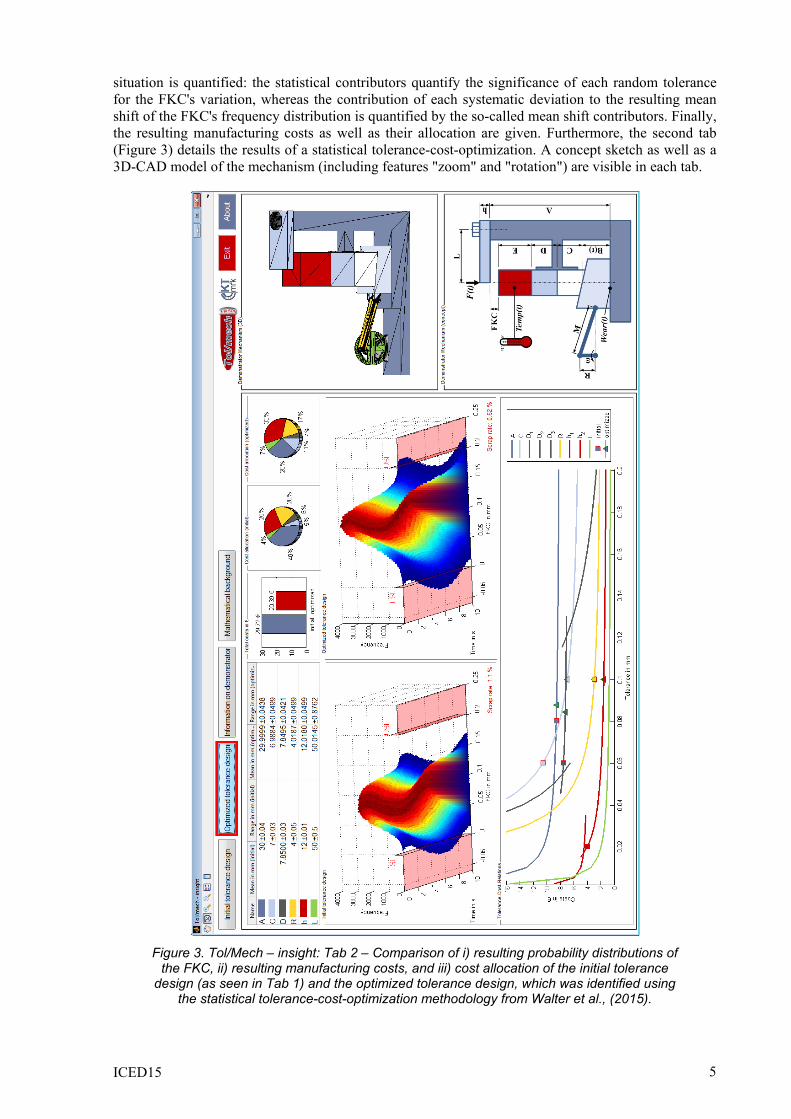
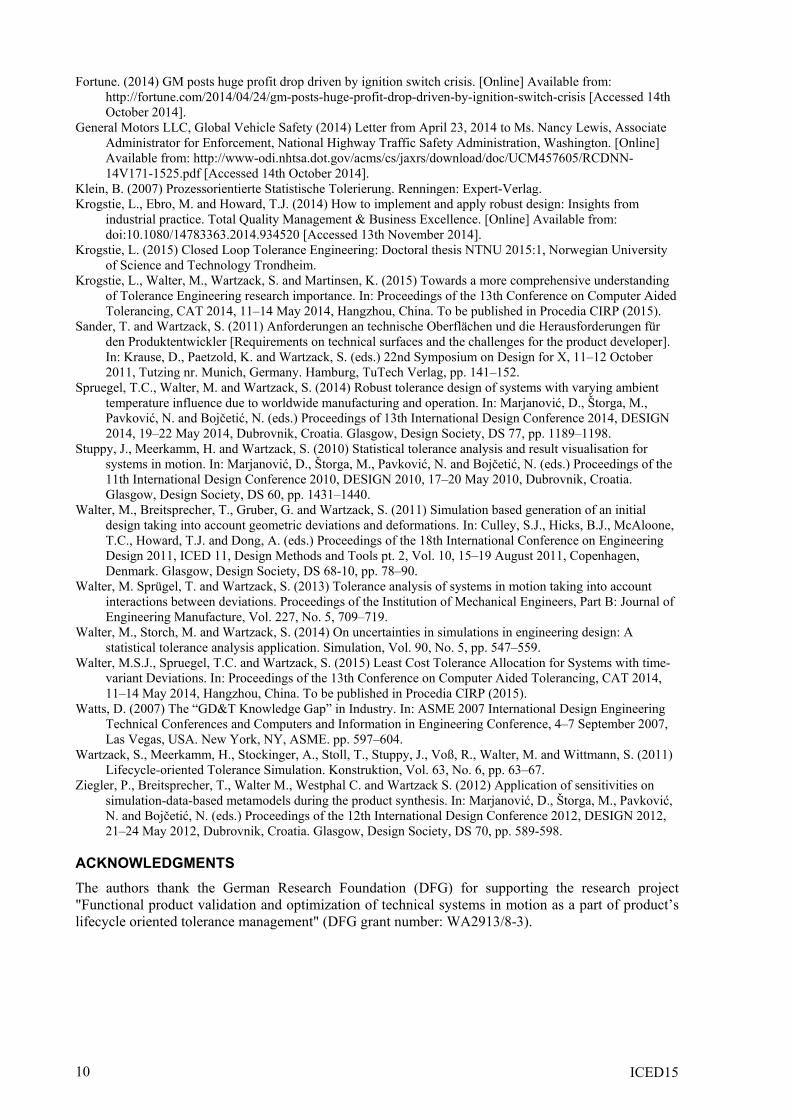
situation is quantified: the statistical contributors quantify the significance of each random tolerance for the FKC's variation, whereas the contribution of each systematic deviation to the resulting mean shift of the FKC's frequency distribution is quantified by the so-called mean shift contributors. Finally, the resulting manufacturing costs as well as their allocation are given. Furthermore, the second tab (Figure 3) details the results of a statistical tolerance-cost-optimization. A concept sketch as well as a 3D-CAD model of the mechanism (including features "zoom" and "rotation") are visible in each tab.
Figure 3. Tol/Mech – insight: Tab 2 – Comparison of i) resulting probability distributions of
the FKC, ii) resulting manufacturing costs, and iii) cost allocation of the initial tolerance design (as seen in Tab 1) and the optimized tolerance design, which was identified using
the statistical tolerance-cost-optimization methodology from Walter et al., (2015).
5
ICED15
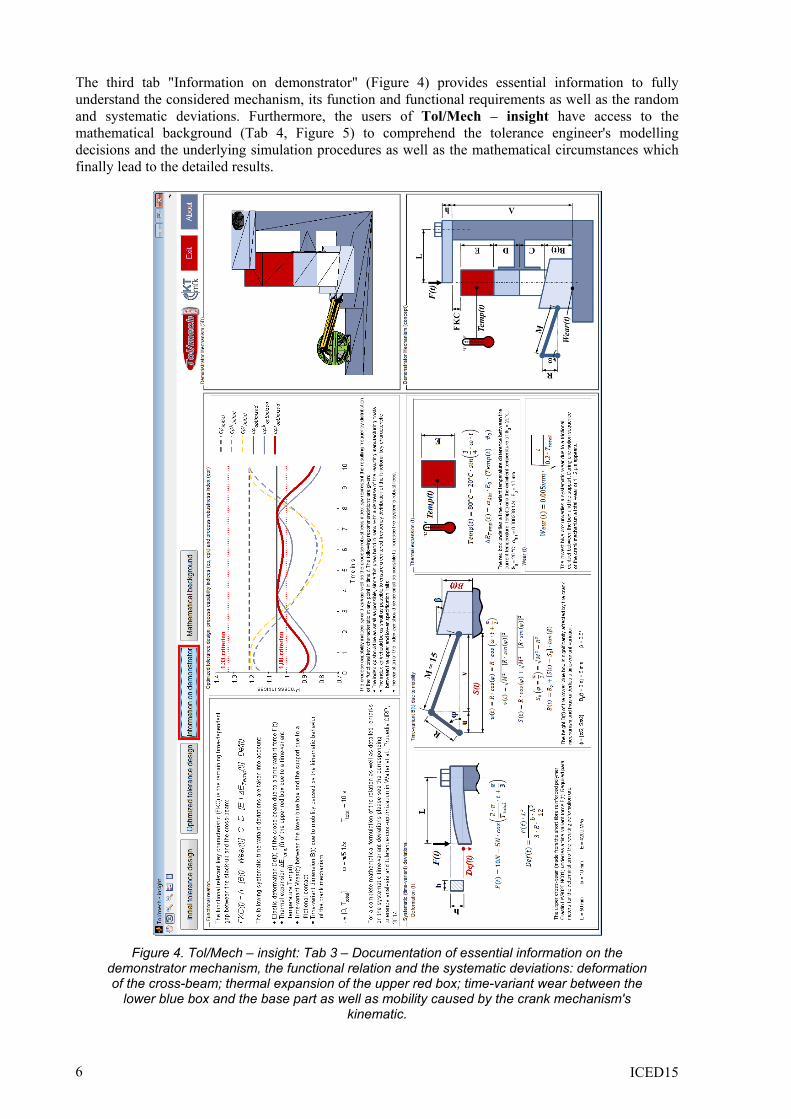
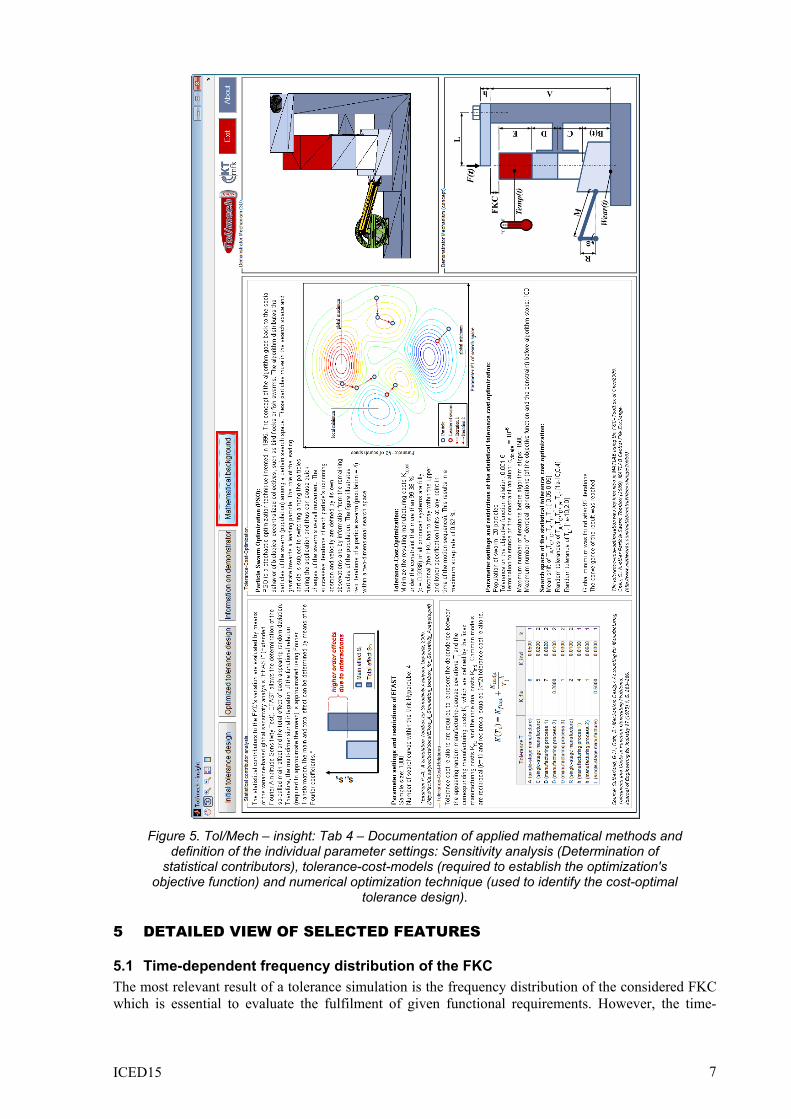
The third tab "Information on demonstrator" (Figure 4) provides essential information to fully understand the considered mechanism, its function and functional requirements as well as the random and systematic deviations. Furthermore, the users of Tol/Mech – insight have access to the mathematical background (Tab 4, Figure 5) to comprehend the tolerance engineer's modelling decisions and the underlying simulation procedures as well as the mathematical circumstances which finally lead to the detailed results.
Figure 4. Tol/Mech – insight: Tab 3 – Documentation of essential information on the
demonstrator mechanism, the functional relation and the systematic deviations: deformation of the cross-beam; thermal expansion of the upper red box; time-variant wear between the
lower blue box and the base part as well as mobility caused by the crank mechanism's kinematic.
6
ICED15
Figure 5. Tol/Mech – insight: Tab 4 – Documentation of applied mathematical methods and
definition of the individual parameter settings: Sensitivity analysis (Determination of statistical contributors), tolerance-cost-models (required to establish the optimization's
objective function) and numerical optimization technique (used to identify the cost-optimal tolerance design).
5 DETAILED VIEW OF SELECTED FEATURES
5.1 Time-dependent frequency distribution of the FKC The most relevant result of a tolerance simulation is the frequency distribution of the considered FKC which is essential to evaluate the fulfilment of given functional requirements. However, the time-
7
ICED15
dependence of mechanisms results in constantly changing deviation effects on FKCs during the mechanisms' motion. Hence, the time-dependent frequency distribution of the FKC is illustrated in a three-dimensional histogram-plot (third axis: parameter "time") with the given requirements toward the FKC (lower and upper specification limits) (Stuppy et al., 2010). Tol/Mech – insight provides such histograms:
– on the first tab to visualize the effects of the initial tolerance design (which may be taken from existing drawings, general tolerances, or in-house databases, etc.) on the FKC. (Figure 2, Box "Initial tolerance design").
– on the second tab to visualize both the effects of the initial tolerance design and the optimized tolerance design, which was identified by means of a statistical tolerance-cost-optimization. Moreover, both histograms are arranged side by side and thus allow an easy and comprehensive comparison of the two different tolerance designs. (Figure 3; Box "Initial tolerance design" and Box "Optimized tolerance design").
Furthermore, the three-dimensional histogram plots in Tol/Mech – insight can be modified using "zoom" and "rotation" features and are accompanied by each tolerance designs' individual scrap rate (in %). Hence, the tolerance engineer is able to evaluate the resulting FKC and thus to identify potential critical tolerance designs and situations by means of the time-dependent frequency distributions.
5.2 Quantification of the time-dependent contribution of deviations As already stated in section 3, the so-called contributors quantify the contribution of each deviation to the resulting FKC. Since the parts of a mechanism underlie both random and systematic deviations, two different contributions are required:
– The "statistical contributor" quantifies the percentage contribution of each random deviation to the resulting variation of the FKC. Several methods exist on calculating these contributors, which are summarized under the term "Sensitivity analysis". However, most of these methods basically go back to the quotient of the variance of the i-th random tolerance to the resulting variance of the FKC. A detailed description of the used variance-based sensitivity analysis EFAST as well as relevant parameter settings can be found in Tab 3 (Box: "Statistical contributor analysis").
– The "mean shift contributor" quantifies the value (here in mm) of the systematic deviations during the mechanism's motion. The used demonstrator is affected by four systematic deviations (elastic deformation, thermal expansion, wear and mobility), which accumulate to a time-dependent mean shift of the FKC. Further insights on each systematic deviation as well as on their mathematical modelling and integration into the functional relation are given in Tab 3 (Box: "Information on demonstrator").
The contributors are highly relevant information for the tolerance engineer so that they can improve the current tolerance design toward lower scrape rates, decreasing manufacturing costs, etc. These can be found in Tab 1 (Figure 2; Box "Statistical contributors") For instance, tolerances with high statistical contributors have significant effects on the FKC's variation and thus on the scrap rate. Consequently, a reduction of the scrap rate can be efficiently achieved by tightening these largely contributing tolerances. On the contrary, tolerances that have minor significance in their statistical contribution may be increased to reduce the corresponding manufacturing costs.
5.3 Manufacturing cost allocation and corresponding tolerance-cost-relations Finally, the effects of tolerancing on the corresponding manufacturing costs are highly relevant for the tolerance engineer as well as several different departments of a company. In consequence, the resulting total manufacturing costs of both the initial tolerance design and the optimized tolerance design are given in Tab 1 and Tab 2. Moreover, each design's individual cost allocation on the specified random tolerances is illustrated by side by side pie charts on Tab 2. The dependence between the tolerances and the resulting costs are usually formulated by so-called tolerance-cost-relations (Andolfatto et al., 2014). Common models assume a reciprocal or reciprocal-squared dependence between the tolerance and the fixed manufacturing costs and each tolerance's individual costs (Sutherland and Roth, 1975). The table in Tab 4 (Box: "Tolerance-Cost-relations") of Tol/Mech – insight documents the relevant parameters for each tolerance's tolerance-cost-relation(s), also taking into account alternative manufacturing processes.
8
ICED15
Finally, the tolerance-cost-relations are illustrated in Tab 2 (Box: "Tolerance-Cost-Relations"), as these are essential to formulate the objective function of the tolerance-cost-optimization and thus to identify the cost-optimal tolerance design. Furthermore, the "positions of the random tolerances on the cost-relations" are highlighted with boxes (initial tolerance design) and triangles (optimized tolerance design). Hence, the tolerance engineer can comprehend the optimization algorithm's recommendations on tightening or increasing individual tolerances.
5.4 Establishment of the functional relation between FKC and the deviations The formulation of the functional relation is the first step in both tolerance analyses and tolerance syntheses (Klein, 2007; Walter et al., 2011). This relation describes the mathematical dependencies between the FKC and all random and systematic deviations of the considered mechanism. Therefore, at first a closed vector chain is established (Spruegel et al., 2014). Afterwards, the terms of the four systematic deviations must be replaced by appropriate mathematical models which approximate the physical behavior of the mechanism's parts, such as elastic deformation due to external loads. Tol/Mech – insight provides a complete mathematical background as well as corresponding sketches with additional parameters in Tab 3 (Figure 4).
6 CLOSING WORDS
Appropriate result visualization and documentation of statistical tolerance simulations is essential providing a sufficient and reliable basis for decision-making and preserving gained knowledge. Moreover, comprehensive and easy-to-understand result visualization and documentation may help tolerance management to move upstream and to gain
– i) more acceptance among involved departments, – ii) an expanding range of applications, and – iii) larger attention among industrial management and decision-makers.
However, currently existing methods on tolerance simulation and commercially available tools hardly meet the given requirements – in particular when considering the effects of random and systematic deviations on the motion behavior of time-dependent mechanisms. In this paper, a graphic user interface called Tol/Mech – insight has been presented, which covers both the visualization of the results of tolerance analysis as well as tolerance synthesis and the documentation of relevant information concerning the mechanism, deviations, and used mathematical methods and tools. To achieve this, the first and second tab give the user a detailed look at the effects of tolerances – before (Tab 1) and after a cost-optimal tolerance allocation (Tab 2). The remaining tabs (Tab 3 & 4) provide the essential background on i) the demonstrator system and ii) the mathematical methods which enable the product developer to understand fully the given tolerance situations and carry out the underlying tolerance simulations, which achieve reproducible and thus robust as well as reliable results. Nevertheless, it must be stated that even the best visualization and documentation concept may be worthless if it is not accepted and used in industrial practice. As a consequence, the authors aim to attract the concept of Tol/Mech – insight to students and young graduates. This may attract further interest in design departments in manufacturing industry in the future. Moreover, the tolerancing engineering and the product development research communities may gain further insights into both the acceptance and the handling of the academic visualization and documentation tool in the tolerance engineer's everyday work.
REFERENCES Andolfatto, L., Thiébaut, F., Lartigue, C. and Douilly, M. (2014) Quality- and cost-driven assembly technique
selection and geometrical tolerance allocation for mechanical structure assembly. Journal of Manufacturing Systems, Vol. 33, No. 1, pp. 103–115.
Chase, K.W. and Greenwood, H.W. (1988) Design Issues in Mechanical Tolerance Analysis. ASME Manufacturing Review, Vol. 1, No. 1, pp. 50–59.
Eifler, T., Ebro, M. and Howard, T.J. (2013) A classification of the industrial relevance of robust design methods. In: Lindemann, U., Venkataraman, S., Kim, Y.S., Lee, S.W., Clarkson, J. and Cascini, G. (eds.) Proceedings of the 19th International Conference on Engineering Design 2013, ICED13, Design For Harmonies, Vol. 9, 19–20 August 2013, Seoul, Republic of Korea. Design Society, DS 75-9, pp. 427–436.
9
ICED15
Fortune. (2014) GM posts huge profit drop driven by ignition switch crisis. [Online] Available from: http://fortune.com/2014/04/24/gm-posts-huge-profit-drop-driven-by-ignition-switch-crisis [Accessed 14th October 2014].
General Motors LLC, Global Vehicle Safety (2014) Letter from April 23, 2014 to Ms. Nancy Lewis, Associate Administrator for Enforcement, National Highway Traffic Safety Administration, Washington. [Online] Available from: http://www-odi.nhtsa.dot.gov/acms/cs/jaxrs/download/doc/UCM457605/RCDNN-14V171-1525.pdf [Accessed 14th October 2014].
Klein, B. (2007) Prozessorientierte Statistische Tolerierung. Renningen: Expert-Verlag. Krogstie, L., Ebro, M. and Howard, T.J. (2014) How to implement and apply robust design: Insights from
industrial practice. Total Quality Management & Business Excellence. [Online] Available from: doi:10.1080/14783363.2014.934520 [Accessed 13th November 2014].
Krogstie, L. (2015) Closed Loop Tolerance Engineering: Doctoral thesis NTNU 2015:1, Norwegian University of Science and Technology Trondheim.
Krogstie, L., Walter, M., Wartzack, S. and Martinsen, K. (2015) Towards a more comprehensive understanding of Tolerance Engineering research importance. In: Proceedings of the 13th Conference on Computer Aided Tolerancing, CAT 2014, 11–14 May 2014, Hangzhou, China. To be published in Procedia CIRP (2015).
Sander, T. and Wartzack, S. (2011) Anforderungen an technische Oberflächen und die Herausforderungen für den Produktentwickler [Requirements on technical surfaces and the challenges for the product developer]. In: Krause, D., Paetzold, K. and Wartzack, S. (eds.) 22nd Symposium on Design for X, 11–12 October 2011, Tutzing nr. Munich, Germany. Hamburg, TuTech Verlag, pp. 141–152.
Spruegel, T.C., Walter, M. and Wartzack, S. (2014) Robust tolerance design of systems with varying ambient temperature influence due to worldwide manufacturing and operation. In: Marjanović, D., Štorga, M., Pavković, N. and Bojčetić, N. (eds.) Proceedings of 13th International Design Conference 2014, DESIGN 2014, 19–22 May 2014, Dubrovnik, Croatia. Glasgow, Design Society, DS 77, pp. 1189–1198.
Stuppy, J., Meerkamm, H. and Wartzack, S. (2010) Statistical tolerance analysis and result visualisation for systems in motion. In: Marjanović, D., Štorga, M., Pavković, N. and Bojčetić, N. (eds.) Proceedings of the 11th International Design Conference 2010, DESIGN 2010, 17–20 May 2010, Dubrovnik, Croatia. Glasgow, Design Society, DS 60, pp. 1431–1440.
Walter, M., Breitsprecher, T., Gruber, G. and Wartzack, S. (2011) Simulation based generation of an initial design taking into account geometric deviations and deformations. In: Culley, S.J., Hicks, B.J., McAloone, T.C., Howard, T.J. and Dong, A. (eds.) Proceedings of the 18th International Conference on Engineering Design 2011, ICED 11, Design Methods and Tools pt. 2, Vol. 10, 15–19 August 2011, Copenhagen, Denmark. Glasgow, Design Society, DS 68-10, pp. 78–90.
Walter, M. Sprügel, T. and Wartzack, S. (2013) Tolerance analysis of systems in motion taking into account interactions between deviations. Proceedings of the Institution of Mechanical Engineers, Part B: Journal of Engineering Manufacture, Vol. 227, No. 5, 709–719.
Walter, M., Storch, M. and Wartzack, S. (2014) On uncertainties in simulations in engineering design: A statistical tolerance analysis application. Simulation, Vol. 90, No. 5, pp. 547–559.
Walter, M.S.J., Spruegel, T.C. and Wartzack, S. (2015) Least Cost Tolerance Allocation for Systems with time-variant Deviations. In: Proceedings of the 13th Conference on Computer Aided Tolerancing, CAT 2014, 11–14 May 2014, Hangzhou, China. To be published in Procedia CIRP (2015).
Watts, D. (2007) The “GD&T Knowledge Gap” in Industry. In: ASME 2007 International Design Engineering Technical Conferences and Computers and Information in Engineering Conference, 4–7 September 2007, Las Vegas, USA. New York, NY, ASME. pp. 597–604.
Wartzack, S., Meerkamm, H., Stockinger, A., Stoll, T., Stuppy, J., Voß, R., Walter, M. and Wittmann, S. (2011) Lifecycle-oriented Tolerance Simulation. Konstruktion, Vol. 63, No. 6, pp. 63–67.
Ziegler, P., Breitsprecher, T., Walter M., Westphal C. and Wartzack S. (2012) Application of sensitivities on simulation-data-based metamodels during the product synthesis. In: Marjanović, D., Štorga, M., Pavković, N. and Bojčetić, N. (eds.) Proceedings of the 12th International Design Conference 2012, DESIGN 2012, 21–24 May 2012, Dubrovnik, Croatia. Glasgow, Design Society, DS 70, pp. 589-598.
ACKNOWLEDGMENTS The authors thank the German Research Foundation (DFG) for supporting the research project "Functional product validation and optimization of technical systems in motion as a part of product’s lifecycle oriented tolerance management" (DFG grant number: WA2913/8-3).
10