Embed Size (px)
Citation preview

1
Results 3Q 2014 / 13 Nov 2014
2
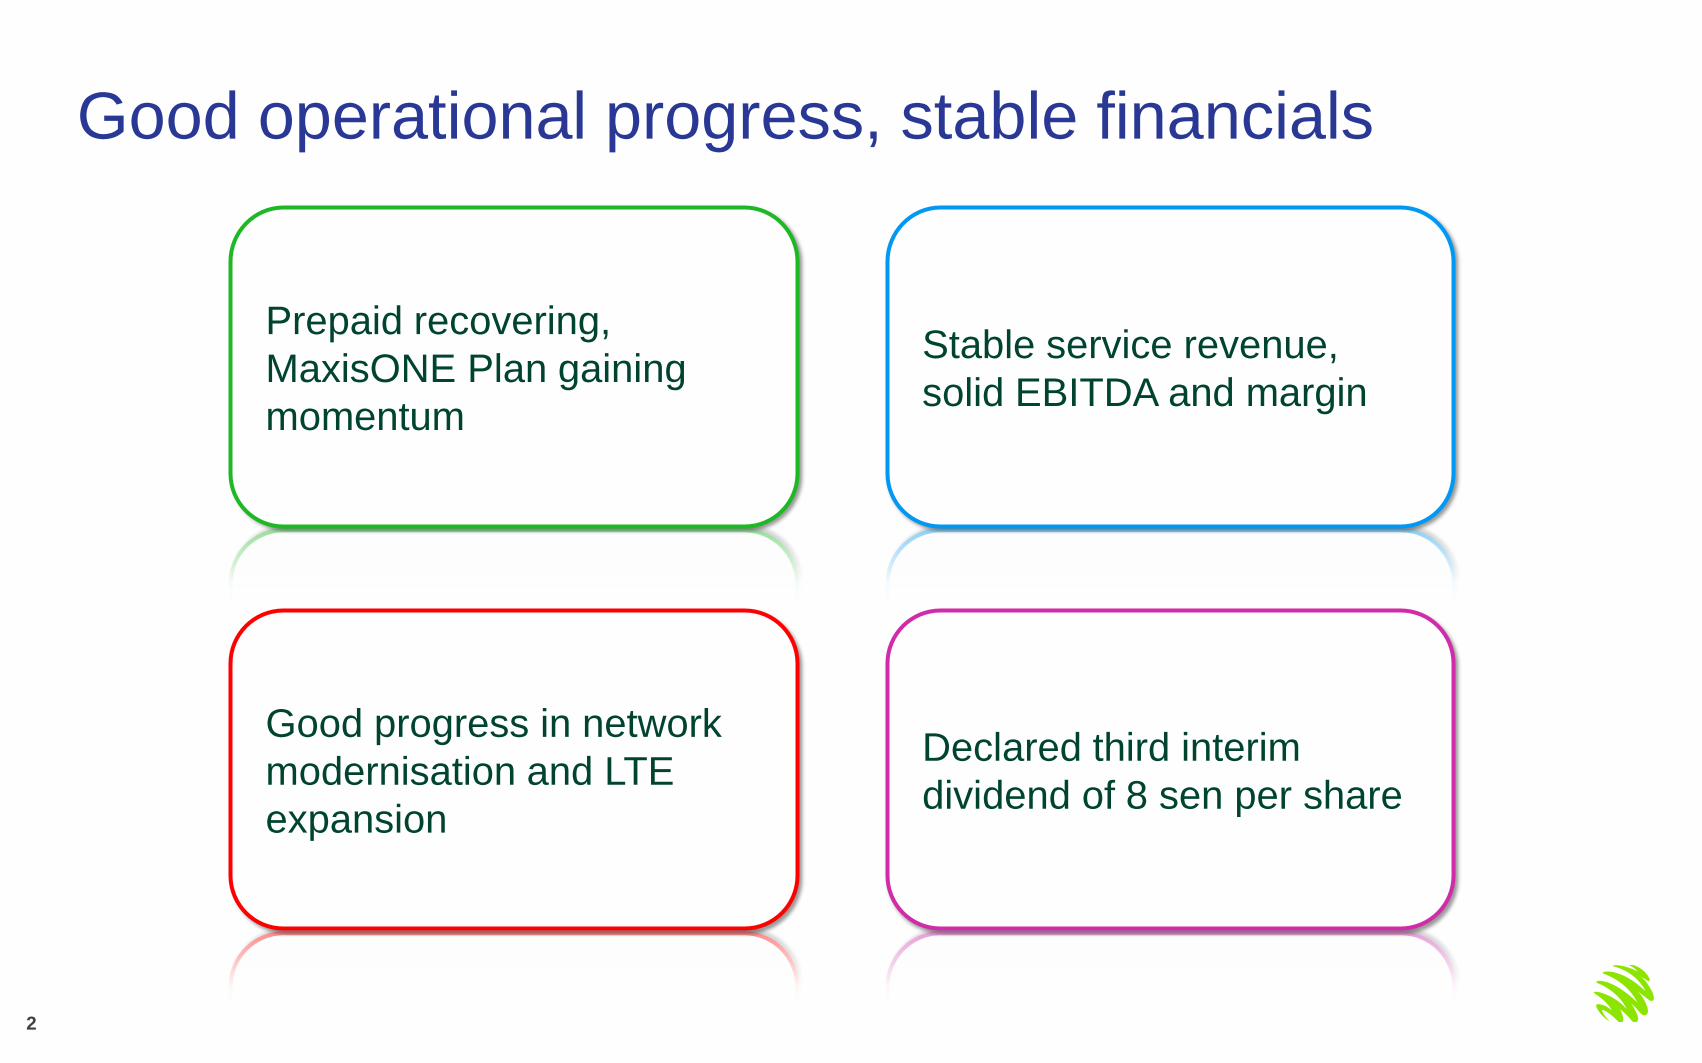
Prepaid recovering,
MaxisONE Plan gaining
momentum
Good progress in network
modernisation and LTE
expansion
Stable service revenue,
solid EBITDA and margin
Declared third interim
dividend of 8 sen per share
Good operational progress, stable financials
3
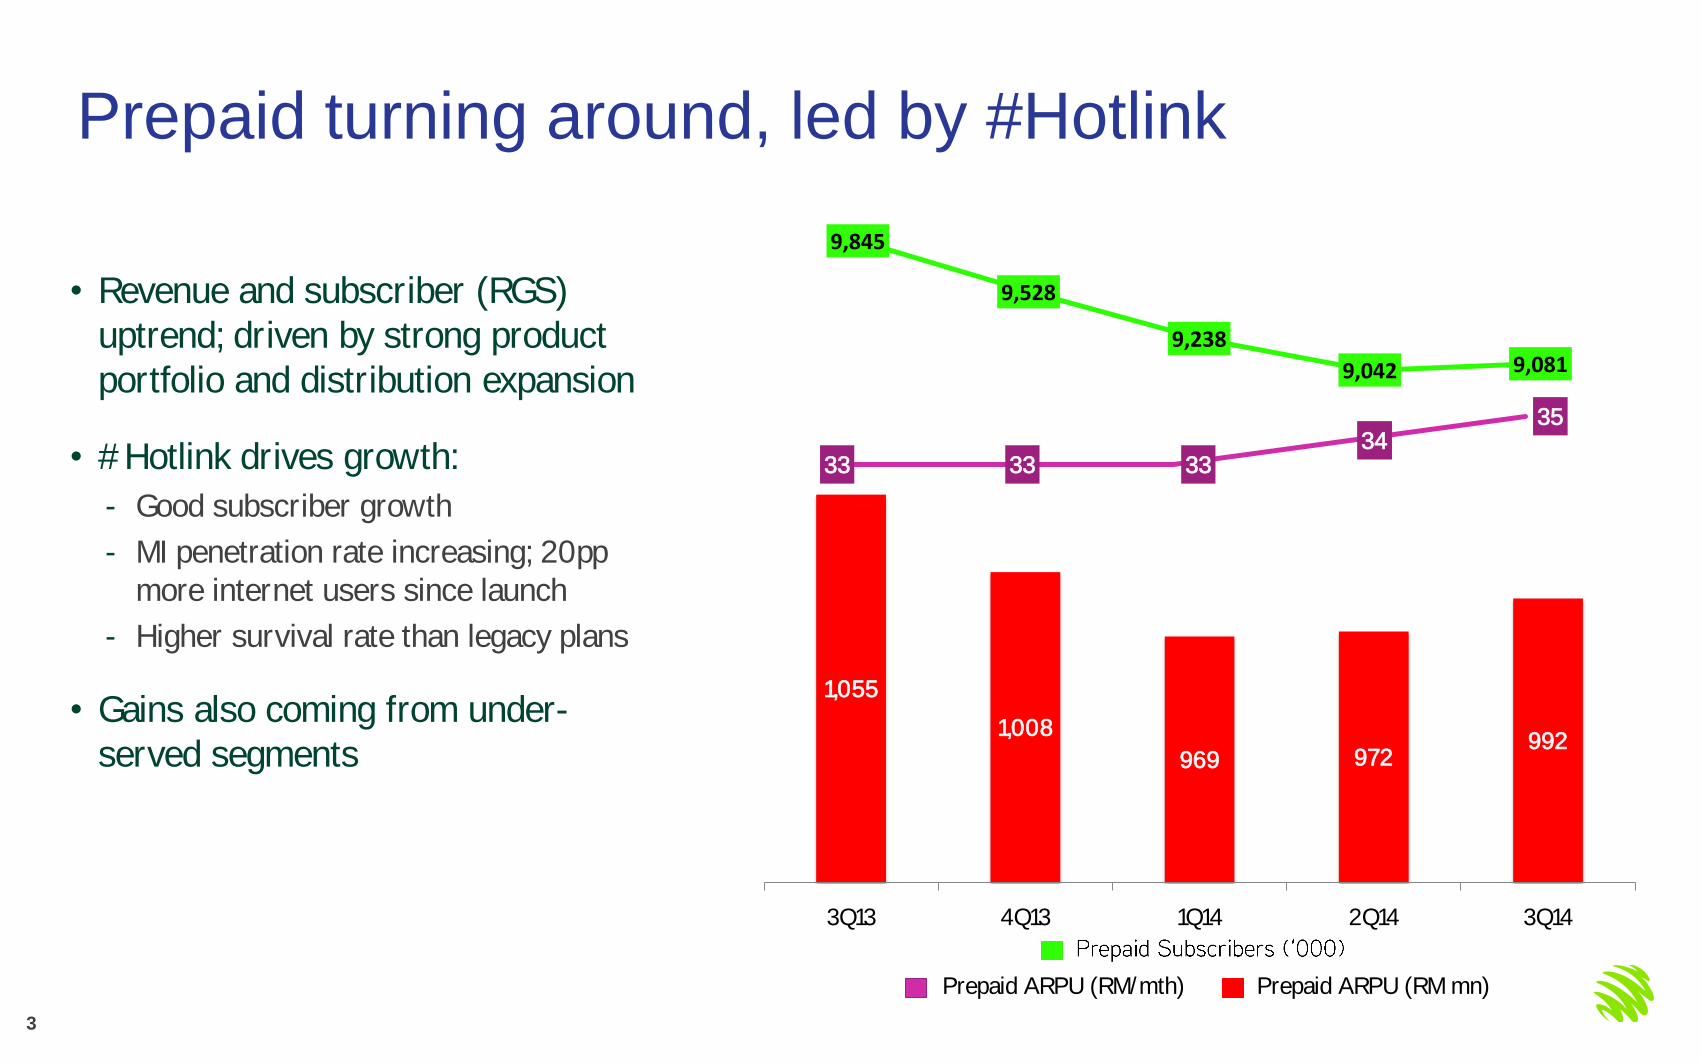
9,845
9,528
9,238
9,042 9,081
Prepaid turning around, led by #Hotlink
• Revenue and subscriber (RGS)
uptrend; driven by strong product
portfolio and distribution expansion
• #Hotlink drives growth:
- Good subscriber growth
- MI penetration rate increasing; 20pp
more internet users since launch
- Higher survival rate than legacy plans
• Gains also coming from under-
served segments
1,055
1,008
969 972 992
3Q13 4Q13 1Q14 2Q14 3Q14
33 33 33 34
35
Prepaid ARPU (RM/mth)
Prepaid ARPU (RM mn)

4
996 1,016
984 986 962
3Q13 4Q13 1Q14 2Q14 3Q14
2,732
2,769 2,794
2,828 2,839
100 101
96 97
94
Postpaid stable impacted by pay per use re-pricing,
MaxisONE Plan gaining momentum
• Revenue and ARPU reflecting RM16
million re-pricing impact
• Data revenue flat QoQ; +5.0% on
postpaid re-pricing normalisation
• Continued postpaid subscriber
growth
• Positive subscriber traction with
good ARPU impact for MaxisONE
Plan
Postpaid ARPU (RM/mth)
Postpaid Revenue (RM mn)

5
24.7% 25.9%
26.8%
28.9% 30.1%
506 524 524 566 589
275 257 224 205 184
122 117 110 99 91
3Q13 4Q13 1Q14 2Q14 3Q14
Steady pick-up in data, supported by worry free
propositions and smart-phone momentum
• Data share of mobile revenue at 30%;
7.6 million mobile internet users
• Blended smart-phone penetration at
54%; up 5% points QoQ; boosted by
attractively priced low-to-mid tier
devices
- Postpaid @ 67% (+3pp QoQ)
- Prepaid @ 50% (+6pp points QoQ)
• Messaging & WBB declining in-line
with industry trend
MI as a % of Mobile Revenue
WBB (RM mn) Messaging (RM mn) MI+VAS (RM mn)
6
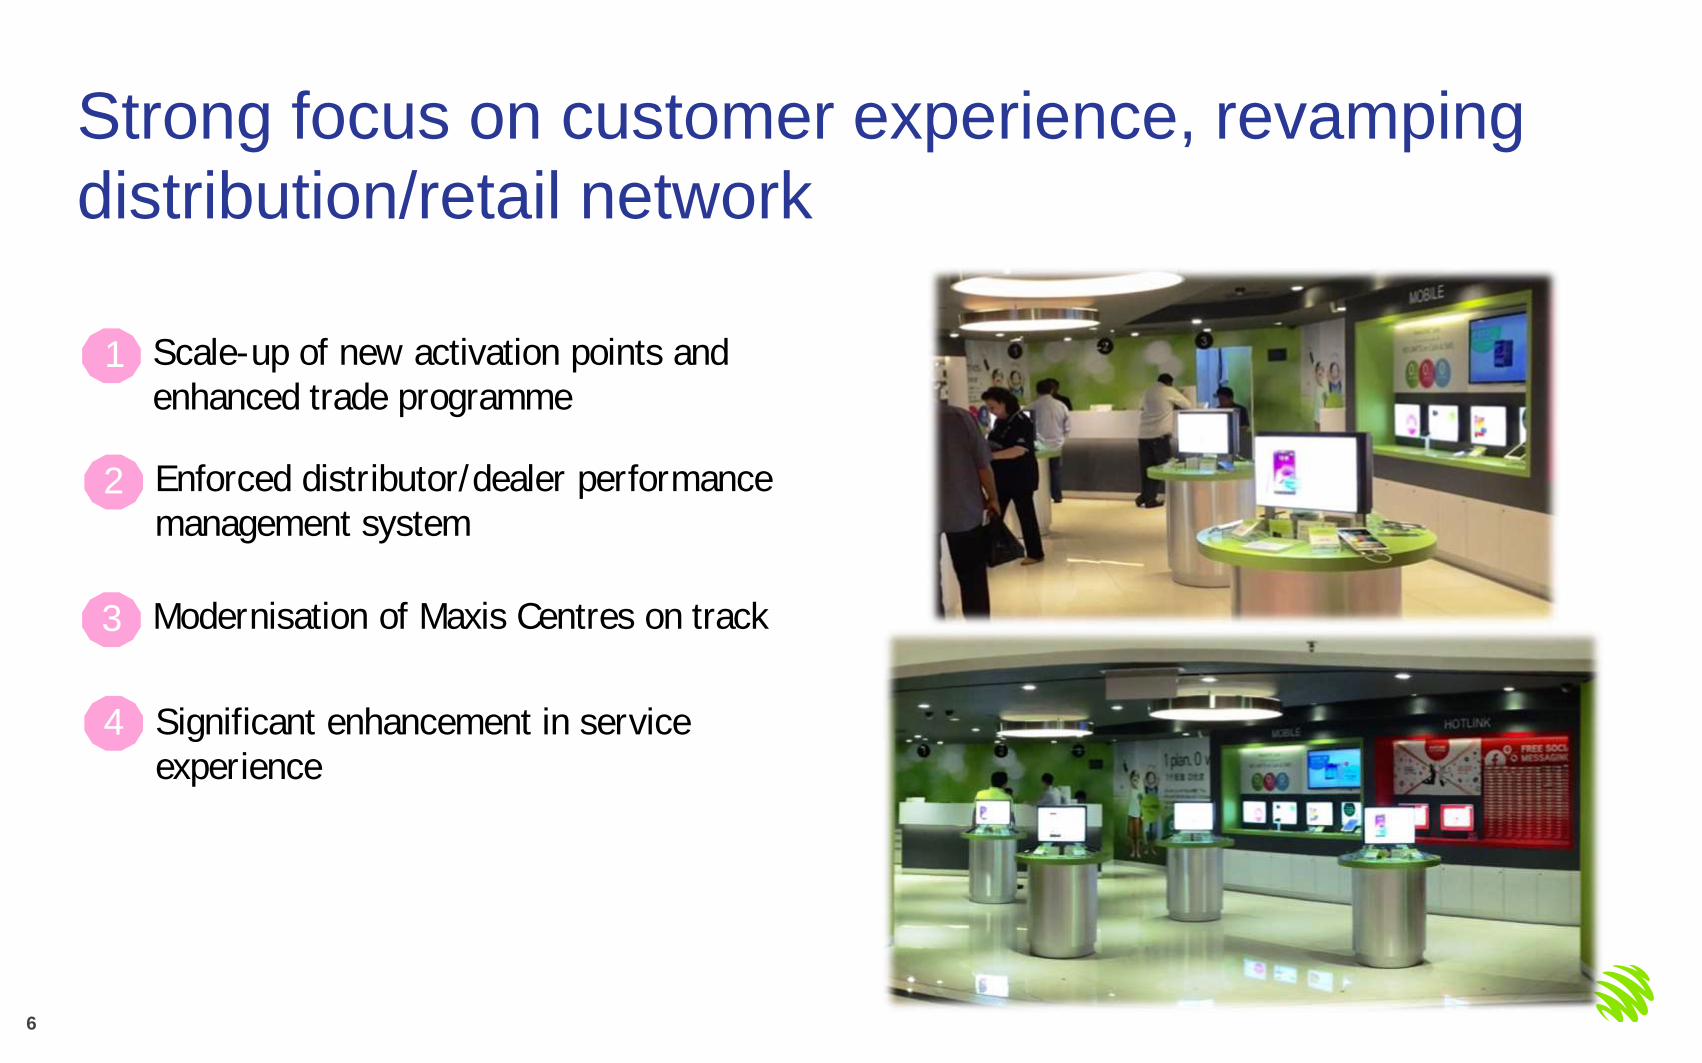
Strong focus on customer experience, revamping
distribution/retail network
2
4 Significant enhancement in service
experience
Enforced distributor/dealer performance
management system
1 Scale-up of new activation points and
enhanced trade programme
3 Modernisation of Maxis Centres on track

7
141
267
118
155
337
3Q13 4Q13 1Q14 2Q14 3Q14
Investing to deliver best network experience
• 2G and 3G modernised population
coverage at 73%
• Significant improvement in network
quality; strong improvements in
DCR, CSSR and data quality
• 4G LTE population coverage at 21%;
covered key market centres and
state capitals
- 4X increase in download speeds; better
customer experience in video, music
streaming, etc
6.3% 12.0% 5.6% 7.4%
16.3%
Capex/Revenue (%) Capex (RM mn)

8
Service revenue reflecting continued voice/SMS
decline and postpaid pay per use re-pricing impact
• Mobile internet revenue grew 6.7%
QoQ normalised for re-pricing
versus 3.9% reported growth
• Voice/SMS continued to decline;
new bundled plans should ease
pressure moving forward
• Fixed Enterprise and Integrated
Services (formerly Home) delivering
consistent growth
• Prepaid RGS growth and
MaxisONEPlan yet to have
significant impact on service
revenue
2,127 2,108 2,037 2,049 2,049
3Q13 4Q13 1Q14 2Q14 3Q14
Service Revenue (RM mn)
+0.0%
-3.7%

9
33.0% 34.3% 33.4% 31.3% 31.6%
3.9% 4.8%
3.4% 4.8% 5.2%
9.7% 6.9% 5.5% 5.5% 3.2%
0.4% 1.0%
0.6% 0.4% 0.7%
6.0% 9.3%
6.5% 5.7% 7.5%
3Q13 4Q13 1Q14 2Q14 3Q14
Solid EBITDA and margin
• 52.7% service revenue EBITDA
margin
- 50.5% service revenue EBITDA margin
(excluding reversal of staff cost)
- EBITDA margin at 51.8%
• Higher spend in sales and marketing
as guided
1,052 971 1,073 1,086 1,070
G&A+Others Bad Debts Staff Costs S&M Direct Expenses
47.0%
43.7%
50.6% 52.2% 51.8%
EBITDA (RM mn) EBITDA Margin
10
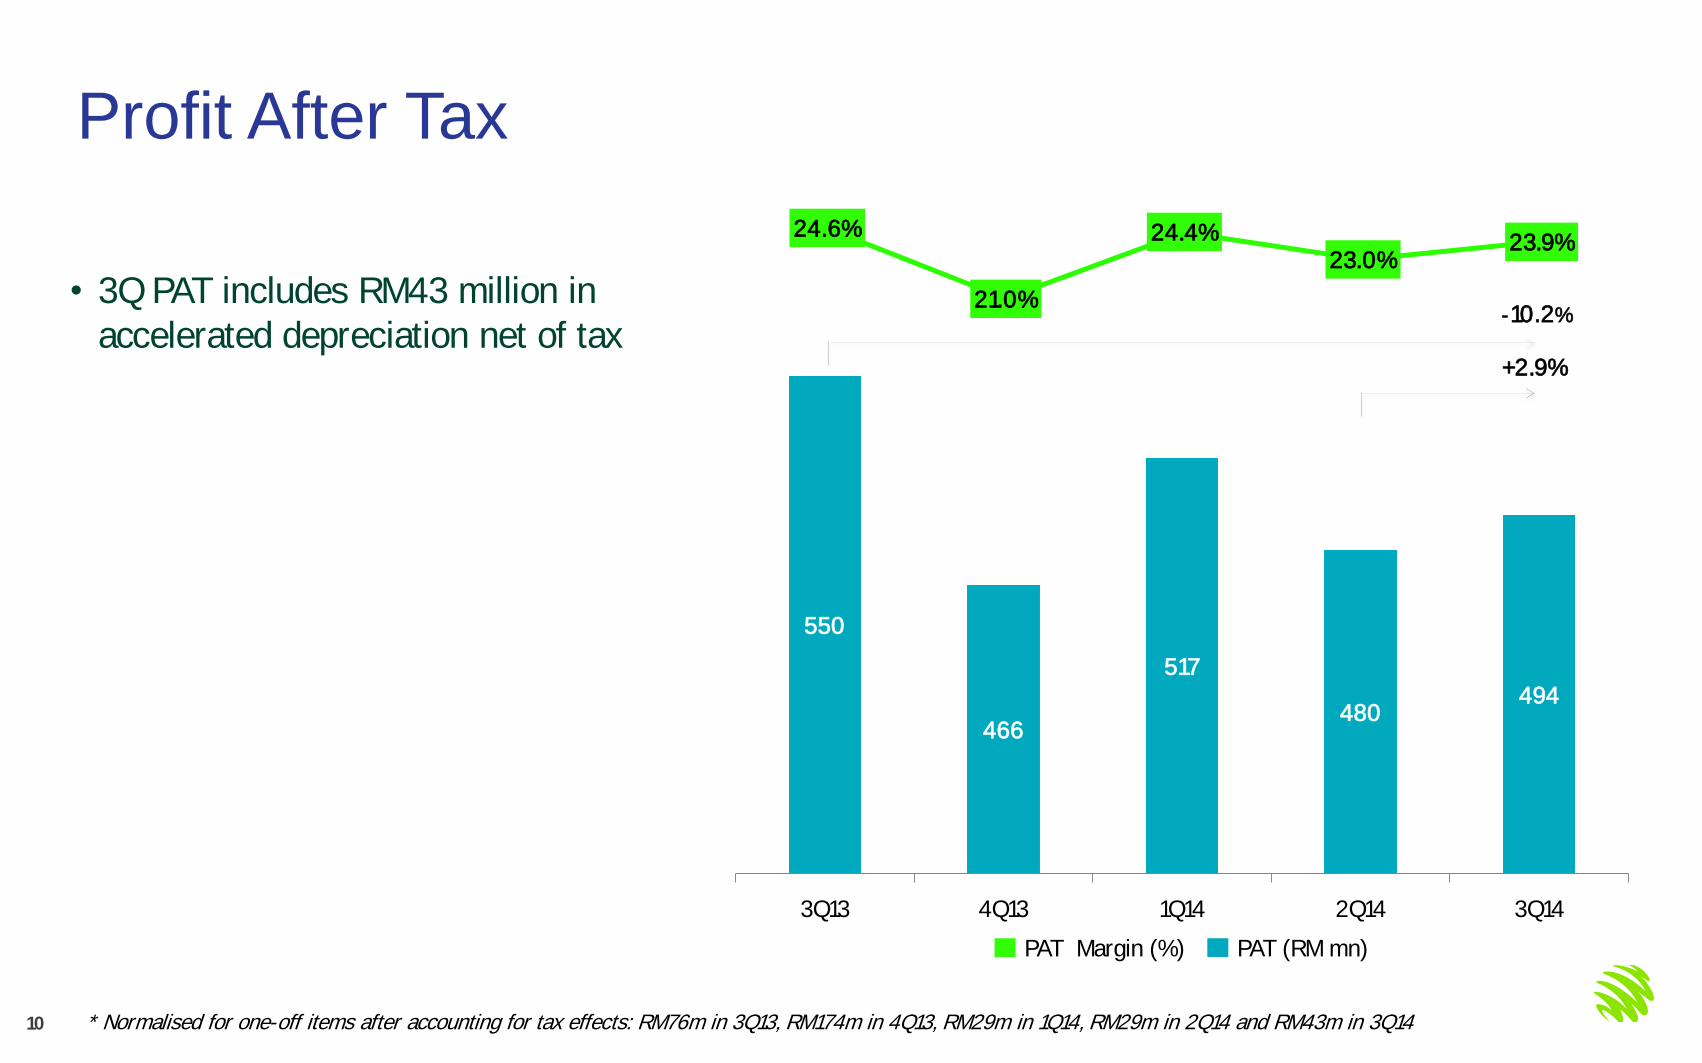
550
466
517
480 494
3Q13 4Q13 1Q14 2Q14 3Q14
24.6%
21.0%
24.4% 23.0%
23.9%
Profit After Tax
• 3Q PAT includes RM43 million in
accelerated depreciation net of tax
* Normalised for one-off items after accounting for tax effects: RM76m in 3Q13, RM174m in 4Q13, RM29m in 1Q14, RM29m in 2Q14 and RM43m in 3Q14
+2.9%
-10.2%
PAT Margin (%) PAT (RM mn)

11
FY2014 Outlook - maintained
• Service revenue lower; EBITDA margin at
similar level to FY2013
• Capex spend maintained at approximately RM1.1
billion to deliver best network experience & key
IT initiatives

12
Prepaid recovering,
MaxisONE Plan gaining
momentum
Good progress in network
modernisation, LTE
expansion
Stable service revenue,
solid EBITDA and margin
Declared third interim
dividend of 8 sen per share
Good operational progress, stable financials

13
thank you

14
Disclaimer -looking statements. Forward-looking statements can be identified by
the use of forward-
Forward-looking statements made in this presentation involve known and unknown risks, uncertainties and other factors which may
cause actual future performance, outcomes and results to differ materially from those expressed or implied in such forward-looking
statements. Such forward-
future events and are not a guarantee of future performance. Maxis cannot give any assurance that such forward-looking statements
will be realized.
Factors which could affect actual future performance, outcomes and results include (without limitation) general industry and
economic conditions, interest rate trends, cost of capital and capital availability, availability of real estate properties, competition from
other companies and avenues for the sale/distribution of goods and services, shifts in customer demands, customers and partners,
changes in operating expenses, including employee wages, benefits and training, governmental and public policy changes and the
continued availability of financing in the amounts and the terms necessary to support future business.
Forward-looking statements made in this presentation are made only as at the date of this presentation and Maxis and its subsidiaries,
affiliates, representatives and advisers expressly disclaim any obligation or undertaking to release, publicly or otherwise, any updates
or revisions to any such forward- ,
change in conditions or circumstances or otherwise.
This presentation has been prepared by Maxis. The information in this presentation, including forward-looking statements, has not
been independently verified. Without limiting any of the foregoing in this disclaimer, no representation or warranty, express or implied,
is made as to, and no reliance should be placed on, the fairness, accuracy or completeness of such information. Maxis and its
subsidiaries, affiliates, representatives and advisers shall have no liability whatsoever (whether in negligence or otherwise) for any
loss, damage, costs or expenses howsoever arising out of or in connection with this presentation.

15
APPENDICES

16
Important definitions/notations • Service Revenue: Group revenue excluding device & hubbing revenues
• EBITDA margin on Service Revenue: EBITDA that has been adjusted for costs solely related to the provision of service revenue
defined above
• Normalised EBITDA margin: Normalised for one-off items in 3Q13, 4Q13 and 2Q14 amounting to RM102 mil, RM110 mil and RM22
mil respectively
• Normalised PAT: Normalised for one-off items after accounting for tax effects of RM76 mil in 3Q13, RM174 mil in 4Q13, RM29 mil
in 1Q14, RM29 mil in 2Q14 and RM43 mil in 3Q14
• Revenue generating subscribers (RGS30): Defined as active line subscriptions and exclude those that does not have any revenue
generating activities for more than 30 days
• WBB subscription: Subscriptions on data plans using USB modems and tablets (subscriptions included in postpaid subscriptions
• FBI: Free basic internet
• Smart-phone: Any devices with growing apps stores and active developers
• DCR: Drop call rate
• CSSR: Call set up success rate

17
Consolidated Income Statement
RM mn
Reported
2Q14
Reported
3Q14
QoQ chg
Normalised
2Q14
Normalised
3Q14
QoQ chg
REVENUE 2,082 2,065 -0.8% 2,082 2,065 -0.8%
Direct Expenses (652) (652) (652) (652)
Indirect Expenses (344) (343) (366) (343)
Total Opex (996) (995) +0.1% (1,018) (995) +2.3%
EBITDA 1,086 1,070 -1.5% 1,064 1,070 +0.6%
Margin 52.2% 51.8% 51.1% 51.8%
Depreciation (284) (268) (224) (211)
Amortisation (65) (60) (65) (60)
Others (12) 2 (12) 2
EBIT 725 744 +2.6% 763 801 +5.0%
Interest Expenses (101) (114) (101) (114)
Interest Income 10 13 10 13
PBT 634 643 +1.4% 672 700 +4.2%
Tax (183) (192) (192) (206)
PAT 451 451 0.0% 480 494 +2.9%
18
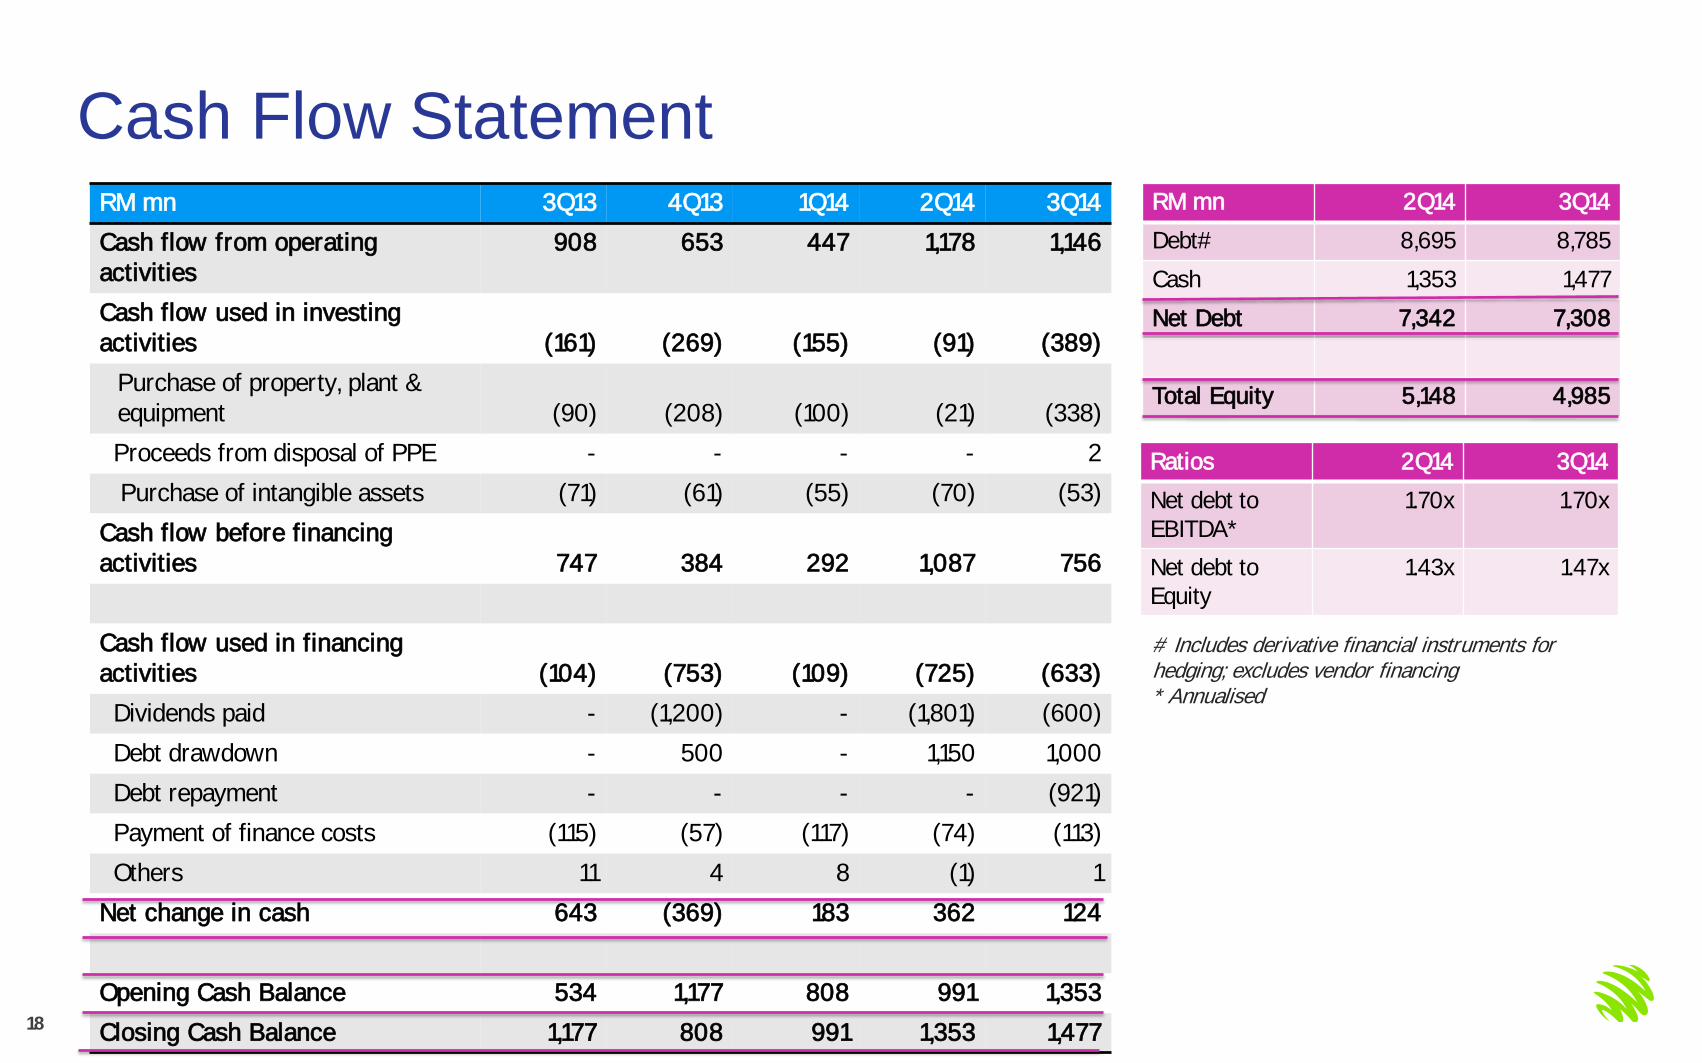
Cash Flow Statement RM mn 3Q13 4Q13 1Q14 2Q14 3Q14
Cash flow from operating
activities
908 653 447 1,178 1,146
Cash flow used in investing
activities
(161)
(269)
(155)
(91)
(389)
Purchase of property, plant &
equipment
(90)
(208)
(100)
(21)
(338)
Proceeds from disposal of PPE - - - - 2
Purchase of intangible assets (71) (61) (55) (70) (53)
Cash flow before financing
activities
747
384
292
1,087
756
Cash flow used in financing
activities
(104)
(753)
(109)
(725)
(633)
Dividends paid - (1,200) - (1,801) (600)
Debt drawdown - 500 - 1,150 1,000
Debt repayment - - - - (921)
Payment of finance costs (115) (57) (117) (74) (113)
Others 11 4 8 (1) 1
Net change in cash 643 (369) 183 362 124
Opening Cash Balance 534 1,177 808 991 1,353
Closing Cash Balance 1,177 808 991 1,353 1,477
RM mn 2Q14 3Q14
Debt# 8,695 8,785
Cash 1,353 1,477
Net Debt 7,342 7,308
Total Equity 5,148 4,985
Ratios 2Q14 3Q14
Net debt to
EBITDA*
1.70x 1.70x
Net debt to
Equity
1.43x 1.47x
# Includes derivative financial instruments for hedging; excludes vendor financing * Annualised

19
Key Financial Data
2Q12 3Q12 4Q12 1Q13 2Q13 3Q13 4Q13 1Q14 2Q14 3Q14
Total Revenue 2,216 2,216 2,306 2,327 2,294 2,239 2,224 2,119 2,082 2,065
Total Expenses
- Direct - Indirect
1,110
716 394
1,161
743 418
1,241
813 428
1,205
801 404
1,129
787 342
1,187
738 449
1,253
763 490
1,046
707 339
996
652 344
995
652 343
EBITDA 1,106 1,055 1,065 1,122 1,165 1,052 971 1,073 1,086 1,070
PBT 630 632 547 666 735 667 428 657 634 643
PAT 466 443 378 476 530 474 292 488 451 451
EBITDA Margin 49.9% 47.6% 46.2% 48.2% 50.8% 47.0% 43.7% 50.6% 52.2% 51.8%
PAT Margin 21.0% 20.0% 16.4% 20.5% 23.1% 21.2% 13.1% 23.0% 21.7% 21.8%
REPORTED
NORMALISED
2Q12 3Q12 4Q12 1Q13 2Q13 3Q13 4Q13 1Q14 2Q14 3Q14
Total Revenue 2,216 2,216 2,306 2,327 2,294 2,239 2,224 2,119 2,082 2,065
Total Expenses
- Direct - Indirect
1,110
716 394
1,161
743 418
1,241
813 428
1,205
801 404
1,129
787 342
1,085
738 347
1,143
759 384
1,046
707 339
1,018
652 366
995
652 343
EBITDA 1,106 1,055 1,065 1,122 1,165 1,154 1,081 1,073 1,064 1,070
PBT 755 667 676 726 775 769 660 696 672 700
PAT 550 463 475 521 560 550 466 517 480 494
EBITDA Margin 49.9% 47.6% 46.2% 48.2% 50.8% 51.5% 48.6% 50.6% 51.1% 51.8%
PAT Margin 24.8% 20.9% 20.6% 22.4% 24.4% 24.6% 21.0% 24.4% 23.1% 23.9%

20
Key Financial Data
2Q12 3Q12 4Q12 1Q13 2Q13 3Q13 4Q13 1Q14 2Q14 3Q14
Total Revenue
- Service - Mobile - EntFixed - IntSer(Home)
- Non-Service - Device - Hubbing
2,216
2,137 2,081
50 6
79 30 49
2,216
2,128 2,066
53 9
88 62 26
2,306
2,177 2,111
55 11
129 80 49
2,327
2,143 2,066
63 14
184 125 59
2,294
2,136 2,062
58 16
158 95 63
2,239
2,127 2,051
58 18
112 43 69
2,224
2,108 2,024
61 23
116 56 60
2,119
2,037 1,953
59 25 82 40 42
2,082
2,049
1,958 62 29 33
5 28
2,065
2,049
1,954 64 31 16 2
14
EBITDA Margin on
Service Revenue
52.3%
50.1%
49.3%
53.0%
54.4%
49.6%
46.4%
53.0%
53.5%
52.7%
Mobile Revenue
- Voice - Data
2,081
1,162 919
2,066
1,167 899
2,111
1,182 929
2,066
1,147 919
2,062
1,134 928
2,051
1,148 903
2,024
1,126 898
1,953
1,096 857
1,958
1,088 870
1,954
1,090 864
Mobile Revenue
- Prepaid - Postpaid
2,081
1,075 1,006
2,066
1,110 956
2,111
1,106 1,005
2,066
1,069 997
2,062
1,047 1,015
2,051
1,055 996
2,024
1,008 1,016
1,953
969 984
1,958
972 986
1,954
992 962
Data
- MI+VAS - Messaging - WBB
919
421 355 143
899
419 355 125
929
460 342 127
919
466 320 133
928
495 298 135
903
506 275 122
898
524 257 117
857
524 223 110
870
566 205
99
864
589 184
91
FINANCIALS

21
Key Operational Data
2Q12 3Q12 4Q12 1Q13 2Q13 3Q13 4Q13 1Q14 2Q14 3Q14
Mobile Subs
- Prepaid - Postpaid
13,827
10,515 3,312
13,930
10,612 3,318
14,091
10,770 3,321
14,136
10,780 3,356
13,873
10,497 3,376
13,213
9,845 3,368
12,893
9,528 3,365
12,602
9,238 3,364
12,401
9,042 3,359
12,415
9,081 3,334
WBB 687 710 679 673 663 636 596 570 531 495
Mobile Internet
Users
7,500
7,600
7,800
7,900
8,000
6,900
7,300
7,100
7,500
7,600
Home Connections 9 19 26 31 36 43 52 59 66 72
CUSTOMERS (Market Definition)
2Q12 3Q12 4Q12 1Q13 2Q13 3Q13 4Q13 1Q14 2Q14 3Q14
Postpaid
- ARPU - MOU
109 341
106 325
107 322
102 307
103 307
100 298
101 293
96 278
97 283
94 278
Prepaid
- ARPU - MOU
33 115
34 121
33
127
32
125
31
119
33 116
33 117
33 118
34
124
35 131
Blended
- ARPU - MOU
49
158
48
160
48
165
46
160
46
156
48
153
49
155
48
154
50 161
50
165
ARPUs and MOUs (Market Definition)

22
Key Operational Data
(%) 1Q13 2Q13 3Q13 4Q13 1Q14 2Q14 3Q14
Blended
- Prepaid - Postpaid
25
20 49
29
23 53
33
27 56
38
32 59
43
38 61
48
43
64
54
50
67
SMART PHONE PENETRATION