Embed Size (px)
Citation preview

Results by Oversampled Geographies
June 2014
SURVEY OVERVIEW

Methodology• Penn Schoen Berland completed 3,279 telephone interviews between April 3, 2014 and May 6, 2014• This report includes the following audiences:
Audience Definition Sample Size
Margin of Error
General Population SamplesNational 60+ 2014 US adults 60 and older from 2014 study 1,000 +/- 3.1%National 60+ 2013 US adults 60 and older from 2013 study 1,007 +/- 3.1%National 60+ 2012 US adults 60 and older from 2012 study 1,004 +/- 3.09%National 18-59 2014 US adults 18-59 from 2014 study 1,027 +/- 3.06%
National 18-59 2013 US adults 18-59 from 2013 study 993 +/- 3.11%
Oversampled Audiences
Low-Income Seniors 2014
US adults 60 and older with household income of <$15,000 from 2014 study
252 +/- 6.17%
Low-Income Seniors 2013
US adults 60 and older with household income of <$15,000 from 2013 study
378 +/- 5.04%
Socially-Isolated Seniors
US adults 60 and older living alone and expressing feelings of loneliness from 2014 study
250 +/- 6.2%
Dallas Seniors US adults 60 and older living in Dallas from 2014 study
250 +/- 6.2%
Newark, N.J. Seniors
US adults 60 and older living in Newark, N.J. from 2014 study
250 +/- 6.2%
Cleveland Seniors US adults 60 and older living in Cleveland from 2014 study
250 +/- 6.2%
3Note: 2014 wave was conducted between April 3, 2014 and May 6, 2014 Note: 2013 wave was conducted between April 4, 2013 and May 3, 2013Note: 2012 wave was conducted between May 10, 2012 and June 6, 2012

Methodology
Please note:• Data from general population samples and regional oversampled
audiences are weighted to U.S. Census Bureau data. Data from the oversampled audience of “Low-Income Seniors” are weighted to 2013 survey demographics data.
• The following demographics are weighted:– Age– Gender– Marital status– Race
• Sample sizes under N=75 are not shown, as these sample sizes are too small to be statistically reliable.
• All numbers in this report are percentages unless otherwise noted.• Due to rounding, some of the total percentages do not add up to 100.
4

REGIONAL FINDINGS
Cleveland, Dallas, and Newark, N.J., seniors are not as optimistic as seniors nationally when it comes to their general outlook, health and finances.

Cleveland
6
Attitudes and Actions on
Health
Financial Foundation
Support Network
Cleveland seniors are as likely as seniors nationally to say their health has been better than normal or the best yet in the past year, but they are more likely to expect it will stay the same in the next decade than seniors nationally. Cleveland seniors are more confident that they will be able to maintain a high quality of life than seniors nationally. Cleveland seniors are much less likely to exercise daily or set health goals in the past year than seniors nationally. Compared with seniors nationally, Cleveland seniors are more likely to think their financial situation will remain the same in the next decade. They are also less concerned that their savings and income will be sufficient to last them for the rest of their life than seniors nationally.Cleveland seniors are as likely as seniors nationally to think that their community is ready to meet the needs of a growing senior population. While Cleveland seniors are more likely to expect to continue living in their own home and to live alone, they do not anticipate needing as much support with home maintenance compared with seniors nationally.
The United States of Aging Survey, 2014, sample size: 3,279

Seniors living in Cleveland are more likely to intend to age in place and prefer living alone than seniors nationally
7
Cleveland, OH
Intend to continue living in their home
Prefer to live alone
Expect to live alone
Cleveland Seniors
Seniors Nationally
81% VS. 77%
62% VS. 53%
87% VS. 81%
Q30 (For 2014 60+). Do you intend to continue living in your current home for the rest of your life?Q39 (For 2014 60+). Would you prefer to live alone, or with family members for the remainder of your senior years?Q40 (For 2014 60+). IF LIVE ALONE, Do you expect to live alone for the rest of your life?

Dallas
8
Attitudes and Actions on
Health
Financial Foundation
Support Network
Dallas seniors are slightly less likely than seniors nationally to say their health has been better in the past year. However, they are as likely as seniors nationally to say that their health will improve in the next five to 10 years. Dallas seniors are slightly more likely to feel they have prepared for their senior years and are more confident that they will be able to maintain a high quality life than seniors nationally. Dallas seniors are much less likely to exercise daily than seniors nationally.Dallas seniors are more likely to believe their financial situation will remain the same in the future than seniors nationally who are more hopeful it will improve. Compared with seniors nationally, Dallas seniors are less concerned that their savings and income will be sufficient to last for the rest of their life.Dallas seniors are less convinced that their community is prepared to meet the needs of a growing senior population than seniors nationally. While Dallas seniors are as likely as seniors nationally to anticipate needing support with transportation, they are less likely to think their community provides adequate access to transportation than seniors nationally.
The United States of Aging Survey, 2014, sample size: 3,279

Seniors living in Dallas prefer to live alone and are less convinced that their community is prepared for the needs of a growing senior population
9
Dallas, TX
Seniors living in Dallas are more likely to prefer
living alone than seniors nationally (68% compared with 53% respectively)
And seniors in Dallas are less likely to say that their community is prepared to meet the needs of
seniors than seniors nationally (47% compared with 54% respectively)
Yet, only 16% of seniors living in Dallas feel they will need support with staying
socially connected, compared with 24% of seniors nationally
Q39 (For 2014 60+). Would you prefer to live alone, or with family members for the remainder of your senior years? Q79 (For 2014 60+). Do you feel your community – meaning the city/town you live in – is doing enough to prepare for the needs of a growing senior population?Q80 (For 2014 60+). What services do you anticipate needing as you age? Please tell me all that apply. ] need to live alone?

Newark, N.J.
10
Attitudes and Actions on
Health
Financial Foundation
Support Network
Newark seniors are more likely to say their health has been normal over the past year than seniors nationally. Looking forward, they are less optimistic about their health than seniors nationally, yet, they feel like they have done more preparation for their senior years. Newark seniors are as likely as seniors nationally to exercise daily and set health goals.Compared with seniors nationally, Newark seniors are less optimistic about their financial situation improving in the next decade. They are just as likely as seniors nationally to feel that their savings will be sufficient to last them for the rest of their life. Newark seniors are less likely to find it easy to pay monthly bills than seniors nationally.
Newark seniors are less likely to say that their community is prepared to meet the needs of the senior population than seniors nationally. While Newark seniors are as likely to anticipate needing support with transportation, they are more likely to say their community provides adequate access to transportation than seniors nationally.
The United States of Aging Survey, 2014, sample size: 3,279
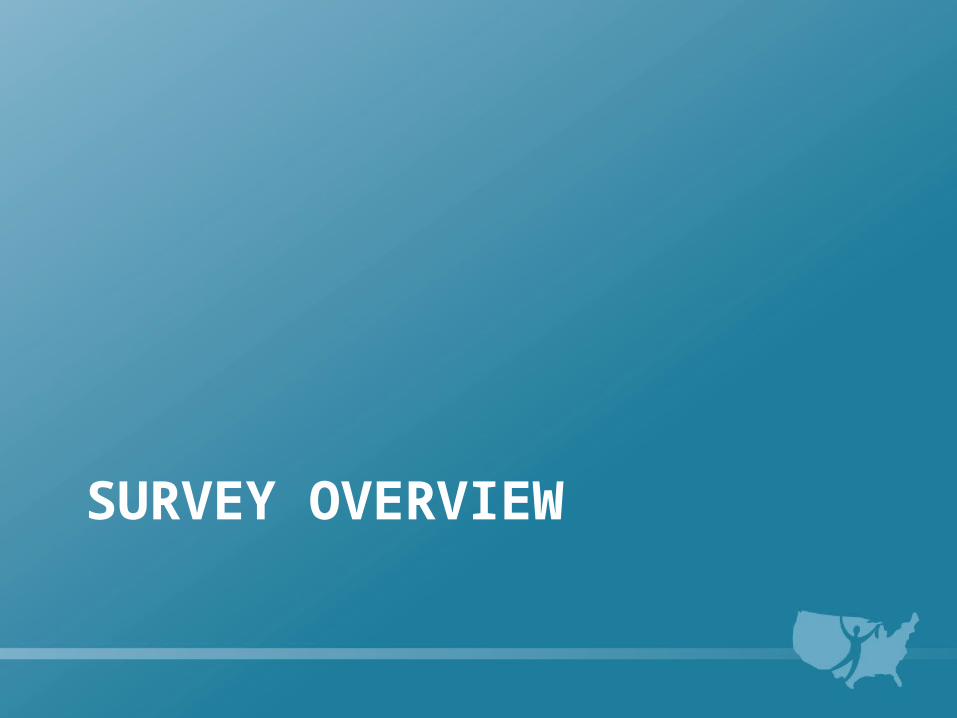
Newark seniors are less likely to intend to age in place, and find it more difficult to live alone than seniors nationally
11
Newark, NJ
Newark Seniors Seniors Nationally
64%Intend to continue
living in current home
77%
21% Difficulty living alone 14%
49% Community preparedness 54%
34%Community
provides access to affordable senior
housing
39%
Q30 (For 2014 60+). Do you intend to continue living in your current home for the rest of your life?Q41 (For 2014 60+). IF LIVE ALONE, How easy or difficult is it to live alone? Q79 (For 2014 60+). Do you feel your community – meaning the city/town you live in – is doing enough to prepare for the needs of a growing senior population?Q83 (For 2014 60+). Does your community provide adequate access to affordable senior housing options?
OVERSAMPLED REGIONS

• Among those that did receive help, many were not asked for their input
Seniors living in Newark and Cleveland are less likely to say the past year has been better than normal but are nearly as optimistic for the future as seniors nationally
13
In general, would you say the past year of your life has been...?
When thinking about the next five to 10 years, do you expect your overall quality of life to get much better, somewhat better, stay about the same, get somewhat
worse, or get much worse?
60+ 2014 Dallas Seniors Newark Seniors Cleveland Seniors5% 8% 7% 4%
17% 17% 21% 24%
53% 48%54% 55%
19% 17%12% 13%
5% 9% 5% 3%
The best yet
Better than normal
Normal
Worse than normal
The worst yet
60+ 2014 Dallas Seniors Newark Seniors Cleveland Seniors
5% 3% 3% 4%16% 14% 19% 17%
49% 55% 49% 54%
17% 15% 17% 16%11% 10% 8% 8%
Much better
Somewhat better
Stay about the same
Somewhat worse
Much worse
*Not showing “don’t know”Q6 (For 2014 60+), In general, would you say the past year of your life has been…? Among All.Q7 (For 2014 60+). When thinking about the next 5-10 years, do you expect your overall quality of life to get…? Among All.
• Among those that did receive help, many were not asked for their input
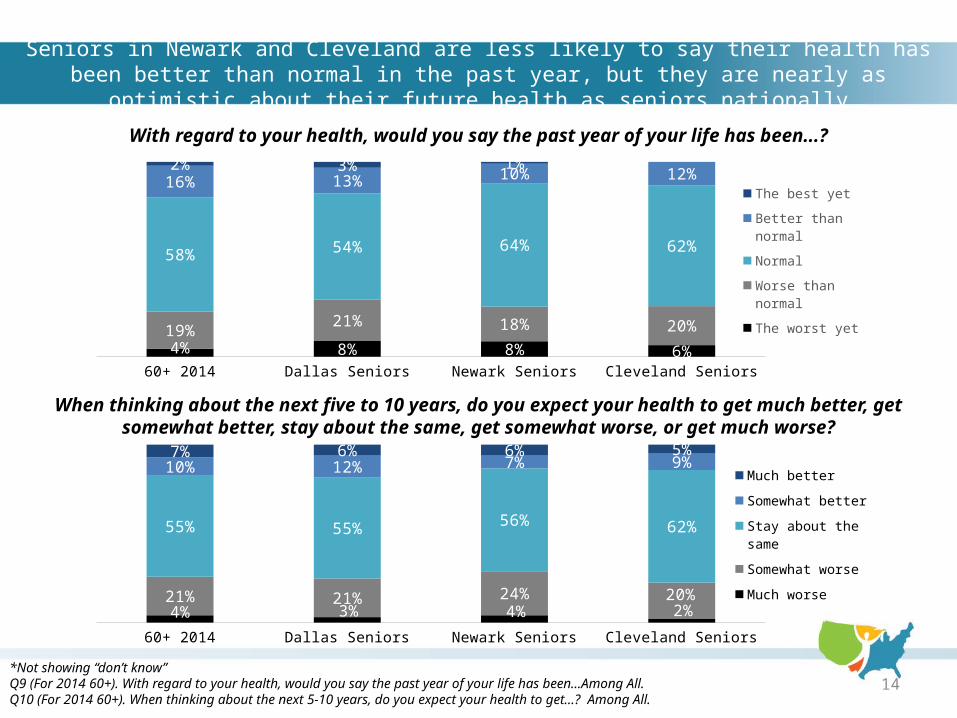
Seniors in Newark and Cleveland are less likely to say their health has been better than normal in the past year, but they are nearly as optimistic about their future health as seniors nationally
14
With regard to your health, would you say the past year of your life has been...?
When thinking about the next five to 10 years, do you expect your health to get much better, get somewhat better, stay about the same, get somewhat worse,
or get much worse?
60+ 2014 Dallas Seniors Newark Seniors Cleveland Seniors
4% 8% 8% 6%19%
21% 18% 20%
58% 54% 64% 62%
16% 13% 10% 12%2% 3% 1%
The best yet
Better than normal
Normal
Worse than normal
The worst yet
60+ 2014 Dallas Seniors Newark Seniors Cleveland Seniors4% 3% 4% 2%21% 21% 24% 20%
55% 55% 56% 62%
10% 12% 7% 9%7% 6% 6% 5%
Much better
Somewhat better
Stay about the same
Somewhat worse
Much worse
*Not showing “don’t know”Q9 (For 2014 60+). With regard to your health, would you say the past year of your life has been…Among All.Q10 (For 2014 60+). When thinking about the next 5-10 years, do you expect your health to get…? Among All.
• Among those that did receive help, many were not asked for their input
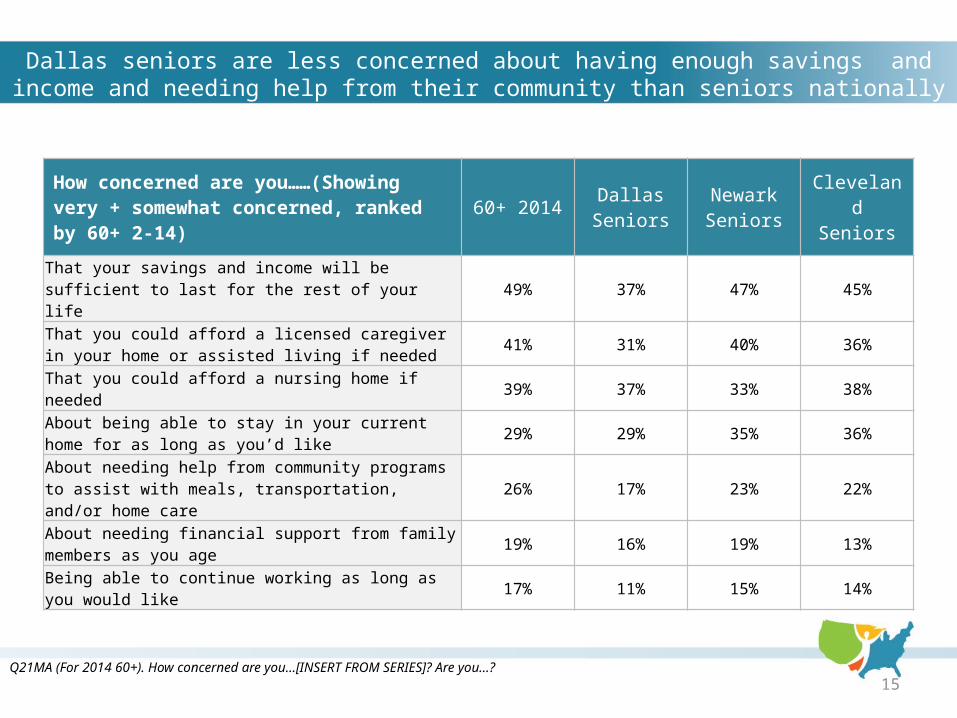
Dallas seniors are less concerned about having enough savings and income and needing help from their community than seniors nationally
15
How concerned are you……(Showing very + somewhat concerned, ranked by 60+ 2-14)
60+ 2014Dallas Seniors
Newark Seniors
Cleveland Seniors
That your savings and income will be sufficient to last for the rest of your life
49% 37% 47% 45%
That you could afford a licensed caregiver in your home or assisted living if needed
41% 31% 40% 36%
That you could afford a nursing home if needed 39% 37% 33% 38%
About being able to stay in your current home for as long as you’d like
29% 29% 35% 36%
About needing help from community programs to assist with meals, transportation, and/or home care
26% 17% 23% 22%
About needing financial support from family members as you age
19% 16% 19% 13%
Being able to continue working as long as you would like
17% 11% 15% 14%
Q21MA (For 2014 60+). How concerned are you…[INSERT FROM SERIES]? Are you…?

• Among those that did receive help, many were not asked for their input
Newark seniors are less likely to say they intend to continue living in their current home than seniors nationally
16
Do you intend to continue living in your current home for the rest of your life?
60+ 2014 Dallas Seniors Newark Seniors Cleveland Seniors
77% 82%64%
81%
Yes
Would you prefer to live alone, or with family members for the remainder of your senior years? (Ranked by 60+ 2014)
60+ 2014 Dallas Seniors
Newark Seniors
Cleveland Seniors
Alone 53% 68% 59% 62%With family members 41% 29% 34% 30%Neither 3% 1% 4% 3%
• Dallas and Cleveland seniors are more likely to intend on continuing to live in their home than seniors nationally
• Seniors in all three oversampled markets are more likely to prefer to live alone than seniors nationally
*Not showing “don’t know”Q30 (For 2014 60+). Do you intend to continue living in your current home for the rest of your life?Q39 (For 2014 60+). Would you prefer to live alone, or with family members for the remainder of your senior years?

• Among those that did receive help, many were not asked for their input
Seniors living alone in Newark are less likely to expect to live alone for the rest of their life than seniors nationally
17
IF LIVING ALONE: Do you expect to live alone for the rest of your life?
60+ 2014 Dallas Seniors Newark Seniors Cleveland Seniors
81% 82%
74%
87%
Yes
• Newark seniors living alone find it more difficult to live alone than seniors nationally living alone
IF LIVE ALONE: How easy or difficult is it to live alone?
60+ 2014 Dallas Seniors Newark Seniors Cleveland Seniors
3% 2% 1%11% 13% 21% 14%
12% 10%19%
13%
23% 21%
23%32%
49% 54%37% 40% Very easy
Somewhat easy
Neither easy or difficult
Somewhat difficult
Very difficult
Q40 (For 2014 60+). IF LIFE ALONE: Do you expect to live alone for the rest of your life?Q41 (For 2014 60+). IF LIVE ALONE: How easy or difficult is it to live alone
• Among those that did receive help, many were not asked for their input
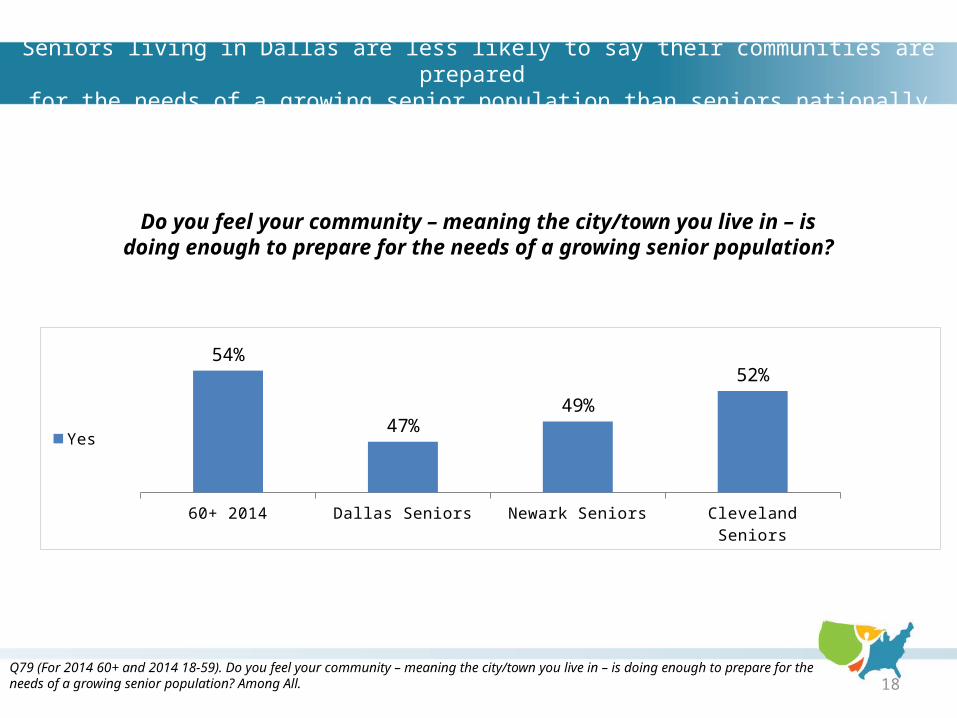
Seniors living in Dallas are less likely to say their communities are prepared for the needs of a growing senior population than seniors nationally
18
Do you feel your community – meaning the city/town you live in – is doing enough to prepare for the needs of a growing
senior population?
60+ 2014 Dallas Seniors Newark Seniors Cleveland Seniors
54%
47%49%
52%
Yes
Q79 (For 2014 60+ and 2014 18-59). Do you feel your community – meaning the city/town you live in – is doing enough to prepare for the needs of a growing senior population? Among All.
MEDIA CONTACTS JESSICA PAPPAS, UNITEDHEALTHCARE(410) 735-8725, [email protected]
VANESSA SINK, NATIONAL COUNCIL ON AGING (202) 600-3131, [email protected]
DALLAS JAMISON, N4A(720) 333-1494, [email protected]