Embed Size (px)
Citation preview

Alm Brand
Results for Q1 2015 Webcast presentation 12 May 2015

Financial highlights of Q1 2015
Pre-tax profit: DKK 202m
Forward-looking activities: Pre-tax profit: DKK 276m
Winding-up activities: Loss: DKK 74m • Writedowns: DKK 63m
G R O U P
Non-life Insurance Pre-tax profit: DKK 257m
• CR: 80.1 • Run-off gain: 10.1 • Expense ratio: 16.3% • Premium growth: 0.2%
Life and Pension Pre-tax profit: DKK 26m
• Risk result: DKK 13m • Bonus potential: DKK 1.1bn • Bonus rate: 11.5%
Banking Pre-tax profit: DKK 6m
• Writedowns: DKK 6m • Growth in lending • Growth in full-service
customers
2
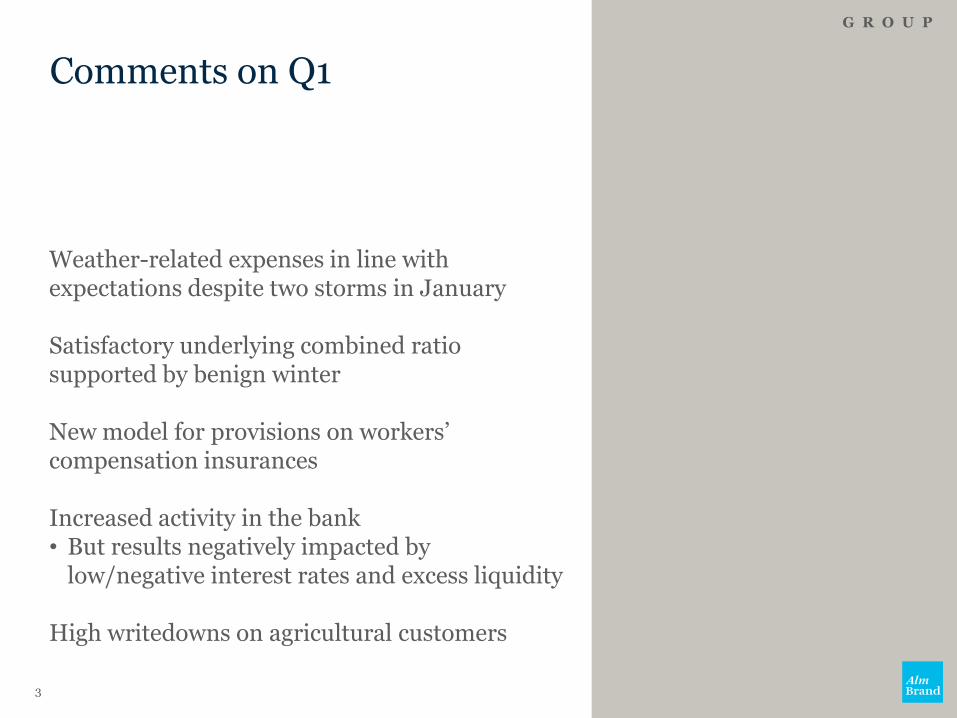
Comments on Q1
Weather-related expenses in line with expectations despite two storms in January Satisfactory underlying combined ratio supported by benign winter New model for provisions on workers’ compensation insurances Increased activity in the bank • But results negatively impacted by
low/negative interest rates and excess liquidity High writedowns on agricultural customers
G R O U P
3
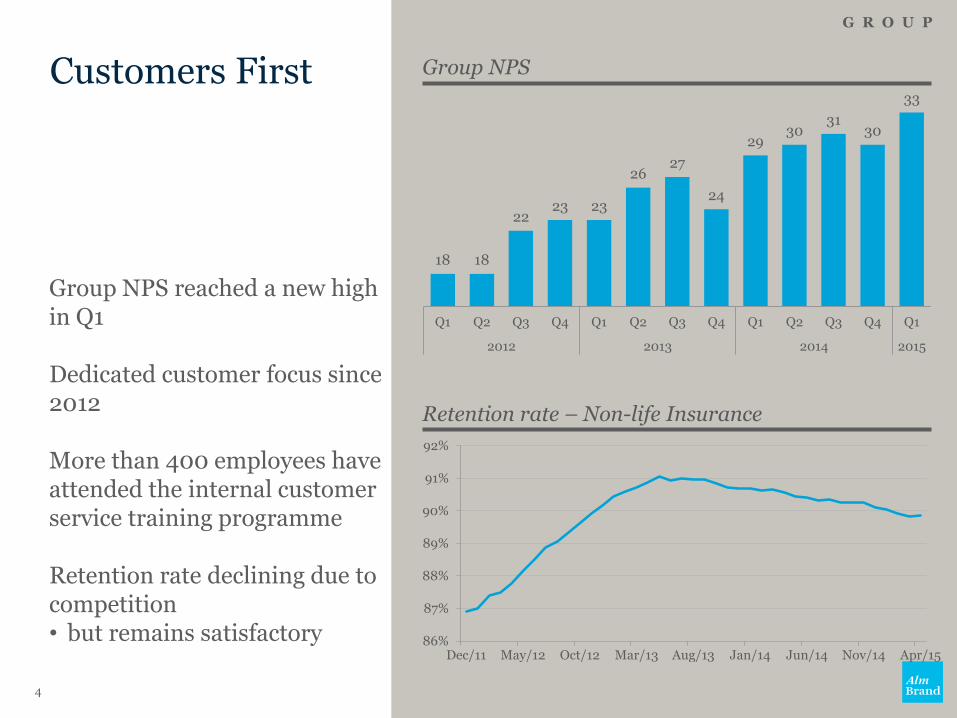
Customers First
Group NPS reached a new high in Q1 Dedicated customer focus since 2012 More than 400 employees have attended the internal customer service training programme Retention rate declining due to competition • but remains satisfactory
G R O U P
Group NPS
18 18
22 23 23
26 27
24
29 30
31 30
33
Q1 Q2 Q3 Q4 Q1 Q2 Q3 Q4 Q1 Q2 Q3 Q4 Q1
2012 2013 2014 2015
4
86%
87%
88%
89%
90%
91%
92%
Dec/11 May/12 Oct/12 Mar/13 Aug/13 Jan/14 Jun/14 Nov/14 Apr/15
Retention rate – Non-life Insurance

fjern evt. pladsholderen
NON-LIFE INSURANCE Highlights
Pre-tax profit of DKK 257m
• Technical result better than expected
– Combined ratio of 80.1
– Combined ratio excl. run-offs of 90.2
• Positive investment return
– Satisfactory returns on mortgage deeds and equities
N O N - L I F E I N S U R A N C E
Pre-tax profit DKKm
5
139 133 135
245
25
10
-3
12
164
143 132
257
2012 2013 2014 2015
Q1
Technical result
Investment return after technical interest

Combined ratio better than expected Combined ratio of 80.1 - Better than expected • Run-off gains improved CR by 10.1 ppts
– Approx. half was related to the new model on workers’ compensation insurances
• Weather-related and major claims better than expected
Underlying combined ratio of 81.5
• Discounting increased CR by 0.7 ppt • Number of claims down by 3.7% – Very few theft claims – Benign winter resulted in few motor claims
• Higher average claims
Expense ratio down Y/Y • Lower than expected
N O N - L I F E I N S U R A N C E
Combined ratio
6
73.2 72.6 72.4
63.8
15.7 16.8 16.8
16.3
88.9 89.4 89.2
80.1 81.8 82.0 81.1 81.5
2012 2013 2014 2015
Q1
Claims ratio incl. reinsurance
Gross expense ratio
Underlying combined ratio
Weather-related and major claims
N O N - L I F E I N S U R A N C E
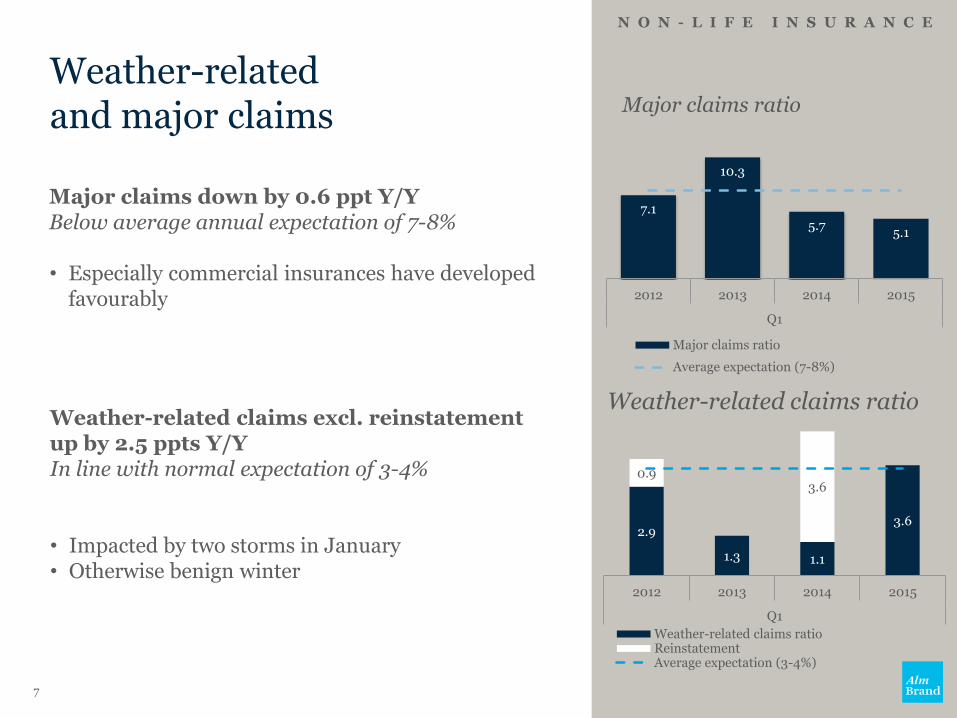
Major claims ratio
Major claims down by 0.6 ppt Y/Y Below average annual expectation of 7-8%
• Especially commercial insurances have developed
favourably
Weather-related claims excl. reinstatement up by 2.5 ppts Y/Y In line with normal expectation of 3-4%
• Impacted by two storms in January • Otherwise benign winter
Weather-related claims ratio
7
7.1
10.3
5.7 5.1
2012 2013 2014 2015
Q1
Major claims ratio
Average expectation (7-8%)
2.9
1.3 1.1
3.6
0.9 3.6
2012 2013 2014 2015
Q1
Weather-related claims ratio Reinstatement Average expectation (3-4%)
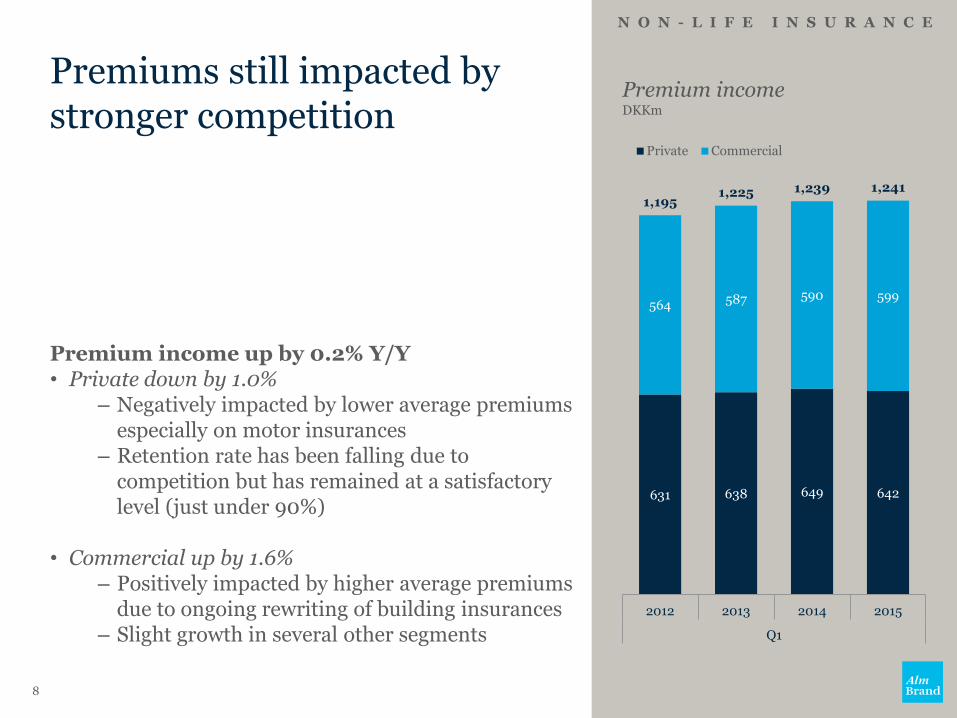
Premiums still impacted by stronger competition
Premium income up by 0.2% Y/Y • Private down by 1.0%
– Negatively impacted by lower average premiums especially on motor insurances
– Retention rate has been falling due to competition but has remained at a satisfactory level (just under 90%)
• Commercial up by 1.6% – Positively impacted by higher average premiums
due to ongoing rewriting of building insurances – Slight growth in several other segments
N O N - L I F E I N S U R A N C E
Premium income DKKm
8
631 638 649 642
564 587 590 599
1,195 1,225 1,239 1,241
2012 2013 2014 2015
Q1
Private Commercial
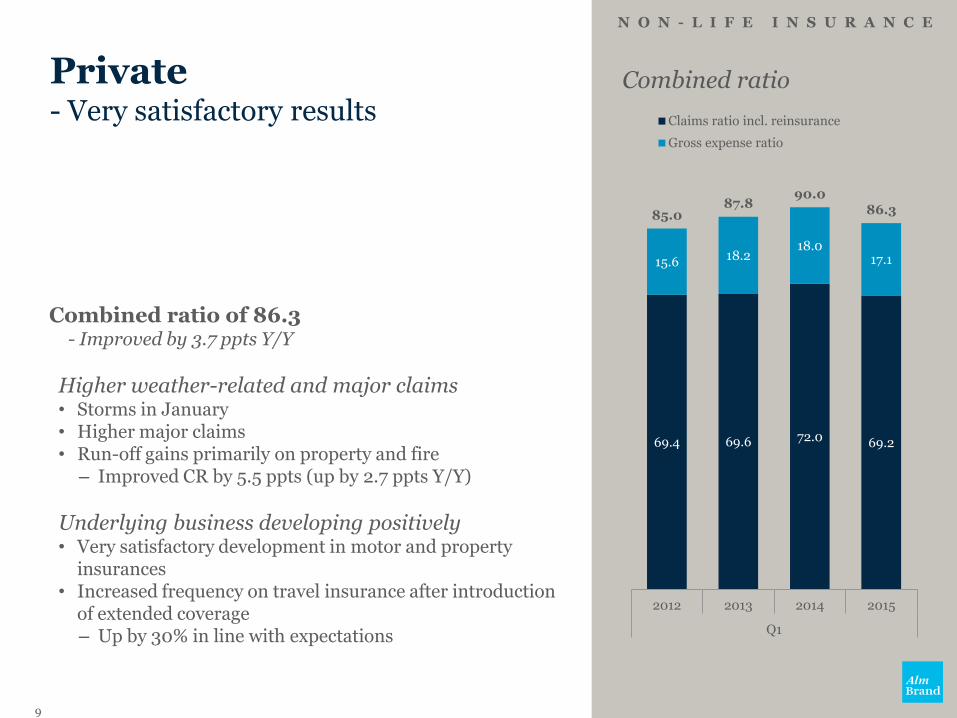
Private - Very satisfactory results
Combined ratio of 86.3 - Improved by 3.7 ppts Y/Y
Higher weather-related and major claims • Storms in January • Higher major claims • Run-off gains primarily on property and fire
– Improved CR by 5.5 ppts (up by 2.7 ppts Y/Y)
Underlying business developing positively • Very satisfactory development in motor and property
insurances • Increased frequency on travel insurance after introduction
of extended coverage – Up by 30% in line with expectations
N O N - L I F E I N S U R A N C E
Combined ratio
9
69.4 69.6 72.0 69.2
15.6 18.2 18.0
17.1
85.0 87.8
90.0 86.3
2012 2013 2014 2015
Q1
Claims ratio incl. reinsurance
Gross expense ratio
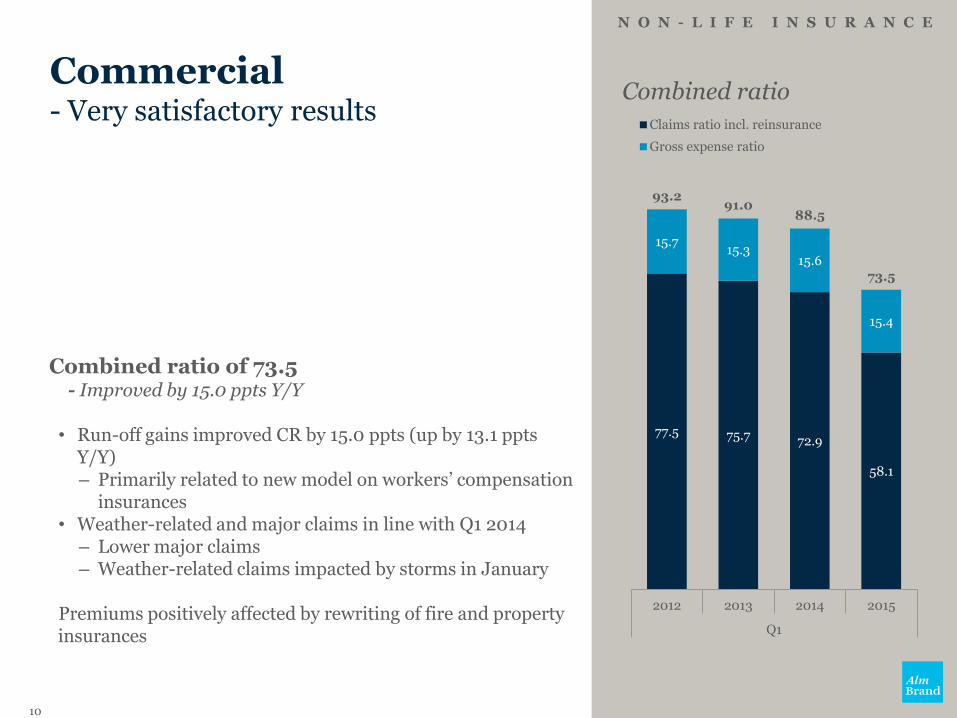
Commercial - Very satisfactory results
Combined ratio of 73.5 - Improved by 15.0 ppts Y/Y
• Run-off gains improved CR by 15.0 ppts (up by 13.1 ppts
Y/Y) – Primarily related to new model on workers’ compensation
insurances • Weather-related and major claims in line with Q1 2014
– Lower major claims – Weather-related claims impacted by storms in January
Premiums positively affected by rewriting of fire and property insurances
N O N - L I F E I N S U R A N C E
Combined ratio
10
77.5 75.7 72.9
58.1
15.7 15.3
15.6
15.4
93.2 91.0
88.5
73.5
2012 2013 2014 2015
Q1
Claims ratio incl. reinsurance
Gross expense ratio
fjern evt. pladsholderen
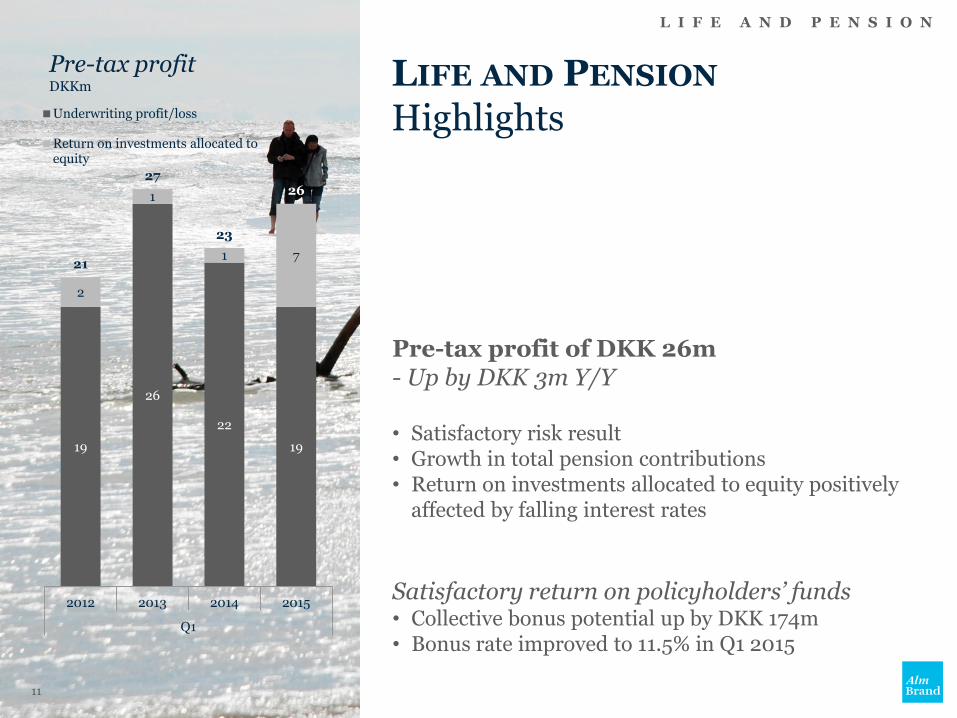
LIFE AND PENSION Highlights
Pre-tax profit of DKK 26m - Up by DKK 3m Y/Y • Satisfactory risk result • Growth in total pension contributions • Return on investments allocated to equity positively
affected by falling interest rates
Satisfactory return on policyholders’ funds • Collective bonus potential up by DKK 174m • Bonus rate improved to 11.5% in Q1 2015
L I F E A N D P E N S I O N
Pre-tax profit DKKm
11
19
26
22
19
2
1
1 7 21
27
23
26
2012 2013 2014 2015
Q1
Underwriting profit/loss
Return on investments allocated to equity
Pension contributions
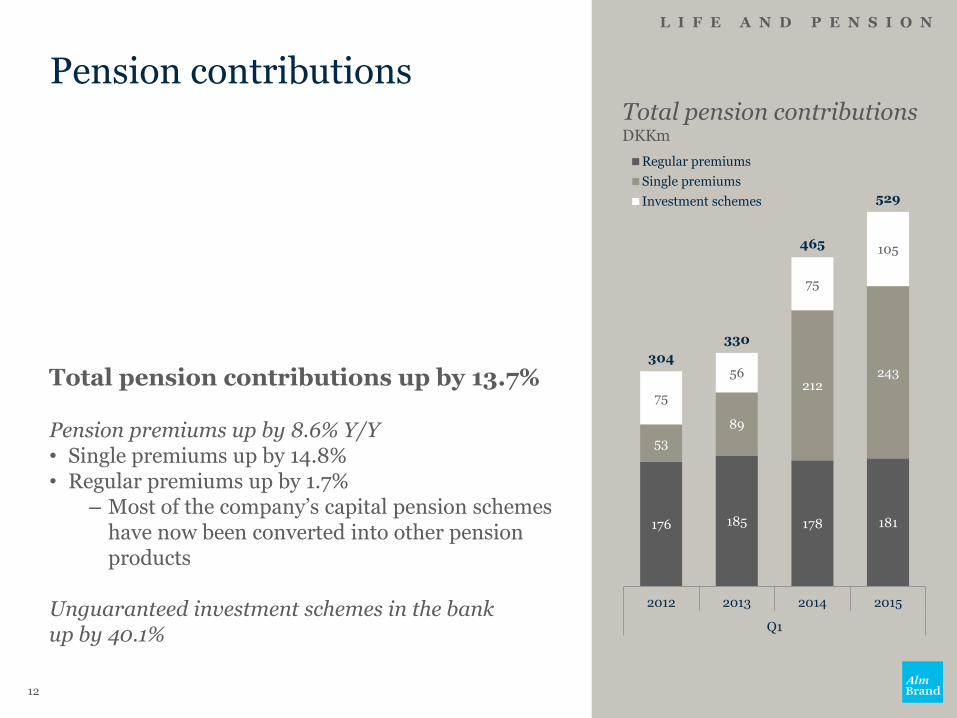
Total pension contributions up by 13.7%
Pension premiums up by 8.6% Y/Y • Single premiums up by 14.8% • Regular premiums up by 1.7%
– Most of the company’s capital pension schemes have now been converted into other pension products
Unguaranteed investment schemes in the bank up by 40.1%
L I F E A N D P E N S I O N
Total pension contributions DKKm
12
176 185 178 181
53
89
212 243
75
56
75
105
304
330
465
529
2012 2013 2014 2015
Q1
Regular premiums
Single premiums
Investment schemes
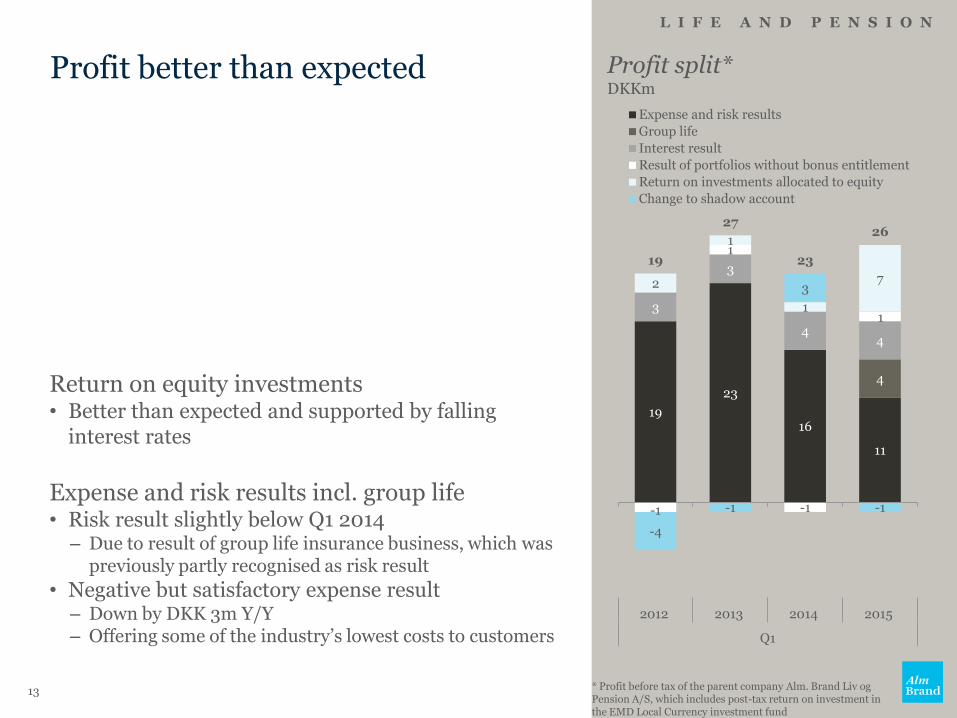
Profit better than expected
Return on equity investments • Better than expected and supported by falling
interest rates
Expense and risk results incl. group life • Risk result slightly below Q1 2014
– Due to result of group life insurance business, which was previously partly recognised as risk result
• Negative but satisfactory expense result – Down by DKK 3m Y/Y – Offering some of the industry’s lowest costs to customers
L I F E A N D P E N S I O N
Profit split* DKKm
13 * Profit before tax of the parent company Alm. Brand Liv og Pension A/S, which includes post-tax return on investment in the EMD Local Currency investment fund
19
23
16
11
4
3
3
4 4
-1
1
-1
1
2
1
1
7
-4
-1
3
-1
19
27
23
26
2012 2013 2014 2015
Q1
Expense and risk results
Group life
Interest result
Result of portfolios without bonus entitlement
Return on investments allocated to equity
Change to shadow account

Investment return - Very satisfactory return and improved bonus rate
L I F E A N D P E N S I O N
Strong bonus potential
• Average bonus rate of 11.5%
• Attractive bonus rate for new policyholders of 13.8%
Rate on policyholders’ savings
• Highest rate on private policyholders’ savings in Denmark
U74*
Interest rate group Total
0 1 2 3
Technical interest rate 0.5-1.5 1.5-2.5 2.5-3.5 3.5-4.5
Rate on policyholders’ savings, 2015 4.00 5.00 5.00 6.00
Investment assets (DKKbn) 0.1 5.9 1.9 1.4 3.8 13,1
Bonus rate (%) 13.8 18.6 6.8 4.6 11.5
Return (% YTD) 4.6 5.2 3.0 3.4 4.3
Bonds 100% 58% 51% 74% 78% 65%
Equities 0% 26% 21% 9% 4% 16%
Property 0% 16% 13% 10% 8% 12%
Fixed-income derivatives 0% 0% 15% 7% 10% 7%
*Portfolios without bonus entitlement
14
fjern evt. pladsholderen
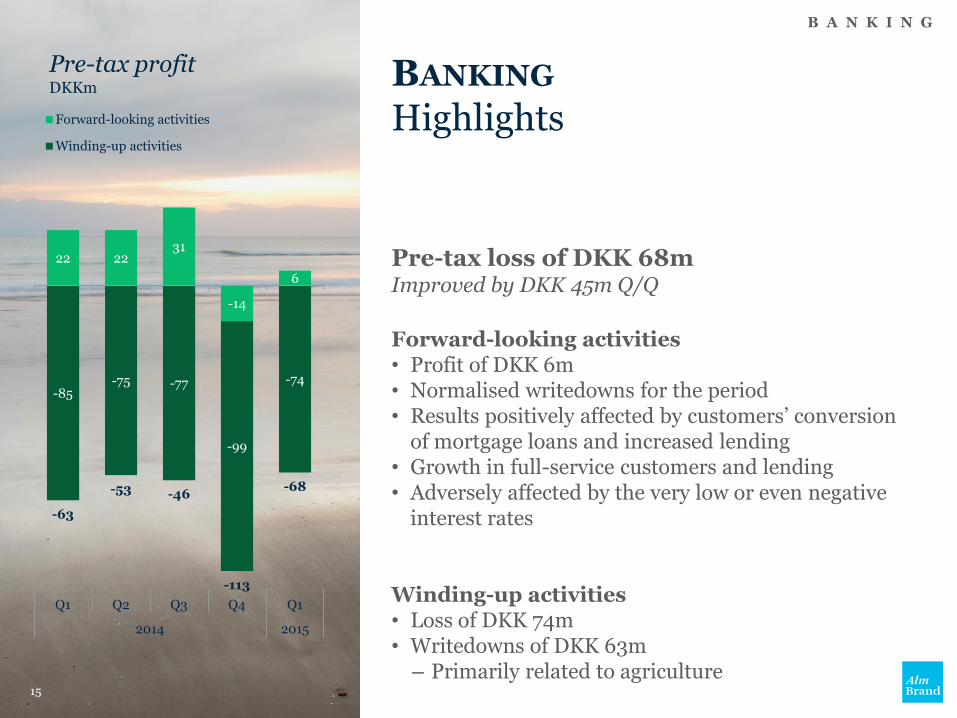
BANKING Highlights
Pre-tax loss of DKK 68m Improved by DKK 45m Q/Q
Forward-looking activities • Profit of DKK 6m • Normalised writedowns for the period • Results positively affected by customers’ conversion
of mortgage loans and increased lending • Growth in full-service customers and lending • Adversely affected by the very low or even negative
interest rates
Winding-up activities • Loss of DKK 74m • Writedowns of DKK 63m
– Primarily related to agriculture
B A N K I N G
Pre-tax profit DKKm
15
22 22 31
-14
6
-85 -75 -77
-99
-74
-63
-53 -46
-113
-68
Q1 Q2 Q3 Q4 Q1
2014 2015
Forward-looking activities
Winding-up activities
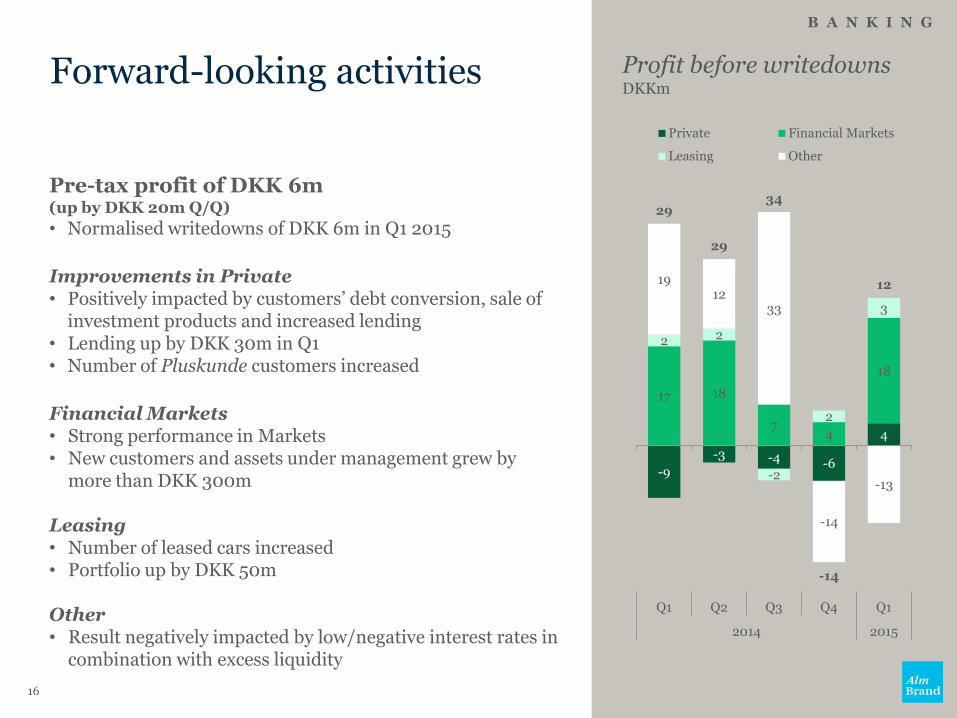
Forward-looking activities
Pre-tax profit of DKK 6m (up by DKK 20m Q/Q)
• Normalised writedowns of DKK 6m in Q1 2015
Improvements in Private • Positively impacted by customers’ debt conversion, sale of
investment products and increased lending • Lending up by DKK 30m in Q1 • Number of Pluskunde customers increased
Financial Markets • Strong performance in Markets • New customers and assets under management grew by
more than DKK 300m
Leasing • Number of leased cars increased • Portfolio up by DKK 50m
Other • Result negatively impacted by low/negative interest rates in
combination with excess liquidity
B A N K I N G
Profit before writedowns DKKm
16
-9
-3 -4 -6
4
17 18
7 4
18
2 2
-2
2
3
19 12
33
-14
-13
29
29
34
-14
12
Q1 Q2 Q3 Q4 Q1
2014 2015
Private Financial Markets
Leasing Other
Winding-up activities
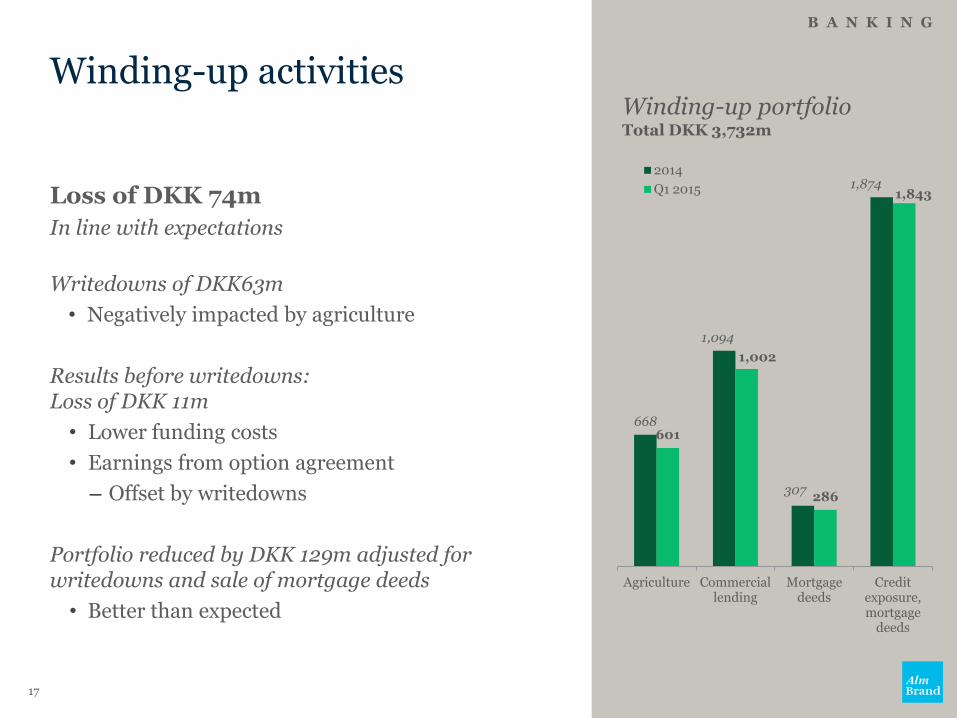
Loss of DKK 74m
In line with expectations
Writedowns of DKK63m
• Negatively impacted by agriculture
Results before writedowns: Loss of DKK 11m
• Lower funding costs
• Earnings from option agreement
– Offset by writedowns
Portfolio reduced by DKK 129m adjusted for writedowns and sale of mortgage deeds
• Better than expected
B A N K I N G
Winding-up portfolio Total DKK 3,732m
17
668
1,094
307
1,874
601
1,002
286
1,843
Agriculture Commercial lending
Mortgage deeds
Credit exposure, mortgage
deeds
2014
Q1 2015
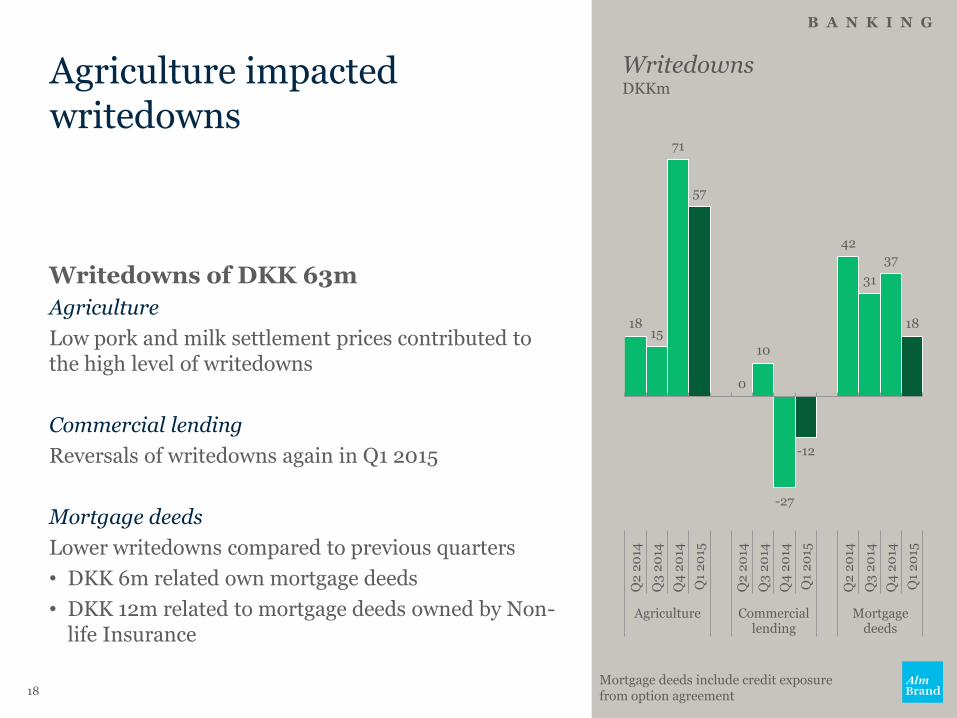
Agriculture impacted writedowns
Writedowns of DKK 63m
Agriculture
Low pork and milk settlement prices contributed to the high level of writedowns
Commercial lending
Reversals of writedowns again in Q1 2015
Mortgage deeds
Lower writedowns compared to previous quarters
• DKK 6m related own mortgage deeds
• DKK 12m related to mortgage deeds owned by Non-life Insurance
B A N K I N G
Writedowns DKKm
18 Mortgage deeds include credit exposure from option agreement
18 15
71
57
0
10
-27
-12
42
31
37
18
Q2
20
14
Q3
20
14
Q4
20
14
Q1
20
15
Q2
20
14
Q3
20
14
Q4
20
14
Q1
20
15
Q2
20
14
Q3
20
14
Q4
20
14
Q1
20
15
Agriculture Commercial lending
Mortgage deeds

CAPITAL MODEL
Excess capital higher than expected
• Risk related to Banking reduced by DKK 110m in Q1
• Dividend payment reduced excess capital by DKK 85m
G R O U P
19
Development in excess capital DKKm
Equity in Q1 2015 was reduced by the dividend payment approved at the AGM
4,506 4,685 4,847 4,906
-665 -556 -526 -509
1,654 925 522 518
5,495
5,054 4,843 4,915
886 906
211 383
2012 2013 2014 Q1 2015
Equity
Tax assets
Tier 2 capital
Excess relative to internal capital target

Full-year outlook for 2015 - Raised by an additional DKK 50m
DKK 350-450m Pre-tax profit
Forward-looking activities: Pre-tax profit of DKK 700-750m
Winding-up activities: Loss of DKK 300-350m Prices on agricultural products expected to impact writedowns negatively
G R O U P
Non-life Insurance Pre-tax profit: DKK 650m • CR at the level of 88 • Expense ratio at the level of 16% • Premiums in line with 2014
Life and Pension Pre-tax profit: DKK 75m • Expects to book risk
allowance for all contribution groups
• Regular premiums expected to grow by 4%
Banking Pre-tax profit: DKK 40m • Writedowns of around
DKK 20m • Negative impact from low
interest rate level
20
Non-life Insurance: Run-off gains lifted the technical result. Topline still impacted by intensified competition
Life and Pension: Growth in pension contributions and improved bonus potential
Banking: Increased customer activity in all continuing activities
Winding-up activities: Still high risk on agricultural lending
Outlook: Pre-tax profit of DKK 350-450m in 2015
G R O U P
21
Highlights
“The statements made in this presentation are based on current expectations, estimates and projections made by management. All statements about future financial performance are subject to risks and uncertainties that could cause actual results to differ materially from those set forth in or implied by the statements. All statements about future financial performance made in this presentation are solely based on information known at the time of the preparation of the last published financial report, and the company assumes no obligation to update these statements, whether as a result of new information, future events, or otherwise.”
22
Alm Brand
Results for Q1 2015 Webcast presentation 12 May 2015