Embed Size (px)
Citation preview
Results for the half year ended
30 June 2017
Capita plc21 September 2017
Agenda
2 | H1 2017 financial results
Introduction Ian Powell, Chairman
Overview & financial results Nick Greatorex, Interim CEO and Group Finance Director
Business development Chris Sellers, Group Business Development Director
Summary & outlook Nick Greatorex, Interim CEO and Group Finance Director

Overview & Financial Results
Nick GreatorexInterim CEO and Group Finance Director
3 | H1 2017 financialresults
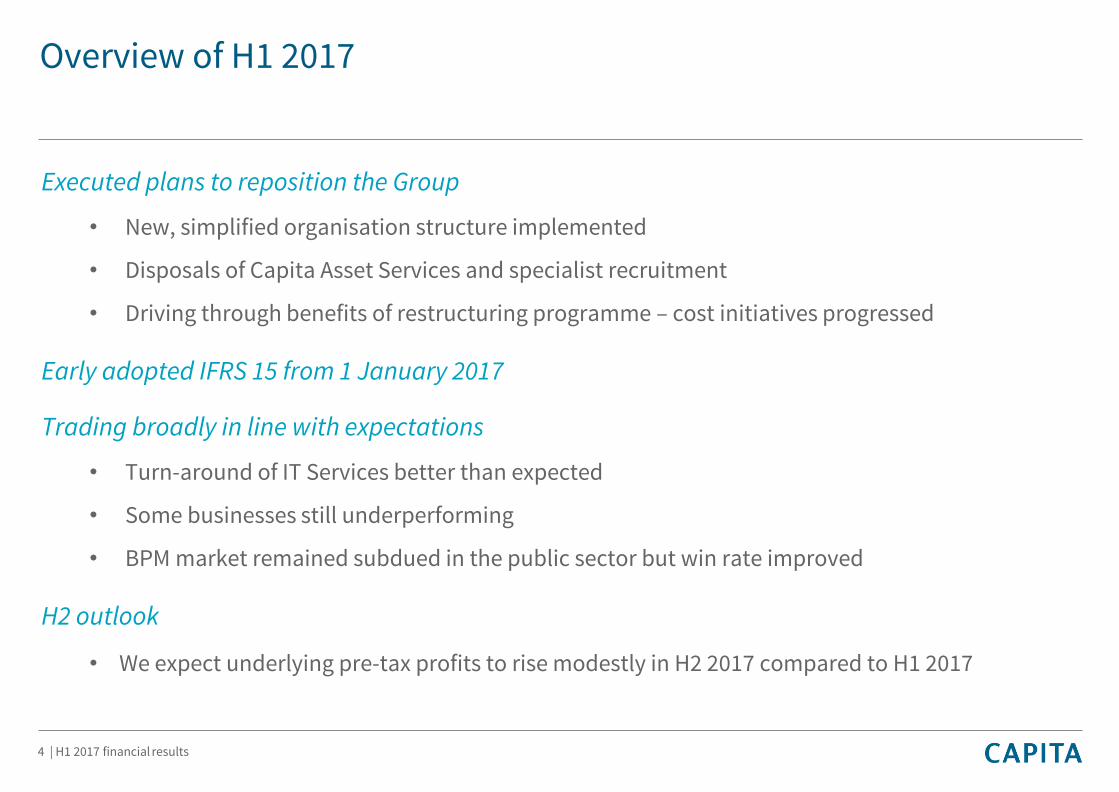
Overview of H1 2017
Executed plans to reposition the Group
• New, simplified organisation structure implemented
• Disposals of Capita Asset Services and specialist recruitment
• Driving through benefits of restructuring programme – cost initiatives progressed
Early adopted IFRS 15 from 1 January 2017
Trading broadly in line with expectations
• Turn-around of IT Services better than expected
• Some businesses still underperforming
• BPM market remained subdued in the public sector but win rate improved
H2 outlook
• We expect underlying pre-tax profits to rise modestly in H2 2017 compared to H1 2017
4 | H1 2017 financial results
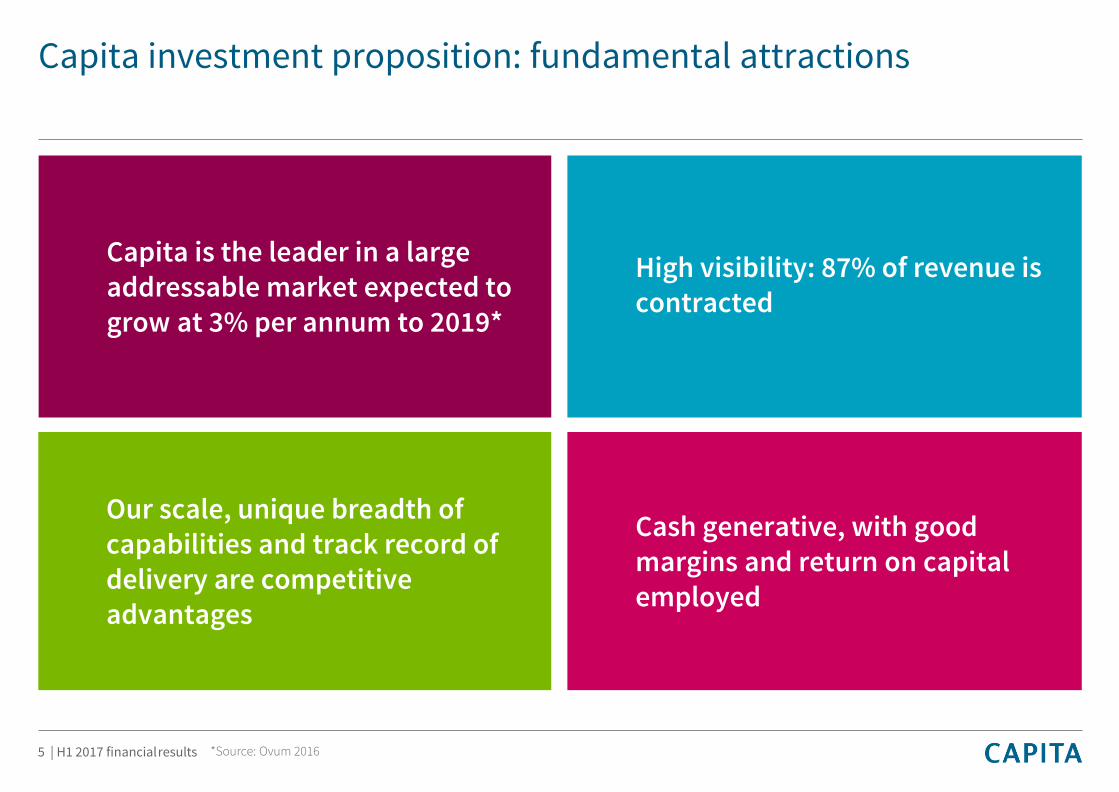
Capita is the leader in a large addressable market expected to grow at 3% per annum to 2019*
High visibility: 87% of revenue is contracted
Cash generative, with good margins and return on capital employed
Our scale, unique breadth of capabilities and track record of delivery are competitive advantages
5 | H1 2017 financialresults *Source: Ovum 2016
Capita investment proposition: fundamental attractions
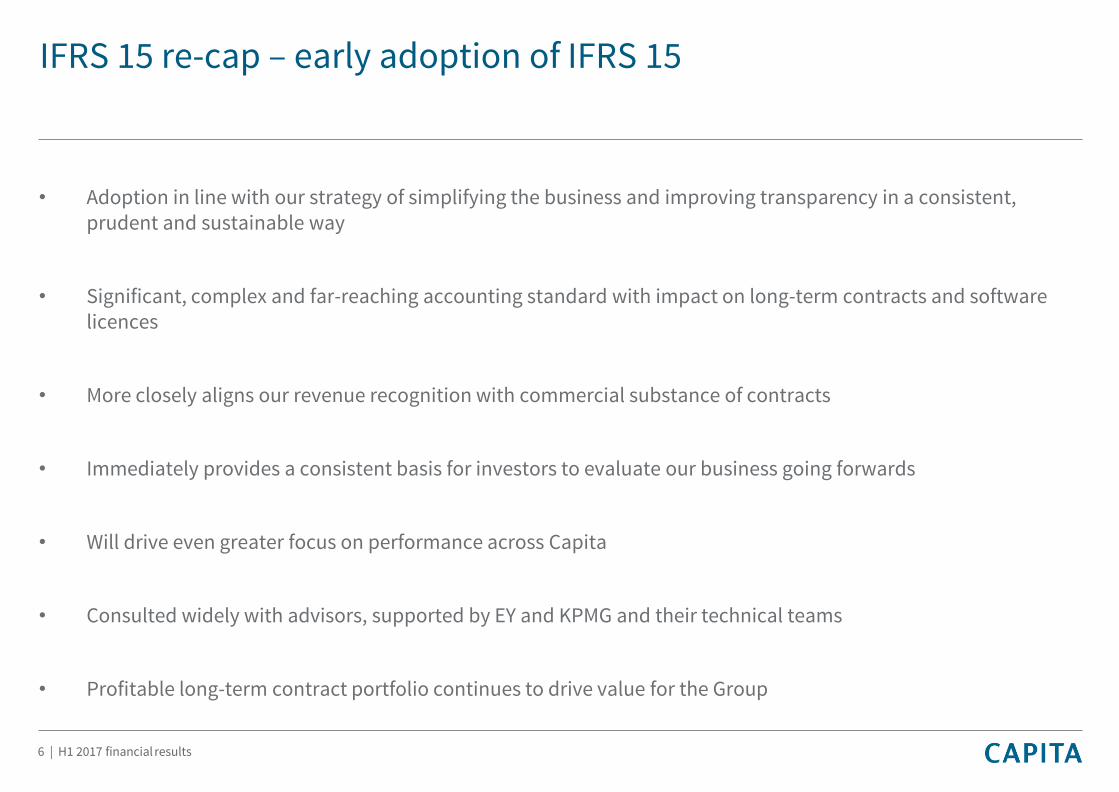
IFRS 15 re-cap – early adoption of IFRS 15
• Adoption in line with our strategy of simplifying the business and improving transparency in a consistent, prudent and sustainable way
• Significant, complex and far-reaching accounting standard with impact on long-term contracts and software licences
• More closely aligns our revenue recognition with commercial substance of contracts
• Immediately provides a consistent basis for investors to evaluate our business going forwards
• Will drive even greater focus on performance across Capita
• Consulted widely with advisors, supported by EY and KPMG and their technical teams
• Profitable long-term contract portfolio continues to drive value for the Group
6 | H1 2017 financial results
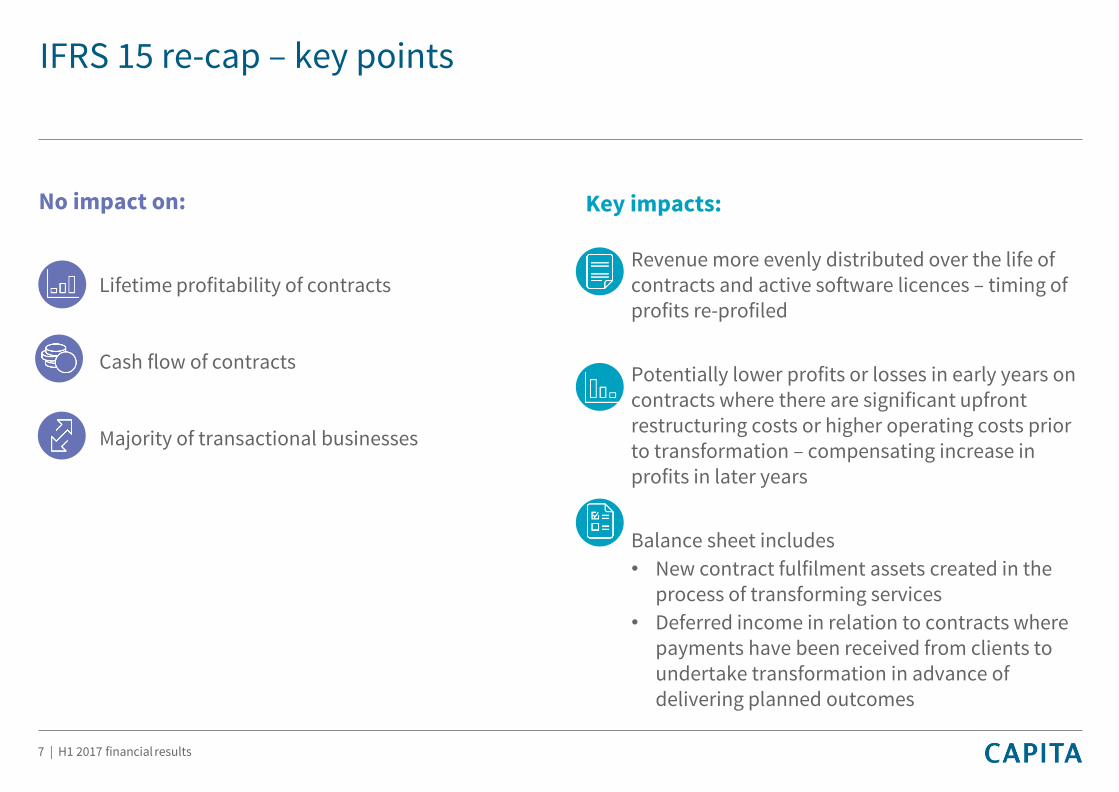
IFRS 15 re-cap – key points
No impact on:
Lifetime profitability of contracts
Cash flow of contracts
Majority of transactional businesses
Key impacts:
Revenue more evenly distributed over the life of contracts and active software licences – timing of profits re-profiled
Potentially lower profits or losses in early years on contracts where there are significant upfront restructuring costs or higher operating costs prior to transformation – compensating increase in profits in later years
Balance sheet includes
• New contract fulfilment assets created in the process of transforming services
• Deferred income in relation to contracts where payments have been received from clients to undertake transformation in advance of delivering planned outcomes
7 | H1 2017 financial results
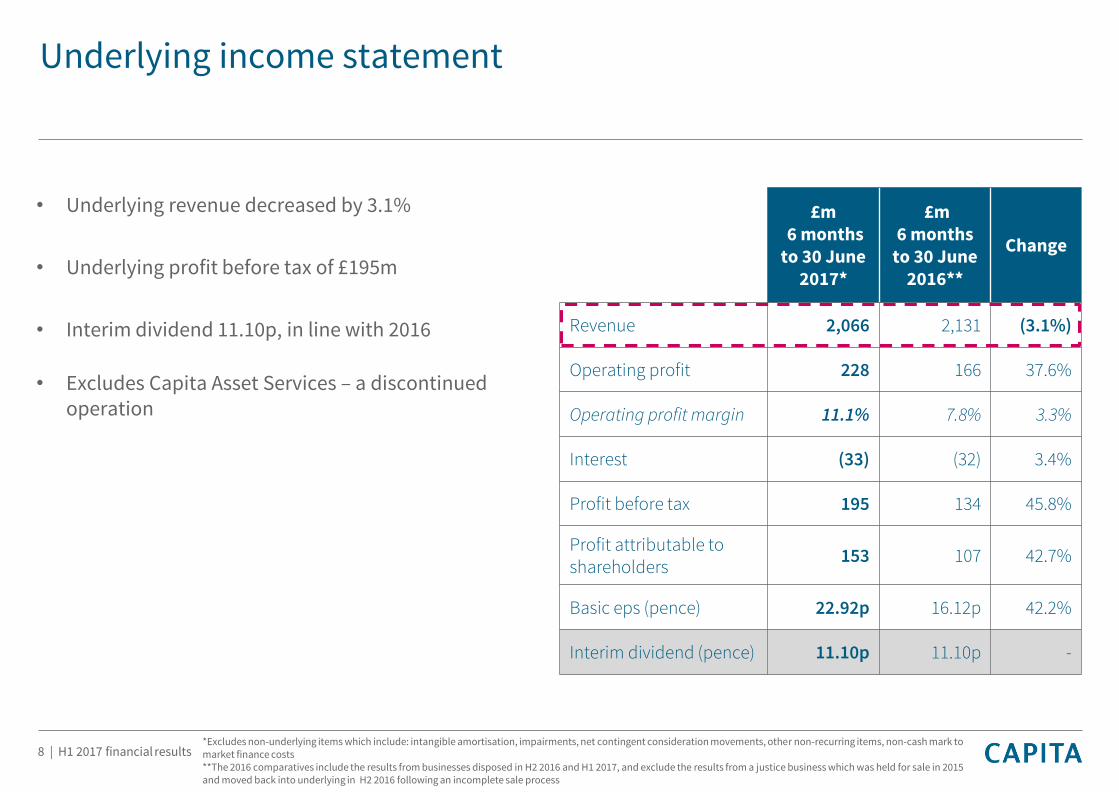
Underlying income statement
• Underlying revenue decreased by 3.1%
• Underlying profit before tax of £195m
• Interim dividend 11.10p, in line with 2016
• Excludes Capita Asset Services – a discontinued operation
£m6 months
to 30 June 2017*
£m 6 months
to 30 June 2016**
Change
Revenue 2,066 2,131 (3.1%)
Operating profit 228 166 37.6%
Operating profit margin 11.1% 7.8% 3.3%
Interest (33) (32) 3.4%
Profit before tax 195 134 45.8%
Profit attributable to shareholders
153 107 42.7%
Basic eps (pence) 22.92p 16.12p 42.2%
Interim dividend (pence) 11.10p 11.10p -
*Excludes non-underlying items which include: intangible amortisation, impairments, net contingent consideration movements, other non-recurring items, non-cash mark to market finance costs**The 2016 comparatives include the results from businesses disposed in H2 2016 and H1 2017, and exclude the results from a justice business which was held for sale in 2015 and moved back into underlying in H2 2016 following an incomplete sale process
8 | H1 2017 financial results
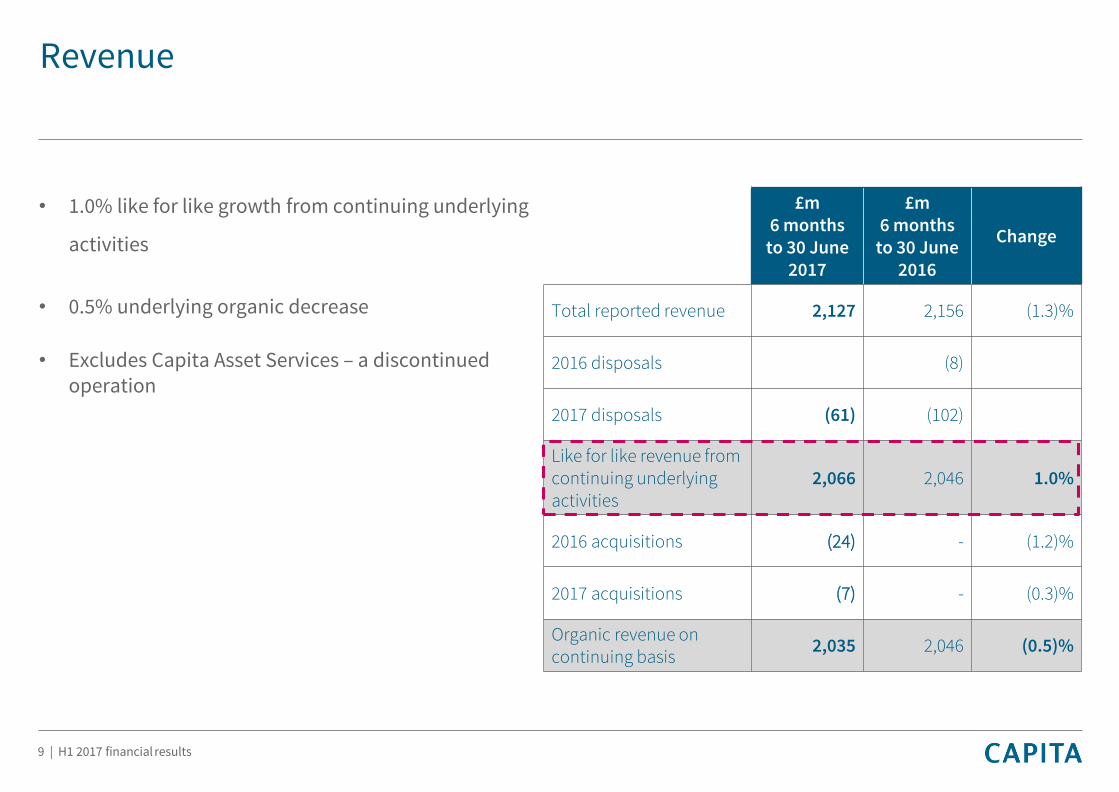
Revenue
• 1.0% like for like growth from continuing underlying
activities
• 0.5% underlying organic decrease
• Excludes Capita Asset Services – a discontinued operation
£m 6 months
to 30 June2017
£m 6 months
to 30 June 2016
Change
Total reported revenue 2,127 2,156 (1.3)%
2016 disposals (8)
2017 disposals (61) (102)
Like for like revenue from continuing underlying activities
2,066 2,046 1.0%
2016 acquisitions (24) - (1.2)%
2017 acquisitions (7) - (0.3)%
Organic revenue on continuing basis
2,035 2,046 (0.5)%
9 | H1 2017 financial results
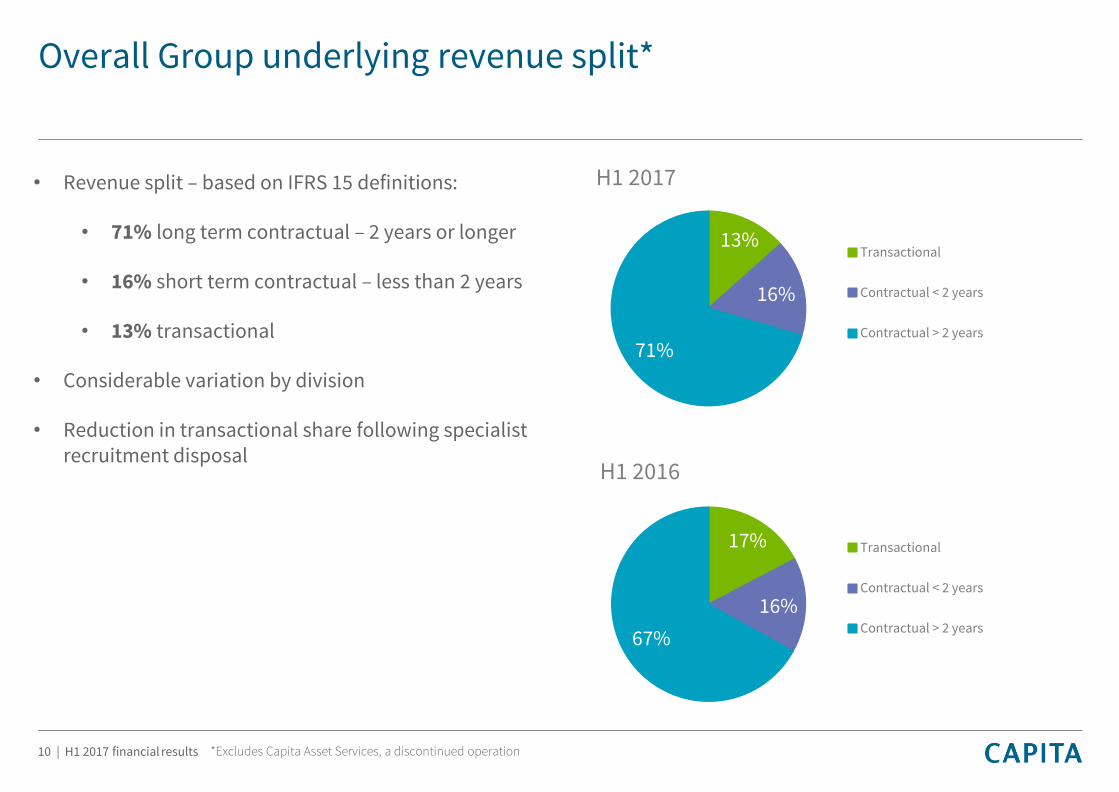
Overall Group underlying revenue split*
• Revenue split – based on IFRS 15 definitions:
• 71% long term contractual – 2 years or longer
• 16% short term contractual – less than 2 years
• 13% transactional
• Considerable variation by division
• Reduction in transactional share following specialist recruitment disposal
10 | H1 2017 financial results
17%
16%
67%
H1 2016
Transactional
Contractual < 2 years
Contractual > 2 years
13%
16%
71%
H1 2017
Transactional
Contractual < 2 years
Contractual > 2 years
*Excludes Capita Asset Services, a discontinued operation
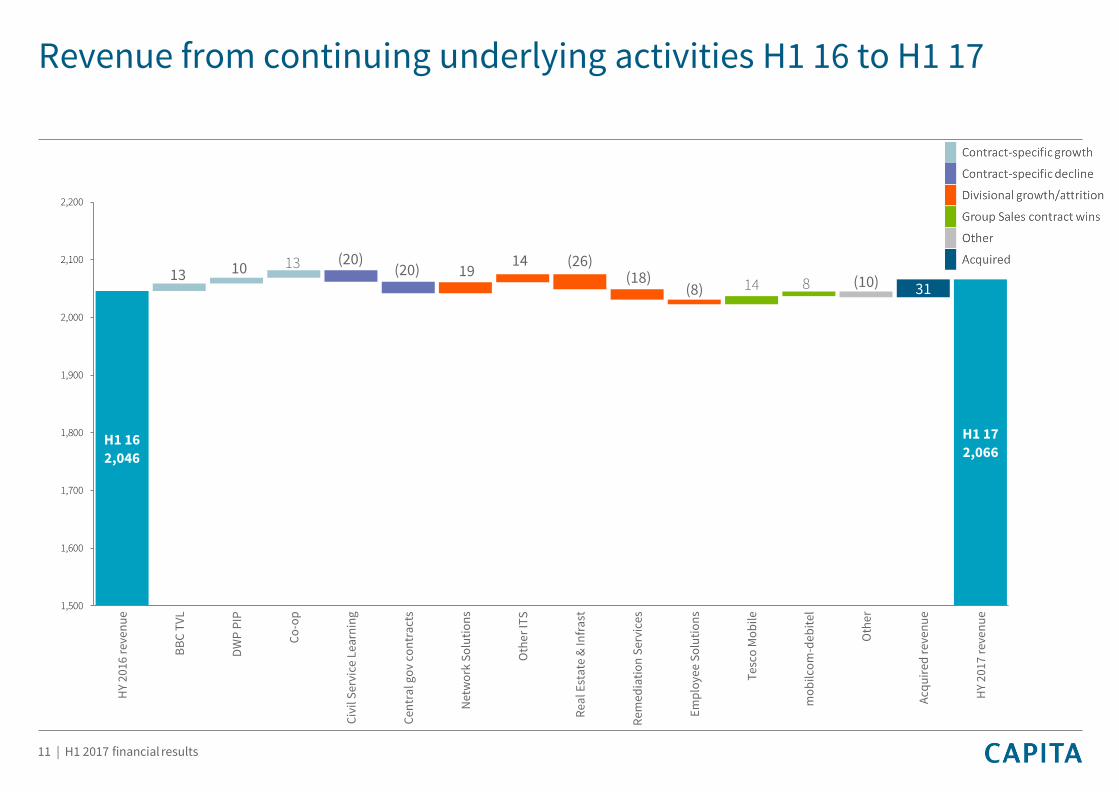
Revenue from continuing underlying activities H1 16 to H1 17
11 | H1 2017 financial results
H1 16 2,046
H1 17
2,066
13 10 1319
14
14 8 31
(20)(20)
(26)(18)
(8) (10)
1,500
1,600
1,700
1,800
1,900
2,000
2,100
2,200
HY
201
6 r
eve
nu
e
BB
C T
VL
DW
P P
IP
Co
-op
Civ
il S
ervi
ce L
earn
ing
Cen
tra
l go
v co
ntr
act
s
Net
wo
rk S
olu
tio
ns
Oth
er
ITS
Rea
l Est
ate
& In
fra
st
Rem
edia
tio
n S
ervi
ces
Em
plo
yee
So
luti
on
s
Te
sco
Mo
bil
e
mo
bilc
om
-de
bit
el
Oth
er
Acq
uir
ed r
eve
nu
e
HY
201
7 r
eve
nu
e
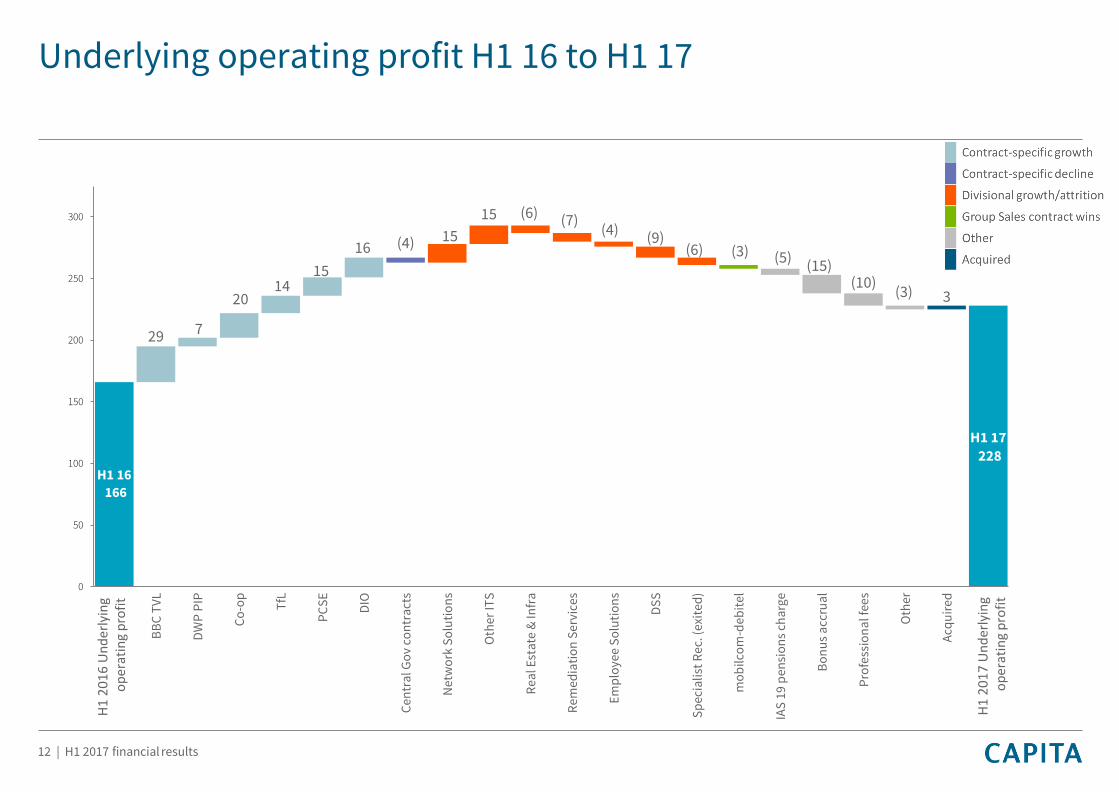
Underlying operating profit H1 16 to H1 17
12 | H1 2017 financial results
H1 16166
H1 17
228
29 7
2014
15
1615
15
3
(4)
(6) (7)(4)
(9)(6) (3) (5)
(15)(10)
(3)
0
50
100
150
200
250
300
BB
C T
VL
DW
P P
IP
Co
-op
TfL
PC
SE
DIO
Cen
tra
l Go
v co
ntr
act
s
Net
wo
rk S
olu
tio
ns
Oth
er IT
S
Re
al E
sta
te &
Infr
a
Re
med
iati
on
Se
rvic
es
Em
plo
yee
So
luti
on
s
DS
S
Sp
ecia
list
Re
c. (
exit
ed)
mo
bilc
om
-deb
itel
IAS
19
pen
sio
ns
cha
rge
Bo
nu
s a
ccru
al
Pro
fess
ion
al f
ees
Oth
er
Acq
uir
ed
H1
20
17
Un
der
lyin
go
per
atin
g p
rofi
t
H1
20
16
Un
der
lyin
go
per
atin
g p
rofi
t
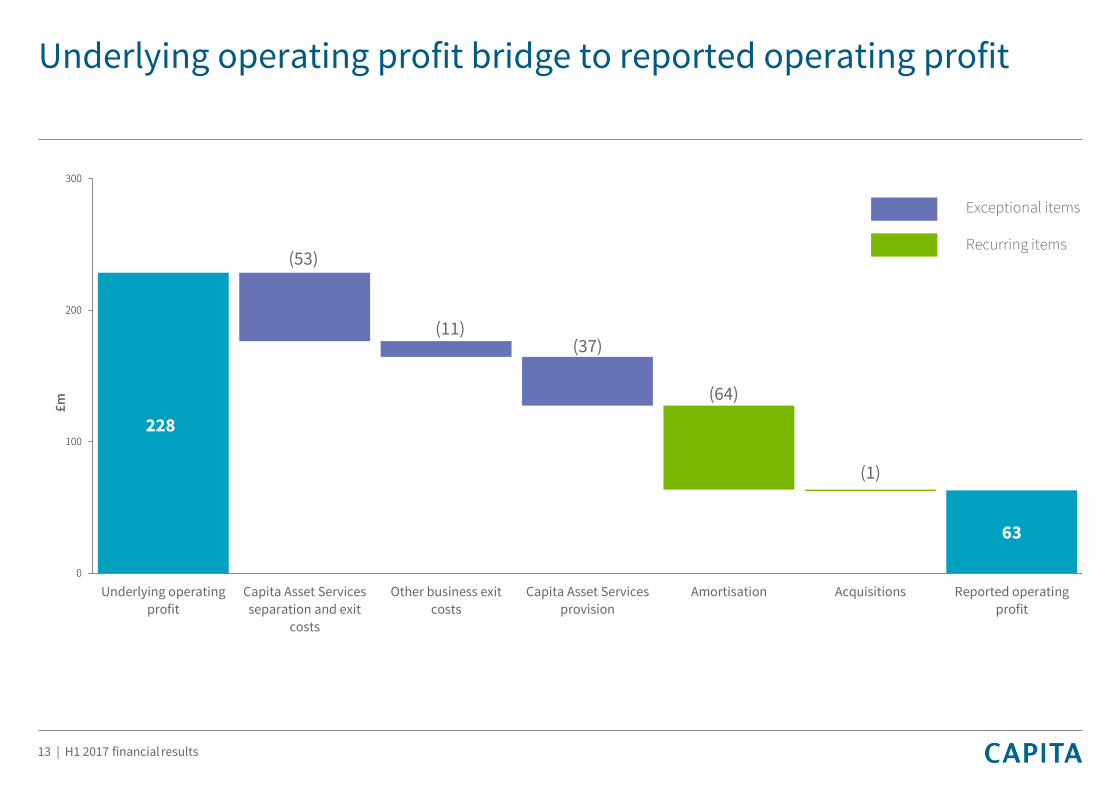
Underlying operating profit bridge to reported operating profit
228
63
(53)
(11)(37)
(64)
(1)
0
100
200
300
Underlying operating
profit
Capita Asset Services
separation and exitcosts
Other business exit
costs
Capita Asset Services
provision
Amortisation Acquisitions Reported operating
profit
Recurring items
Exceptional items
£m
13 | H1 2017 financial results
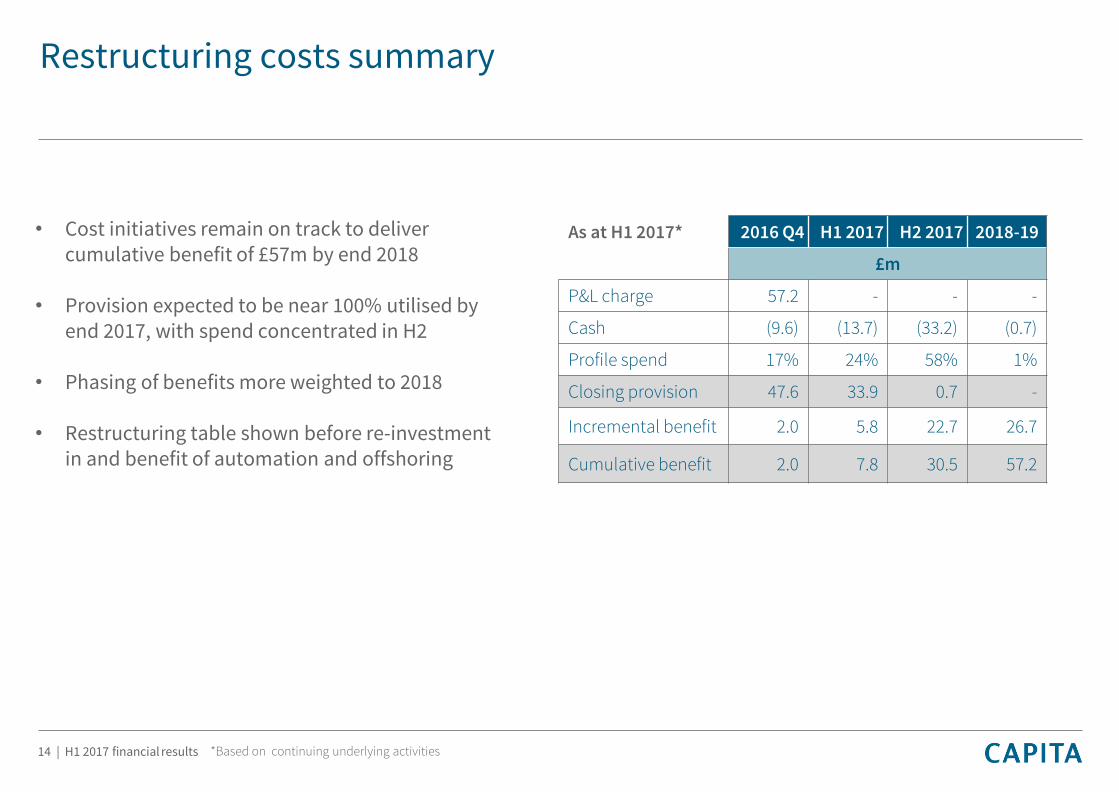
Restructuring costs summary
• Cost initiatives remain on track to deliver cumulative benefit of £57m by end 2018
• Provision expected to be near 100% utilised by end 2017, with spend concentrated in H2
• Phasing of benefits more weighted to 2018
• Restructuring table shown before re-investment in and benefit of automation and offshoring
As at H1 2017* 2016 Q4 H1 2017 H2 2017 2018-19
£m
P&L charge 57.2 - - -
Cash (9.6) (13.7) (33.2) (0.7)
Profile spend 17% 24% 58% 1%
Closing provision 47.6 33.9 0.7 -
Incremental benefit 2.0 5.8 22.7 26.7
Cumulative benefit 2.0 7.8 30.5 57.2
14 | H1 2017 financial results *Based on continuing underlying activities
Underlying operating margin
15 | H1 2017 financial results
Focus on improving operating margin through:
New winsRobust sales process
Offshoring and investmentCost efficiency through strategic relocation of operations
Finance transformationLong-term transformation programme in place
ProcurementNew system development to maximise opportunities for centralised function
PropertyLong-term consolidation plan progressing
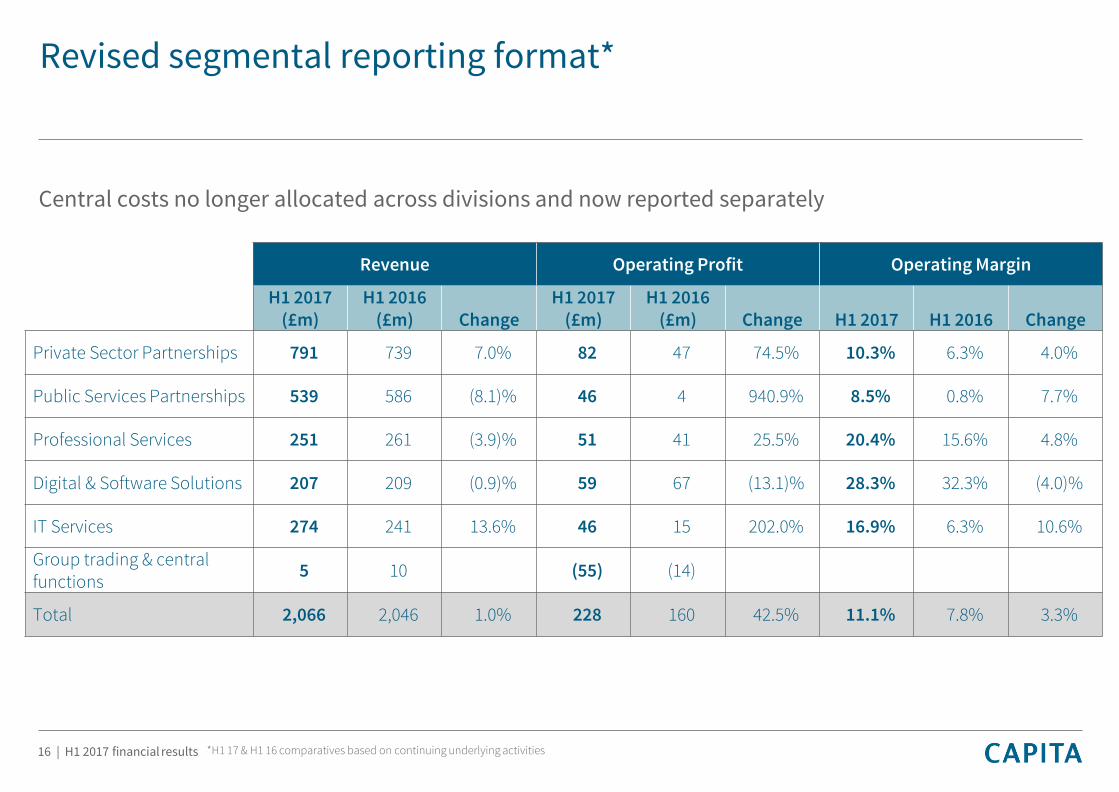
Revised segmental reporting format*
Central costs no longer allocated across divisions and now reported separately
Revenue Operating Profit Operating Margin
H1 2017 (£m)
H1 2016 (£m) Change
H1 2017 (£m)
H1 2016 (£m) Change H1 2017 H1 2016 Change
Private Sector Partnerships 791 739 7.0% 82 47 74.5% 10.3% 6.3% 4.0%
Public Services Partnerships 539 586 (8.1)% 46 4 940.9% 8.5% 0.8% 7.7%
Professional Services 251 261 (3.9)% 51 41 25.5% 20.4% 15.6% 4.8%
Digital & Software Solutions 207 209 (0.9)% 59 67 (13.1)% 28.3% 32.3% (4.0)%
IT Services 274 241 13.6% 46 15 202.0% 16.9% 6.3% 10.6%
Group trading & central functions
5 10 (55) (14)
Total 2,066 2,046 1.0% 228 160 42.5% 11.1% 7.8% 3.3%
*H1 17 & H1 16 comparatives based on continuing underlying activities16 | H1 2017 financial results
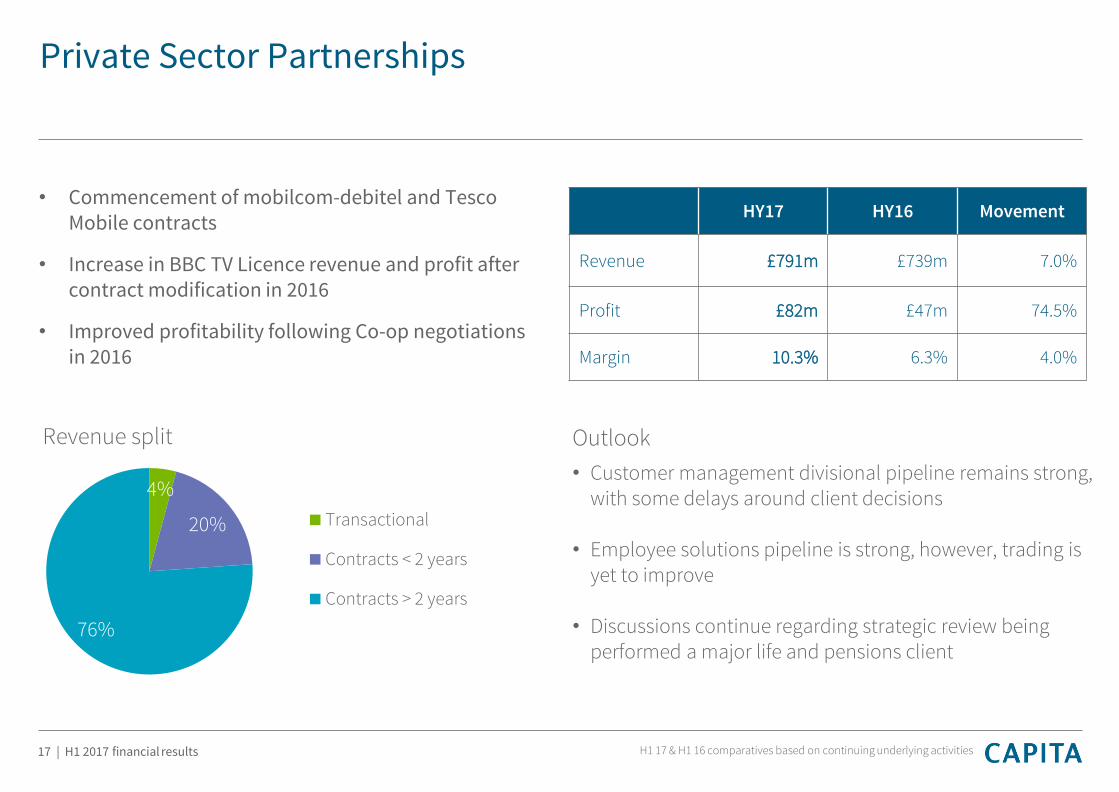
Private Sector Partnerships
HY17 HY16 Movement
Revenue £791m £739m 7.0%
Profit £82m £47m 74.5%
Margin 10.3% 6.3% 4.0%
4%
20%
76%
Revenue split
Transactional
Contracts < 2 years
Contracts > 2 years
17 | H1 2017 financial results
• Commencement of mobilcom-debitel and Tesco Mobile contracts
• Increase in BBC TV Licence revenue and profit after contract modification in 2016
• Improved profitability following Co-op negotiations in 2016
Outlook
• Customer management divisional pipeline remains strong, with some delays around client decisions
• Employee solutions pipeline is strong, however, trading is yet to improve
• Discussions continue regarding strategic review being performed a major life and pensions client
H1 17 & H1 16 comparatives based on continuing underlying activities
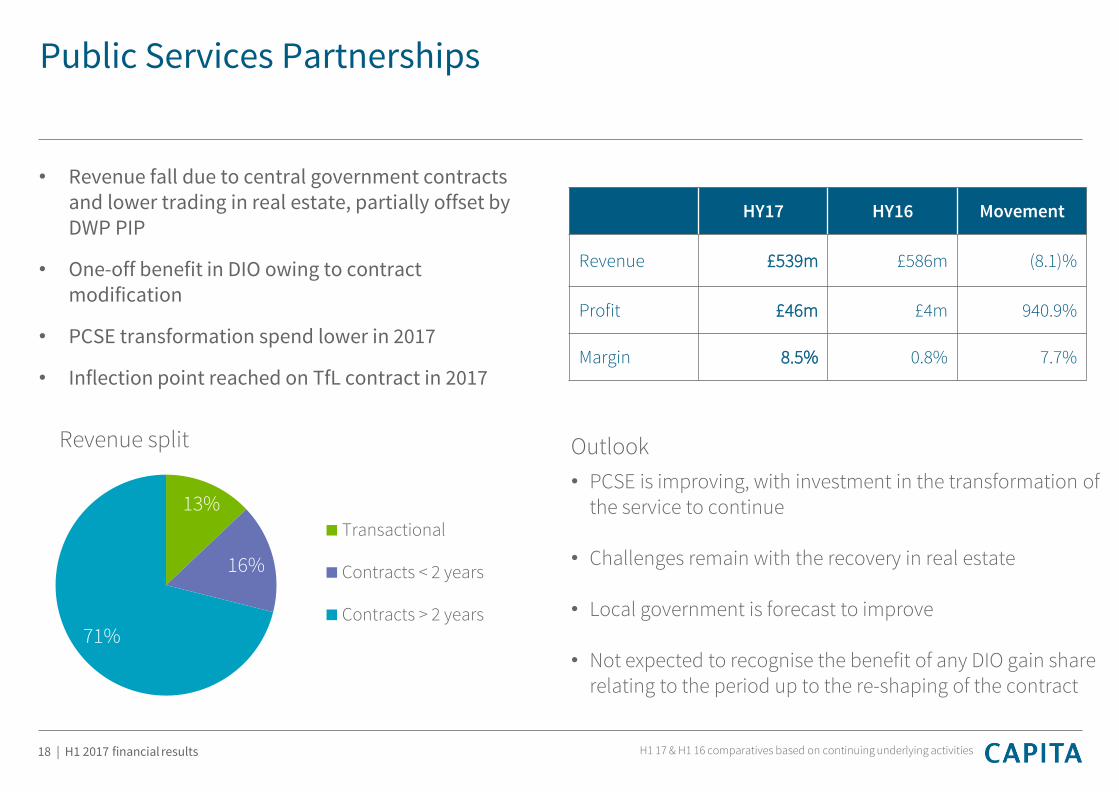
Public Services Partnerships
HY17 HY16 Movement
Revenue £539m £586m (8.1)%
Profit £46m £4m 940.9%
Margin 8.5% 0.8% 7.7%
13%
16%
71%
Revenue split
Transactional
Contracts < 2 years
Contracts > 2 years
18 | H1 2017 financial results
• Revenue fall due to central government contracts and lower trading in real estate, partially offset by DWP PIP
• One-off benefit in DIO owing to contract modification
• PCSE transformation spend lower in 2017
• Inflection point reached on TfL contract in 2017
Outlook
• PCSE is improving, with investment in the transformation of the service to continue
• Challenges remain with the recovery in real estate
• Local government is forecast to improve
• Not expected to recognise the benefit of any DIO gain share relating to the period up to the re-shaping of the contract
H1 17 & H1 16 comparatives based on continuing underlying activities
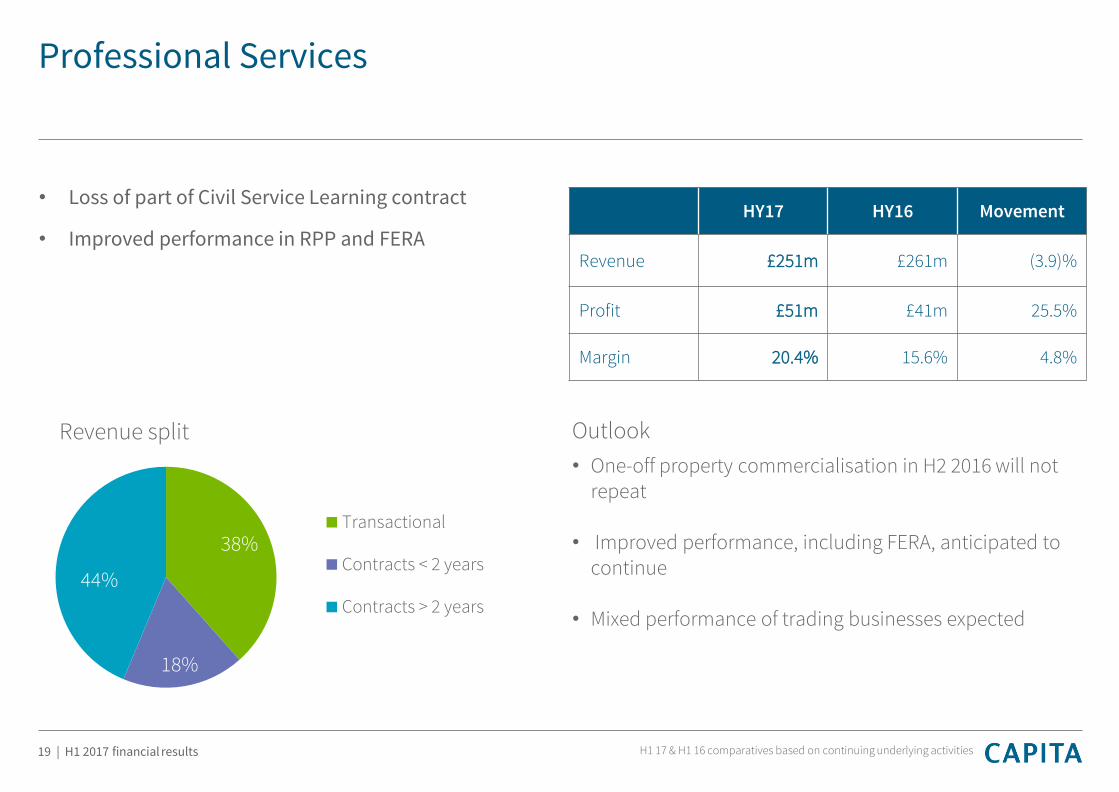
Professional Services
HY17 HY16 Movement
Revenue £251m £261m (3.9)%
Profit £51m £41m 25.5%
Margin 20.4% 15.6% 4.8%
38%
18%
44%
Revenue split
Transactional
Contracts < 2 years
Contracts > 2 years
19 | H1 2017 financial results
• Loss of part of Civil Service Learning contract
• Improved performance in RPP and FERA
Outlook
• One-off property commercialisation in H2 2016 will not repeat
• Improved performance, including FERA, anticipated to continue
• Mixed performance of trading businesses expected
H1 17 & H1 16 comparatives based on continuing underlying activities
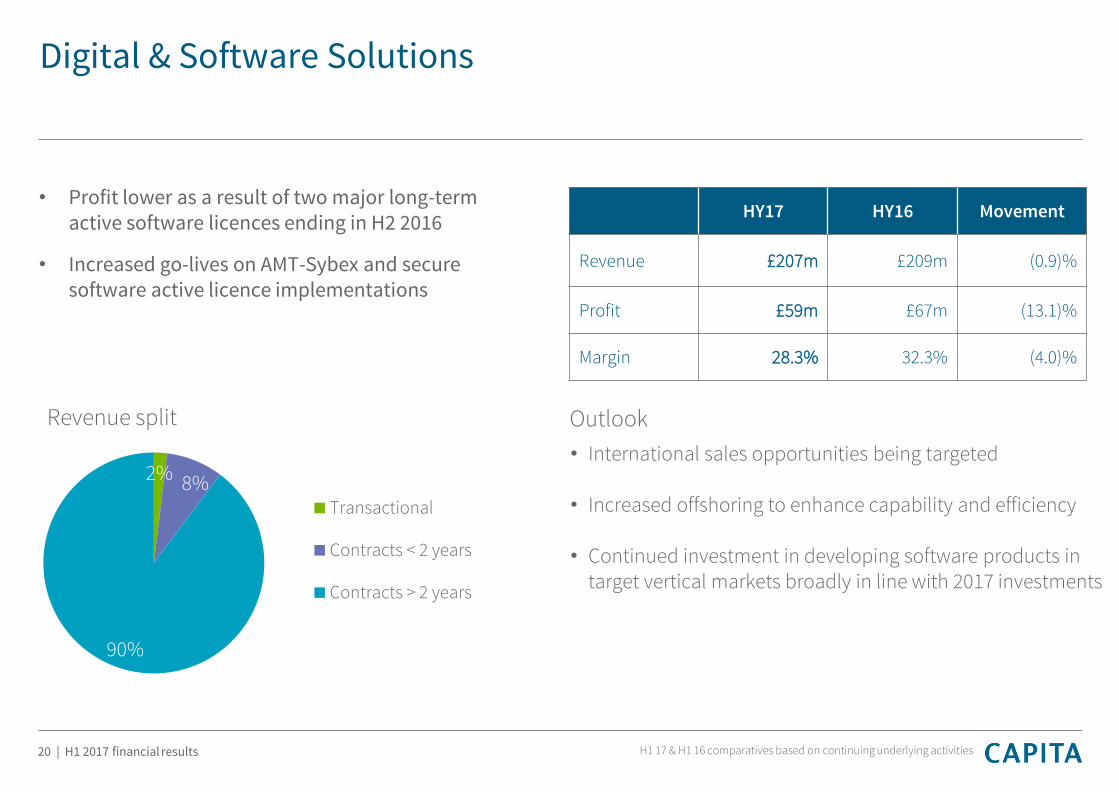
Digital & Software Solutions
HY17 HY16 Movement
Revenue £207m £209m (0.9)%
Profit £59m £67m (13.1)%
Margin 28.3% 32.3% (4.0)%
2% 8%
90%
Revenue split
Transactional
Contracts < 2 years
Contracts > 2 years
20 | H1 2017 financial results
• Profit lower as a result of two major long-term active software licences ending in H2 2016
• Increased go-lives on AMT-Sybex and secure software active licence implementations
Outlook
• International sales opportunities being targeted
• Increased offshoring to enhance capability and efficiency
• Continued investment in developing software products in target vertical markets broadly in line with 2017 investments
H1 17 & H1 16 comparatives based on continuing underlying activities
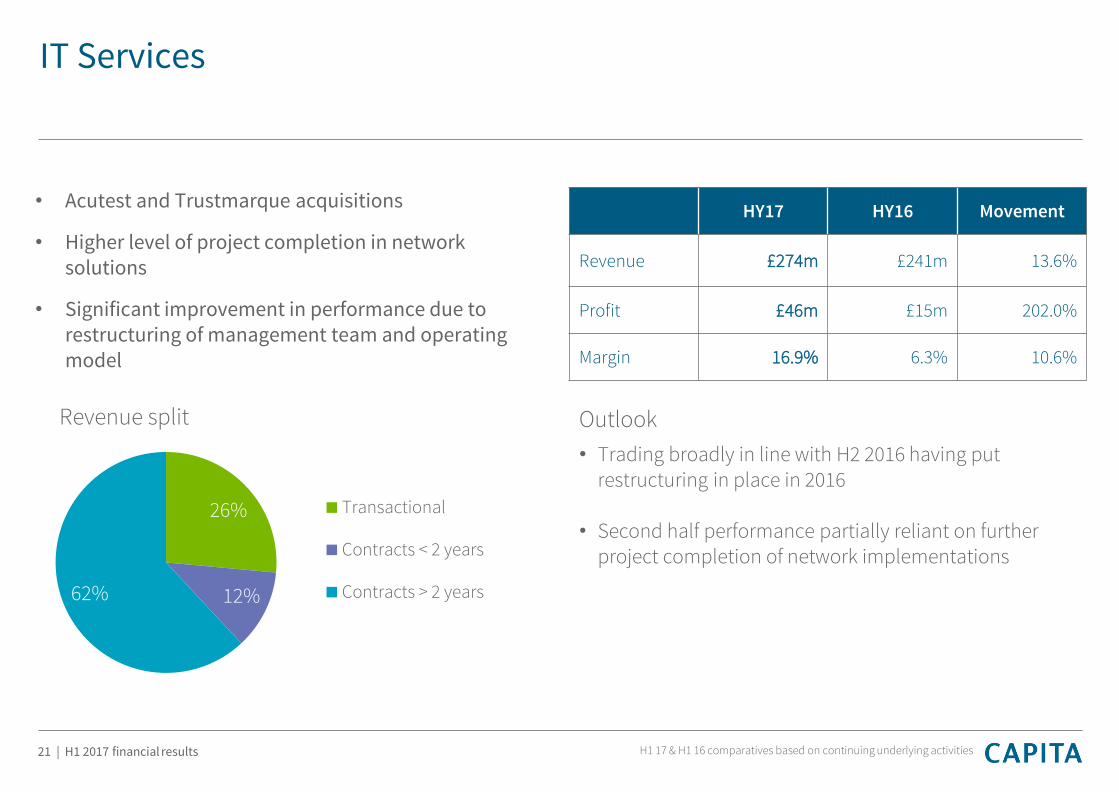
IT Services
HY17 HY16 Movement
Revenue £274m £241m 13.6%
Profit £46m £15m 202.0%
Margin 16.9% 6.3% 10.6%
26%
12%62%
Revenue split
Transactional
Contracts < 2 years
Contracts > 2 years
21 | H1 2017 financial results
• Acutest and Trustmarque acquisitions
• Higher level of project completion in network solutions
• Significant improvement in performance due to restructuring of management team and operating model
Outlook
• Trading broadly in line with H2 2016 having put restructuring in place in 2016
• Second half performance partially reliant on further project completion of network implementations
H1 17 & H1 16 comparatives based on continuing underlying activities
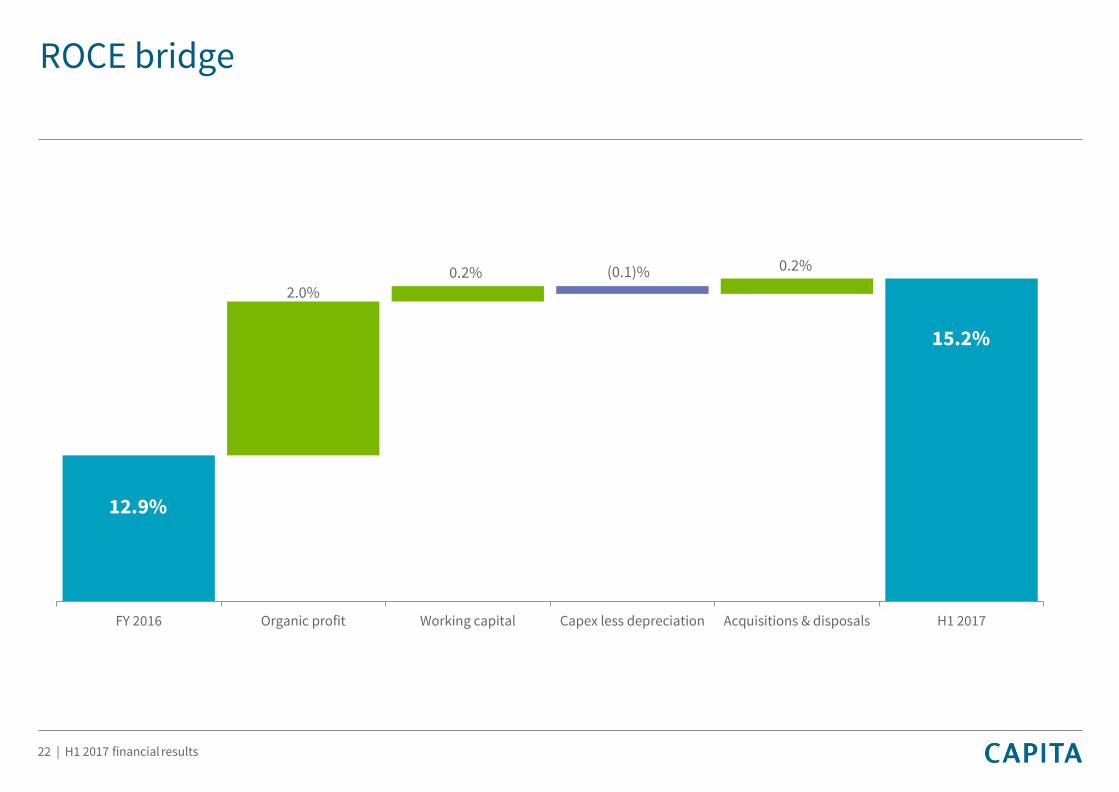
ROCE bridge
22 | H1 2017 financial results
12.9%
15.2%
2.0%
0.2% 0.2%(0.1)%
FY 2016 Organic profit Working capital Capex less depreciation Acquisitions & disposals H1 2017
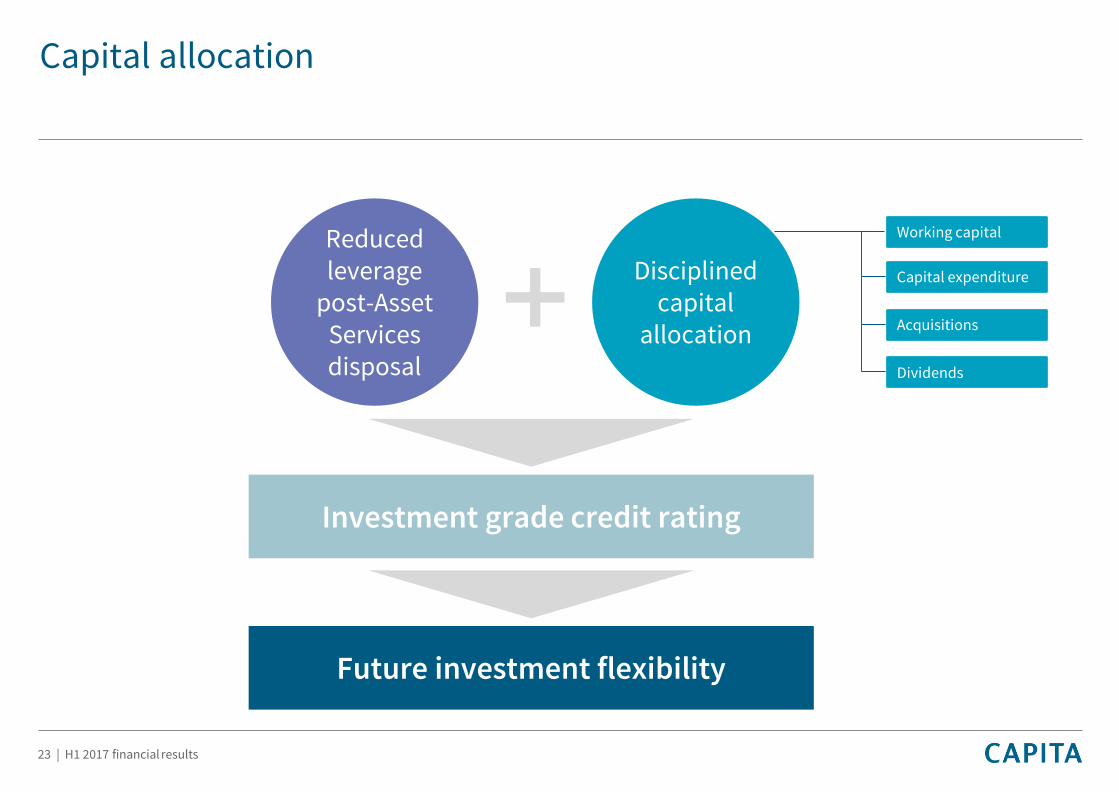
Capital allocation
Investment grade credit rating
Reduced leverage
post-Asset Services disposal
Disciplined capital
allocation
Working capital
Capital expenditure
Acquisitions
Dividends
23 | H1 2017 financial results
Future investment flexibility
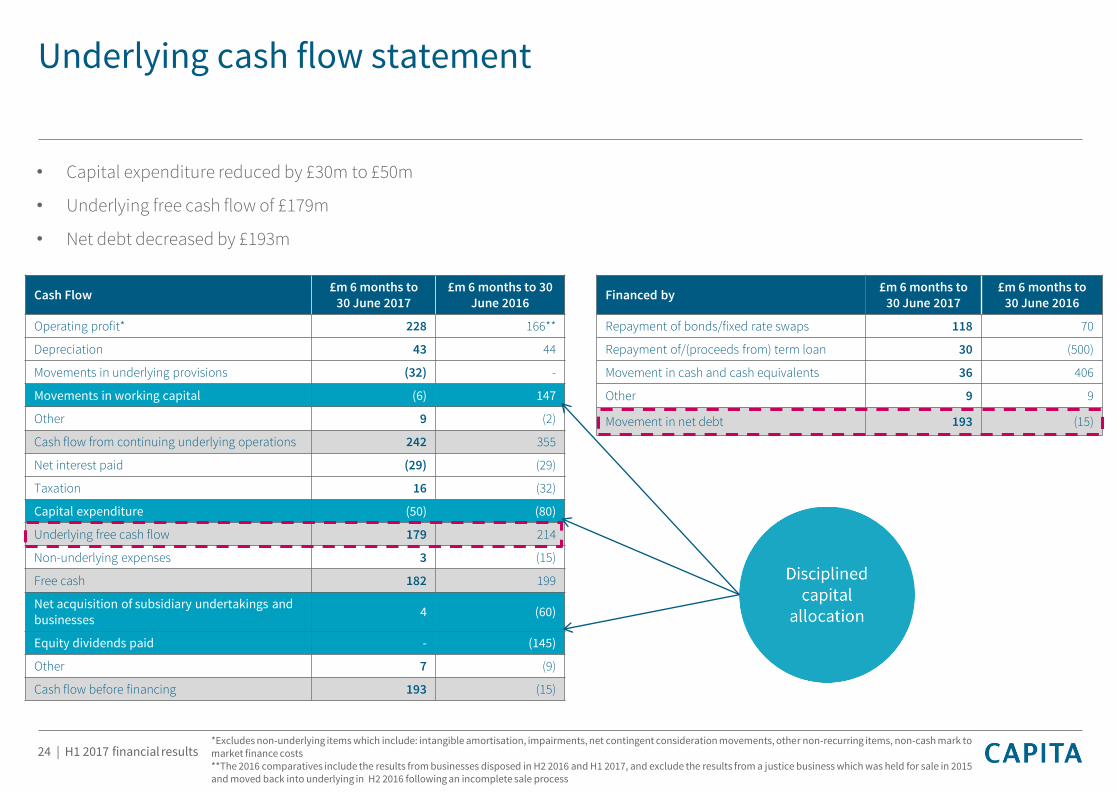
Underlying cash flow statement
Cash Flow£m 6 months to
30 June 2017£m 6 months to 30
June 2016
Operating profit* 228 166**
Depreciation 43 44
Movements in underlying provisions (32) -
Movements in working capital (6) 147
Other 9 (2)
Cash flow from continuing underlying operations 242 355
Net interest paid (29) (29)
Taxation 16 (32)
Capital expenditure (50) (80)
Underlying free cash flow 179 214
Non-underlying expenses 3 (15)
Free cash 182 199
Net acquisition of subsidiary undertakings and businesses
4 (60)
Equity dividends paid - (145)
Other 7 (9)
Cash flow before financing 193 (15)
Financed by£m 6 months to
30 June 2017£m 6 months to
30 June 2016
Repayment of bonds/fixed rate swaps 118 70
Repayment of/(proceeds from) term loan 30 (500)
Movement in cash and cash equivalents 36 406
Other 9 9
Movement in net debt 193 (15)
*Excludes non-underlying items which include: intangible amortisation, impairments, net contingent consideration movements, other non-recurring items, non-cash mark to market finance costs**The 2016 comparatives include the results from businesses disposed in H2 2016 and H1 2017, and exclude the results from a justice business which was held for sale in 2015 and moved back into underlying in H2 2016 following an incomplete sale process
• Capital expenditure reduced by £30m to £50m
• Underlying free cash flow of £179m
• Net debt decreased by £193m
24 | H1 2017 financial results
25 | H1 2017 financial results
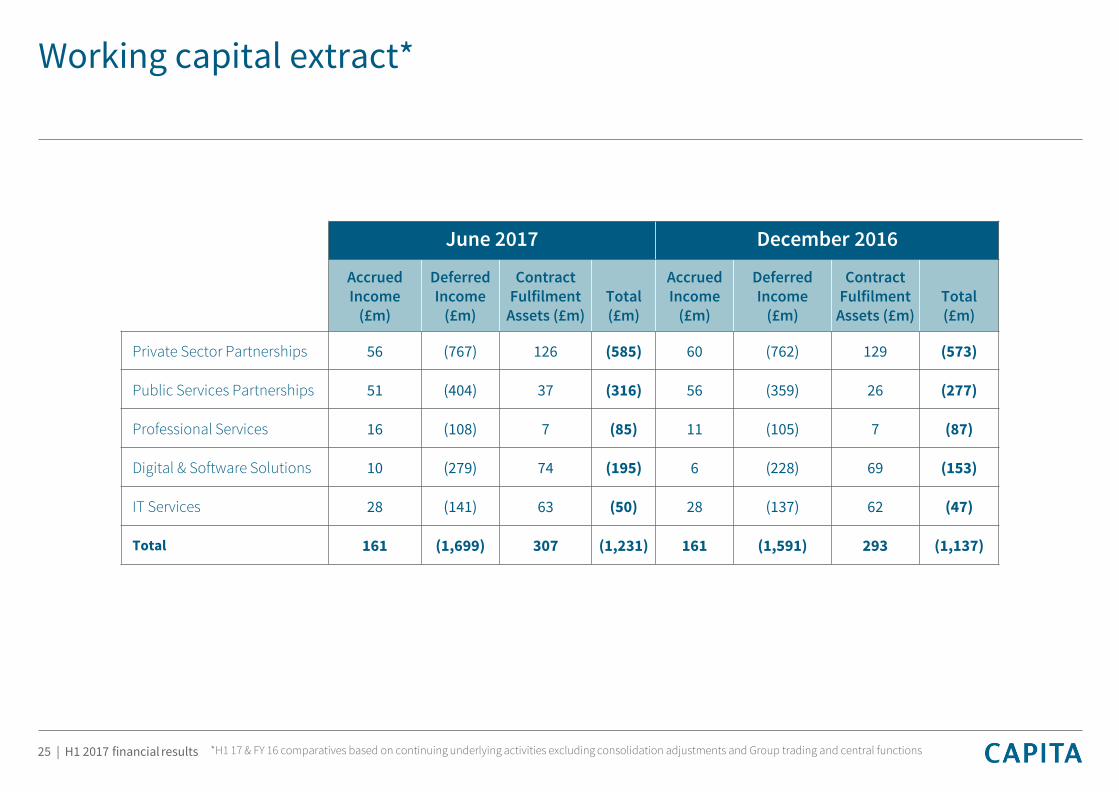
June 2017 December 2016
Accrued Income
(£m)
Deferred Income
(£m)
Contract Fulfilment
Assets (£m)Total(£m)
Accrued Income
(£m)
Deferred Income
(£m)
Contract Fulfilment
Assets (£m)Total(£m)
Private Sector Partnerships 56 (767) 126 (585) 60 (762) 129 (573)
Public Services Partnerships 51 (404) 37 (316) 56 (359) 26 (277)
Professional Services 16 (108) 7 (85) 11 (105) 7 (87)
Digital & Software Solutions 10 (279) 74 (195) 6 (228) 69 (153)
IT Services 28 (141) 63 (50) 28 (137) 62 (47)
Total 161 (1,699) 307 (1,231) 161 (1,591) 293 (1,137)
*H1 17 & FY 16 comparatives based on continuing underlying activities excluding consolidation adjustments and Group trading and central functions
Working capital extract*
Capital expenditure
26 | HY 2017 financial results
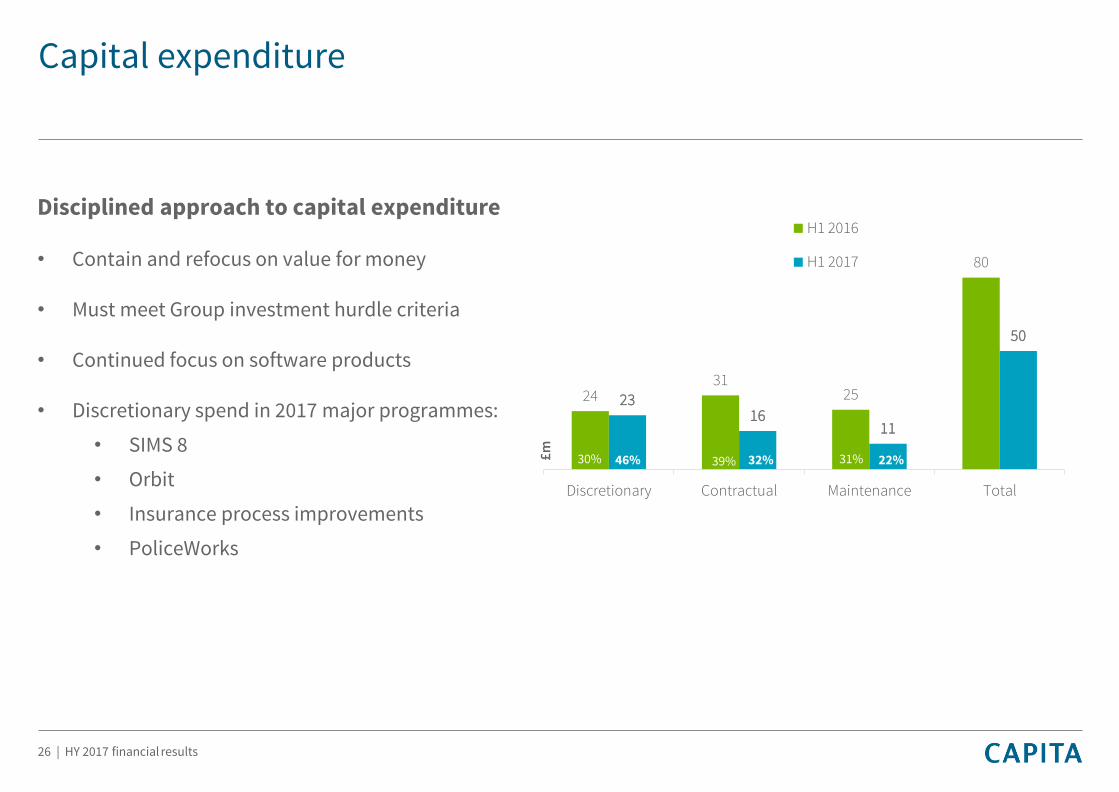
Disciplined approach to capital expenditure
• Contain and refocus on value for money
• Must meet Group investment hurdle criteria
• Continued focus on software products
• Discretionary spend in 2017 major programmes:
• SIMS 8
• Orbit
• Insurance process improvements
• PoliceWorks
2431
25
80
2316
11
50
Discretionary Contractual Maintenance Total
H1 2016
H1 2017
£m
30% 31%39%46% 32% 22%
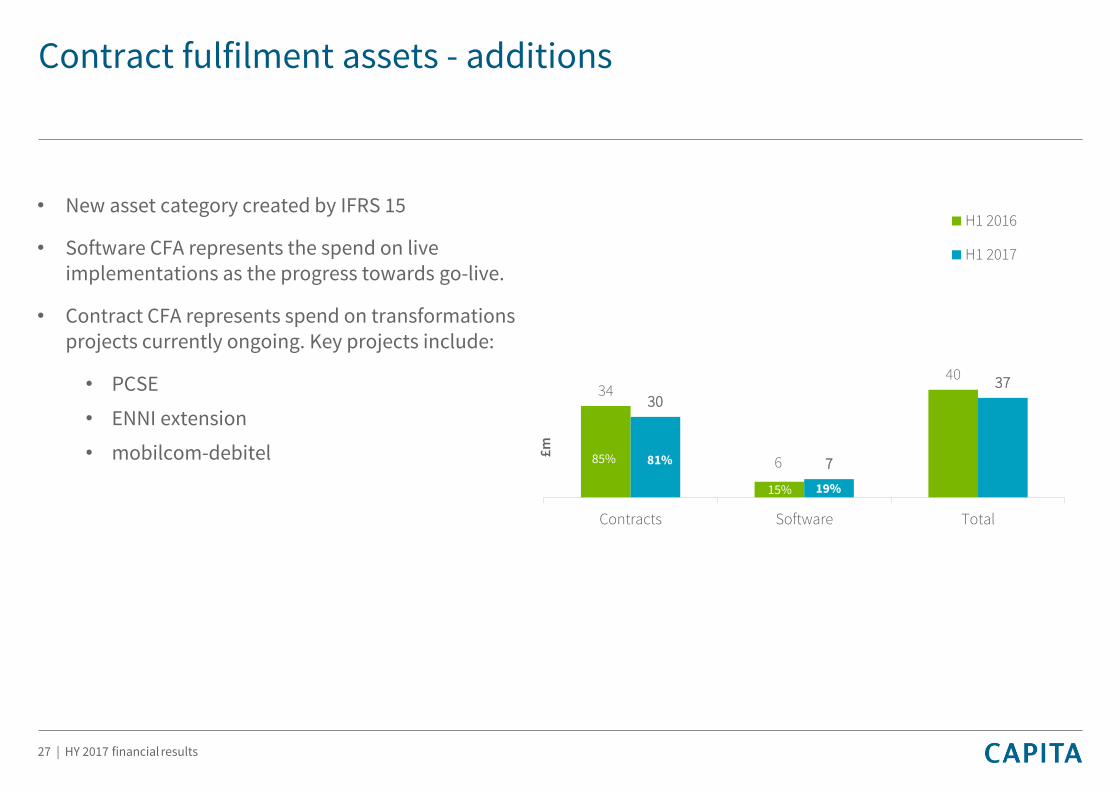
Contract fulfilment assets - additions
27 | HY 2017 financial results
34
6
40
30
7
37
Contracts Software Total
H1 2016
H1 2017
£m
19%
85% 81%
• New asset category created by IFRS 15
• Software CFA represents the spend on live implementations as the progress towards go-live.
• Contract CFA represents spend on transformations projects currently ongoing. Key projects include:
• PCSE
• ENNI extension
• mobilcom-debitel
15% 19%
Disposals and acquisitions
• Capita Asset Services disposed for £888m gross of £72m transaction expenses, expected to complete in Q4
• Specialist recruitment disposal completed
• Two small bolt-on acquisitions in software testing and travel
28 | HY 2017 financial results
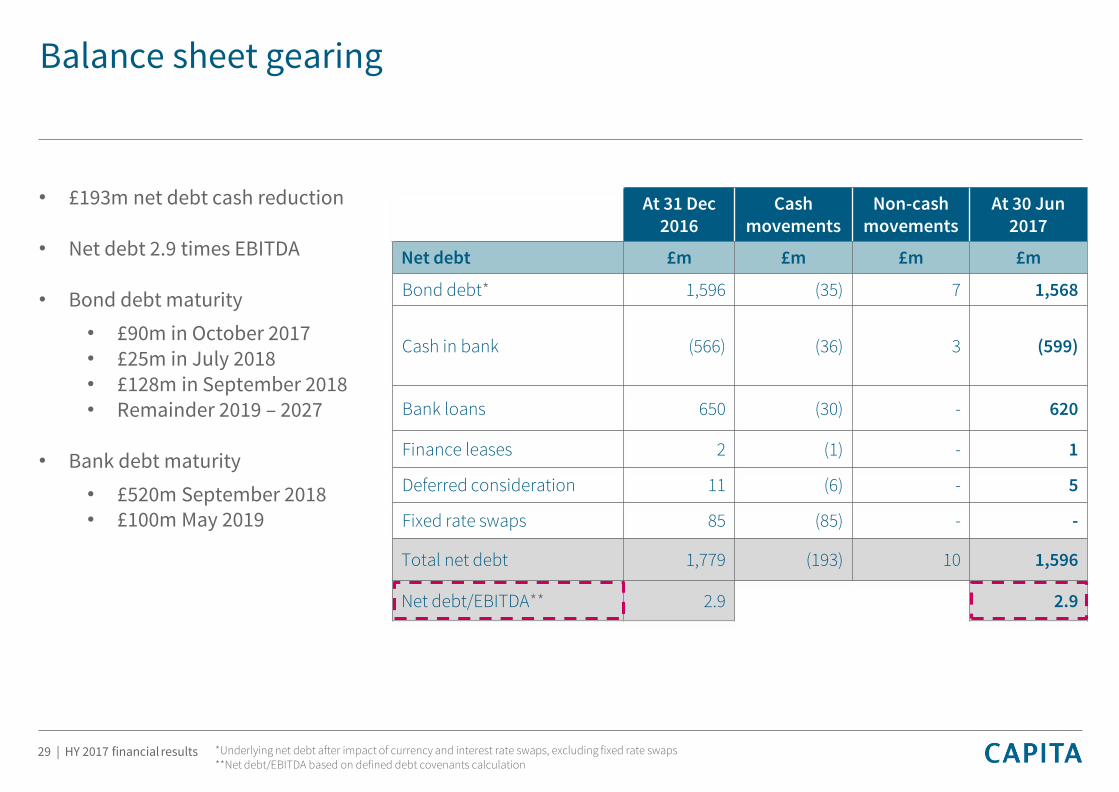
Balance sheet gearing
• £193m net debt cash reduction
• Net debt 2.9 times EBITDA
• Bond debt maturity
• £90m in October 2017• £25m in July 2018• £128m in September 2018• Remainder 2019 – 2027
• Bank debt maturity
• £520m September 2018• £100m May 2019
29 | HY 2017 financial results
At 31 Dec 2016
Cash movements
Non-cash movements
At 30 Jun 2017
Net debt £m £m £m £m
Bond debt* 1,596 (35) 7 1,568
Cash in bank (566) (36) 3 (599)
Bank loans 650 (30) - 620
Finance leases 2 (1) - 1
Deferred consideration 11 (6) - 5
Fixed rate swaps 85 (85) - -
Total net debt 1,779 (193) 10 1,596
Net debt/EBITDA** 2.9 2.9
*Underlying net debt after impact of currency and interest rate swaps, excluding fixed rate swaps**Net debt/EBITDA based on defined debt covenants calculation

Interest and debt profile
• Net debt benefitting from free cash flow
• Higher coupon fixed rate interest rate swaps terminated in H1 2017 leading to lower H1 2017 interest cost
• 2017 interest cost expectation (including £9m pension cost) is £65m-£70m, dependent on timing of receipt of disposal proceeds
• Undrawn £600m revolving credit facility maturing 2020/21
• June 2017 liquidity headroom of £1.2bn, composed of £598.6m cash and £600m revolving credit facility
30 | H1 2017 financial results
2015 2016 H1 2017
Interest rate % 2.9 3.3 2.7
US$ PPN 1,312 1,340 1,300
€ PPN 217 257 268
Term debt 300 650 620
Other (incl. cash) 10 (468) (592)
Total net debt 1,839 1,779 1,596
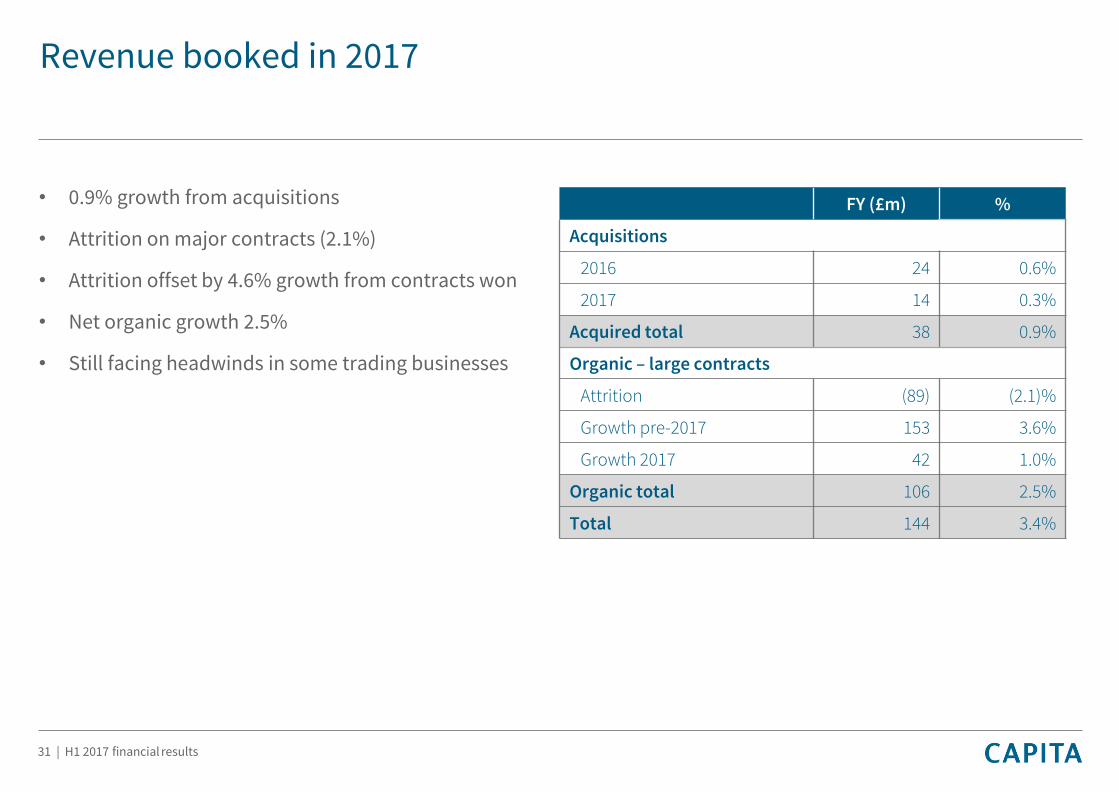
Revenue booked in 2017
• 0.9% growth from acquisitions
• Attrition on major contracts (2.1%)
• Attrition offset by 4.6% growth from contracts won
• Net organic growth 2.5%
• Still facing headwinds in some trading businesses
31 | H1 2017 financial results
FY (£m) %
Acquisitions
2016 24 0.6%
2017 14 0.3%
Acquired total 38 0.9%
Organic – large contracts
Attrition (89) (2.1)%
Growth pre-2017 153 3.6%
Growth 2017 42 1.0%
Organic total 106 2.5%
Total 144 3.4%
IFRS 16 - Leases
• Adoption from 1 January 2019
• Ongoing detailed review of lease contracts
• Expect significant lease liabilities and right of use lease assets to be recognised on the balance sheet
• Expect the profile of income and recognition in relation to these leases to change
• There is no impact on cash flow (except for presentation purposes)
• Reasonable estimate of the impact of IFRS 16 to be provided once detailed reviews completed
32 | H1 2017 financial results
Pension liability
• Scheme liability of £1.5bn
• Deficit moved from £345m at December 2016 to £381m owing to discount rate moving from 2.8% to 2.6%
• Half year income statement charge increase of £6m, with full year 2017 expected to increase by £12m
• The latest valuation commenced in April 2017, with expected increases in cash contributions from June 2018
• Completed consultation on closure of most of remaining deferred benefit scheme to future accrual
• A one-off £17m contribution agreed as part of the Capita Asset Services disposal
33 | H1 2017 financial results
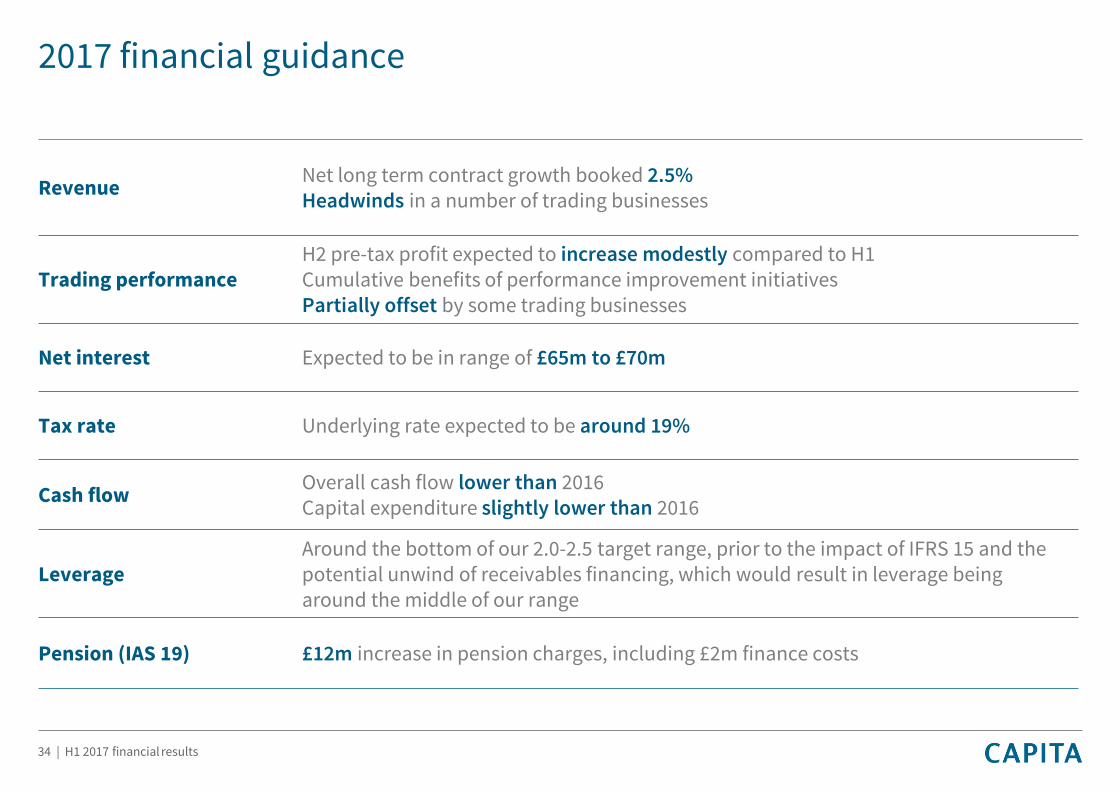
2017 financial guidance
34 | H1 2017 financial results
RevenueNet long term contract growth booked 2.5% Headwinds in a number of trading businesses
Trading performanceH2 pre-tax profit expected to increase modestly compared to H1Cumulative benefits of performance improvement initiativesPartially offset by some trading businesses
Net interest Expected to be in range of £65m to £70m
Tax rate Underlying rate expected to be around 19%
Cash flowOverall cash flow lower than 2016Capital expenditure slightly lower than 2016
LeverageAround the bottom of our 2.0-2.5 target range, prior to the impact of IFRS 15 and the potential unwind of receivables financing, which would result in leverage being around the middle of our range
Pension (IAS 19) £12m increase in pension charges, including £2m finance costs

Business Development
Chris SellersGroup Business Development Director
35 | H1 2017 financialresults
Agenda
36 | H1 2017 financial results
1 Our structure to match current buying behaviour
2 Buying behaviour: major deals and campaigns
3 Campaign progress: local government
4 Customer management: market and approach
5 Overview of our pipeline
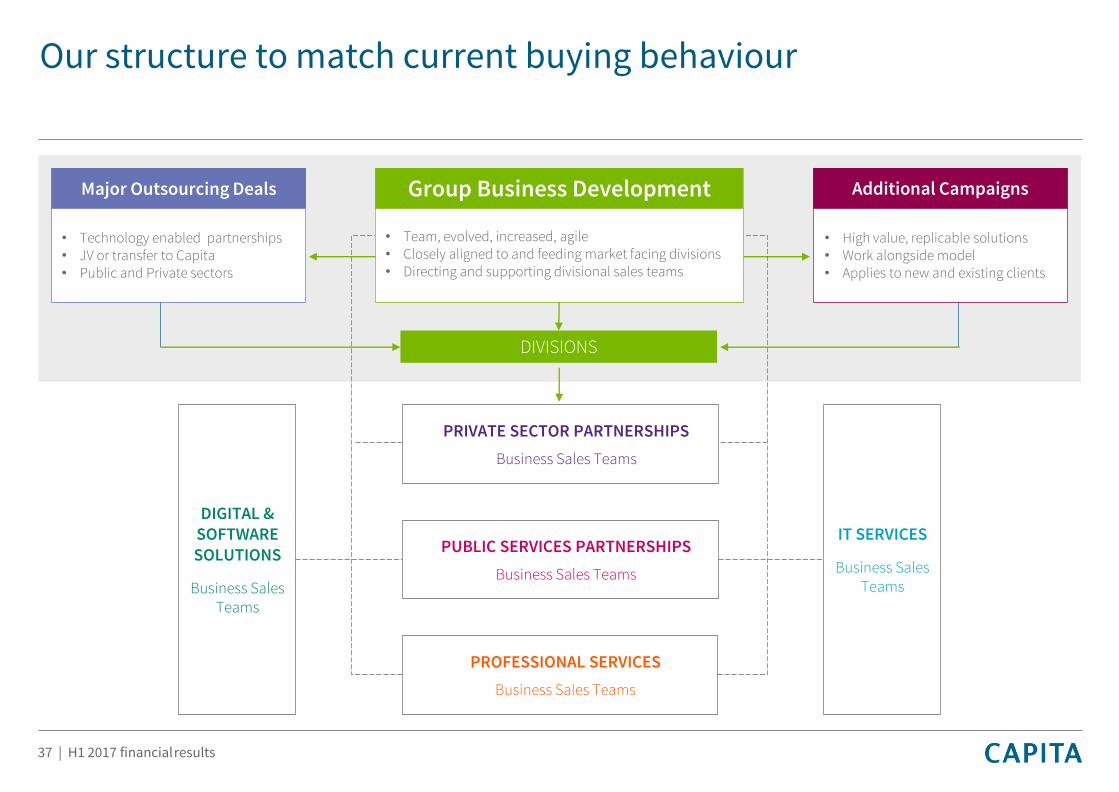
Our structure to match current buying behaviour
Group Business Development
• Team, evolved, increased, agile• Closely aligned to and feeding market facing divisions• Directing and supporting divisional sales teams
DIVISIONS
Additional Campaigns
• High value, replicable solutions• Work alongside model• Applies to new and existing clients
DIGITAL & SOFTWARE SOLUTIONS
Business Sales Teams
IT SERVICES
Business Sales Teams
PRIVATE SECTOR PARTNERSHIPS
Business Sales Teams
PUBLIC SERVICES PARTNERSHIPS
Business Sales Teams
PROFESSIONAL SERVICES
Business Sales Teams
Major Outsourcing Deals
• Technology enabled partnerships• JV or transfer to Capita • Public and Private sectors
37 | H1 2017 financialresults
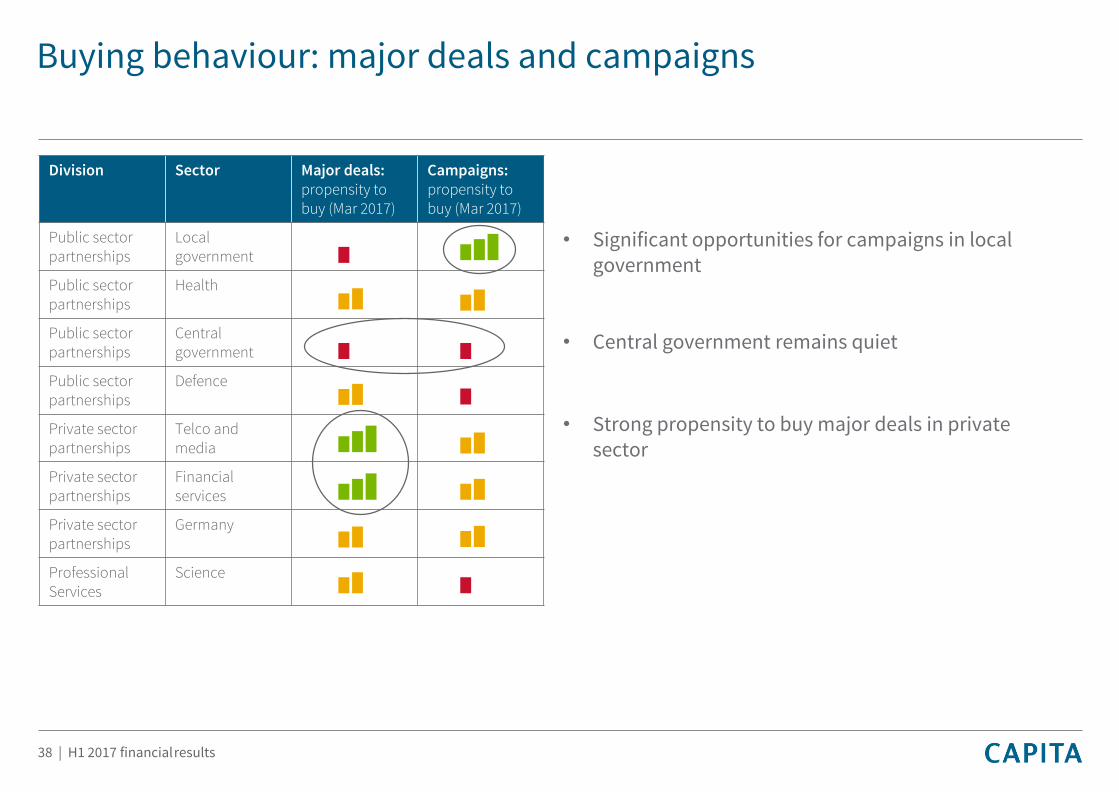
Buying behaviour: major deals and campaigns
Division Sector Major deals:propensity to buy (Mar 2017)
Campaigns:propensity to buy (Mar 2017)
Public sector partnerships
Local government
Public sector partnerships
Health
Public sector partnerships
Central government
Public sector partnerships
Defence
Private sector partnerships
Telco and media
Private sector partnerships
Financial services
Private sector partnerships
Germany
Professional Services
Science
• Strong propensity to buy major deals in private sector
• Central government remains quiet
• Significant opportunities for campaigns in local government
38 | H1 2017 financialresults
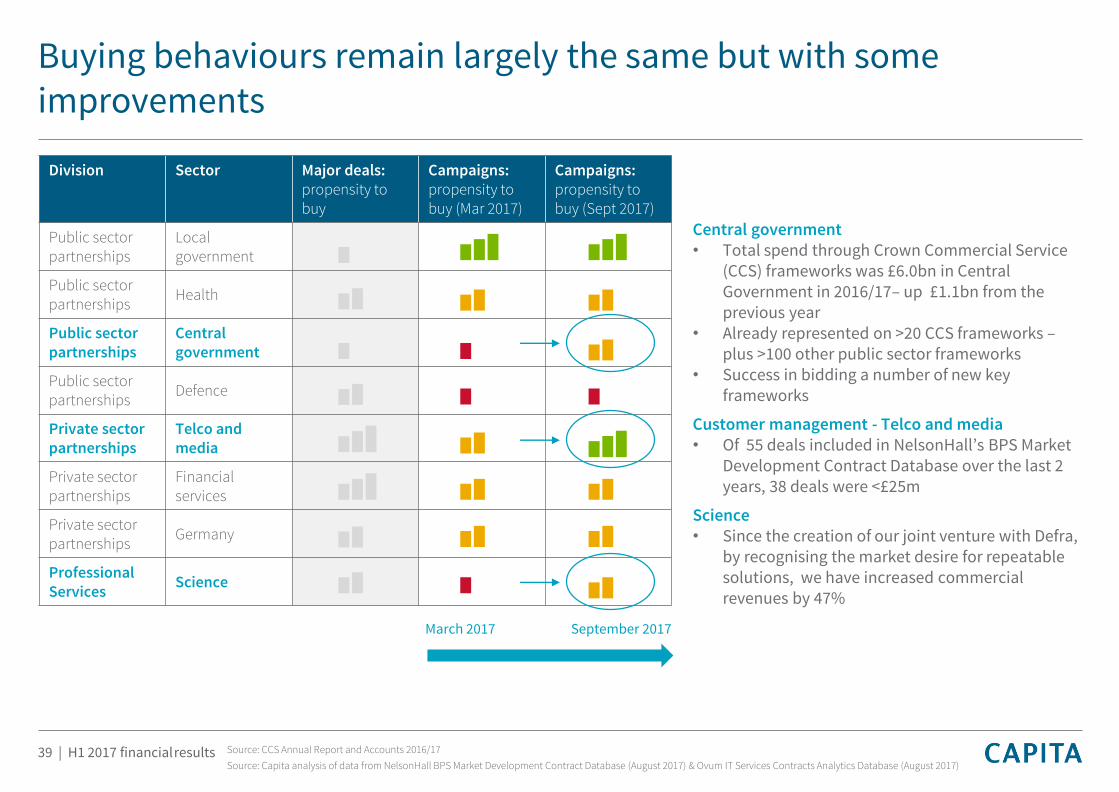
Buying behaviours remain largely the same but with some improvements
Division Sector Major deals:propensity to buy
Campaigns:propensity to buy (Mar 2017)
Campaigns:propensity to buy (Sept 2017)
Public sector partnerships
Local government
Public sector partnerships
Health
Public sector partnerships
Central government
Public sector partnerships
Defence
Private sector partnerships
Telco and media
Private sector partnerships
Financial services
Private sector partnerships
Germany
Professional Services
Science
Central government• Total spend through Crown Commercial Service
(CCS) frameworks was £6.0bn in Central Government in 2016/17– up £1.1bn from the previous year
• Already represented on >20 CCS frameworks –plus >100 other public sector frameworks
• Success in bidding a number of new key frameworks
Customer management - Telco and media• Of 55 deals included in NelsonHall’s BPS Market
Development Contract Database over the last 2 years, 38 deals were <£25m
Science• Since the creation of our joint venture with Defra,
by recognising the market desire for repeatable solutions, we have increased commercial revenues by 47%
Source: CCS Annual Report and Accounts 2016/17
Source: Capita analysis of data from NelsonHall BPS Market Development Contract Database (August 2017) & Ovum IT Services Contracts Analytics Database (August 2017)
March 2017 September 2017
39 | H1 2017 financialresults
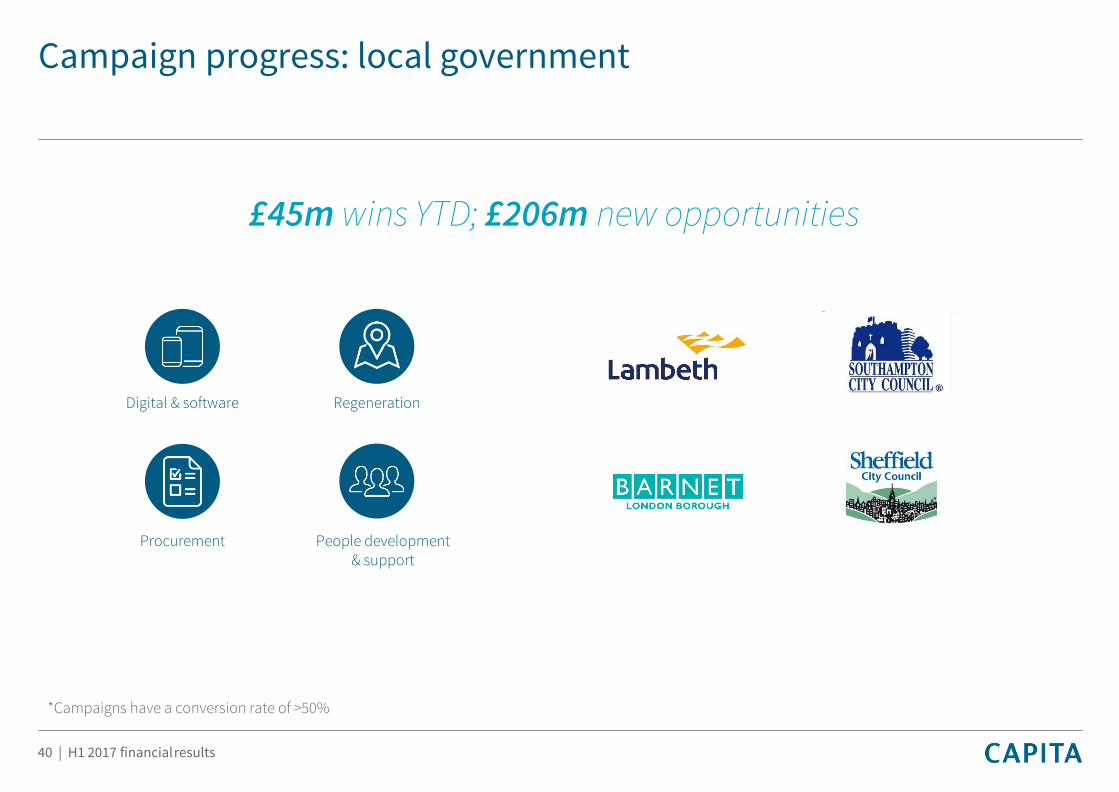
Campaign progress: local government
£45m wins YTD; £206m new opportunities
*Campaigns have a conversion rate of >50%
Digital & software Regeneration
People development & support
Procurement
40 | H1 2017 financialresults
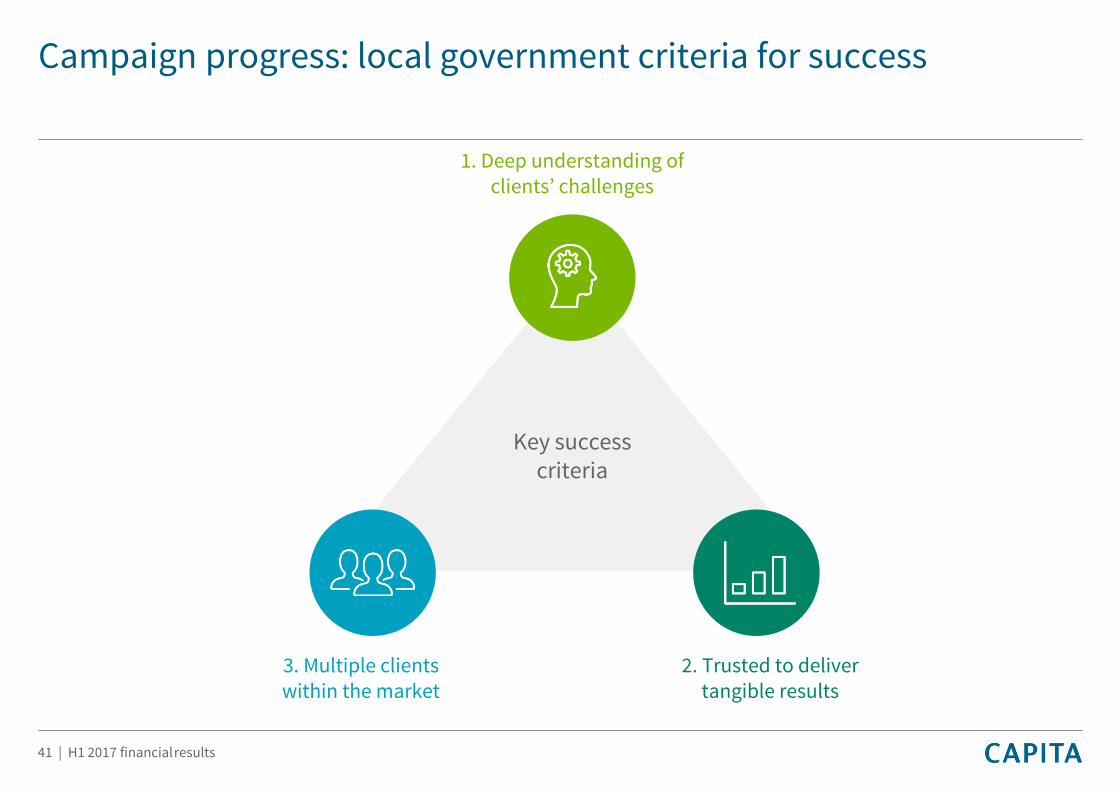
Campaign progress: local government criteria for success
3. Multiple clients within the market
1. Deep understanding of clients’ challenges
2. Trusted to deliver tangible results
Key success criteria
41 | H1 2017 financialresults
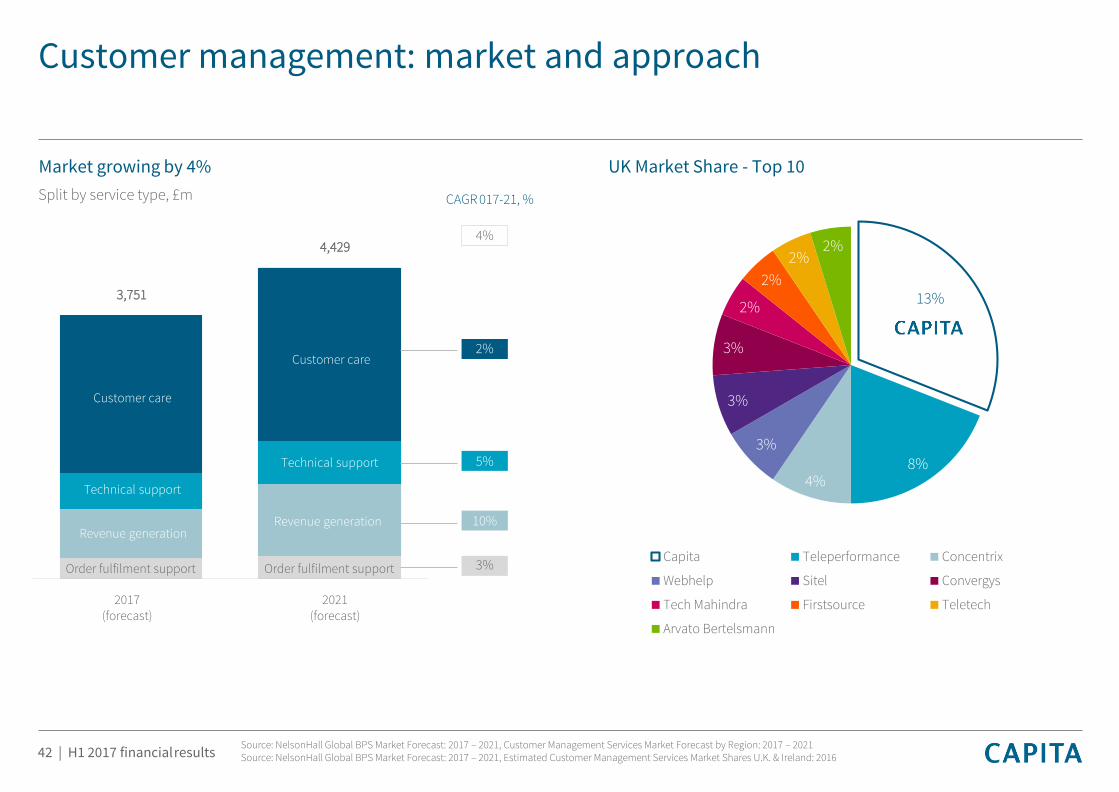
Customer management: market and approach
Market growing by 4%
Source: NelsonHall Global BPS Market Forecast: 2017 – 2021, Customer Management Services Market Forecast by Region: 2017 – 2021Source: NelsonHall Global BPS Market Forecast: 2017 – 2021, Estimated Customer Management Services Market Shares U.K. & Ireland: 2016
2017 (forecast)
2021(forecast)
Split by service type, £m CAGR 017-21, %
3,751
4,4294%
2%
5%
10%
3%Order fulfilment support
Technical support
Customer care
13%
8%4%
3%
3%
3%
2%
2%
2%2%
Capita Teleperformance Concentrix
Webhelp Sitel Convergys
Tech Mahindra Firstsource Teletech
Arvato Bertelsmann
UK Market Share - Top 10
Customer care
Technical support
Revenue generationRevenue generation
Order fulfilment support
42 | H1 2017 financialresults
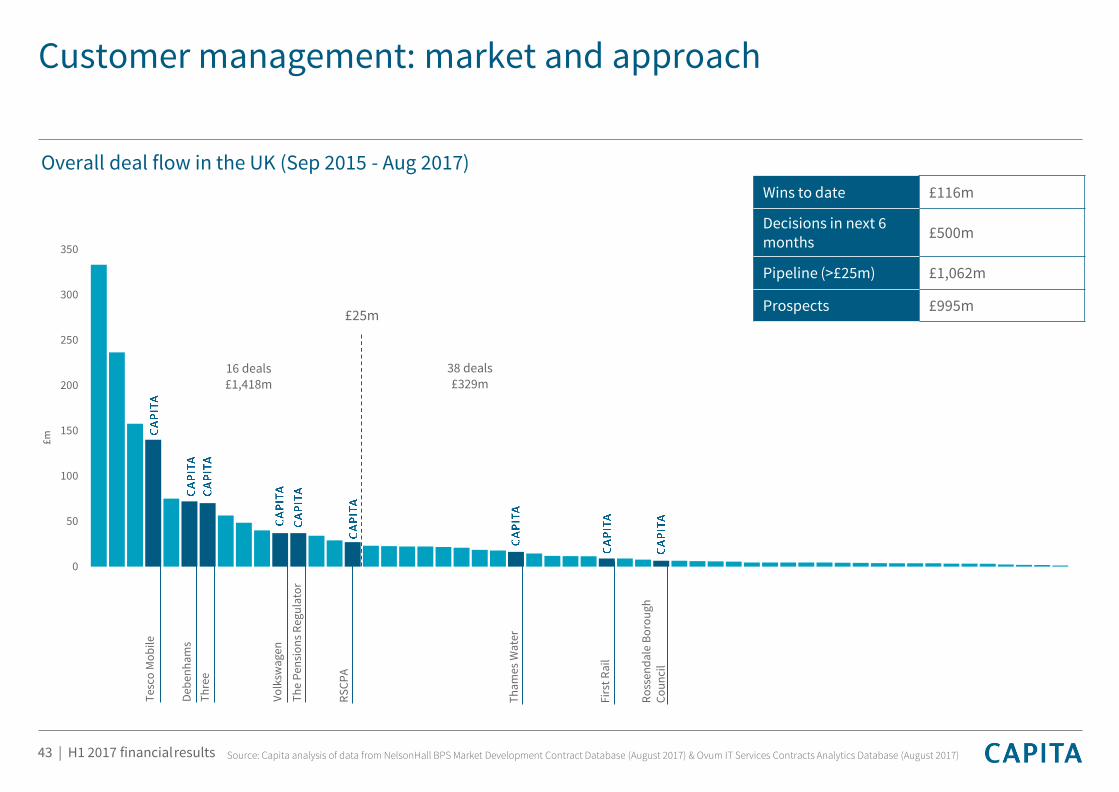
Customer management: market and approach
0
50
100
150
200
250
300
350
£m
£25m
16 deals£1,418m
38 deals£329m
Overall deal flow in the UK (Sep 2015 - Aug 2017)
Source: Capita analysis of data from NelsonHall BPS Market Development Contract Database (August 2017) & Ovum IT Services Contracts Analytics Database (August 2017)
Tes
co M
ob
ile
Deb
enh
am
s
Th
ree
Vo
lksw
ag
en
Th
e P
ensi
on
s R
egu
lato
r
RS
CP
A
Firs
t R
ail
Th
am
es W
ate
r
Ro
ssen
da
leB
oro
ug
h
Co
un
cil
Wins to date £116m
Decisions in next 6 months
£500m
Pipeline (>£25m) £1,062m
Prospects £995m
43 | H1 2017 financialresults
Using technology to deliver customer excellence
44 | H1 2017 financialresults
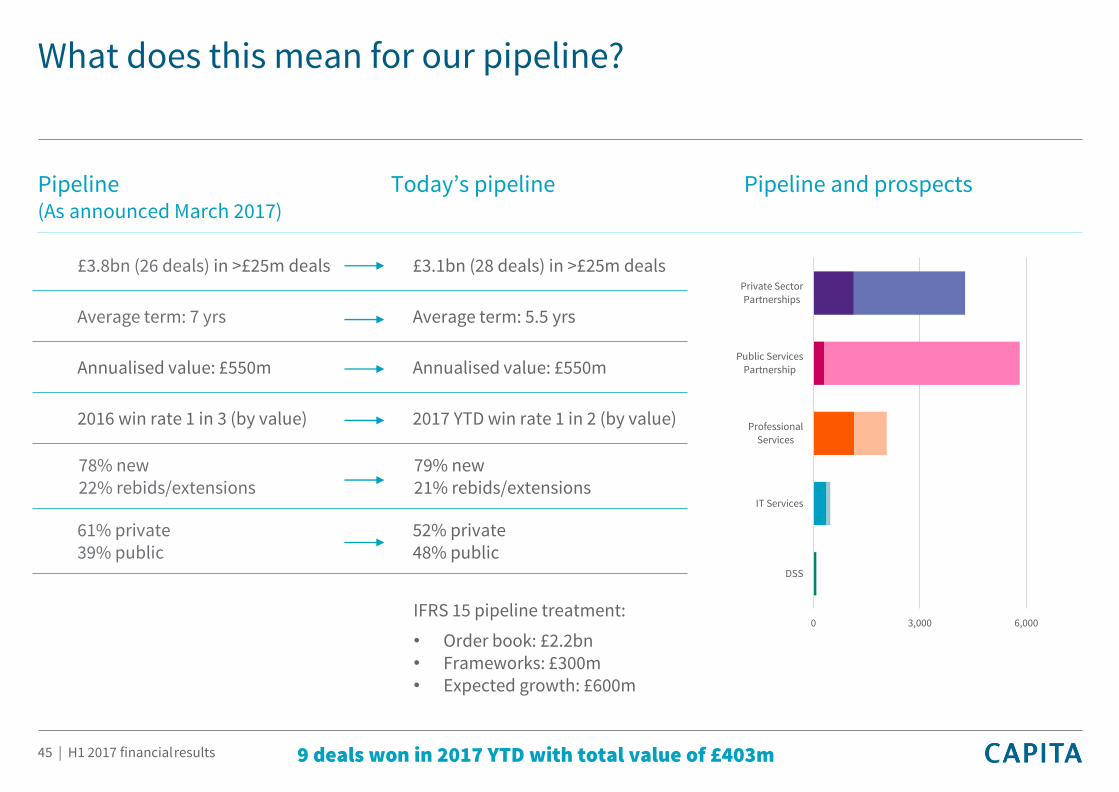
£3.8bn (26 deals) in >£25m deals £3.1bn (28 deals) in >£25m deals
Average term: 7 yrs Average term: 5.5 yrs
Annualised value: £550m Annualised value: £550m
2016 win rate 1 in 3 (by value) 2017 YTD win rate 1 in 2 (by value)
78% new 22% rebids/extensions
79% new 21% rebids/extensions
61% private 39% public
52% private 48% public
What does this mean for our pipeline?
Pipeline (As announced March 2017)
Today’s pipeline Pipeline and prospects
0 3,000 6,000
DSS
IT Services
ProfessionalServices
Public Services
Partnership
Private SectorPartnerships
9 deals won in 2017 YTD with total value of £403m
IFRS 15 pipeline treatment:
• Order book: £2.2bn• Frameworks: £300m• Expected growth: £600m
45 | H1 2017 financialresults
Driving Capita’s future growth
Adapting to buying behaviours of our markets
Investing in markets where we are strong
Driving additional growth through campaigns
Continuing to build on major deal success
Focusing on win rate
70,000 people contributing to the development and growth of Capita46 | H1 2017 financialresults
Summary and outlook
47 | H1 2017 financialresults
Nick GreatorexInterim CEO and Group Finance Director
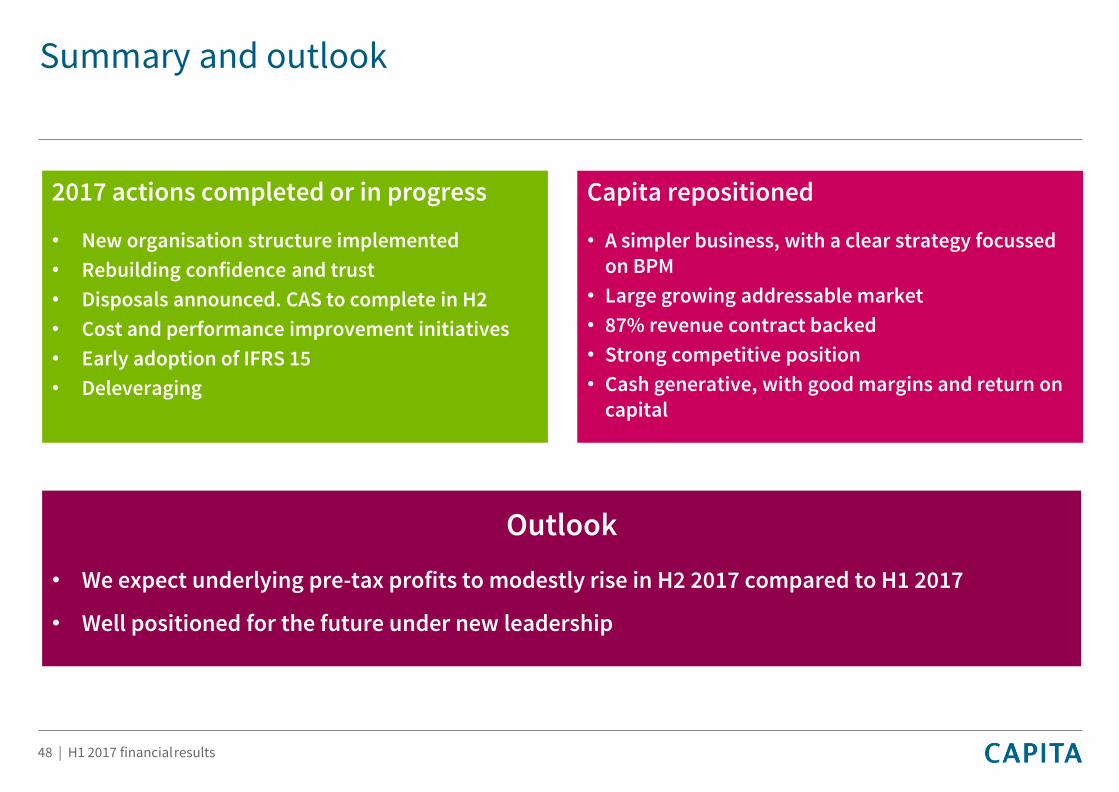
Summary and outlook
2017 actions completed or in progress
• New organisation structure implemented
• Rebuilding confidence and trust
• Disposals announced. CAS to complete in H2
• Cost and performance improvement initiatives
• Early adoption of IFRS 15
• Deleveraging
Capita repositioned
• A simpler business, with a clear strategy focussed on BPM
• Large growing addressable market
• 87% revenue contract backed
• Strong competitive position
• Cash generative, with good margins and return on capital
Outlook
• We expect underlying pre-tax profits to modestly rise in H2 2017 compared to H1 2017
• Well positioned for the future under new leadership
48 | H1 2017 financialresults