Embed Size (px)
Citation preview

Full year results presentation 27 February 2014
Results for the year ended31 December 2013Delivering sustainable growth

Agenda
Delivering sustainable growth
Introduction Paul PindarChief Executive
Financial results Gordon HurstGroup Finance Director
Positioning Capita for continued growth
Andy ParkerDeputy Chief Executive
Major sales update Maggi Bell Group Business Development Director
Outlook Andy Parker
2
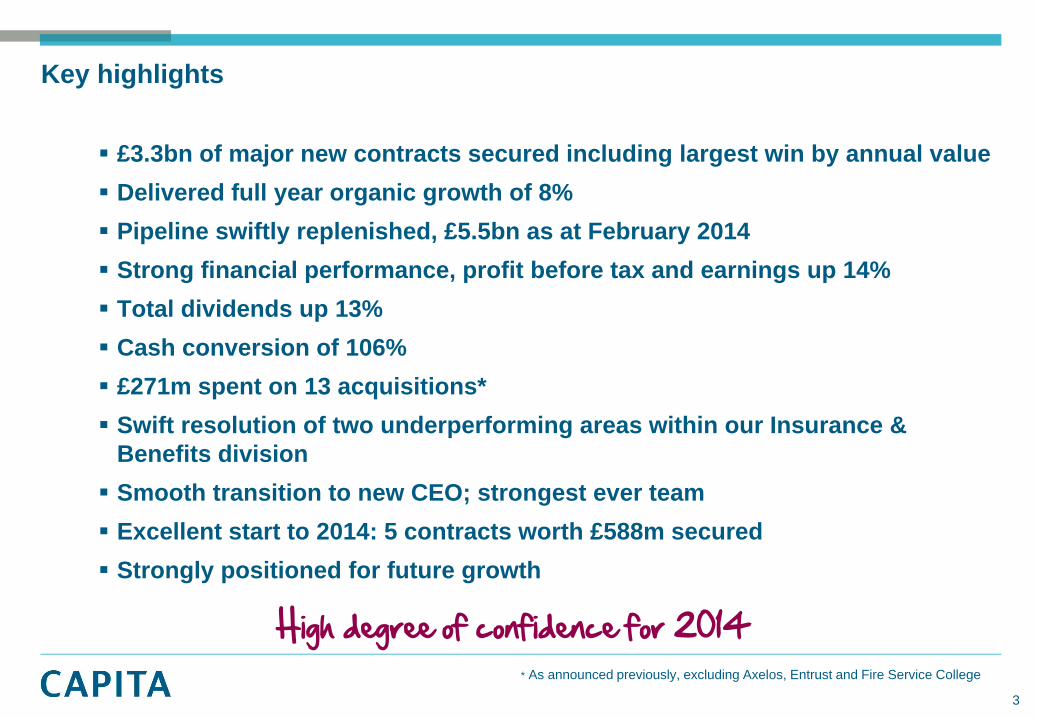
£3.3bn of major new contracts secured including largest win by annual value Delivered full year organic growth of 8%Pipeline swiftly replenished, £5.5bn as at February 2014Strong financial performance, profit before tax and earnings up 14% Total dividends up 13% Cash conversion of 106% £271m spent on 13 acquisitions* Swift resolution of two underperforming areas within our Insurance & Benefits divisionSmooth transition to new CEO; strongest ever team Excellent start to 2014: 5 contracts worth £588m secured Strongly positioned for future growth
High degree of confidence for 2014
Key highlights
* As announced previously, excluding Axelos, Entrust and Fire Service College
3
Financial results
Gordon HurstGroup Finance Director

Annual growth 15%5 year compound growth 10%
Financial results – underlying revenue
3,851*
3,352
2,930
2,744
2,687
2,441
0 1,000 2,000 3,000 4,000 5,000
2013
2012
2011
2010
2009
2008
£m
½ yearFull year
* Revenue excluding Insurance Distribution and SIP businesses of £45m
Continued revenue growth
5

Private sector 52% (half year: 52%)Public sector 48% (half year: 48%)
Financial results – underlying revenue by market
2013 year end (half year)
Other private sector 21% (19%)
Local government 16% (17%)
Life and pensions 13% (15%)
Education 10% (8%)
Central government 10% (11%)
Retail, telecoms, utilities 8% (7%)
Financial services 7% (8%)
Health 5% (5%)
Justice and emergency services 4% (4%)
Insurance 3% (3%)
Defence 3% (3%)
Diverse market spread
6

£m 2013 £m 2012 Growth
Underlying revenue 3,851 3,352 14.9%
Insurance Distribution and SIP business 45 - 1.3%
Total revenue including Insurance Distribution and SIP business 3,896 3,352 16.2%
2012 acquisitions (117) - (3.4)%
2013 acquisitions (167) - (5.0)%
Total organic revenue growth excluding acquisitions 3,612 3,352 7.8%
Insurance Distribution and SIP business (45) (69)
Organic revenue growth on continuing business 3,567 3,283 8.7%
Strong organic growth
Financial results – underlying revenue growth
7
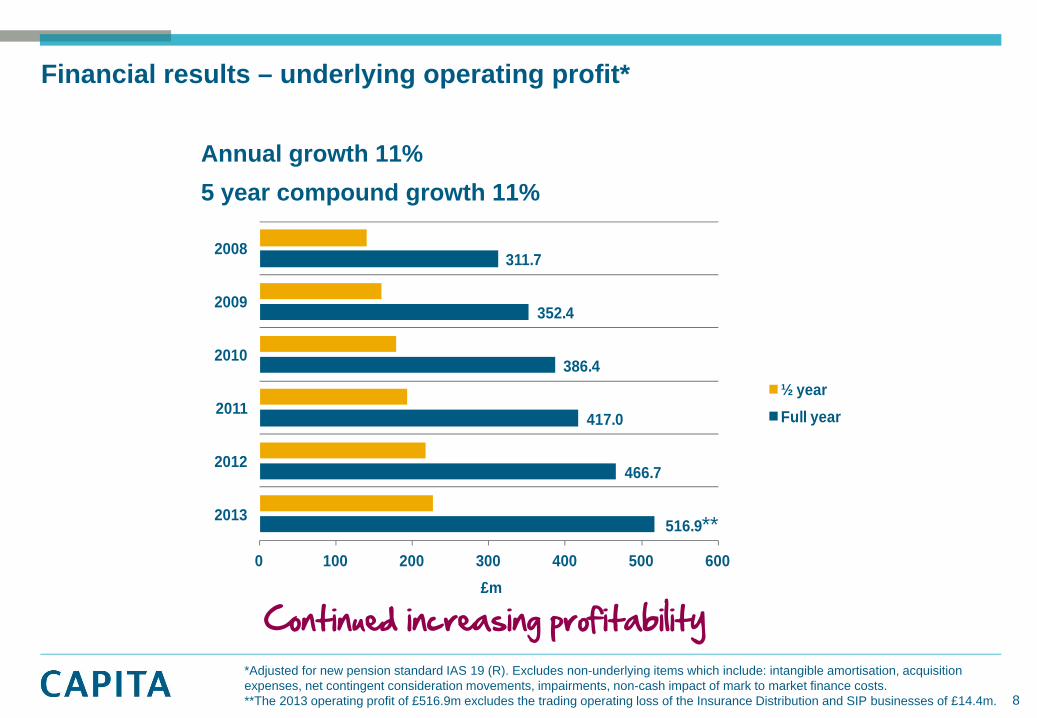
*Adjusted for new pension standard IAS 19 (R). Excludes non-underlying items which include: intangible amortisation, acquisition expenses, net contingent consideration movements, impairments, non-cash impact of mark to market finance costs. **The 2013 operating profit of £516.9m excludes the trading operating loss of the Insurance Distribution and SIP businesses of £14.4m.
Annual growth 11%5 year compound growth 11%
Financial results – underlying operating profit*
516.9
466.7
417.0
386.4
352.4
311.7
0 100 200 300 400 500 600
2013
2012
2011
2010
2009
2008
£m
½ yearFull year
Continued increasing profitability
**
8

*Adjusted for new pension standard IAS 19 (R). Excludes non-underlying items which include: intangible amortisation, acquisition expenses, net contingent consideration movements, impairments, non-cash impact of mark to market finance costs.**The 2013 underlying profit before tax of £475.0m excludes the trading loss before tax of the Insurance Distribution and SIP businesses of £14.4m.
Annual growth 14%5 year compound growth 12%
Financial results – underlying profit before tax*
475.0**
417.0
376.6
355.7
321.7
269.1
0 100 200 300 400 500
2013
2012
2011
2010
2009
2008
£m
½ yearFull year
Continued increasing profitability
9

12.8
13.1
14.1 14.213.9
13.4**
12.0
5.0
(5.0)
(7.0)
3.0
8.0
(10.0)
(5.0)
-
5.0
10.0
15.0
10.0
11.0
12.0
13.0
14.0
15.0
2008 2009 2010 2011 2012 2013
Org
anic
gro
wth
%
Annual decrease 50 bps
Financial results – underlying operating margin*O
pera
ting
mar
gin
%
*Adjusted for new pension standard IAS19 (R). Excludes non-underlying items which include: intangible amortisation, acquisition expenses, net contingent consideration movements, impairments, non-cash impact of mark to market finance costs **The 2013 operating margin of 13.4% excludes the Insurance Distribution and SIP businesses, including them the operating margin is 12.9%.
12.5 – 13.5% range for foreseeable future
Operating marginOrganic growth
10
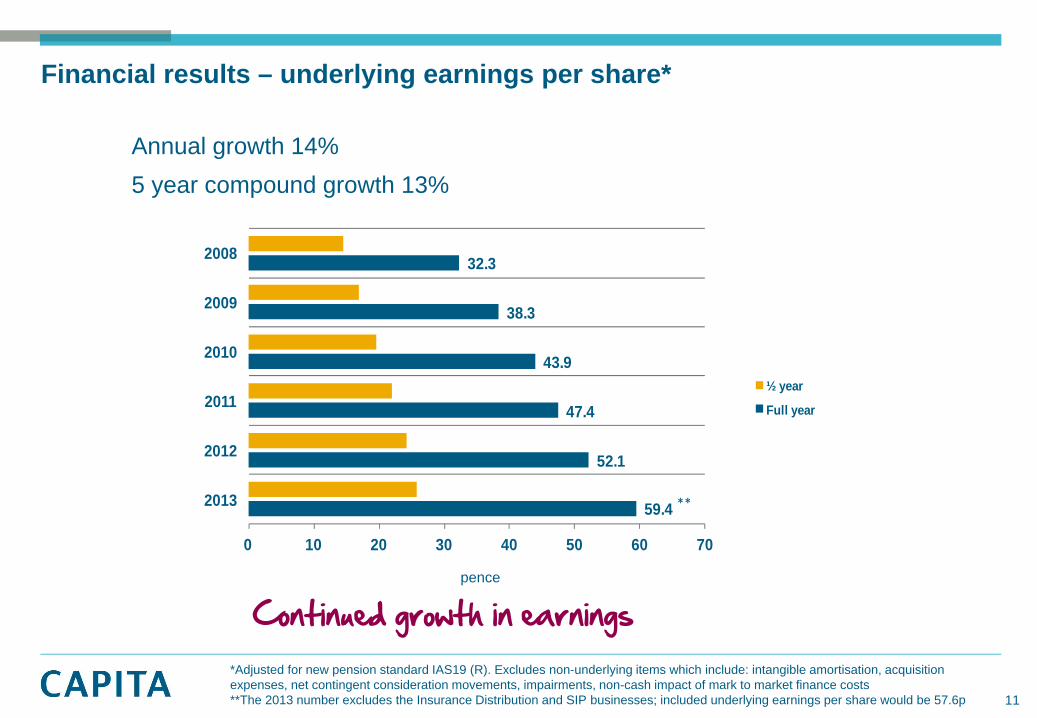
59.4
52.1
47.4
43.9
38.3
32.3
0 10 20 30 40 50 60 70
2013
2012
2011
2010
2009
2008
½ year
Full year
**
Financial results – underlying earnings per share*
Annual growth 14%5 year compound growth 13%
pence
*Adjusted for new pension standard IAS19 (R). Excludes non-underlying items which include: intangible amortisation, acquisition expenses, net contingent consideration movements, impairments, non-cash impact of mark to market finance costs **The 2013 number excludes the Insurance Distribution and SIP businesses; included underlying earnings per share would be 57.6p
Continued growth in earnings
11

26.5
23.5
21.4
20.0
16.8
14.4
0 5 10 15 20 25 30
2013
2012
2011
2010
2009
2008
½ yearFull year
Financial results – dividends
12
Annual growth 13% 5 year compound growth 13% Dividend cover* 2.24x Dividend yield 2.4%
pence
*Adjusted for new pension standard IAS 19 (R). Dividend cover is calculated using underlying earnings per share excluding the Insurance Distribution and SIP businesses
Dividend growth broadly in line with earnings growth

£m 2013 £m 2012
Cash flow from operations before business disposal/planned closure* 546 515
Net interest paid (37) (46)
Taxation paid (53) (62)
Capital expenditure (144) (100)
Free cash flow before business disposal/planned closure 312 307
Free cash flow of Insurance Distribution and SIP businesses (9) -
Free cash flow after business disposal/planned closure 303 307
Acquisition costs (including debt paid) (232) (172)
Purchase of public sector subsidiary partnerships (48) -
Contingent consideration (14) (12)
Cash disposed with business (6) -
Equity dividends paid (159) (138)
Share option proceeds/share issue 17 282
Net debt issued/(repaid) 2 (20)
Other financing (11) (2)
(Decrease)/increase in cash in the period (148) 245
Financial results – cash flow statement
Strong operational cash flow*Adjusted for new pension standard IAS19 (R)
13

Financial results – cash flow from operating activities
£m 2013 £m 2012
Operating profit before business disposal/planned closure* 517 467
Depreciation 78 73
Share based payment 11 9
Pensions 2 (7)
Movements in provisions (12) (18)
Movements in working capital (50) (9)
Cash flow from operations 546 515
Operating cash conversion before business disposal/ planned closure 106% 110%
*Adjusted for IAS19 (R). Excludes non-underlying items being: intangible amortisation, acquisition expenses, net contingent consideration movements, impairments, non-cash impact of mark to market finance costs
Confident of maintaining annual cash conversion of around 100%
14

Financial results – capital expenditure as a % of turnover
15
3.5
2.5
3.6 3.5
2.9
3.7
0
1
2
3
4
5
6
7
2008 2009 2010 2011 2012 2013
%
Controlled capital expenditure

8.2 7.9 7.7 7.5 7.0 7.7
19.7 20.3 19.5
16.1 15.8 15.5
4
8
12
16
20
24
2008 2009 2010 2011 2012 2013
Actual
WACC
2008 2009 2010 2011 2012 2013
Operating profit (£m) 312 352 386 417 467 517
Avg capital (£m) 1,155 1,271 1,491 1,976 2,348 2,701
Tax (%) 27.0 26.8 24.5 23.5 20.5 19.0
Financial results – underlying net return on capital*%
retu
rn
16
*Adjusted for new pension standard IAS 19 (R). Excludes non-underlying items which include: intangible amortisation, acquisition expenses, net contingent consideration movements, impairments, non-cash impact of mark to market finance costs and excludes the Insurance Distribution and SIP businesses for 2013.
Maintaining healthy returns

133
158 176 171
207 211
90
110
130
150
170
190
210
2008 2009 2010 2011 2012 2013
Economic profit
2008 2009 2010 2011 2012 2013
PBIT 312 352 386 417 467 517
Average capital 1,155 1,271 1,491 1,976 2,348 2,701
Tax (%) 27.0 26.8 24.5 23.5 20.5 19.0
WACC (%) 8.2 7.9 7.7 7.5 7.0 7.7
Capital charge (£m) 95 100 115 148 164 208
Tax (£m) 84 94 95 98 96 98
Financial results – post tax economic profit*£m
*Adjusted for new pension standard IAS 19 (R). Excludes non-underlying items being: intangible amortisation, acquisition expenses, net contingent consideration movements, impairments, non-cash impact of mark to market finance costs and excludes the Insurance Distribution and SIP businesses for 2013
5 year compound growth 9%
17
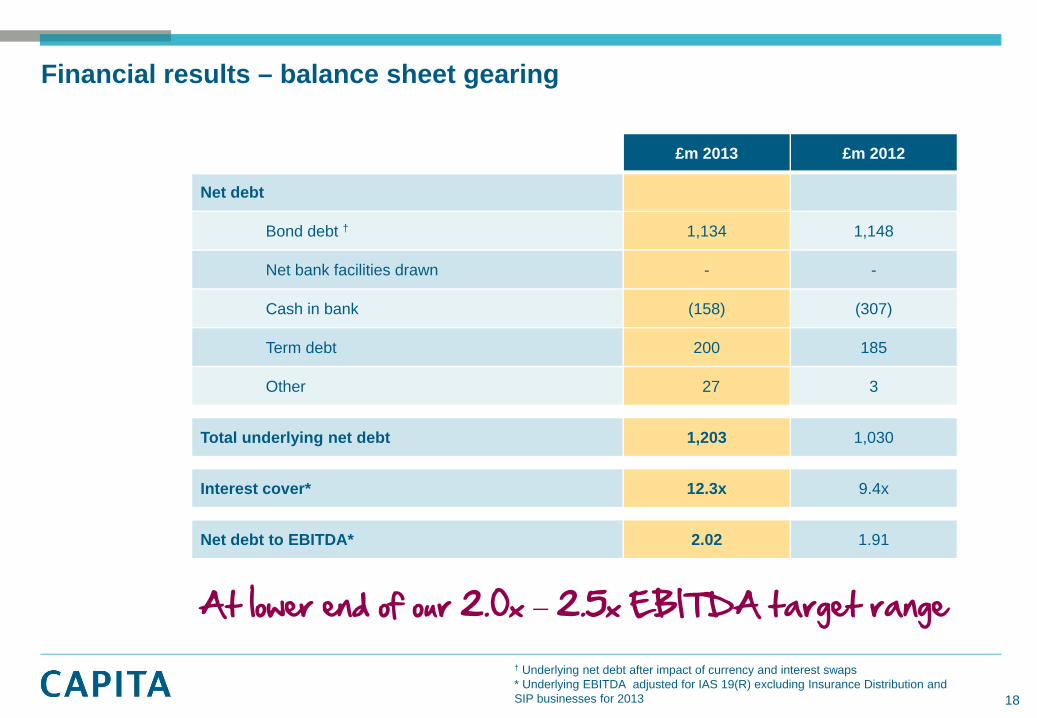
£m 2013 £m 2012
Net debt
Bond debt † 1,134 1,148
Net bank facilities drawn - -
Cash in bank (158) (307)
Term debt 200 185
Other 27 3
Total underlying net debt 1,203 1,030
Interest cover* 12.3x 9.4x
Net debt to EBITDA* 2.02 1.91
Financial results – balance sheet gearing
† Underlying net debt after impact of currency and interest swaps* Underlying EBITDA adjusted for IAS 19(R) excluding Insurance Distribution and SIP businesses for 2013
At lower end of our 2.0x – 2.5x EBITDA target range
18
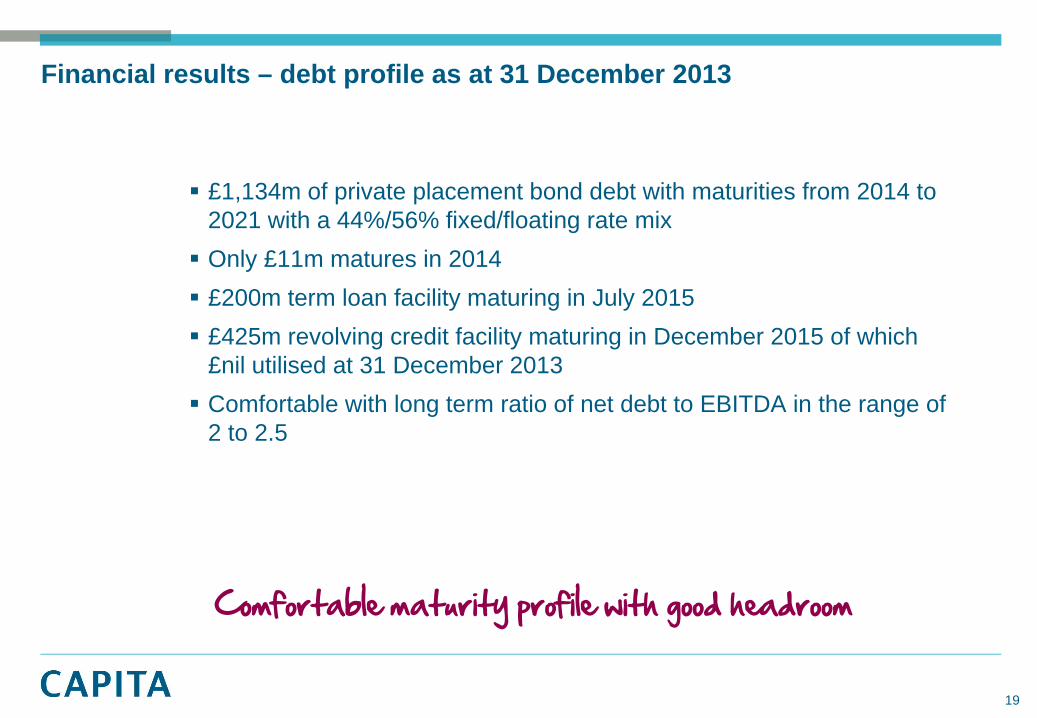
£1,134m of private placement bond debt with maturities from 2014 to 2021 with a 44%/56% fixed/floating rate mixOnly £11m matures in 2014£200m term loan facility maturing in July 2015£425m revolving credit facility maturing in December 2015 of which £nil utilised at 31 December 2013Comfortable with long term ratio of net debt to EBITDA in the range of 2 to 2.5
Financial results – debt profile as at 31 December 2013
Comfortable maturity profile with good headroom
19

83106
131
154
184
219
280
241
157
307 312
50
100
150
200
250
300
350
2003 2004 2005 2006 2007 2008 2009 2010 2011 2012 2013
£2.1bn free cash flow generated over last 10 yearsOrdinary dividendsSpecial dividends £1,129m £1.7bn
returned to shareholders (gross)
£1.4bn returned to shareholders (net
of equity raised in 2012)Share buy backs £551m
Acquisitions £1,800m
£m
14% p.a. growth over last 10 years
Underlying free cash flow growth
20

Total shareholder return
FTSE 100 Capita Capital appreciation +50% +311%Returns from dividends +65% +114%Total shareholder return +115% +425%
1 Share prices used for calculating capital appreciation: 252.392p (2 Jan 2004 close), 1038.000p (31 Dec 2013 close). Source: Citi
Over 10 years to 31 December 2013:
Delivering long term shareholder value
21

Positioning Capita for continued growth
Andy Parker

Strategy for continued growth
Long term objective to deliver a minimum 10% revenue growth, split 2/3 organic growth and 1/3 acquisitions Continued discipline regarding cash management and capexFoster entrepreneurial behaviours within robust governance structure Continue to align management and shareholder objectives -strengthened through the addition of ROCE in remuneration policy from 2014
Well positioned for long term growth
23

Results in:
Sustainable growthHigher organic growthValue add acquisitions
Best in class resilient margins
Increasing strong cash generation
Increasing earnings
Sustainable and progressive dividends
An embedded delivery model driving operational excellence and robust governance
2013 operating structure:
9 divisions
Optimise synergies Responsiveness Market facing Structured for growth Spreading responsibility Promotes entrepreneurship Shared scale benefits On/near/offshore flexible delivery
Extensive resources + integrated process for controlled growth:Organic growth:
Big ticket contract sales teamsDivisional sales teams
Value add acquisitions: Divisionally generatedCentrally controlledDisciplined pricing New markets/enhance capability Fully integrated
Evaluation & governance:Big ticket sales review(‘black hat’) Monthly business review & re-forecasting (MOBs) Strong divisional management
Financial strategy:
Appropriate gearing:2 to 2.5 x EBITDA
Return on capital significantly above WACC
Maximise shareholder returns:
DividendsSpecial dividendsShare buybacks
Reinvestment:Acquisitions Disciplined capital expenditure
24
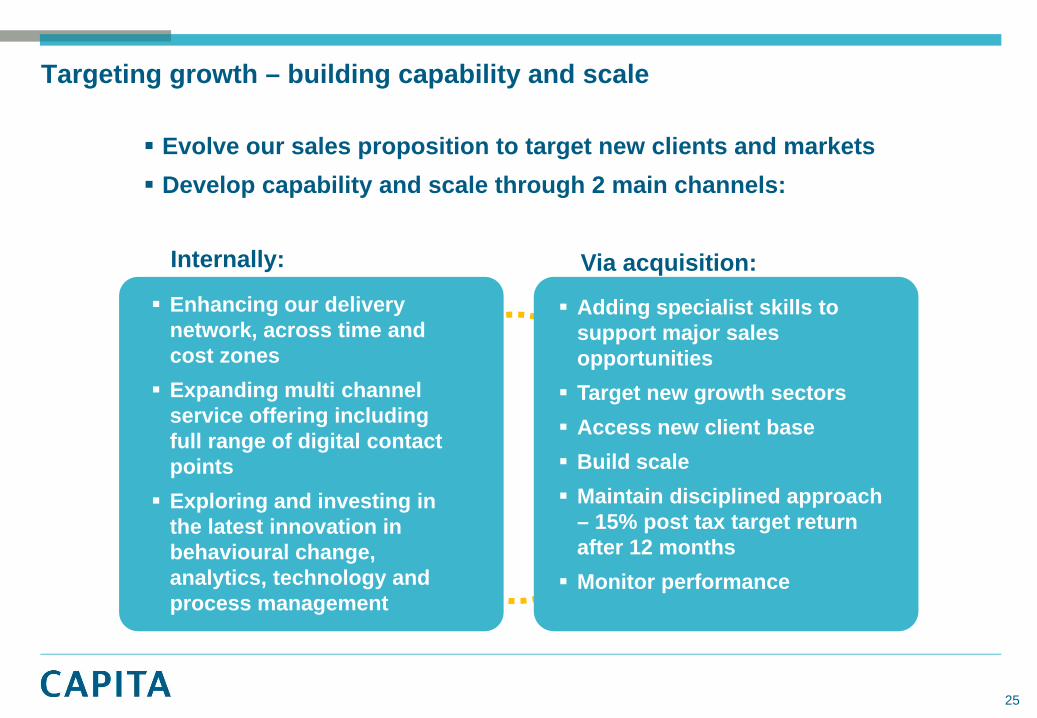
Evolve our sales proposition to target new clients and markets Develop capability and scale through 2 main channels:
Targeting growth – building capability and scale
Internally: Via acquisition:Enhancing our delivery network, across time and cost zonesExpanding multi channel service offering including full range of digital contact points Exploring and investing in the latest innovation in behavioural change, analytics, technology and process management
Adding specialist skills to support major sales opportunities Target new growth sectors Access new client base Build scale Maintain disciplined approach – 15% post tax target return after 12 months Monitor performance
25
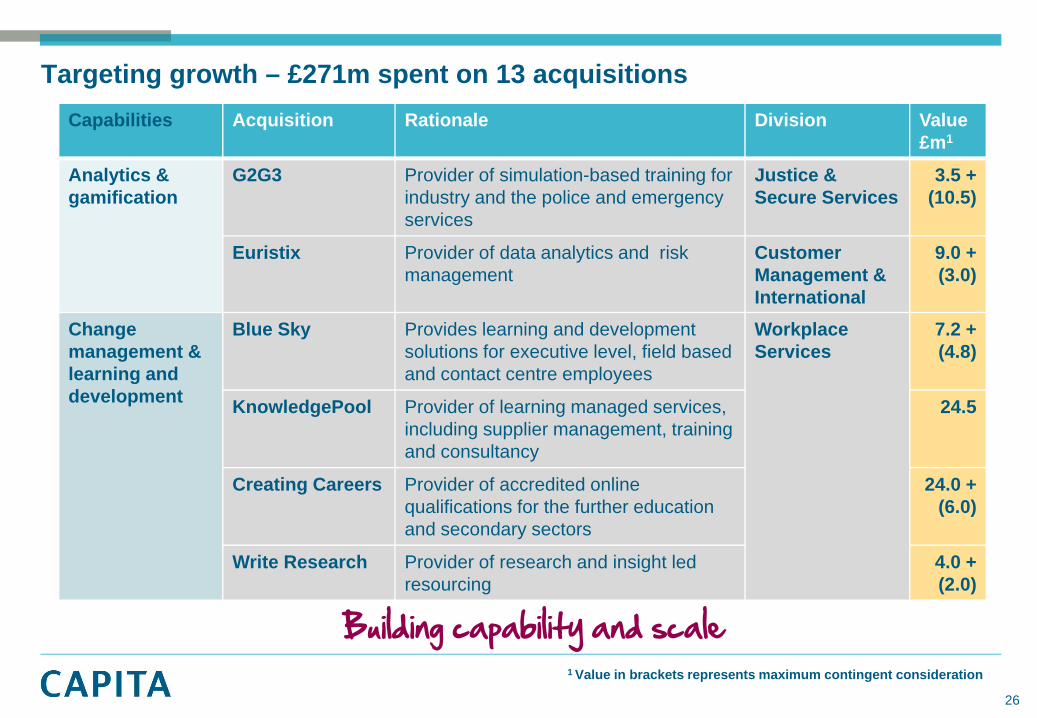
Capabilities Acquisition Rationale Division Value £m1
Analytics & gamification
G2G3 Provider of simulation-based training forindustry and the police and emergency services
Justice & Secure Services
3.5 + (10.5)
Euristix Provider of data analytics and risk management
Customer Management & International
9.0 + (3.0)
Change management & learning and development
Blue Sky Provides learning and development solutions for executive level, field based and contact centre employees
Workplace Services
7.2 + (4.8)
KnowledgePool Provider of learning managed services, including supplier management, training and consultancy
24.5
Creating Careers Provider of accredited online qualifications for the further education and secondary sectors
24.0 + (6.0)
Write Research Provider of research and insight led resourcing
4.0 + (2.0)
Building capability and scale
Targeting growth – £271m spent on 13 acquisitions
1 Value in brackets represents maximum contingent consideration
26

Capabilities Acquisition Rationale Division Value £m1
IT & software MLS Provider of library and resource management systems to the UK education sector
Professional Services
16.5 + (4.0)
Northgate Provides cloud-based, infrastructure and specialist managed services to public, private and third sectors
IT Services 65.0
STL Provider of software and ICT to criminal justice system
Justice & Secure Services
6.1
ParkingEye Provider of technology based car parking services
57.5
Debt management
iQor UK (now branded Akinika)
Provider of outsourced debt collection services to both the public and private sectors
Customer Management & International
42.0
Specialist consultancy
Cymbio Specialist consultancy supporting the NHS Health & Wellbeing
7 + (3.75)
Contact Associates
Provider of assessment service enabling disabled students to access specialist support
4.5 + (0.5)
1 Value in brackets represents maximum contingent consideration
Expanding our sales propositions
Targeting growth – £271m spent on 13 acquisitions
27

Capabilities Acquisition Rationale Division Value £m1
Data management
Liberty Document management company, primarily servicing the transport sector
Justice & Secure Services
6.5
IT & software Retain International
People management, planning and forecasting tools
18.8 (3.8)
Building for future growth
Targeting growth – £25.3m spent on 2 acquisitions to date in 2014
1 Value in brackets represents maximum contingent consideration
28

Entering and building a new market through acquisition – justice and emergency services
29
£207m invested in 9 core niche businesses 2010 to date:
Strong platform for growth in justice and emergency services sectors
Division reported revenue of over £400m in full year 2013Securing major new contracts with clients including Home Office, Ministry of Justice and Metropolitan Police Service Buoyant market, currently c.25% of bid pipeline

Generating further organic growth – Ministry of Justice, electronic monitoring
Selected as preferred bidder:National electronic monitoring and field support services Overall services and systems integrator
£400m over six years (based on EM growth)Contract due to be signed shortly with new service expected to start later in 2014Significant potential for growth through expansion of services to other government departments/agenciesInterim contract signed for frontline delivery of the existing operation, transfer of around 1,000 employees in early 2014: - Serco employees and service transferred smoothly on 1 February, G4S employees transfer to Capita end March.
Building relationships in key target markets
30

Probation is a key area for Capita Significant changes planned in the way that probation services are delivered New service models which administer services but also target underlying issues such as reoffending Significant potential to realise substantial savings for taxpayers and improved outcomes for individuals and communities
• Annual spend of c.£900m on delivering sentences in the
community • Total of 16,500 FTE staff employed and funded by the
Probation Service
Reoffending rates:58.2% for prisoners released
from under 12 months custody,
35.0% for prisoners released from 12 months custody or
more
Caseload of 224,283 at the end of 2012
£9.5bn – £13bnTotal cost to the economy of
crime committed by recent ex-prisoners
Wider justice market opportunities
Identifying the underlying challenges
31

Major sales update
Maggi Bell Group Business Development Director

ContractValue (£m)
Duration (y) Type
New market entry - utilities and telecoms
npower 120 7 New
Telefónica UK (O2) 1,200 10 New + extension
Carphone Warehouse 160 10 New
Embedded growth
Electronic Monitoring 400 6 New
London Borough of Barnet (development and regulatory services)
154 10 New
Cabinet Office (Axelos) 400 10 New
Greenfield and traditional partnerships
Smart meter communicationlicence
175 12 New
National Asset Management Agency (NAMA)
69 4 New
Southampton City Council 124 5 Extension
University of Strathclyde 40 5 New
Civil Service Learning 60 2 Extension
Other major contracts 381 5 – 10 New & extensions
Creating growth – 2013 major contract wins
17 bids won in
2013 worth £3.3bn
81% new revenue
3 contracts with
potential to double
in size
Achieved win rate
of 2 in 3
33
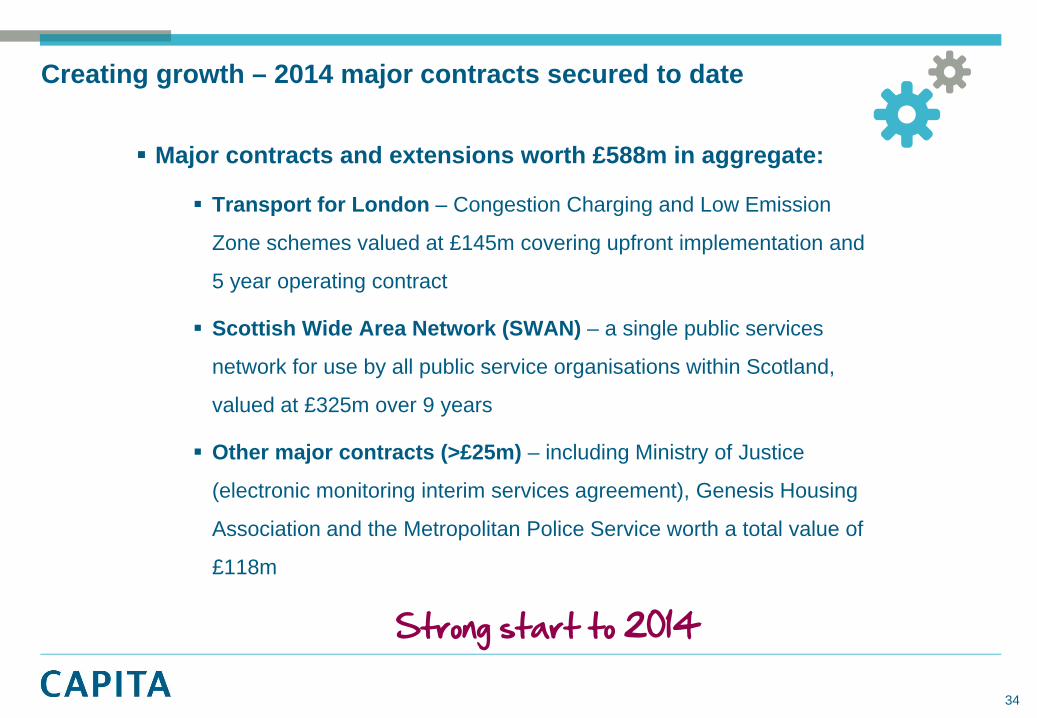
Major contracts and extensions worth £588m in aggregate:
Transport for London – Congestion Charging and Low Emission
Zone schemes valued at £145m covering upfront implementation and
5 year operating contract
Scottish Wide Area Network (SWAN) – a single public services
network for use by all public service organisations within Scotland,
valued at £325m over 9 years
Other major contracts (>£25m) – including Ministry of Justice
(electronic monitoring interim services agreement), Genesis Housing
Association and the Metropolitan Police Service worth a total value of
£118m
Creating growth – 2014 major contracts secured to date
Strong start to 2014
34

Generating growth – bid pipeline
1 Criteria: more than 1% of 2013 full year revenue of £3,851m
Strong, balanced pipeline for growth
Bid pipeline today of £5.5bn comprising 25 bids (Nov 2013: £4.2bn, 30 bids)94% new revenue / 6% renewalsPrivate sector 46% (Feb 2013: private sector 20%)Average contract length – 8 yearsOne material rebid in 2015 (acquired contract) and no further for next 5 years1
Private sector Justice &
emergency services
Financial services
Localgov Central
gov Defence Education L&P
0
10
20
30
%
35

Market landscape – multiple market driversScale: £126bn per annum
Central government
Local government Education Health
Justice & emergency
servicesDefence
Ongoing financial pressure, demographic, social changesReal term cuts in expenditureMaximise revenue collection and generationEnhance outcomes to citizens
Retail, telecoms and utilities
Life & pensions and insurance
Financial services
Other private
Refocus on core businessIncrease market shareImproving net promoter score
Public Sector
Private Sector
Customer retentionCustomer advocacy Regulatory remediation and changeDigital solutions
Drive to join-up services i.e. education, health, social care Improvement in procurement process/timeframesInnovative delivery models
Diverse, growing markets
36

Investment in market shaping
Established markets
New markets
Evolve competitive differentiation
Leverage scale
Unique solution capabilities
New relationship models
Rigorous qualification
ROI based criteria
Value sale not price competition
Strategy for growth – capitalising on opportunity
Active sales generation and win strategy
37

9 market directors Deep understanding of sector Board level relationships
New expertise in:
Group Board & divisional directors – client relationship management programme
Investment in market shaping – people and technology
Active sales generation and win strategy
Technology enabled change Digital GamificationRobotics Artificial intelligence
Intelligence enabled change Big data Predictive analytics Behavioural science Customer led service design
38
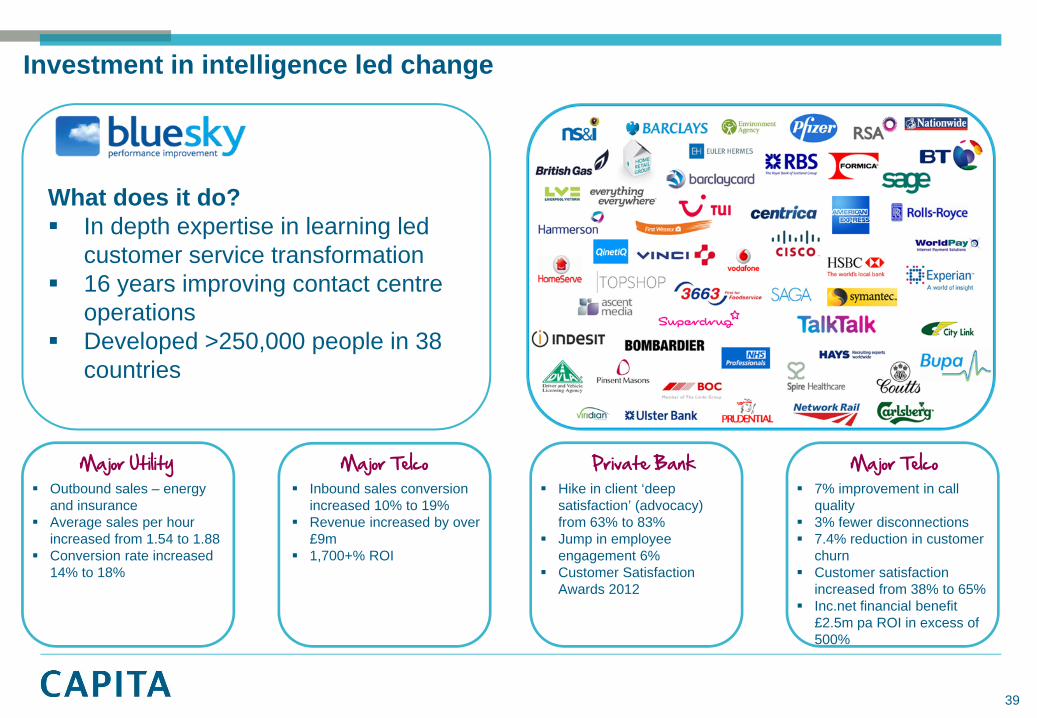
Investment in intelligence led change
Major Utility Major Telco Private Bank Major TelcoInbound sales conversion increased 10% to 19%Revenue increased by over £9m1,700+% ROI
Outbound sales – energy and insuranceAverage sales per hour increased from 1.54 to 1.88Conversion rate increased 14% to 18%
Hike in client ‘deep satisfaction’ (advocacy) from 63% to 83%Jump in employee engagement 6%Customer Satisfaction Awards 2012
7% improvement in call quality3% fewer disconnections7.4% reduction in customer churnCustomer satisfaction increased from 38% to 65%Inc.net financial benefit £2.5m pa ROI in excess of 500%
What does it do?In depth expertise in learning led customer service transformation16 years improving contact centre operationsDeveloped >250,000 people in 38 countries
39

Investment in game science led engagement technology & services
Global Re-insurance Major Tech Vendor Global Auto Manufacturer Major Tech VendorImplemented Project & Portfolio Management simulation technology as pre-sales toolRealised $40m in value over 9 months
Innovative gamificationsolution to architect positive staff behaviour around IT consumptionFull ROI in 4 weeks3 month cost saving $3.2m
Replaced ITIL Foundation training with 100 simulations worldwide Jump in training approval rating from 37% to 92%Created significant energy & commitment towards ITSM transformation & education
Creation of custom IT simulation based on Formula One scenarioRealised $1bn in value to product sales, services and education businesses
What does it do?Uses game science to engage, educate& enable for better business outcomesLicenses game-based technology to 7 of top 10 tech companies in worldGartner ‘Cool Vendor’Global footprint, 172 partners worldwide
40

Transformational partnership
Client selection criteria:Trusted relationship –partnering behaviour Deep market knowledgeFinancial stabilityGrowth track record
Scal
e
Complexity
Multi service /mid-sized contracts
Transformational partnering
Relationship structure:Long-term partnershipContracted revenue plus evergreen concessionSpecialist SMEs / subcontractorsBusiness growth focus
Client objectives:Increase revenueSupport economic regenerationImprove servicesJob creation
Transformational & greenfieldoutsourcing
Single service platforms
41

Strategy for growth – understanding client requirements and desired outcomes, wins since H1 2013
Sca
le
Complexity
Mid-sized / multi service
contracts
Transformational partnering
Civil Service Learning Smart Metering
Carphone WarehouseStaffordshire CC/EntrustCabinet Office/AxelosTelefónica UK (O2)Barnet
NAMAUniversity of Strathclyde
• npower• SWAN• Southampton CC
• TfL• Electronic monitoring
Transformational & greenfieldoutsourcing
Single service platforms
42

Sca
le
Complexity
Mid-sized / multi service
contracts
Transformational partnering
£3,425m
Strategy for growth – Bid pipeline by value
£728m
£385m
£1,008m
Single service platforms
Transformational & greenfieldoutsourcing
43
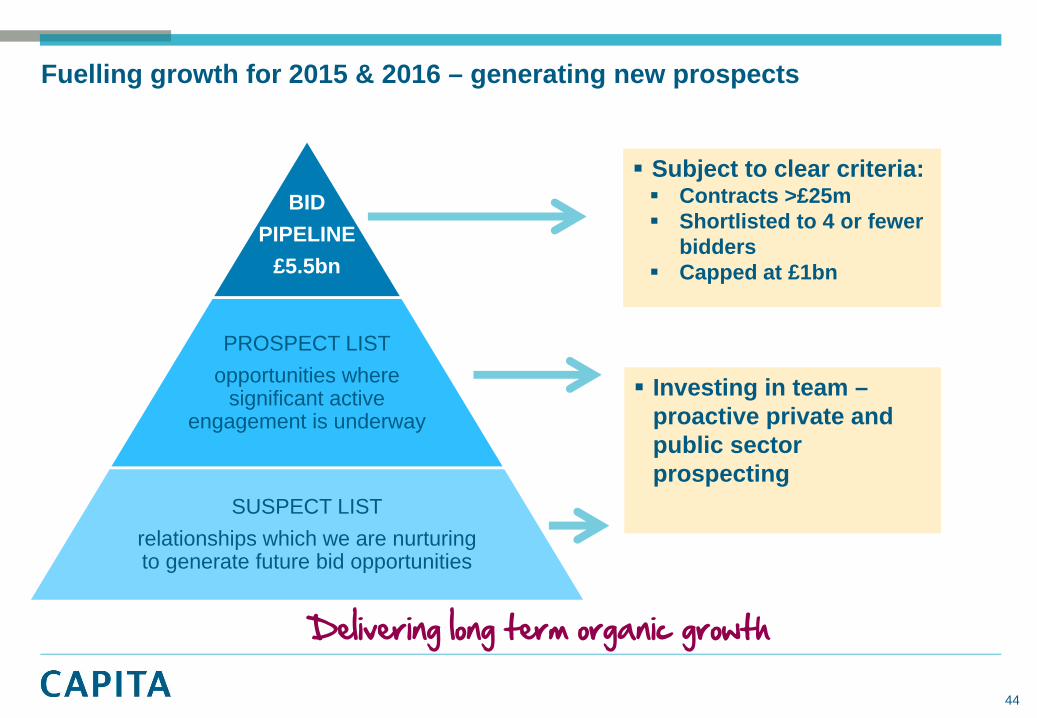
BID PIPELINE
£5.5bn
PROSPECT LISTopportunities where
significant active engagement is underway
SUSPECT LISTrelationships which we are nurturing to generate future bid opportunities
Fuelling growth for 2015 & 2016 – generating new prospects
Delivering long term organic growth
Investing in team –proactive private and public sector prospecting
Subject to clear criteria:Contracts >£25mShortlisted to 4 or fewer biddersCapped at £1bn
44

Summary & outlook
Andy Parker
High level of sales activity in both traditional and new customer management and BPM marketsFocusing on smooth delivery of recent major contract wins Operational excellence delivering strong customer referencesMaintaining strong financial discipline and an entrepreneurial, open culture as the business grows Continuation of our proven strategy and business model Well positioned for 2014 and beyond
Strongly positioned for growth
Delivering long term, sustainable growth
46
Results for the year ended31 December 2013
Full year results presentation 27 February 2014