Embed Size (px)
Citation preview

1
Results from the Peace Bridge Neighborhood Air Quality StudyAugust 2014 – September 2015
Presentation: September 20, 2016Buffalo and Erie County Public LibraryNiagara Branch - 280 Porter Avenue

2
HistoryInitial Study: Fall 2012 – Spring 2013 collected data prior to construction at the Peace Bridge PlazaThe study found that fine particulate matter (PM2.5) was below National Ambient Air Quality Standards and black carbon (BC) was higher in the afternoon when truck traffic was heaviestMany stakeholders voiced concern that the initial study missed summer months when traffic is higher, did not include ultrafine particles (UFP) and did not include a local background site

3
Current Study Objectives• Developed with community and stakeholders• One full year of data collection starting August 2014
Provides information on seasonal pollutant changes Annual pollutant concentrations for comparison to
standards and guidelines • Goal to increase understanding of mobile source emissions
(PM2.5, BC, volatile organic compounds (VOCs), carbonyls and UFP)

4
Study Design:Two fixed sites & community monitoring Busti Ave near Rhode Island St - close to and downwind
of Peace Bridge operations and within the residential neighborhood (maximum impact site)
PS198 International Preparatory School - within the same community but away from direct influence of Peace Bridge operations and I-190 (neighborhood background site)
Community sampling effort for VOCs, PM2.5 and UFP

5
Study Data Collection: Fixed SitesParameter Busti Ave PS198
Fine Particulate Matter (PM2.5) Aug 2014 – Sept 2015
Ultrafine Particles (UFP) Sept 2014 – Sept 2015 June – Sept 2015
Black Carbon (BC) Aug 2014 – Sept 2015
Meteorological Conditions Aug 2014 – Sept 2015 not monitored
Carbonyls Aug 2014 – Sept 2015 not monitored
Volatile Organic Compounds Aug 2014 – Sept 2015 not monitored

6
Traffic Data for Study Period
• Buffalo and Fort Erie Public Bridge Authority provided vehicle count and classification for Peace Bridge traffic Bridge crossings in both directions Idling and delay information
• NYS Thruway Authority provided vehicle count and classification for I-190 traffic Northbound at milepost 6.2 and 7.3 Southbound at milepost 6.4 and 8.2

7
Fixed Site Monitor
Locations1. Maximum impact site2. Neighborhood background site
1 2

8
Maximum Impact Site
Located 40 yards downwind of congested customs clearance areaYellow arrow shows the predominant wind direction

9
Maximum Impact Site: Mobile Source Emissions
• Peace Bridge approximately 15,400 annual average daily vehicles (18-26% are trucks)
• I-190: 84,400 annual average daily vehicles (10% are trucks)
• Busti Ave: 1,582 annual average daily vehicles

10
Neighborhood Background Site
Black Carbon
PM2.5
• PS198 is on the corner of 14th St. and York Street
• York Street: 1,323 annual average daily vehicles

11
Black Carbon
PM2.5
Neighborhood Background
SiteInstruments are situated above most nearby trees and rooftops

12
Buffalo Near Road Site • Data were compared to Busti monitor results
• The EPA requires near-road monitoring In cities over 1 million people For nitrogen dioxide, PM2.5 and
carbon monoxide• Buffalo site on I-90 between
Exits 51 and 52• 125,000 annual average daily
traffic
1313
Study Findings

14
Findings: Traffic Information• Peace Bridge traffic volume
Trucks are consistent across seasons and much higher during the week
Automobiles are higher in summer and weekends• I-190 traffic volume
Trucks are consistent across seasons and higher during week
Automobiles relatively consistent across seasons and lower on weekends.

15
Findings: Fine Particulate Matter Concentrations
PM2.5 is well below daily and annual National Ambient Air Quality Standards (NAAQS)
Primarily from regional sources Modest increase at the Busti monitor on the weekdays
during late morning to afternoon which tracks pattern of mobile source emissions
Highest for the winter season at both monitoring sites

16
Findings: Black Carbon Concentrations
Significantly higher at the Busti monitor than PS198 and corresponds with weekday Peace Bridge truck traffic
Busti site is similar to Buffalo near-road site
Higher in the summer than winter
Evidence of weekend evening sources at the neighborhood background site

17
Findings: Ultrafine Particle Counts
Significantly higher at the Busti monitor than PS198 and corresponds with weekday Peace Bridge truck traffic
Higher in the winter than in the summer
Lower at the Busti monitor in comparison to the Buffalo near-road monitor which is closer to the thruway
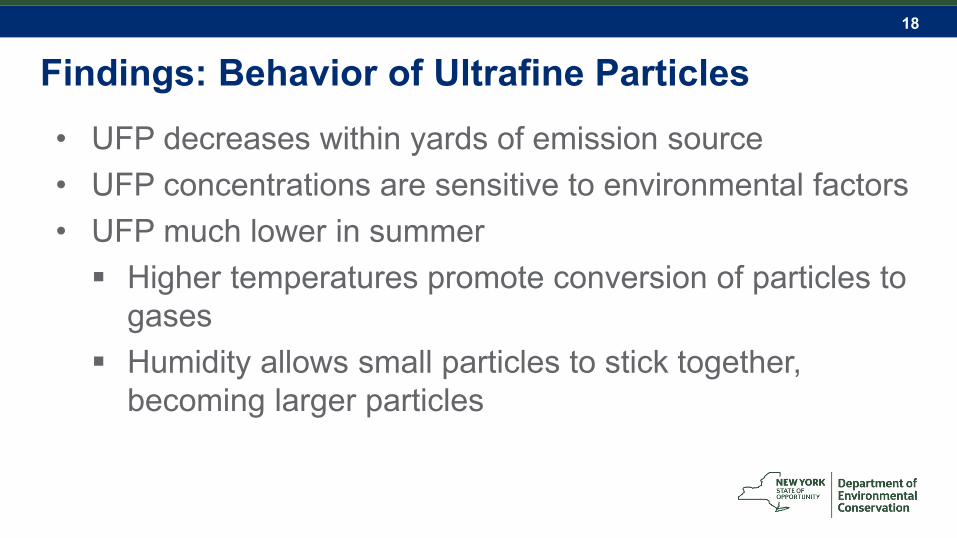
18
Findings: Behavior of Ultrafine Particles• UFP decreases within yards of emission source• UFP concentrations are sensitive to environmental factors • UFP much lower in summer
Higher temperatures promote conversion of particles to gases
Humidity allows small particles to stick together, becoming larger particles

19
Findings: Mobile Source Indicators• UFP and BC are better indicators of mobile source
emissions than PM2.5
Both UFP and BC diminish quickly downwind from sources
Both UFP and BC were more closely associated with truck emissions than automobile emissions
Traffic incidents including sports events primarily impacted automobile traffic and had little effect on pollutant measurements

20
Findings: Air Toxics• Some of the vehicle-related VOCs and carbonyls were
found above DEC’s annual guideline concentrations –but these same air toxics are found above guideline concentrations throughout the State
• Vehicle-related VOCs and carbonyls were found at the same levels as other monitoring sites in New York
• The 1-hour VOC community sample results were all below short-term guideline concentrations

21
Findings: Overall• For fine particulate matter, the levels were well below
federal standards and most of it comes from sources much farther away from this neighborhood.
• For air toxics, the air quality in this neighborhood is similar to other urbanized areas of the state.

22
Findings: Overall• The study included two pollutants which do not have a
standard or guideline: UFP and BC
A small, measureable increase in UFP and BC that corresponds with truck travel patterns on the Peace Bridge
Local increases in UFP and BC quickly diminish downwind from sources

2323
Study Instrumentation

24
Instrumentation: PM2.5
Thermo Environmental Inc. TEOM 1400B• Collects particles smaller than
2.5 microns• Reports 1-hour average
concentration

25
Instrumentation: Black Carbon
Magee Scientific Model AE21 and the newer Model AE33• Black Carbon is PM2.5 particles
that absorb light (1000x more than other species)
• Reports 1-hour average concentration

26
Instrumentation: VOCs, Carbonyls
• EPA collection and laboratory analysis methods are the same procedures used for all air toxics sites in DEC network
• 24-hr air samples collected once every 6 days

27
Instrumentation: Ultrafine Particle Number• API Model 651• Condensation Particle
Counter (CPC)• Lower size cut 7nm • 2nd Unit was on loan
from the manufacturer
This is the first instrument designed for ambient air quality monitoringData units are # of particles/cm3 averaged hourly

28
Instrumentation: What was added?
A UFP monitor was added to the background site on June 11th to capture the summer months when traffic on the Peace Bridge is heaviest
A UFP monitor was also added to the Buffalo near road site on the same day
2929
Ultrafine Particles

30Virus
1 Meter
1 Million Microns
Bacteria DNA Hair
100,000Microns
10,000Microns
1,000Microns
100Microns
10Microns
1Microns
100 Nanometer
0.1Microns
1Nanometer
0.001Microns
0.1Nanometer
0.0001Microns
UFP Size:
How small are we talking about?
•A Micron is a Millionth of a Meter
•A Nanometer is a Billionth of a Meter
•Wavelength of Visible Light: 390 – 700 nm
Red Blood cell
Tobacco SmokeRain Drops Mist/Fog
10 Nanometer
0.01Microns
Ultrafine particles
Visible Particles
Oxygen
Invisible Particles
Scatter Light
Molecules

31Virus
1 Meter
1 Million Microns
Bacteria DNA Hair
100,000Microns
10,000Microns
1,000Microns
100Microns
10Microns
1Microns
100 Nanometer
0.1Microns
1Nanometer
0.001Microns
0.1Nanometer
0.0001Microns
Red Blood cell
10 Nanometer
0.01Microns
Oxygen
Particles measured byWeight in a
volume of air (µg/m3)
Particles measured by Number in a volume of air
(#/cm3)
A 100 nm particle has 0.0064% of the volume of a PM-2.5 particle

32
Virus
1 Meter
1 Million Microns
Bacteria DNA Hair
100,000Microns
10,000Microns
1,000Microns
100Microns
10Microns
1Microns
100 Nanometer
0.1Microns
1Nanometer
0.001Microns
0.1Nanometer
0.0001Microns
Red Blood cell
10 Nanometer
0.01Microns
Ultrafine particles
Oxygen
45 Years:
Evolution of PM NAAQS
•1971 – Total suspended particles
•1987 – PM10 daily 150, Annual 50 mg/m3
•1997 – PM2.5 daily standard 65 mg/m3
•2006 – PM2.5 daily standard 35 mg/m3
•2012 – PM2.5 annual standard lowered from 15 to 12 mg/m3
•2017 – ? (NAAQS currently under review)
Total Suspended Particulates
PM10
PM2.5
Ambient Ultrafine Particles are not regulated in the US

3333
Study Results

34
Results: Peace Bridge Traffic • ADT: Average Daily Traffic• Total AADT: 14,904 autos, trucks and buses, east and westbound • Truck traffic is very consistent year round• Auto traffic is higher in the summer

35
Results: Peace Bridge Automobiles
• Diurnal Plots (average concentration by hour)• Higher on weekends and summer• Weekdays – peak period is 11 am – 7 pm

36
Results: Peace Bridge Trucks
• Lower on weekends• Consistent throughout seasons• Weekday – peak period is 9 am – 7 pm

37
Results: I-190 Traffic
• Total AADT: 78,421 autos and trucks, north and southbound • Truck traffic is slightly higher in the summer, lower in the winter • Auto traffic is higher in the summer, lower in the winter

38
Results: I-190 Autos
• Lower on weekends• Higher in the summer, lower in the winter • Weekday peak is 8 am and 4 pm
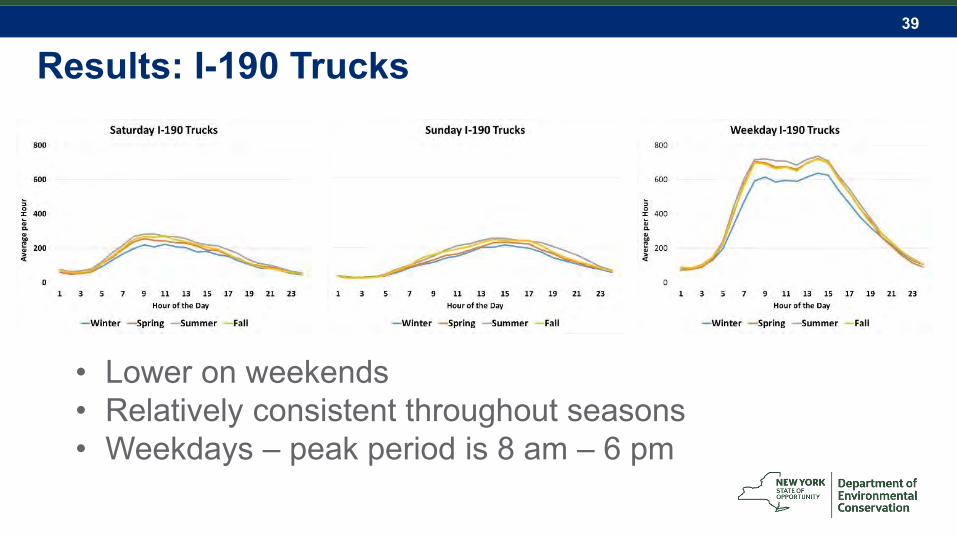
39
Results: I-190 Trucks
• Lower on weekends• Relatively consistent throughout seasons• Weekdays – peak period is 8 am – 6 pm

40
Results: PM2.5
Both study sites (8.85 and 8.05 µg/m3) are well below the Annual NAAQS for PM2.5 (12 µg/m3)

41
Results: PM2.5
• Local is Busti PM2.5 minus PS198 PM2.5
• Regional is PS198

42
Results: PM2.5
Weekdays: contribution of local source PM2.5 is 1% to 24% of the total PM2.5

43
Results: Black Carbon
BC has a stronger gradient and is a good indicator of mobile source emissions

44
Results: Black Carbon
• All sites are effected by daily pattern of vehicle emissions• BC is higher in the summer than winter • Near-road site has stronger traffic influence

45
Results: Ultrafine Particles • UFP is much higher in the winter • UFP has a strong gradient and is a good indicator of mobile
source emissions

46
Results: UFP Summer Site Comparison
The time of day plot shows that UFP is considerably higher at the Near Road site than at Busti Avenue and PS 198
The Near Road site is much closer to vehicle emissions than Busti Ave

47
Results: Seasonal UFP• Trucks are large contributor to UFP
and daily volumes are relatively consistent throughout the year
• UFP in the summer at Busti Ave is about ½ of winter values
• UFP at Buffalo near-road in the summer is similar to winter
• UFP does not decrease significantly in 20 yards but it does in 40 yards to 200 yards

48
Results: UFP from the 2006 HEI/Harvard study• Due to UFP instrument’s lower
particle size cut we would expect to find UFP 25-50% higher in the DEC study
• UFP in the DEC study were about 12% higher in the winter and lower in the summer. This is not conclusive but suggests that UFP have decreased
DEC Study 2015 DEC Study 2014-15
Summer Average Winter Average
Busti Ave 12,232 Busti Ave 23,636
PS 198 7,736 PS 198 Not Installed

49
Results: Meteorology • This plot shows the
frequency of wind direction (blowing from) for the BustiAve site
• The predominant wind direction (30%) is from the southwest
• Wind direction is fairly consistent year round

50
Results: Temperature and Wind Speed by Season
• Higher temperatures and humidity allow some UFP to become gases and some UFP to become larger particles
• High wind speed disperses BC and UFP more quickly

51
Results: Mobile Source Indicators and Truck Traffic

52
Results: Mobile Source Indicators and Auto Traffic

53
Results: VOCs & Carbonyls• Air samples analyzed for the presence of 43 VOCs and
11 carbonyls• 12-month average compared to DEC’s Annual Guideline
Concentrations (AGCs)• Four vehicle-related VOCs and carbonyls
Were found above AGC Below DEC’s target risk level Similar to concentrations found in other cities in the State
54
Results: Community Samples VOCs • Community collected samples at times and in locations
where concentrations were expected to be elevated• Four air samples collected on two different dates
May 24 and September 15, 2015 Both mid-afternoon
• 1-hour concentrations compared to DEC’s Short-term Guideline Concentrations (SGCs)
• All results below SGCs and similar to 24-hour results obtained in this Study

55
• Benzene primarily from mobile sources
• Concentrations in PB neighborhood are similar to urban and suburban areas of the State
56
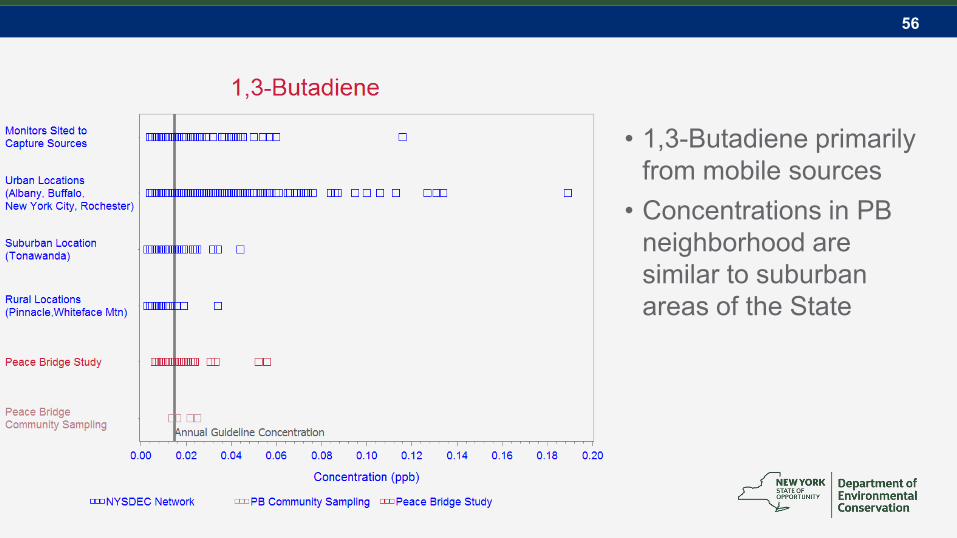
• 1,3-Butadiene primarily from mobile sources
• Concentrations in PB neighborhood are similar to suburban areas of the State

57
• Concentrations are similar to other areas of the State

58
• Concentrations are similar to other areas of the State

59
Conclusions: Mobile Source Emissions UFP & BCThe study has improved our understanding of the behavior of mobile source indicator pollutants• BC at Busti Avenue is similar to the Near-road site and is
higher than PS198 BC is emitted and it’s concentration decreases due to
dispersion• UFP is higher at the Near Road Site because the monitor is
much closer to roadway UFP are emitted and quickly undergo dispersion and
transformations

60
Conclusions: Mobile Source Emissions Air Toxics
• Vehicle related VOCs and carbonyls found at levels similar to other similar sized cities in the State
• All concentrations found were below DEC’s target risk level

61
Future UFP Monitoring and Data• The Buffalo Near Road site as expected has higher
UFP and will successfully represent the worst case near-road emissions for the Buffalo-Niagara region
• The EPA near-road monitoring stations are expected to be a component of the revised PM NAAQS
• The study data are available for EPA and other researchers for use in health assessments

62
Thank You
• Dirk Felton • Randi Walker • Oliver Rattigan• Tom Gentile• Margaret Valis• Steve DeSantis• Al Carlacci
• Blaise Agnew• Pete Furdyna• Jackie Perry• Matt Hirsch
Connect with us:Facebook: www.facebook.com/NYSDECTwitter: twitter.com/NYSDECFlickr: www.flickr.com/photos/nysdec