Embed Size (px)
Citation preview
1
Results in line with our Long Term Strategic PlanSolidity of fundamentals sustains growth
2007 Annual Results
http://cemig.infoinvest.com.br 2 / 49
Disclaimer
Some statements in this presentation are forward-looking statements within the meaning of the US Securities Acts and are subject to risks and uncertainties. Forward looking statements are forecasts that may differ from the final numbers and are not under our control. For a discussion of the risks and uncertainties as they relate to the Company, please refer to our Form 20F of 2006, and in particular Item 3, containing “Basic Information – Risk Factors”.
All figures are in BR GAAP.

http://cemig.infoinvest.com.br 3 / 49
Contents
Highlights and Investment Policy• Marcio Araujo de Lacerda
Chairman of the Board of Directors
Corporate management and expansion of our business• Djalma Bastos de Morais
Chief Executive Officer
Financial management and 2007 Results• Luiz Fernando Rolla
Chief Officer for Finance, Investor Relations and Control of Holdings
Strategy ensures sustainable growth• Marcio Araujo de Lacerda
Chairman of the Board of Directors

http://cemig.infoinvest.com.br 4 / 49
Highlights and Investment Policy• Marcio Araujo de Lacerda
Chairman of the Board of Directors
Corporate management and expansion of our business• Djalma Bastos de Morais
Chief Executive Officer
Financial management and 2007 Results• Luiz Fernando Rolla
Chief Officer for Finance, Investor Relations and Control of Holdings
Strategy ensures sustainable growth• Marcio Araujo de Lacerda
Chairman of the Board of Directors
Contents

http://cemig.infoinvest.com.br 5 / 49
Consolidated sales: a record 57,892 GWh – Growth of 11%Sales to Argentina and Uruguay billed R$ 71 million
Solid fundamentals and compliance with Strategic PlanSanto Antônio power plant: the Amazon Region is the new generationfrontier – essential element in our target for 20% market share
– Expected return suitable to our Investment Policy
Financial
to R$ 850 million
Ebitda
+26% 40%EbitdaMargin
Highlights
Strategic Plan
Ebitda: R$ 4.073 billion
Net Income: R$ 1.735 billionProposed dividend: R$ 868 million
Market

http://cemig.infoinvest.com.br 6 / 49
43 average MW from the Funil Hydro Plant sold for
Highlights
Electricity auction
New Bylaws create new organizational structure, preparing the company for the challenges of consolidation of the sector
Fiscal Council operates as Audit CommitteeInternal controls certified for Sarbanes-Oxley Sections 302, 404
Corporate governance
The A-5 “New Energy” Auction
Regulatory
Tariff Review of Cemig D – Repositioning as from April 8
R$ 125.90/ MWh – 30-year contract starting 2012
Renewal of Generation Concessions, totaling 1,735MW

http://cemig.infoinvest.com.br 7 / 49
Brazil’s “Best Large Company to Work In” – in “150 best” surveyEmployee profit shares reflect measures to reduce future payroll expenses.Starting in 2008, variable remuneration will be tied to corporate targets.
Highlights Management
Cemig is World Leader– in Utilities sector of Dow Jones Sustainability World index.
Brazilian consumers elect Cemig best concession holder in the South East in Aneel’s Consumer Satisfaction Survey (IASC)
Sustainability
Feasibility studies for new generation projects (hydraulic, thermal and eolic energy), in partnership with others players, totaling 4,000 MW:Higher Competitive standards in expansion opportunities
Expansion

http://cemig.infoinvest.com.br 8 / 49
Discipline in investing
Sustainability
Leadership in Consolidation of Brazil’s Electricity Sector
Focus on generation, transmission and distribution of electricity, and natural gas• Infovias sold Way TV for R$ 103 million
(profit of R$ 54 million)Return compatible with the risk of each business.Strategic partnerships• Risk mitigation• Improvement of competitiveness• Best corporate governance practices
Strategic Plan defines long-term targets
http://cemig.infoinvest.com.br 9 / 49
Highlights and Investment Policy• Marcio Araujo de Lacerda
Chairman of the Board of Directors
Corporate management and expansion of our business
• Djalma Bastos de MoraisChief Executive Officer
Financial management and 2007 Results• Luiz Fernando Rolla
Chief Officer for Finance, Investor Relations and Control of Holdings
Strategy ensures sustainable growth• Marcio Araujo de Lacerda
Chairman of the Board of Directors
Contents

http://cemig.infoinvest.com.br 10 / 49
Our investment policy ensures sustainable growth:
– Our main principles:
• Focus on electric sector activities
• Profitability: return compatible with risk
• Partnership with strategic investors: corporate governance
– Growth through new projects: long term vision
• Impossible to stay out of the Amazon area
• Growth through acquisitions
• Accelerated growth
• Sinergies identification
Investments

http://cemig.infoinvest.com.br 11 / 49
2005, 2006 and 2007: actual figures.2008: figures estimated in accordance with corporate planning.
417
157
315 334
Total Holding
Cemig DCemig GT
2005 2007 2008
1,166
1,944
926
1,561
2006
691
1,229
601
1,184
58
558
10 43
Capex
Acquisitionof Light and
TBE
Minas Hydro Plants (PCHs)Baguari Hydro Plant
Capacity improvementsLight for Everyoneprogram
2005 2007 20082006
R$ million
R$ million
R$ million
R$ million
2005 2007 20082006
2005 2007 20082006
Light for Everyoneprogram and
improvements to existing system

http://cemig.infoinvest.com.br 12 / 49
Year Capacity added, MW
Total Plants
2004 178 5,949 Barreiro Thermal Plant,Pai Joaquim small hydro, Queimado and Rosal Hydro
2005 164 6,113 Aimorés Hydro Plant2006 521 6,634 Irapé Hydro Plant, RME and Capim Branco I Hydro Group2007 44 6,678 Capim Branco II Hydro Group
In the last four years we have added more than 1,000 MW to our generating capacity, and 71,000 km of network.
2003 2004 2005 2006 2007 TOTAL
5,771
178
164
52144
6,67816%
MW
Installed Capacity
Growth of our assets
2003 2007
km
2003 2007
km
2003 2007
km
10%
3%
20%
4,829
5,313
16,185 16,676
359,304
429,560
Transmission lines
Sub-transmission lines
Distribution lines
http://cemig.infoinvest.com.br 13 / 49
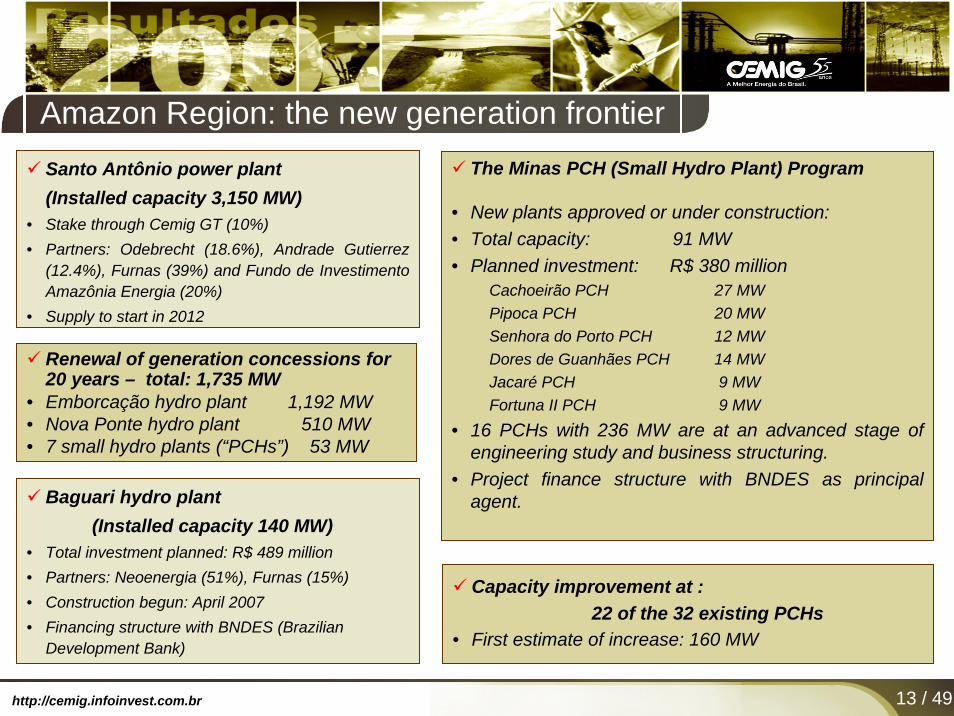
Amazon Region: the new generation frontier
Renewal of generation concessions for 20 years – total: 1,735 MW
• Emborcação hydro plant 1,192 MW• Nova Ponte hydro plant 510 MW• 7 small hydro plants (“PCHs”) 53 MW
Baguari hydro plant(Installed capacity 140 MW)
• Total investment planned: R$ 489 million• Partners: Neoenergia (51%), Furnas (15%)• Construction begun: April 2007• Financing structure with BNDES (Brazilian
Development Bank)
Capacity improvement at :22 of the 32 existing PCHs
• First estimate of increase: 160 MW
The Minas PCH (Small Hydro Plant) Program
• New plants approved or under construction: • Total capacity: 91 MW• Planned investment: R$ 380 million
Cachoeirão PCH 27 MWPipoca PCH 20 MWSenhora do Porto PCH 12 MWDores de Guanhães PCH 14 MWJacaré PCH 9 MWFortuna II PCH 9 MW
• 16 PCHs with 236 MW are at an advanced stage of engineering study and business structuring.
• Project finance structure with BNDES as principal agent.
Santo Antônio power plant(Installed capacity 3,150 MW)
• Stake through Cemig GT (10%)• Partners: Odebrecht (18.6%), Andrade Gutierrez
(12.4%), Furnas (39%) and Fundo de InvestimentoAmazônia Energia (20%)
• Supply to start in 2012

http://cemig.infoinvest.com.br 14 / 49
Inter-American Development Bank contract for Transchile: US$51 million
Startup of new transmission lines:Companhia Transudeste de Transmissão : Transmission Line Itutinga–Juiz de Fora, 345kV, Length 140 km, Cemig (24%),
Companhia Transirapé de Transmissão: Transmission LineIrapé–Araçuaí, 230kV, Length 65km; and Irapé and Araçuaísubstations, Cemig (24.5%)
Cemig GT’s total Permitted Annual Revenue increased 2.2% with the startup of new facilities.
Transmission: growth in Brazil and other countries
( * ) Rede Básica Novas Instalações
http://cemig.infoinvest.com.br 15 / 49
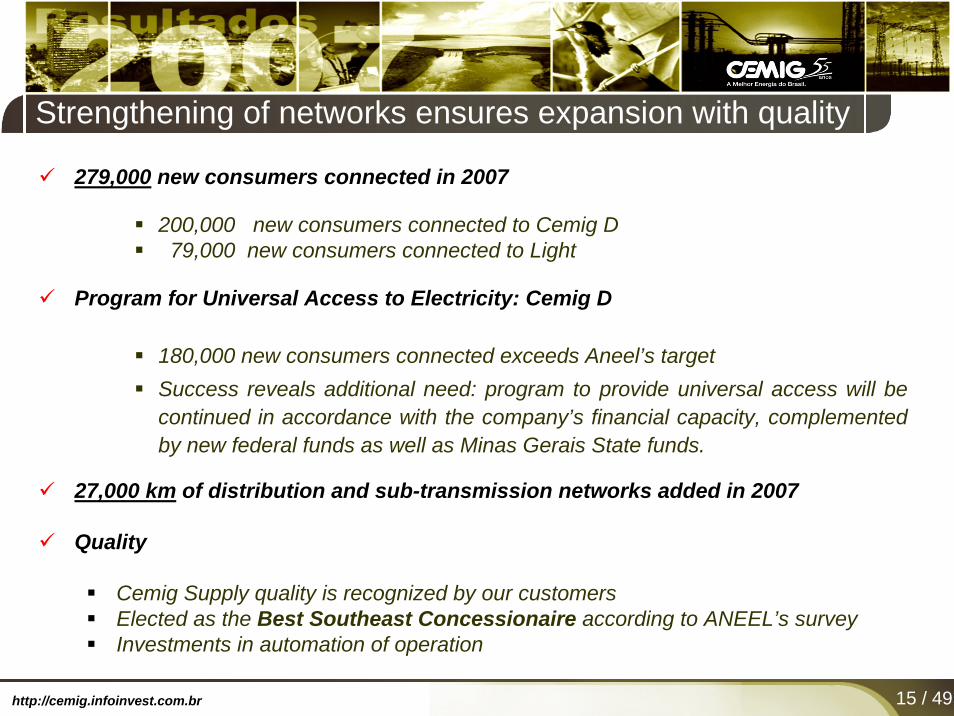
279,000 new consumers connected in 2007
200,000 new consumers connected to Cemig D79,000 new consumers connected to Light
Program for Universal Access to Electricity: Cemig D
180,000 new consumers connected exceeds Aneel’s targetSuccess reveals additional need: program to provide universal access will be continued in accordance with the company’s financial capacity, complemented by new federal funds as well as Minas Gerais State funds.
27,000 km of distribution and sub-transmission networks added in 2007
Quality
Cemig Supply quality is recognized by our customersElected as the Best Southeast Concessionaire according to ANEEL’s surveyInvestments in automation of operation
Strengthening of networks ensures expansion with quality
http://cemig.infoinvest.com.br 16 / 49
Sustainability is a corporate value
Social and Environmental Responsibility is a perennial commitment in all corporate decisions and it is introduced in our
long-term vision, assuring the sustainability of the activities, and allow us to generate, transmit and distribute energy with profitability and respect for our stakeholders.

http://cemig.infoinvest.com.br 17 / 49
Sustainability : social and environmental highlights of 2007
Interaction with community
ASIN project
• strong stimulus to voluntary work by employees - 1,100 participants
• 83 projects developed through the state
Assist Chateaubriand Social Responsibility Award for programs devised by our volunteers: “Lighting up Lives” and “Solidarity School-kit”.
Interaction with environment
Funds applied in environmental programs: R$44 million
Environmental Management System now protects 82% of our total generation capacity
Biodiversity: Peixe Vivo (“Fish Alive”) program for preservation of aquatic species in the Minas Gerais river basins where we have hydro plants.
Terra de Gente (“Our Land”) program: environmental education in schools

http://cemig.infoinvest.com.br 18 / 49
Highlights and Investment Policy• Marcio Araujo de Lacerda
Chairman of the Board of Directors
Corporate management and expansion of our business• Djalma Bastos de Morais
Chief Executive Officer
Financial management and 2007 Results• Luiz Fernando Rolla
Chief Officer for Finance, Investor Relations and Control of Holdings
Strategy ensures sustainable growth• Marcio Araujo de Lacerda
Chairman of the Board of Directors
Contents

http://cemig.infoinvest.com.br 19 / 49
Performance of aquisitions proves the excellence of our investments
Light
Light reflects positively in Cemig’s result
TBE - Transmissoras Brasileiras de Energia : Group of 5 transmission line companies, acquired in 2006.
8,138
2,035
1,105
276
1,077
141
518
68
Revenue Ebidta Net Income Dividends Revenue Ebidta Net
Income Dividends
455
71
382
61
180
29
171
35
TBE
Total
Cemig share
Total
Cemig share

http://cemig.infoinvest.com.br 20 / 49
Electricity sales GWH
Net revenueR$ million
Ebitda R$ million
Debt R$ million Consumers Employees
Total, consolidated 57,892 10,246 4,073 7,639 10,320,832 14,518
Company2007
Cemig GT 31,813 2,666 1,696 3,112 177 2,276
Cemig D 20,694 5,976 1,867 2,752 6,440,085 8,317
RME (25%) 5,791 1,253 254 488 3,880,570 3,627
TBE - 68 61 144 - 58
Others (406) 283 195 1,143 - - (4)
(3) (3)
(2)
(1)
A business portfolio focused on electricity
(1) Includes employees of Cemig holding company.(2) Includes R$ 990 million from FIDC fund.(3) Includes 100% of Light.(4) Net of sales by IPPs (1,853 GWh); and eliminating inter-company (2,259 GWh).
http://cemig.infoinvest.com.br 21 / 49
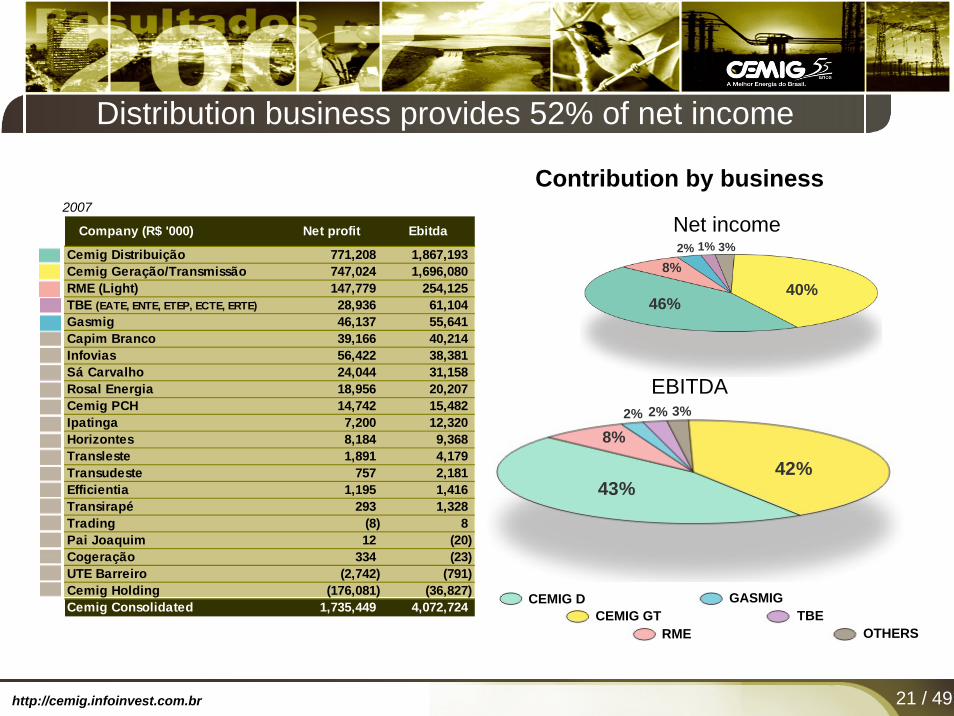
Distribution business provides 52% of net income
Company (R$ '000) Net profit Ebitda
Cemig Distribuição 771,208 1,867,193 Cemig Geração/Transmissão 747,024 1,696,080 RME (Light) 147,779 254,125 TBE (EATE, ENTE, ETEP, ECTE, ERTE) 28,936 61,104 Gasmig 46,137 55,641 Capim Branco 39,166 40,214 Infovias 56,422 38,381 Sá Carvalho 24,044 31,158 Rosal Energia 18,956 20,207 Cemig PCH 14,742 15,482 Ipatinga 7,200 12,320 Horizontes 8,184 9,368 Transleste 1,891 4,179 Transudeste 757 2,181 Efficientia 1,195 1,416 Transirapé 293 1,328 Trading (8) 8 Pai Joaquim 12 (20) Cogeração 334 (23) UTE Barreiro (2,742) (791) Cemig Holding (176,081) (36,827) Cemig Consolidated 1,735,449 4,072,724
EBITDA
CEMIG DCEMIG GT
RME
GASMIGTBE
OTHERS
42%43%
8%2% 2% 3%
40%46%
8%2% 1% 3%
2007Net income
Contribution by business
http://cemig.infoinvest.com.br 22 / 49
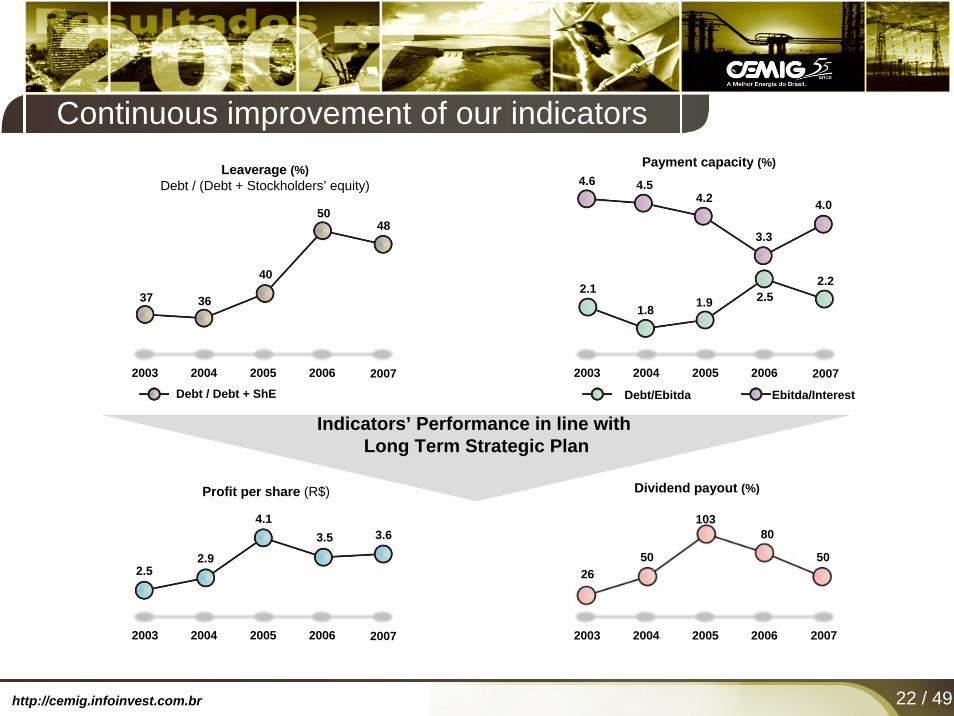
Continuous improvement of our indicators
2003 2004 20062005 2007Debt / Debt + ShE
2650
10380
Ebitda/Interest
Dividend payout (%)
Leaverage (%)Debt / (Debt + Stockholders’ equity)
37 36
40
5048
2.1
1.8 1.9 2.52.2
4.6 4.54.2
3.3
4.0
Payment capacity (%)
Debt/Ebitda
Indicators’ Performance in line with Long Term Strategic Plan
Profit per share (R$)
2.52.9
4.13.5 3.6
2003 2004 20062005 2007
2003 2004 20062005 2007
2003 2004 20062005
50
2007

http://cemig.infoinvest.com.br 23 / 49
Credit quality kept at sufficient levels for a low risk rating over the long term• Moody’s: AA3.br; Fitch: A+.br
Reduction of exposure to FX rate riskExposure in CDI and Selic rates aligned to expectation of reduction of interest rates Introduction of IPCA inflation as indexor (Cemig D Debentures – R$400 million)Transactions in 2007 totaled R$ 1.4 billion
R$/million CEMIG consolidated CEMIG GT CEMIG D
Debt 7.639 3.112 2.752Debt in foreign currency 457 (6%) 120 (4%) 258 (9%)Net debt 5.625 2.210 2.127Ebitda / Interest 4,53Debt / Ebitda 1,96Net debt / (Stockholder's equity + Net debt) 47,66%
(1) Net debt = Total debt – Cash and cash equivalents – Regulatory Asset (RTE/BNDES)
(2) As defined in loan contracts signed with ItaúBBA
OTHERS
5%
71%
DollarURTJCDI/Selic
RGR/Finel
IGP-M
9%3%5%1%5%
(1)(2)
(2)
(2)
1%
IPCA
Indicators show superior credit quality
Indexors usedDebt, consolidated
12/31/2007
http://cemig.infoinvest.com.br 24 / 49
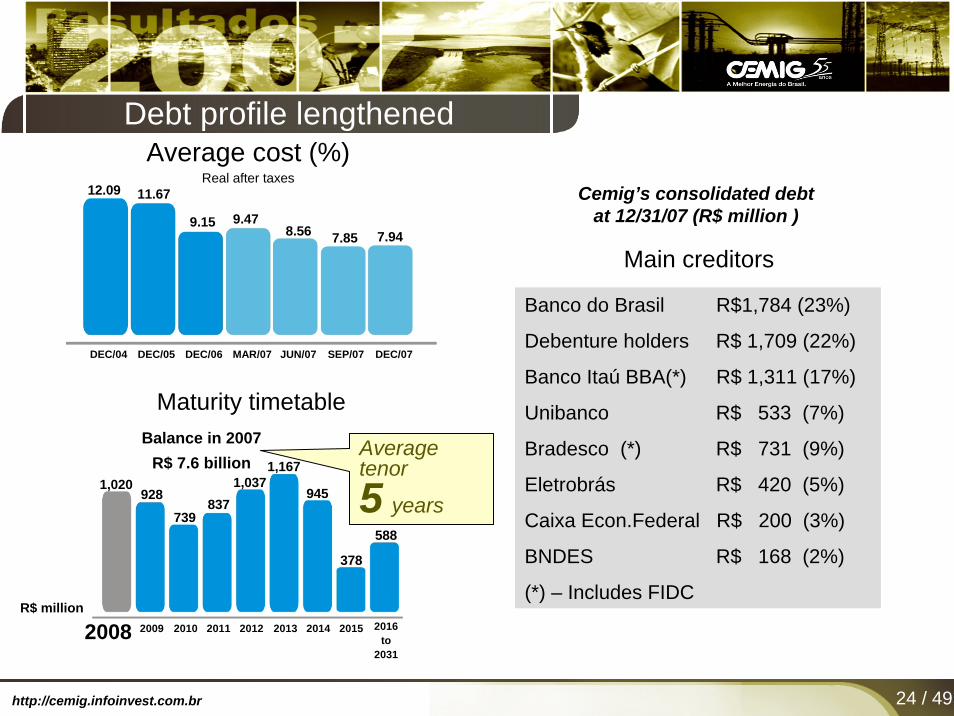
Debt profile lengthened
2008 2009 2010 2011 2012 2013 2014 2015 2016to
2031
1,020928
739837
1,0371,167
945
378
588
Maturity timetable
Averagetenor
5 years
Balance in 2007R$ 7.6 billion
Main creditors
R$ million
Banco do Brasil R$1,784 (23%)
Debenture holders R$ 1,709 (22%)
Banco Itaú BBA(*) R$ 1,311 (17%)
Unibanco R$ 533 (7%)
Bradesco (*) R$ 731 (9%)
Eletrobrás R$ 420 (5%)
Caixa Econ.Federal R$ 200 (3%)
BNDES R$ 168 (2%)
(*) – Includes FIDC
Cemig’s consolidated debtat 12/31/07 (R$ million )
12.09 11.67
9.15 9.478.56 7.85 7.94
DEC/04 DEC/05 DEC/06 MAR/07 JUN/07 SEP/07 DEC/07
Average cost (%)Real after taxes
http://cemig.infoinvest.com.br 25 / 49
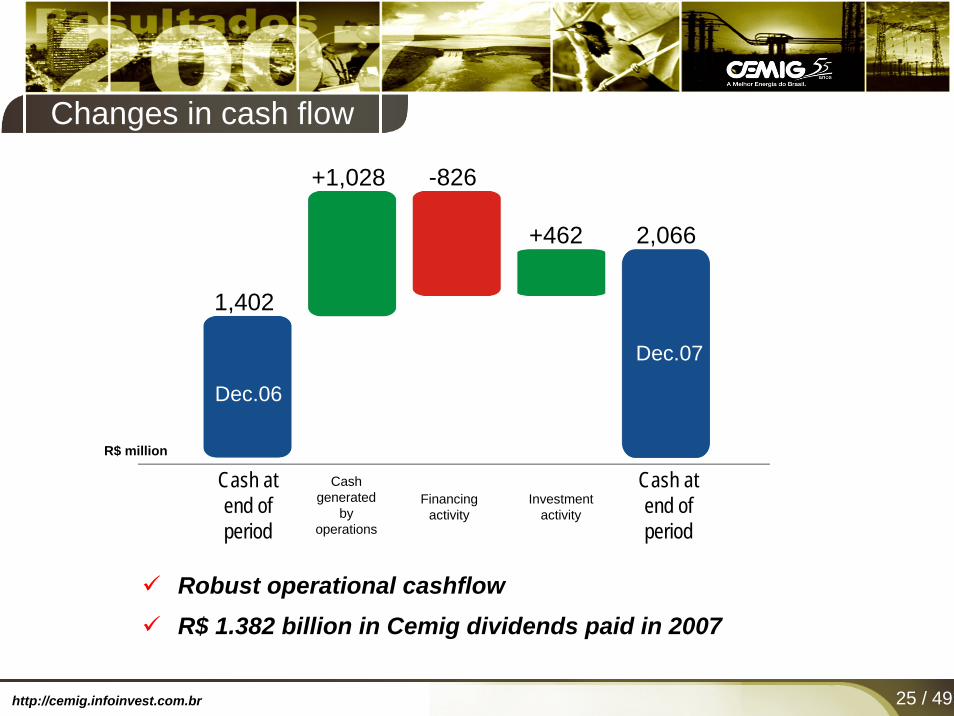
Changes in cash flow
1,402
+1,028 -826
+462 2,066
Cash atend ofperiod
Dec.06
Dec.07
Cash atend ofperiod
Cashgenerated
byoperations
Financingactivity
Investmentactivity
R$ million
Robust operational cashflowR$ 1.382 billion in Cemig dividends paid in 2007
http://cemig.infoinvest.com.br 26 / 49
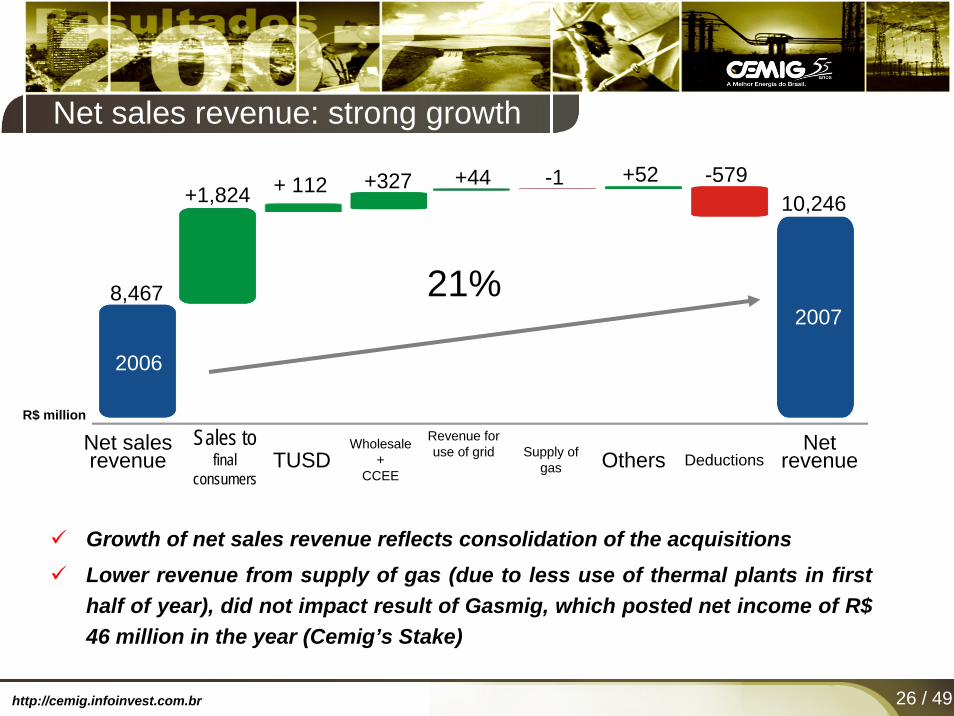
Net sales revenue: strong growth
2006
8,467
+1,824 + 112 +327 +44 -1 +52 -57910,246
20062007
21%
Sales tofinal
consumersTUSD
Wholesale+
CCEE
Revenue for use of grid Supply of
gas Others DeductionsNet
revenue
R$ million
Growth of net sales revenue reflects consolidation of the acquisitionsLower revenue from supply of gas (due to less use of thermal plants in first half of year), did not impact result of Gasmig, which posted net income of R$ 46 million in the year (Cemig’s Stake)
Net salesrevenue

http://cemig.infoinvest.com.br 27 / 49
Consolidated Expenses: Evolution
• Bought energy accounts for 66% of the increase in operational expenses
• Bought energy expenses are passed through to the tariff
5,9176,951
20062007
Consolidated
17%
R$ million
Change in operationalexpenses
66%
34%
R$ 1.034 billion
Other expensesR$ 353 million
EnergyboughtR$ 681 million
Payroll-120
Depreciation106
Grid charges-14
Third parties115
Post-employmentbenefits
-47
Materials12
Royalties-2
Gasfor resale
-4
Operational provisions239
Otherexpenses
68
• Increase in operationalprovisions mainly due to Light consolidation

http://cemig.infoinvest.com.br 28 / 49
Changes on Net income
Net income grows even after the investment in employee profit shares to reduce future payroll expensesNet income adjusted for non-recurring factors and profit shares: 6% growth
1,719
+1,641 -523
-373-306
+27 -96-109 1,735
2006 2007
1%
Non-controllableoperationalexpenses
Controllableoperationalexpenses
Financial revenue
(expenses)
Non-operational
revenue(expenses)
Provision for federal taxes
includingdeferred
Minorityinterests
Net income
R$
mill
ion
-245
Employees’profit shares
6% 2,092
1,974
Net income Net
revenue
Adjusted for non-recurring itemsand profit shares
20072006

http://cemig.infoinvest.com.br 29 / 49
Human capital: alignment with the Strategic PlanPerformance management: compensation linked to business results.
• Company’s adequacy to new industry challenges
• Engaged and stimulated employees
Succession Management Program: involving 752 professionals in management position and 1,800 to assume strategic functions, ensures development of skills necessary to lead the company’s growth.
Technical and Managerial Training investment of R$ 15.5 million ensures operational excellence
Workplace Management: permanent pursuance of better quality standards
Dow Jones Sustainability Index recognizes excellence of our HR• Occupational Health and Safety Index: 100%
• Human Capital Development Index: 100%
• Labor-law Practices Index: 92%
“Proteção Brasil” award 2007: best electricity safety system
• Recognition by companies and specialist professionals for improvement in work, health and safety conditions.

http://cemig.infoinvest.com.br 30 / 49
Progressive reduction in personnel expenses
Nov 2005 Ago 2007 Nov 2007 Jan 2008 Mar 2008
Especial bonuselimination:
16.7%
“Anuenio”elimination
Efficiency programwith
ConsultantsVoluntary
dismissal programBylaws
alteration
Net Revenue
Operational Expenses
Operational Result
Financial Result
Non Operational Result
Earnings Before Income Taxes
Profit Shares
Minority Interests
Net Income
Charges
Salary
Charges
Salary
Anuenio
Bonus
New EmployeeCurrent Employee
http://cemig.infoinvest.com.br 31 / 49
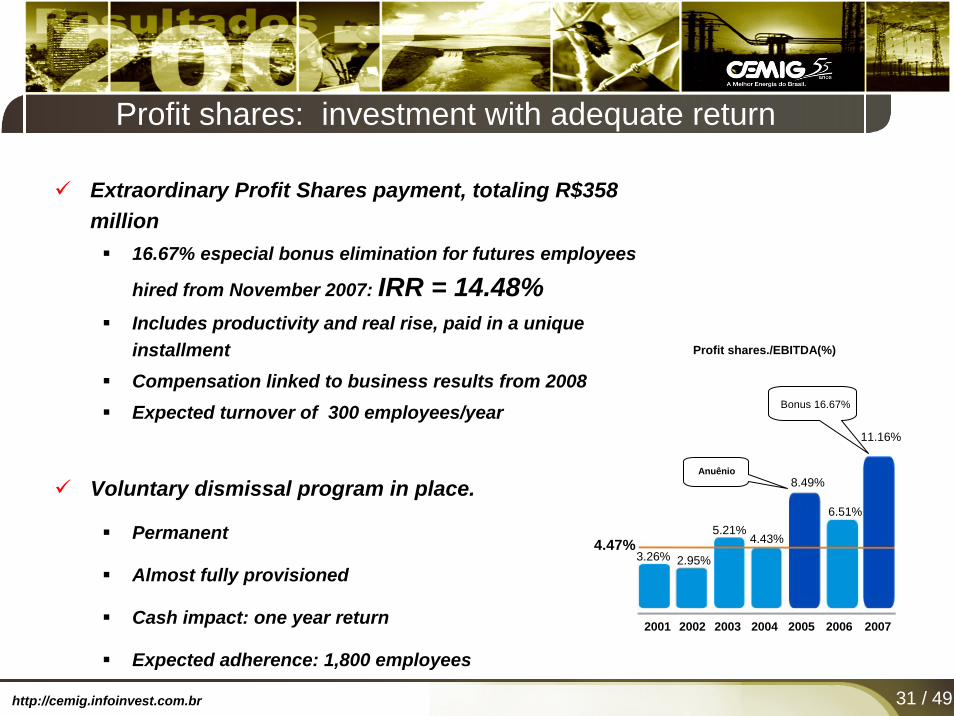
Extraordinary Profit Shares payment, totaling R$358 million
16.67% especial bonus elimination for futures employees
hired from November 2007: IRR = 14.48%Includes productivity and real rise, paid in a unique installmentCompensation linked to business results from 2008Expected turnover of 300 employees/year
Voluntary dismissal program in place.
Permanent
Almost fully provisioned
Cash impact: one year return
Expected adherence: 1,800 employees
Profit shares: investment with adequate return
2002 2003 20052004 2006 2007
4.43%
2.95%
5.21%
3.26%
Profit shares./EBITDA(%)
Anuênio
2001
8.49%
11.16%
6.51%
Bonus 16.67%
4.47%

http://cemig.infoinvest.com.br 32 / 49
Consolidated sales volume (GWh)
Energy volume grew 46% in two years, after Initial Contracts end andLight aquisition on 2006
8,72
5
10,3
04
11,8
88
13,8
51
10,1
49
10,4
37
12,4
44
14,2
48
14,3
19
14,7
70
13,9
22
14,9
52
4,000
1T05 2T05 3T05 4T05 1T06 2T06 3T06 4T06 1T07 2T07 3T07 4T07
Evolução Trimestral
36,5
84
35,9
47 39,6
14
37,8
97
57,8
92
52,2
63
Evolução Anual
2002 2003 2004 2005 2006 2007
30,000
46%
http://cemig.infoinvest.com.br 33 / 49
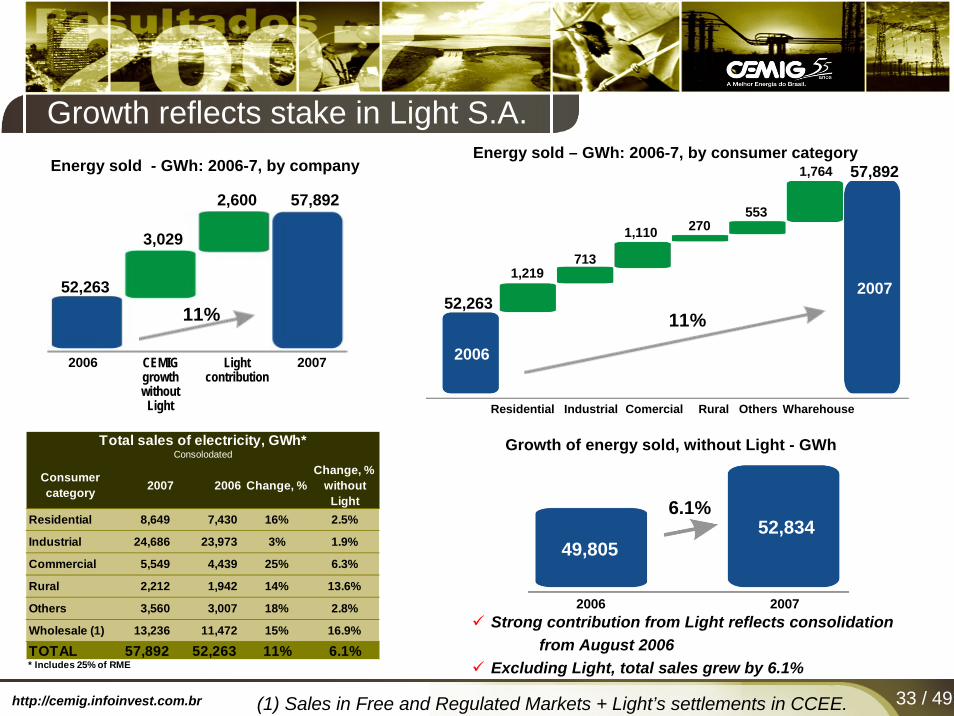
Consumer category 2007 2006 Change, %
Change, % without
LightResidential 8,649 7,430 16% 2.5%
Industrial 24,686 23,973 3% 1.9%
Commercial 5,549 4,439 25% 6.3%
Rural 2,212 1,942 14% 13.6%
Others 3,560 3,007 18% 2.8%
Wholesale (1) 13,236 11,472 15% 16.9%
TOTAL 57,892 52,263 11% 6.1%* Includes 25% of RME
Total sales of electricity, GWh*Consolodated
Growth reflects stake in Light S.A.
CEMIG growthwithoutLight
Light contribution
2007
52,263
3,029
2,600 57,892
11%
1,219
52,263
57,892Energy sold - GWh: 2006-7, by company
713
1,110 270553
1,764Energy sold – GWh: 2006-7, by consumer category
2006
2007
2006
Residential Industrial Comercial Rural Others Wharehouse
49,80552,834
Growth of energy sold, without Light - GWh
6.1%
2006 2007
(1) Sales in Free and Regulated Markets + Light’s settlements in CCEE.
11%
Strong contribution from Light reflects consolidation from August 2006
Excluding Light, total sales grew by 6.1%
http://cemig.infoinvest.com.br 34 / 49
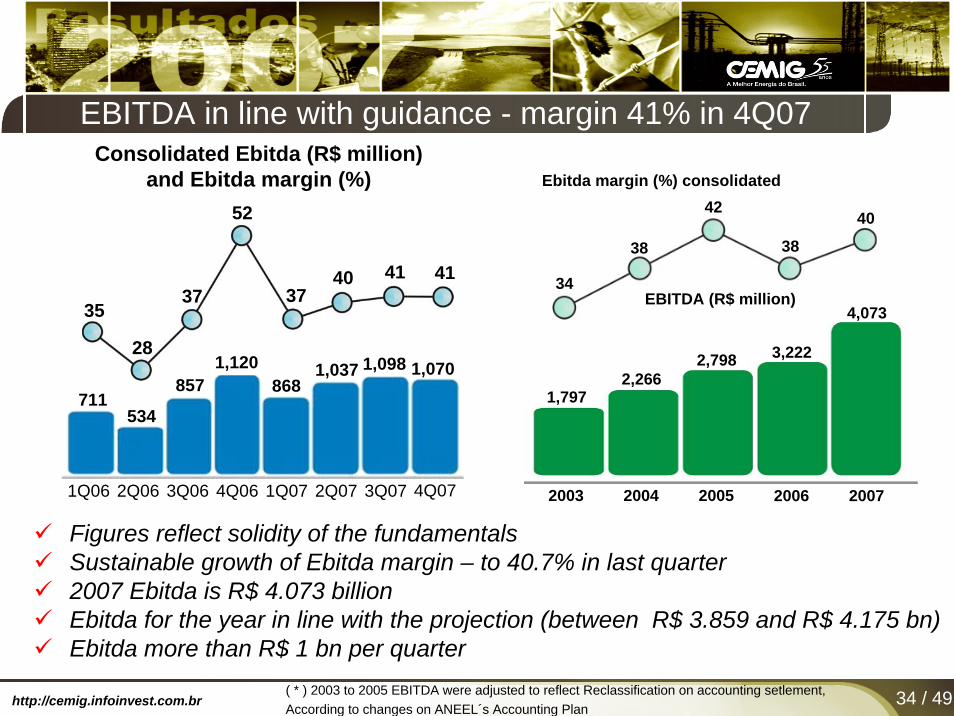
Figures reflect solidity of the fundamentalsSustainable growth of Ebitda margin – to 40.7% in last quarter2007 Ebitda is R$ 4.073 billionEbitda for the year in line with the projection (between R$ 3.859 and R$ 4.175 bn)Ebitda more than R$ 1 bn per quarter
Consolidated Ebitda (R$ million)and Ebitda margin (%)
EBITDA in line with guidance - margin 41% in 4Q07
1Q06 2Q06 3Q06 4Q06 1Q07 2Q07 3Q07 4Q07
Ebitda margin (%) consolidated
EBITDA (R$ million)
2005 20072004 20062003
2,798
4,073
2,2663,222
1,797
4240
38 38
34
( * ) 2003 to 2005 EBITDA were adjusted to reflect Reclassification on accounting setlement, According to changes on ANEEL´s Accounting Plan
35
28
37
52
3740 41 41
711534
8571,120
8681,037 1,098 1,070

http://cemig.infoinvest.com.br 35 / 49
4Q07 Resullts Analysis
Consolidated 4Q07 3Q07 4Q06
Net Revenue 2,627 2,699 2,171 Operational Expenses (1,751) (1,807) (1,244)Operational Results 876 892 927 Depreciation 192 206 193 EBITDA 1,068 1,098 1,120 Financial Results (195) (38) (11)Non Operational Results 23 (14) (24)Provision for Income, Social Contribution, Deferred Income Taxes
44 (279) (71)
Profit Share (455) - (210)Minority Shareholders (27) (14) (5)Net Income 266 547 606
Quarter results impacted by financial results and profit shares
http://cemig.infoinvest.com.br 36 / 49
2,243
+206
+250 -26 +31 -382,666
2006
2007
Net salesrevenue
Sales to final
consumers
Revenue for use of grid
+CCEE Other Deductions
Net sales
revenueWholesale
sales
R$ million
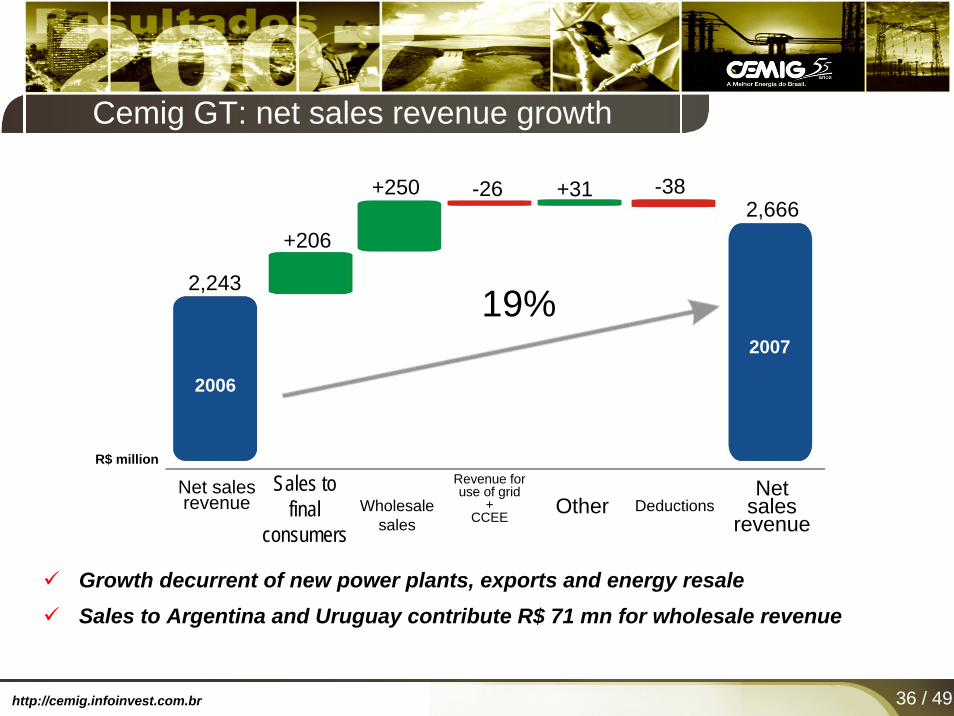
Cemig GT: net sales revenue growth
19%
Growth decurrent of new power plants, exports and energy resaleSales to Argentina and Uruguay contribute R$ 71 mn for wholesale revenue

http://cemig.infoinvest.com.br 37 / 49
Cemig GT: increase in net income
Growth of market boosts net income
614
-129-14 -1 -86
+423
747
2006 2007
R$ million
-60
Net income Net sales
revenueOperationalexpenses
Financial expenses
Non-operationalexpenses
Provision for federal taxes
incl. deferred
Net income
Employeeprofit shares
22%
http://cemig.infoinvest.com.br 38 / 49
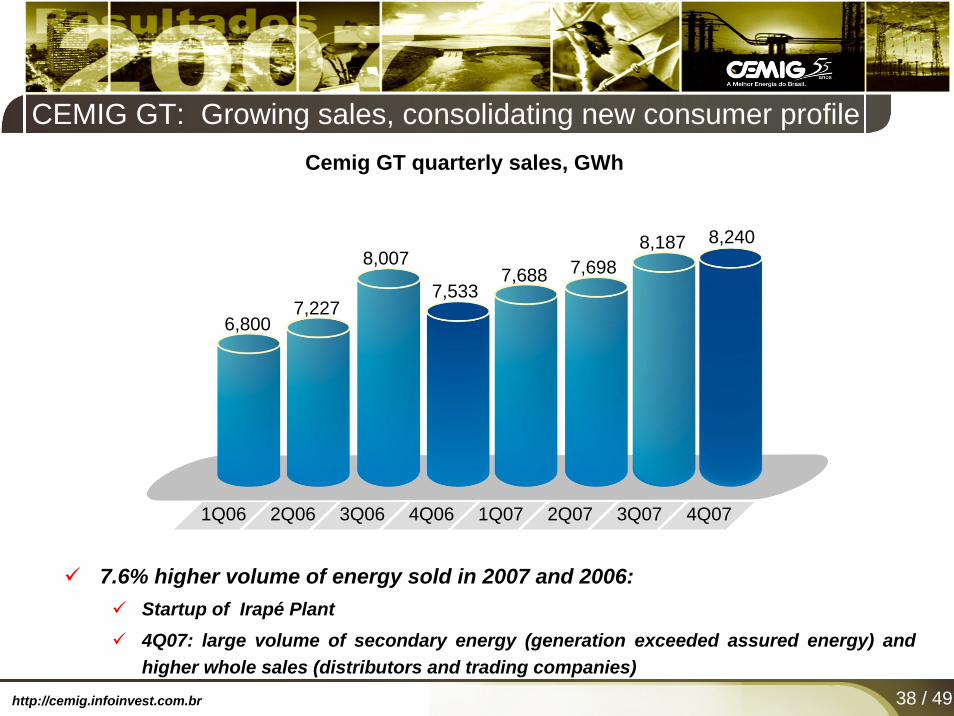
CEMIG GT: Growing sales, consolidating new consumer profile
7.6% higher volume of energy sold in 2007 and 2006: Startup of Irapé Plant4Q07: large volume of secondary energy (generation exceeded assured energy) and higher whole sales (distributors and trading companies)
1Q06 2Q06 3Q06 4Q06 1Q07 2Q07 3Q07
6,8007,227
8,007
7,5337,688 7,698
8,187 8,240
4Q07
Cemig GT quarterly sales, GWh

http://cemig.infoinvest.com.br 39 / 49
Cemig D: increase in net sales revenue
2006
Increase in sales revenue from final consumers due to growth of the market (3.6%) and tariff readjustments of 2006 and 2007
5,419
+582 +60 -37 +12 -60 5,976
2007
Sales to final
consumers
Revenue for use of
distributionnetword
Other DeductionsNet salesrevenue
Wholesale+
CCEE
R$ million
Net salesrevenue
10%
http://cemig.infoinvest.com.br 40 / 49
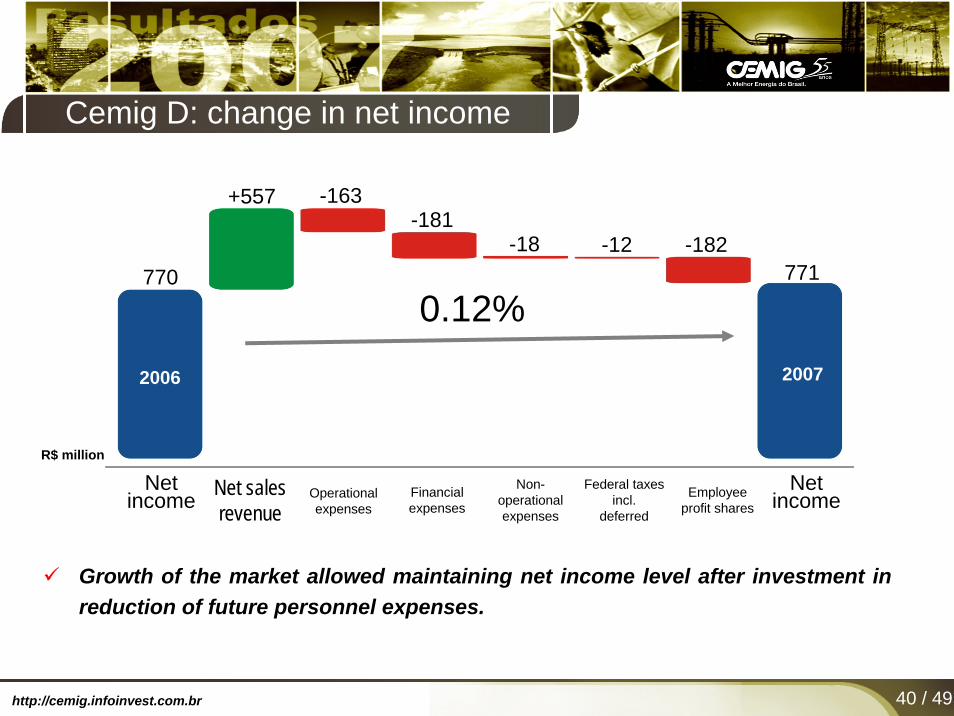
Cemig D: change in net income
Growth of the market allowed maintaining net income level after investment in reduction of future personnel expenses.
770
-163-181
-18 -12
+557
771
2006 2007
0.12%
R$ million
-182
Net income Net sales
revenueOperationalexpenses
Financial expenses
Non-operationalexpenses
Federal taxes incl.
deferred
Net incomeEmployee
profit shares

http://cemig.infoinvest.com.br 41 / 49
Electricity distributed in 2007 grew 4.2% from 2006
Electricity transported for clients and other agents grew 4.8% (TUSD market)
Energy sale to captive market grew 3.6% from 2006.
Cemig D: Sales resume growth after migration of free clients
Cemig DistribuiçãoSales – GWh
1Q05 2Q053Q05 4Q051Q06 2Q06 3Q064Q061Q07 2Q073Q07
5,19
23,
042
5,04
83,
923
5,00
43,
063
5,06
54,
119
5,85
64,
050
5,98
64,
207
5,06
94,
286
5,05
94,
194
4,91
24,
128
5,26
74,
438
5,16
54,
516
Transport marketCaptive market
Total electricity distributed
Sales of elecricity to final consumers(Captive market)
5,19
2
4,85
6
4,91
2
5,04
8
4,98
6
5,26
7
5,00
4
5,06
9
5,16
5
1Q05 1Q06 1Q07 2Q05 2Q06 2Q07 3Q05 3Q06 3Q07 4Q05 4Q06 4Q07
5,06
5
5,05
9
5,35
0
5,35
04,
457
4Q07
2005 2006 2007
http://cemig.infoinvest.com.br 42 / 49
Highlights• Marcio Araujo de Lacerda
Chairman of the Board of Directors
Corporate management and expansion of our business• Djalma Bastos de Morais
Chief Executive Officer
Financial management and 2007 Results• Luiz Fernando Rolla
Chief Officer for Finance, Investor Relations and Control of Holdings
Strategy ensures sustainable growth• Marcio Araujo de Lacerda Chairman of the Board of Directors
Contents

http://cemig.infoinvest.com.br 43 / 49
55 years old: Cemig is operating as a corporation ...
Note: Two companies – Central Hidrelétrica Pai Joaquim S.A. andCentral Termelétrica de Cogeração S.A. – are not included as they are in the process of being wound up.
VS = Voting stockTS = Total stock
40 companies
7 consortia
CIA. ENERGÉTICADE MINAS GERAIS
Capim BrancoEnergia
Consortium21.5%
CEMIGCapim BrancoEnergia S.A.
100%
Usina TérmicaIpatinga S.A.
100%
CEMIG PCH S.A.100%
Horizontes Energia S.A.
100%
Sá Carvalho S.A.100%
Rosal Energia S.A.100%
Usina TermelétricaBarreiro S.A.
100%
Cia. Translestede Transmissão S.A.
25%
Empresa Catarinensede Transmissãode Energia S.A.
7.49%
Empresa Regionalde Transmissãode Energia S.A.
18.35%
Empresa Paraensede Transmissãode Energia S.A.
VS: 25% TS: 18.41%
Empresa Nortede Transmissãode Energia S.A.
18.35%
Empresa Amazonensede Transmissãode Energia S.A.
VS: 25% TS: 16.09%
Cia. Transirapéde Transmissão S.A.
24.5%
Cia. Centroeste Minas de Transmissão S.A.
51%
Cia. Transudestede Transmissão S.A.
24%
Transchile CharrúaTransmissión S.A.
49%
Cia. de Gás deMinas Gerais
55,2%
Centro de GestãoEstratégica de
Tecnologia*100%
Empresa deInfovias S.A.
100%
Efficientia S.A.100%
Cemig Trading S.A.100%
CEMIGGeração e
Transmissão S.A.100%
CEMIG Baguari S.A.100%
HidrelétricaCachoeirão S.A
49%
AHE Funilhydroelectric plant
consortium49%
Igarapavahydroelectric plant
consortium14.5%
Porto Estrelahydroelectric plant
consortium33.33%
Queimado hydroelectric plant
consortium82.5%
Aimorés hydroelectric plant
consortium49%
Baguarihydroelectric plant
consortium34%
Focus Soluções Tecnológicas S.A.
49%
Guanhães Energia S.A.49%
Rio Minas EnergiaParticipações S.A.
25%
Light S.A.52.25%
CEMIGDistribuição S.A.
100%
Light Energia S.A.
100%
LIR Energy Ltd.
100%
Light Serviçosde Eletricidade
S.A.100%
Light Social andUrgan Development
Institute*100%
Light EscoPrest. Serviços
Ltda.100%
Light OverseasInvestments
Ltd.100%
Lightger Ltda.
100%
ItaocaraEnergia Ltda.
100%
Lighthidro Ltda.
100%
Madeira Energia S.A.10%
* Instituto Light de DesenvolvimentoSocial e Urbano
Transmission companiesDistribution companiesGeneration companiesGeneration consortiaFinancial operationsNon-profitGas distributionTelecommunicationsTradingHolding companyServices
Key
* Strategic Technology Management Center
Note: Two companies – Central Hidrelétrica Pai Joaquim S.A. andCentral Termelétrica de Cogeração S.A. – are not included as they are in the process of being wound up.
VS = Voting stockTS = Total stock
40 companies
7 consortia
CIA. ENERGÉTICADE MINAS GERAIS
Capim BrancoEnergia
Consortium21.5%
CEMIGCapim BrancoEnergia S.A.
100%
Usina TérmicaIpatinga S.A.
100%
CEMIG PCH S.A.100%
Horizontes Energia S.A.
100%
Sá Carvalho S.A.100%
Rosal Energia S.A.100%
Usina TermelétricaBarreiro S.A.
100%
Cia. Translestede Transmissão S.A.
25%
Empresa Catarinensede Transmissãode Energia S.A.
7.49%
Empresa Regionalde Transmissãode Energia S.A.
18.35%
Empresa Paraensede Transmissãode Energia S.A.
VS: 25% TS: 18.41%
Empresa Nortede Transmissãode Energia S.A.
18.35%
Empresa Amazonensede Transmissãode Energia S.A.
VS: 25% TS: 16.09%
Cia. Transirapéde Transmissão S.A.
24.5%
Cia. Centroeste Minas de Transmissão S.A.
51%
Cia. Transudestede Transmissão S.A.
24%
Transchile CharrúaTransmissión S.A.
49%
Cia. de Gás deMinas Gerais
55,2%
Centro de GestãoEstratégica de
Tecnologia*100%
Empresa deInfovias S.A.
100%
Efficientia S.A.100%
Cemig Trading S.A.100%
CEMIGGeração e
Transmissão S.A.100%
CEMIG Baguari S.A.100%
HidrelétricaCachoeirão S.A
49%
AHE Funilhydroelectric plant
consortium49%
Igarapavahydroelectric plant
consortium14.5%
Porto Estrelahydroelectric plant
consortium33.33%
Queimado hydroelectric plant
consortium82.5%
Aimorés hydroelectric plant
consortium49%
Baguarihydroelectric plant
consortium34%
Focus Soluções Tecnológicas S.A.
49%
Guanhães Energia S.A.49%
Rio Minas EnergiaParticipações S.A.
25%
Light S.A.52.25%
CEMIGDistribuição S.A.
100%
Light Energia S.A.
100%
LIR Energy Ltd.
100%
Light Serviçosde Eletricidade
S.A.100%
Light Social andUrgan Development
Institute*100%
Light EscoPrest. Serviços
Ltda.100%
Light OverseasInvestments
Ltd.100%
Lightger Ltda.
100%
ItaocaraEnergia Ltda.
100%
Lighthidro Ltda.
100%
Madeira Energia S.A.10%
* Instituto Light de DesenvolvimentoSocial e Urbano
Transmission companiesDistribution companiesGeneration companiesGeneration consortiaFinancial operationsNon-profitGas distributionTelecommunicationsTradingHolding companyServices
KeyTransmission companiesDistribution companiesGeneration companiesGeneration consortiaFinancial operationsNon-profitGas distributionTelecommunicationsTradingHolding companyServices
Key
* Strategic Technology Management Center
http://cemig.infoinvest.com.br 44 / 49
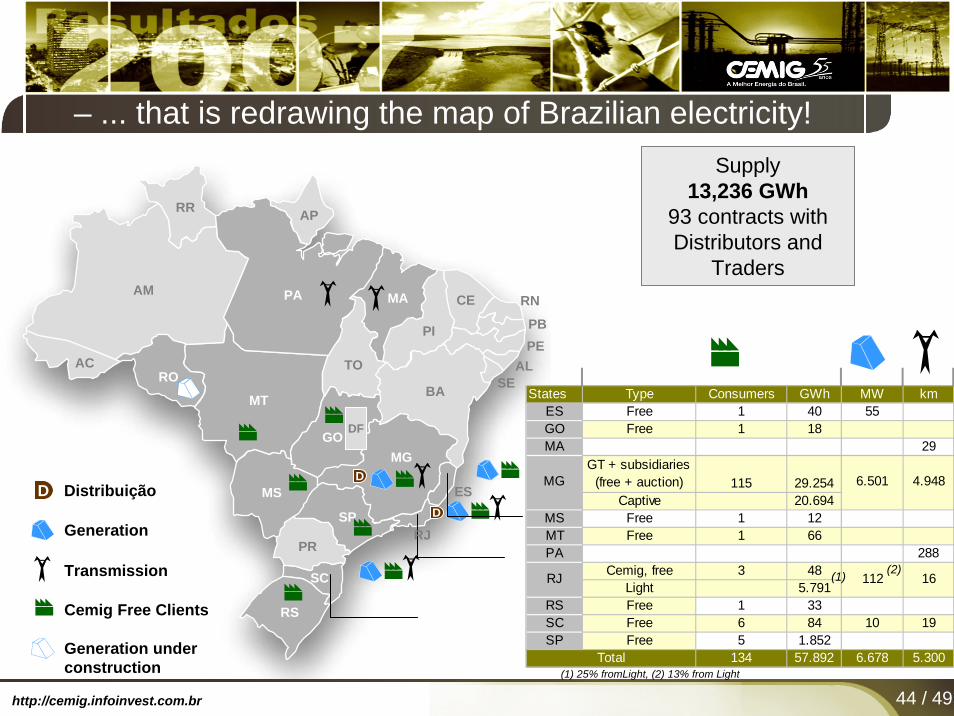
– ... that is redrawing the map of Brazilian electricity!
PB
States Type Consumers GWh MW kmES Free 1 40 55GO Free 1 18MA 29
GT + subsidiaries (free + auction) 115 29.254
Captive 20.694MS Free 1 12MT Free 1 66PA 288
Cemig, free 3 48Light 5.791
RS Free 1 33SC Free 6 84 10 19SP Free 5 1.852
134 57.892 6.678 5.300
4.948
16
6.501MG
Total
112RJ
Supply13,236 GWh
93 contracts with Distributors and
Traders
(1) (2)
(1) 25% fromLight, (2) 13% from Light
Transmission
Cemig Free Clients
Generation
AM
ACRO
PA MA
RR AP
PI
CE RN
PEAL
SEBA
TO
MT
GO DF
MS
SP
PR
SC
RS
ES
RJ
MG
Generation underconstruction
DistribuiçãoDD
D
http://cemig.infoinvest.com.br 45 / 49
R$ 4.3 billion paid as dividends on the last three years
Financial indicators mantained in line with covenants established by our bylaws
Operational Excellence guide costs reduction, taking to higher efficiency gains
Risk management assures confiability to acquisition consolidation
Human capital management modernizes the relation with employees and prepares the company to the new reality of the sector
Tariff Review: repositioning as from April 8
Solidity of fundamentals allows us to grow more

http://cemig.infoinvest.com.br 46 / 49
Commitment with shareholders return assures sustainable growth centered in long term – Strategic Plan in line with Investment Policy
• Aquisition opportunities along 2008
• New concession auctions: Jirau Power Plant and Madeira Complex Transmission System
• Shareholders to approve new limits for kew indicators
Total Assets: R$ 24.3 bilion
Consolidated debt R$ 7.6 bilion
Stockholders’ equity R$ 8.4 bilion
Consolidated net sales revenue (2007) R$ 10.2 bilion
Solidity of fundamentals allows us to grow more
47
Investor Relations
Telephone: (55-31) 3506-5024
Fax: (55-31) 3506-5025
http://cemig.infoinvest.com.br
Aneel: The Brazilian electricity sector is regulated by Aneel, an independent federal regulatory agency.BR GAAP – Accounting Principles Generally Accepted in Brazil.CRC – The Results Compensation Account: Prior to 1993 Brazilian electricity concession holders were guaranteed by law a rate of return on investment in
assets used in the provision of electricity services to clients; rates charged to users were uniform all over the country; and the profits generated by the more profitable concession holders were reallocated to less profitable concession holders, in such a way that the rate of return of all the companies was equal to the national average. The deficits which the majority of the Brazilian electricity concession holders suffered were accounted in the “CRC Account” of each company. When the CRC Account itself, and the concept of guaranteed return, were abolished, the concession holders with positive balances were allowed to set these balances off against amounts owed by them to the federal government.
CCC – The Fossil Fuel Consumption Account: The CCC was created to generate financial reserves to cover the increase in costs associated with greater use of thermal generating plants, in the event of drought: the marginal operational costs of the thermal plants are higher than those of hydroelectric plants. Each energy company is obliged to make an annual contribution to the CCC. The annual contributions are calculated based on the estimates of the cost of fuel consumption by the thermal plants necessary in the subsequent year. CCEE – the Electricity Trading Chamber: Provides the mechanism for transactions in electricity within the Brazilian National Grid system.
CDE – Energy Development Account: This is a source of subsidy created to make alternative sources of energy competitive (e.g. wind energy, or biomass), and to promote the “universalization” of electricity services – their extension to every citizen and location. It is funded from annual payments made by the concession holders for the use of public assets, and penalty payments imposed by Aneel. The CDE will remain in effect for a period of 25 years and will be administered by Eletrobrás.
DEC – Average Customer Outage Duration: In electricity distribution, the average time of outage suffered by consumption units in a given group in the period referred to.
Dividend Yield (dividend per share/share price): The annual return the stockholder receives in the form of dividends and Interest on Equity (per share) calculated as a percentage of the stock price.
FEC – Average Customer Outage Frequency: In electricity distribution, the average number of outages per consumption unit in a given group in the period referred to.
FIDC: A receivables Fund, made up of assets receivable.Ebitda (Earnings Before Interest, Tax, Depreciation and Amortization): Net income before interest (including all items included as financial
revenue/expenses), taxes, depreciation and amortization. This is an expression of operational cash flow, and provides a view of how much a company is generating in cash from its principal business.
Hedge: A mechanism by which holders of asset or liability positions protect themselves from price fluctuations in, e.g., the commodities or FX markets. ( >> continued on next page >> )
Glossary

http://cemig.infoinvest.com.br
Luz no Campo (“Light in the Countryside”): The national rural electrification program, created by the federal government aiming to take electricity to one million rural properties and homes all over Brazil. It is coordinated by the Mining and Energy Ministry, and conducted by Eletrobrás with funds obtained from the Global Reversion Reserve (RGR).
Payout – Percentage of net income distributed as dividends.P/E (Price/Earnings): Ratio between the price of a share and its profit per share.(ShE – Stockholders’ equity)RTE – The “Extraordinary Tariff Recomposition”: This is a tariff adjustment granted in December 2001 to the distributors and generators of the regions
that were under rationing at that time. It is settled in the General Agreement for the Electricity Sector, and resulted in an increase of 2.9% in the tariffs of residential consumers (with the exception of low-income consumers) and rural consumers, and 7.9% for the other consumers. The objective of the adjustment was to restore the losses that distributors and generators of electricity had suffered from the reduction of consumption imposed by the government. The duration of the adjustment varies in accordance with the time necessary for the recovery of the losses of each concession holder.
RGR – Global Reversion Reserve: This is an annual amount included in the costs of concession holders, for generation of funds for expansion and improvement of public electricity services. The amounts are paid monthly to Eletrobrás, which is responsible for administration of the funds, and will also be employed in the Procel program.
RTD – The “Deferred Tariff Adjustment”: Aneel decided the results of the periodic tariff revision of Cemig Distribuição which covers the repositioning of electricity retail supply tariffs at a level compatible with the preservation of the economic-financial equilibrium of the concession contract, providing sufficient revenue to cover efficient operational costs and adequately remunerate investments. The average adjustment applied to Cemig’s tariffs on April 8, 2003, provisionally, was 31.53%, but the final tariff repositioning for Cemig should have been 44.41%. The percentage difference of 12.88% will be compensated through an increase in each of the tariff adjustments planned to occur in 2004 and 2007, cumulatively. The difference between the tariff repositioning to which Cemig Distribuição has the right and the tariff actually charged to consumers is recognized as a Regulatory Asset.
Total return to stockholder – Sum of (change in stock price) and (dividend per share) TUSD – Tariff for Use of the Distribution System: This is paid by generation companies and by Free Consumers for the use of the distribution system of
the distribution concession holder to which the respective generator or consumer is linked, and is revised annually in accordance with the inflation index and the investments made by the distributors in the previous year to maintain and expand the network. The amount to be paid by the user who is linked to the distribution system is calculated by multiplication of the amount of energy contracted with the distribution concession holder for each link point, in kW, on the basis of the tariff in R$/kW which is set by Aneel.
UHE – (“Usina Hidrelétrica”) – Hydroelectric power plant: Electricity generation plant which uses the mechanical energy of water to turn rotors and generate electricity.
UTE – (“Usina Térm(o)Elétrica”) – Thermal generation plant: One in which chemical energy contained in fossil fuels is converted into electricity.WACC – Weighted average cost of capital.