Embed Size (px)
Citation preview

11/29/17
21
Results: Intravenous LPS – Plasma anti-LPS
IgA antibodies41
0.04
0.045
0.05
0.055
0.06
0.065
0.07
0.075
W1D1 W2D1 W3D1 W4 W5 W6
IgA
(M
U/m
L)
Time around parturition (wk)
Plasma IgA in cows around parturition
IV Saline
IV LPS
P
a
r
t
u
r
i
t
i
o
n
Trt P > 0.05
Results: Oral LPS – Plasma anti-LPS IgM
antibodies42
0
0.005
0.01
0.015
0.02
0.025
0.03
0.035
W1D1 W2D1 W3D1 W4 W5 W6
IgM
(M
U/m
L)
Time around parturition (wk)
Plasma IgM in cows around parturition
Oral LPS
Oral Saline
P
a
r
t
u
r
i
t
i
o
n
Trt effect P < 0.01

11/29/17
22
Results: Intravenous LPS – Plasma anti-LPS
IgM antibodies43
0
0.005
0.01
0.015
0.02
0.025
W1D1 W2D1 W3D1 W4 W5 W6
IgM
(M
U/m
L)
Time around parturition (wk)
Plasma IgM in cows around parturition
IV Saline
IV LPS
P
a
r
t
u
r
i
t
i
o
n
Trt P < 0.01
Results: Oral LPS – Plasma anti-LPS IgG
antibodies44
0
0.01
0.02
0.03
0.04
0.05
0.06
0.07
0.08
0.09
W1D1 W2D1 W3D1 W4 W5 W6
IgG
(M
U/m
L)
Time around parturition (wk)
Plasma IgG in cows around parturition
Oral LPS
Oral Saline
P
a
r
t
u
r
i
t
i
o
n
Trt effect P < 0.001Week P < 0.05

11/29/17
23
Results: Intravenous LPS – Plasma anti-LPS
IgG antibodies45
0
0.02
0.04
0.06
0.08
0.1
0.12
W1D1 W2D1 W3D1 W4 W5 W6
IgG
(M
U/m
L)
Time around parturition (wk)
Plasma IgG in cows around parturition
IV Saline
IV LPS
P
a
r
t
u
r
i
t
i
o
n
Trt P < 0.01
TRT P < 0.01
Results: Oral LPS – Plasma calcium46
90
95
100
105
110
115
W1D1 W1D2 W2D1 W2D2 W3D1 W3D2 W4 W5 W6
Ca
lciu
m (
mg
/L)
Time around parturition (wk)
Plasma Ca in cows around parturition
Oral Saline
Oral LPS
P
a
r
t
u
r
i
t
i
o
n
11/29/17
24
Results: Intravenous LPS – Plasma calcium
47
90
95
100
105
110
115
W1D1 W1D2 W2D1 W2D2 W3D1 W3D2 W4 W5 W6
Ca
lciu
m (
mg
/L)
Time around parturition (wk)
Plasma Ca in cows around parturition
IV Saline
IV LPS
P
a
r
t
u
r
i
t
i
o
n
Results: Oral LPS – Plasma insulin48
0.2
0.25
0.3
0.35
0.4
0.45
0.5
0.55
0.6
W1D1 W2D1 W3D1 W4 W5 W6
Insu
lin
(m
g/m
L)
Time around parturition (wk)
Plasma insulin in dairy cows around parturition
Oral LPS
Oral Saline
P
a
r
t
u
r
i
t
i
o
n
Trt effect P < 0.001

11/29/17
25
Results: intravenous LPS – Plasma insulin49
0.2
0.25
0.3
0.35
0.4
0.45
0.5
0.55
0.6
0.65
W1D1 W2D1 W3D1 W4 W5 W6
Insu
lin
(m
g/m
L)
Time around parturition (wk)
Plasma insulin in cows around parturition
IV Saline
IV LPS
P
a
r
t
u
r
i
t
i
o
n
TRT P < 0.01
Milk yield in oral LPS-treated cows50
Milk yield oral group
5
10
15
20
25
30
35
40
45
1 3 5 7 9 11 13 15 17 19 21 23 25 27
Days in milk
Mil
k i
n k
gs
Oral saline
Oral LPS

11/29/17
26
Milk yield in intravenous-LPS treated cows51
Milk yield I/V group
5
10
15
20
25
30
35
40
1 2 3 4 5 6 7 8 9 10 11 12 13 14 15 16 17 18 19 20 21 22 23 24 25 26 27 28
Days in milk
Mil
k y
ield
in
kg
s
I/V saline
I/V LPS
52
Table 3.1 Incidence of postpartal metabolic disorders in the two experimental groups sprayed
orally with saline (control) or saline with lipopolysaccharide from Escherichia coli 0111:B4
(treatment) twice per wk during wk -2, and -1 before calving and 1 wk after calving.
Control Group
Cow number
Clinical disease
Treatment
group Cow number
Clinical disease
2360
2113
2013
2163
2412
2168
2268
2371
307
Off feed 5 day,
Temperature 40oC
Calf dead, Retained
Placenta, Metritis
Twice Mastitis, Off
feed, Temperature 39oC
Off feed 20 d post parturition, Fatty liver
Ketosis 3 d pp
Normal
Normal
Off feed, Treated with
antibiotics
Downer cow, culled
2349
2369
2370
2310
2406
2417
2277
2423
Normal
Normal
Lameness 31 d pp
Mastitis 56 d pp
Normal
Normal
Normal
Normal
Normal
Oral LPS

11/29/17
27
Intravenous LPS – Displaced abomasum and Retained placenta
53
¨ Intermittent iv
administration of LPS
caused high incidence
of LDA and RP
Zebeli and Ametaj, (2011)
Conclusion of Study 1 (Oral LPS)54
¨ Experiment 1
¨ No clinical signs of metabolic diseases during first
month after parturition in cows administered orally
with LPS
¨ More than 50% of cows in control groups had one
or more metabolic diseases
¨ Oral administration of LPS did not affect
concentration of SAA, Hp, anti-LPS IgA, and
insulin; whereas LBP decreased

11/29/17
28
Conclusion of Study 1 (Oral LPS)55
¨ Plasma anti-LPS IgG was lower and IgM higher in
cows treated with oral LPS (primary immune
response triggered)
¨ NEFA and BHBA were lower in cows treated with
oral LPS
¨ Milk production was lower in the first 2 wks after
calving
Conclusion of Study 1 (iv LPS)56
¨ Experiment 2 (iv LPS)
¨ Induced chronic endotoxemia (iv LPS) associated
with greater incidence of Displaced abomasum and
Retained placenta
¨ Intravenous LPS had no effect on SAA, BHBA,
and IgA concentrations
¨ Glucose, lactate, anti-LPS IgM, Ca2+, and insulin in
the plasma decreased
¨ Plasma Hp, LBP, anti-LPS IgG increased

11/29/17
29
Conclusion of Study 1 (Experiment 2)57
¨ Milk production was suppressed in iv LPS treated
cows (Prolactin suppressive effects of LPS)
¨ DMI decreased in iv LPS treated cows
1) To test whether oronasal administration of
LPS prepartum affects health status and milk
production of dairy cows
2) To evaluate whether oral LPS and LTA affect
immunity, metabolism, health status, and
milk yield
Study 2 - Objectives58

11/29/17
30
Mat&Methods: Study 2 – Oronasal LPS
59
Experiment 1 - Oronasal LPS
Animals
q TRT group n = 50 dry off cows
q CTR group n= 50 dry off cows
Treatments
q Dose 1 = 0.01 µg/kg body wt; (d -28)
q Dose 2 = 0.05 µg/kg body wt; (d -25 and -21)
q Dose 3 = 0.1 µg/kg body wt ; (d -18 and -14)
q Doses dissolved in 3 mL of NaCl solution
Controls
q 3 mL of NaCl solution
Route of administration
q Nasal 1/3 and oral 2/3 of the dose
Mat&Methods: Study 2- Oral LPS+LTA60
Animals
� TRT group n = 15 dry off cows
� CTR group n = 15 dry off cows
Treatments
LPS doses
� Dose 1 = 0.01 µg/kg body wt (6.5 µg/cow); (d -28)
� Dose 2 = 0.05 µg/kg body wt (32.5 µg/cow); (d -25 and -21)
� Dose 3 = 0.1 µg/kg body wt (65 µg/cow); (d -18 and -14)
LTA dose� Flat dose (120 µg/animalDoses dissolved in 2 mL of (0.85%) NaCl solution
Controls
� 2 mL of NaCl solution
Route of administration
� Oral

11/29/17
31
Results: Oronasal LPS61
Saliva and vaginal mucus sIgA in oronasal-LPS treated cows
62
11/29/17
32
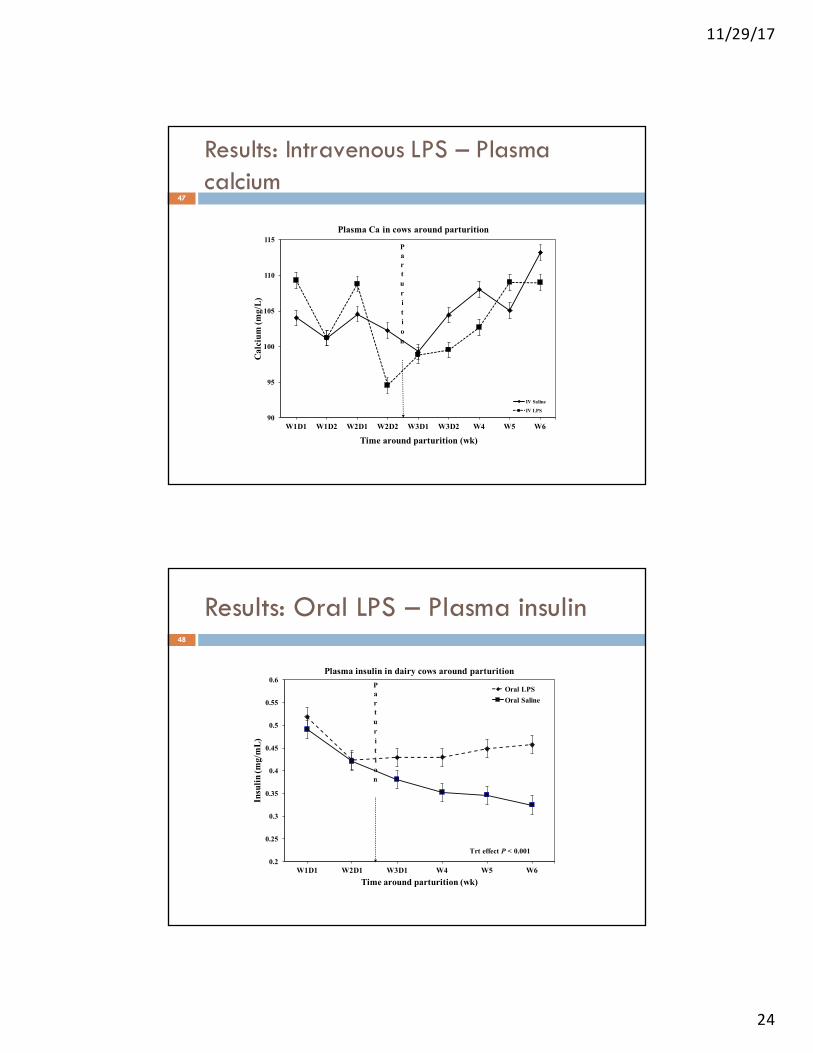
Milk SCC in cows treated oronasally with LPS
63
0
50
100
150
200
250
300
350
400
450
500
1 2 3 4
SC
C,
10
3cell
s/m
L
Week after parturition
Trt P < 0.10Week P = 0.51
Trt þ week P = 0.91
Results: Plasma Acute phase proteins64

11/29/17
33
Results: Clinical observations65
Clinical Observations of cows
Treatment Lameness Retained
placenta
Cows >1
disease
P = 0.24 P = 0.12 P = 0.09
LPS 9 6 4
CTR 15 13 11
Study 2 – Experiment 2/LPS-LTA66
¨ Objective
¤ To test whether oral administration of LPS and LTA before parturition will affect immunity, metabolism,
health status and milk production of dairy cows
11/29/17
34
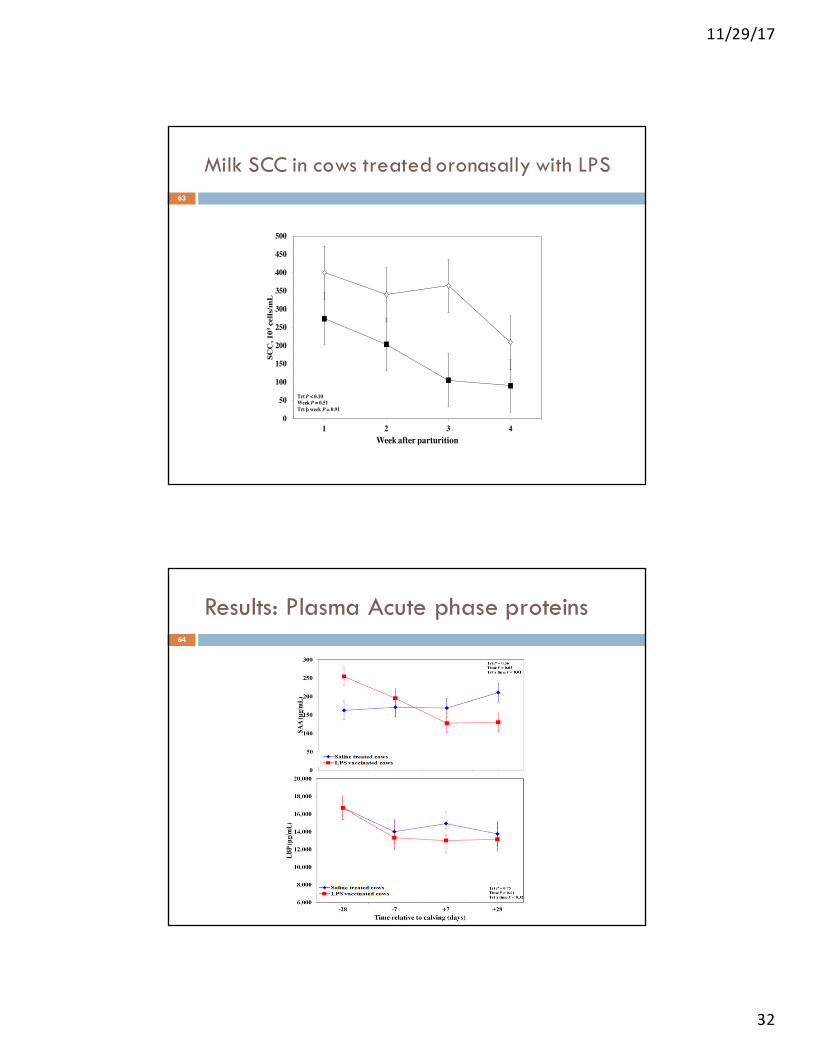
sIgA in the vaginal mucus of cows treated
with oral LPS and LTA67
40.00
60.00
80.00
100.00
120.00
140.00
160.00
180.00
200.00
220.00
240.00
-28 -7 7 28
Va
gin
al m
ucu
s im
mu
no
glu
bu
lin
A (n
g/m
L)
Time relative to calving (days)
TrtP = 0.01
Time P = 0.02
Trt x time P = 0.13
Saliva anti LPS sIgA in cows treated orally
with LPS and LTA68
0.00
2.00
4.00
6.00
8.00
10.00
12.00
14.00
-4 -1 +1 +4
Sa
liv
a I
gA
(n
g/m
L)
Week around parturition
TrtP < 0.01
Week P = 0.04
Trt x week P < 0.01

11/29/17
35
69
0.00
0.02
0.04
0.06
0.08
0.10
0.12
0.14
-4 -1 +1 +4
Imm
un
ogl
ub
uli
n A
(AM
U/m
L)
Week around parturition
TrtP < 0.01
Week P = 0.22
Trt x week P = 0.74
a
0.000
0.005
0.010
0.015
0.020
0.025
-4 -1 +1 +4
Imm
un
olg
ub
uli
n G
(G
MU
/mL
)
Week around parturition
TrtP < 0.01
Week P = 0.13
Trt x week P = 0.75
0.010
0.011
0.012
0.013
0.014
0.015
0.016
-4 -1 +1 +4
Imm
un
ogl
ub
uli
n M
(M
MU
/mL
)
Week around parturition
TrtP < 0.01
Week P = 0.19
Trt x week P = 0.94
b
c
Plasma TNF in cows treated orally with LPS
and LTA70
0.00
0.05
0.10
0.15
0.20
0.25
0.30
0.35
0.40
0.45
-4 -1 +1 +4
TN
F-ɑ
(n
g/m
L)
Week around parturition
TrtP = 0.02
Week P = 0.87
Trt x week P = 0.89

11/29/17
36
Plasma lactate in cows treated orally with
LPS and LTA71
0.0
0.5
1.0
1.5
2.0
2.5
3.0
3.5
4.0
4.5
5.0
-28 -25 -21 -14 -7 7 14 21 28
La
cta
te(m
mo
l/L
)
Time relative to calving (days)
Trt: P < 0.01
Time: P = 0.11
Trt × time: P = 0.36
Plasma NEFA in cows treated orally with LPS and LTA
72
0
50
100
150
200
250
300
350
400
-28 -25 -21 -14 -7 7 14 21 28
NE
FA
(йE
q/L
)
Time relative to calving (days)
Trt: P = 0.36Time: P < 0.01
Trt þ time: P = 0.78
11/29/17
37
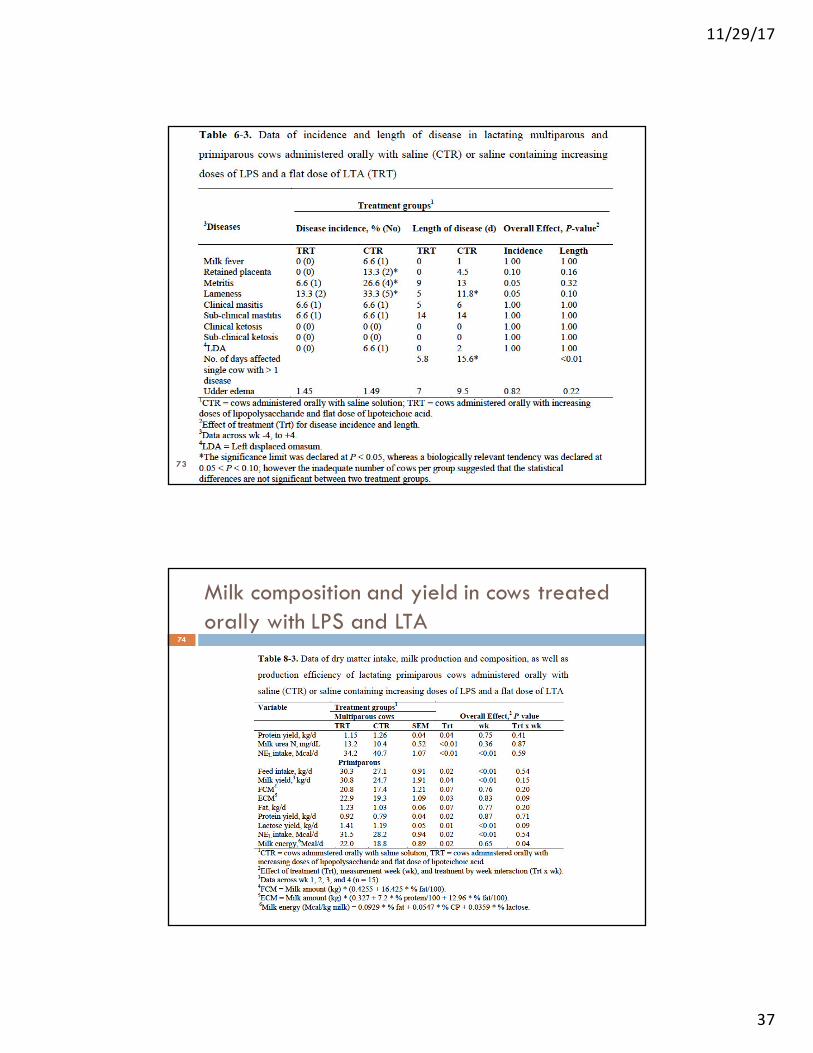
73
Milk composition and yield in cows treated
orally with LPS and LTA74

11/29/17
38
Conclusions75
¨ Oronasal LPS lowered concentrations of glucose in
the plasma and SCC in milk
¨ Increased concentrations of salivary and vaginal
mucus sIgA
¨ Had no effects on plasma concentrations of SAA
and LBP
¨ Tended to lower lameness and RP as well as the
number of cows with more then 1 disease
Conclusions76
¨ Oral LPS+LTA increased salivary and vaginal mucus sIgA
¨ It lowered plasma anti-LPS IgG and IgM as well as TNF-alpha and lactate
¨ It had no effect on plasma anti-LPS IgA and NEFA
¨ Treatment lowered the incidence of RP, lameness and metritis
¨ It lowered the number of days cows were lame and number of diseased days in cows with more than 1 disease

11/29/17
39
Objectives
To evaluate immune responses, health status, and productivity to repeated oral or oro-parenteral exposure to LPS and LTA
Study 3 – Best route and dose of LPS
and LTA77
Materials and methods78
¨ Animals and treatments
• 400 cows randomly assigned to 4 groups (n=50) treated with different doses of LPS and LTA
¨ Cow sample collection• Blood: -4wk to +4wk, once/wk
• Milk: +1wk to +4wk, once/wk
¨ Data collection
• Feed intake: -4wk to +4wk
• Milk yield: 0 to 100 DIM
• Milk composition: CP, fat, lactose, SCC, MUN, and TS
¨ Clinical observation
• Signs of disease and treatment records for cows and calves
• Calf growth: +1wk to +4wk

11/29/17
40
Results - Insulin79
Results - NEFA80

11/29/17
41
Acute phase proteins - LBP81
0
5
10
15
20
25
-4 -1 1 4
LB
P C
on
entr
ati
on
(µ
g/m
L)
Week Relative to Calving
CTR
TRT1
TRT2
TRT3
Trt: P = 0.82
Wk: P < 0.01
Trt x wk: P = 0.01
Acute phase proteins - Haptoglobin82
0
0.05
0.1
0.15
0.2
0.25
0.3
0.35
0.4
0.45
0.5
-4 -1 1 4
Hp
Co
nen
tra
tio
n (
mg
/mL
)
Week Relative to Calving
CTR
TRT1
TRT2
TRT3
Trt: P = 0.27
Wk: P < 0.01
Trt x wk: P = 0.21
11/29/17
42
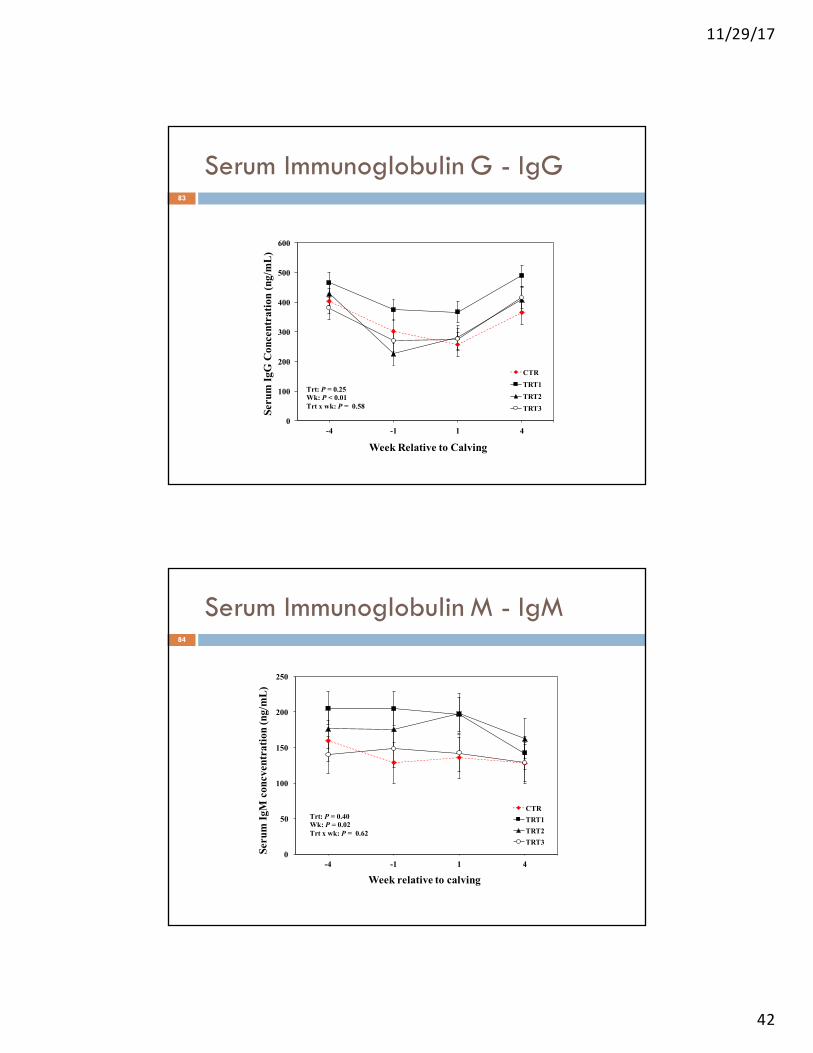
Serum Immunoglobulin G - IgG83
0
100
200
300
400
500
600
-4 -1 1 4
Seru
m I
gG
Co
ncen
tra
tio
n (
ng
/mL
)
Week Relative to Calving
CTR
TRT1
TRT2
TRT3
Trt: P = 0.25
Wk: P < 0.01
Trt x wk: P = 0.58
Serum Immunoglobulin M - IgM84
0
50
100
150
200
250
-4 -1 1 4
Seru
m I
gM
co
ncv
en
tra
tio
n (
ng
/mL
)
Week relative to calving
CTR
TRT1
TRT2
TRT3
Trt: P = 0.40
Wk: P = 0.02
Trt x wk: P = 0.62

11/29/17
43
Serum Interleukin-185
400
450
500
550
600
650
700
-4 -1 1 4
Seu
m I
L-1
co
ncen
tra
tio
n (
pg
/mL
)
Week Relative to Calving
CTR
TRT1
TRT2
TRT3
Trt: P = 0.50
Wk: P = 0.14
Trt x wk: P = 0.27
Conclusions86
¨ Treatments did not trigger systemic inflammation or
influence the normal host metabolism
¨ Treatments decreased the incidence rate of several
periparturient diseases of dairy cows
¨ Two treatments numerically lowered SCC (Somatic
cell count) on the 3rd week of lactation
q Results support the potential utilization of this new
vaccine in dairy cows during the dry off period
11/29/17
44
QUESTIONS
THANK YOU87

![gguo...ò ' ! LPS LBP LPS Bacteria LPS mCD 14 MONOCYTE TNF-A mCD14 ± f_f[jZggucj_p_ilhjfZdjhnZ]h\ - ©magZ_lªebihihebkZoZjb^ EIK ò ' ! LPS LBP LPS Bacteria LPS LBP LPS mCD 14 …](https://img.pdfslide.net/doc/110x75/60e7d4891f692c03dd4a8287/-lps-lbp-lps-bacteria-lps-mcd-14-monocyte-tnf-a-mcd14-ffjzggucjpilhjfzdjhnzh.jpg)