Embed Size (px)
Citation preview

Results Matter. Trust NAG.
Numerical Algorithms GroupMathematics and technology for optimized performance
Numerical Software, Market Dataand Extreme Events
Robert Tong

2
Outline
• Market data
• Pre-processing
• Software components
• Extreme events
• Example: wavelet analysis of FX spot prices
• Implications for software design
3
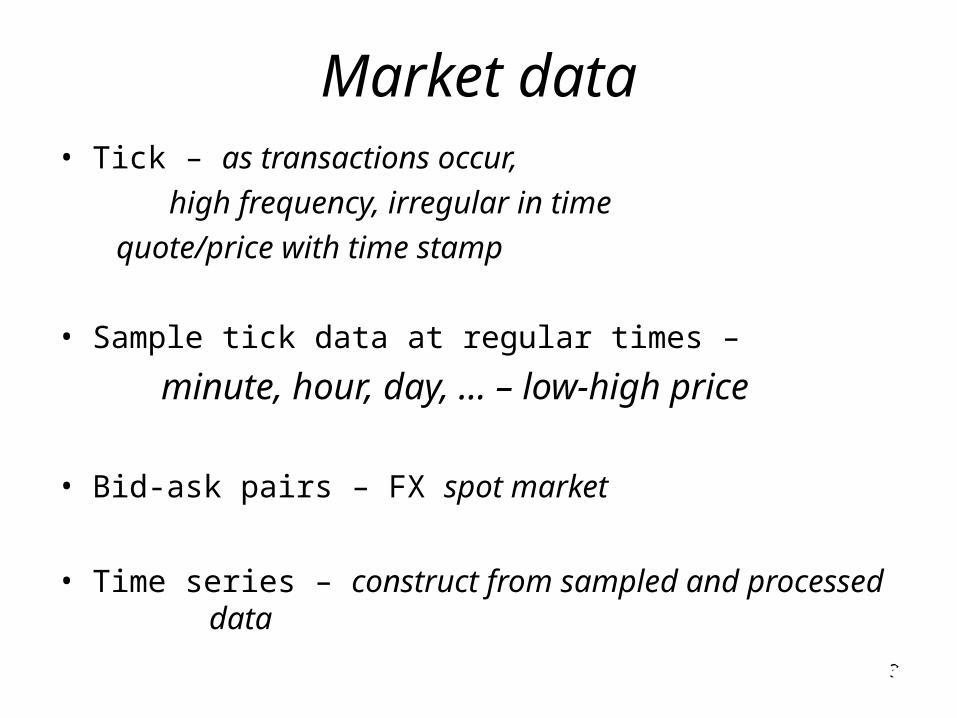
Market data• Tick – as transactions occur,
high frequency, irregular in time
quote/price with time stamp
• Sample tick data at regular times –
minute, hour, day, … – low-high price
• Bid-ask pairs – FX spot market
• Time series – construct from sampled and processed data

4
FX spot market prices - USD-CHF• ticks (e.g. see www.dailyfx.com)
• minutes
• hours
From: www.dailyfx.com/charts

5
Data cleaning
Required to remove errors in data – • inputting errors• test ticks to check system response• repeated ticks• copying and re-sending of ticks• scaling errors
How can false values be reliably identified and rejected ?• what assumptions must be imposed?• elimination of outliers based on an assumed probability
distribution

6
Pre-processing
• Tick data irregular in time – construct homogeneous
time series by interpolation: linear, repeated value• Bid-ask spread – use relative spread• Remove seasonality• Account for holidays
Must not introduce spurious structures to data

7
Software components
Mathematical models
Software components
Data cleaning AnalysisPre-processing
filtering interpolation waveletstransformation

8
Implementation issues
Algorithm design –– Stability– Accuracy– Exception handling– Portability– Error indicators– Documentation
These are independent of the problem being solved

9
Extreme events
• Weather – storm• Warfare – explosion• Markets – crash
Software –How should it respond to the unpredictable?
What is the role of software when its modelling assumptions break down?

10
An illustration – another type of bubble
Underwater explosions are used to destroy ships –
the initial shock is expected and often not as damaging as the later gas bubble collapse.
Left: raw data from sensitive, but un-calibrated pressure gauge
Right: calibrated gauge uses averaging to produce smooth curve
Use of averaging obscures critical event in this case.

11
Example: wavelet analysis of FX spot prices
• Wavelet transforms provide localisation in time and frequency for analysis of financial time series.
• This is achieved by scaling and translation of wavelet basis.
• Decompose time series, by convolution with dilated and translated mother wavelet, or filter,
• Discrete (DWT) Orthogonal Filter pair:
H – high pass, G – low pass
followed by down-sampling
),(tx)(t h

12
Wavelet filtersFamily of filters by scaling
Daubechies D(4) wavelet
filters result from sampling a continuous function
13
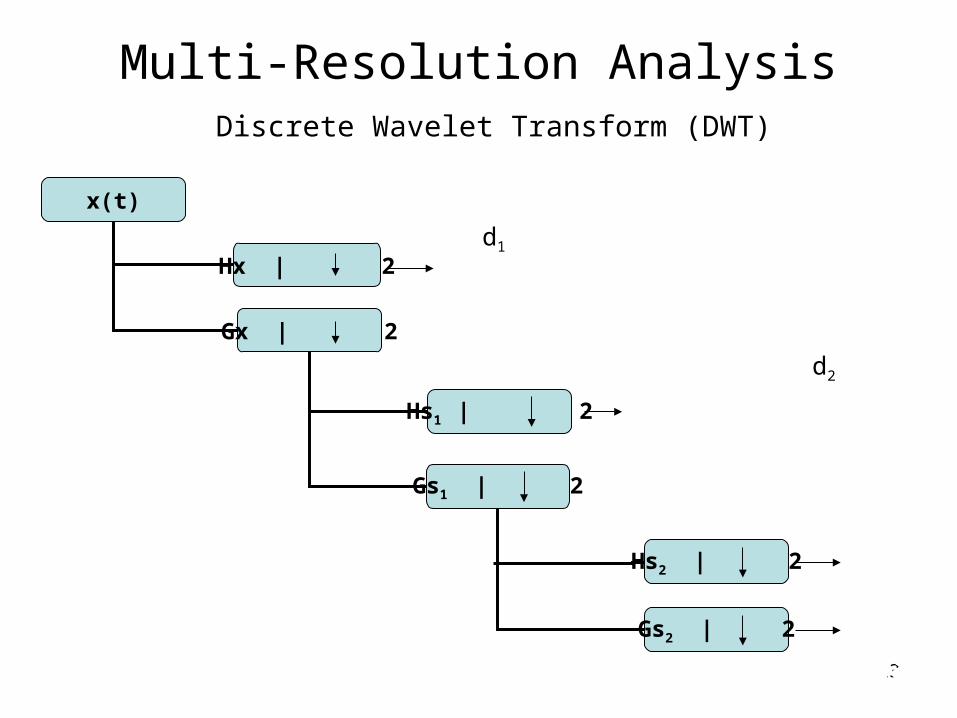
Multi-Resolution AnalysisDiscrete Wavelet Transform (DWT)
d1
d2
x(t)
Hx | 2
Gx | 2
Hs1 | 2
Gs1 | 2
Hs2 | 2
Gs2 | 2

14
DWT implementation
Orthogonal wavelet transform uses • filters defined by sequences: ,• satisfying: ,
,
• This allows for a number of variants in implementation
numerical output from different software providers
is not identical
}{ nh }{ ng
02 jnn
nhh 12 n
nh
nn
n hg 1)1( n
jnn gh 02
15
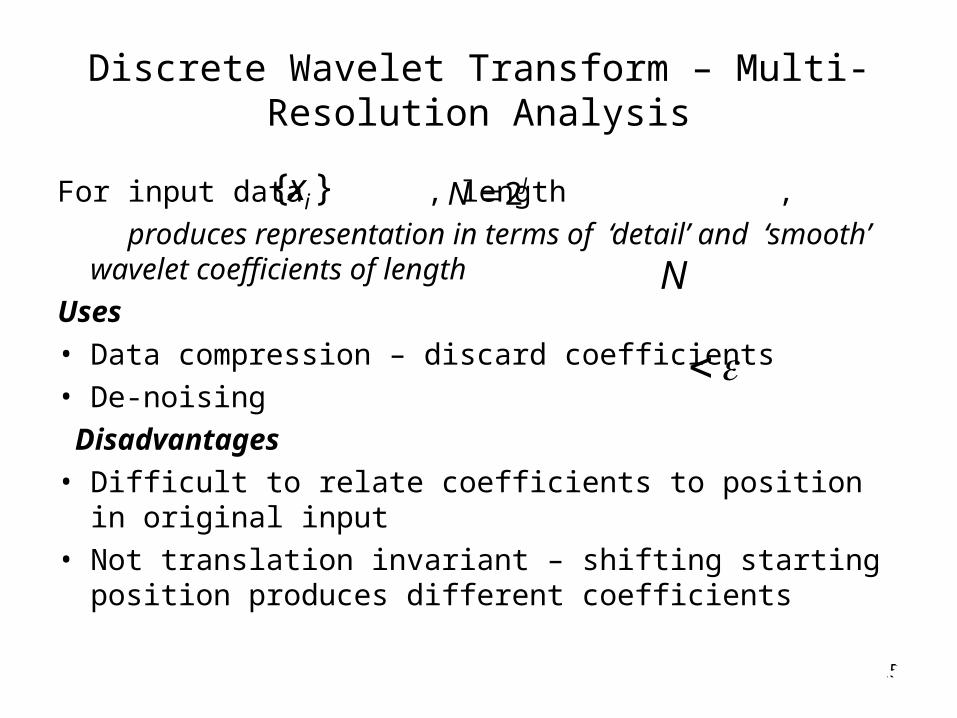
Discrete Wavelet Transform – Multi-Resolution Analysis
For input data , length ,
produces representation in terms of ‘detail’ and ‘smooth’ wavelet coefficients of length
Uses• Data compression – discard coefficients• De-noising
Disadvantages• Difficult to relate coefficients to position in original input• Not translation invariant – shifting starting position
produces different coefficients
}{ ix JN 2
N

16
Maximal Overlap Wavelet Transform (MODWT)(Stationary Wavelet Transform)
• Convolution: wavelet filters as in DWT• No down-sampling• MRA produces N coefficients at each level• Requires more storage and computation• Not orthonormal
Advantages • Translation invariant• Can relate to time scale of original data• Does not require length(x) = J2
17
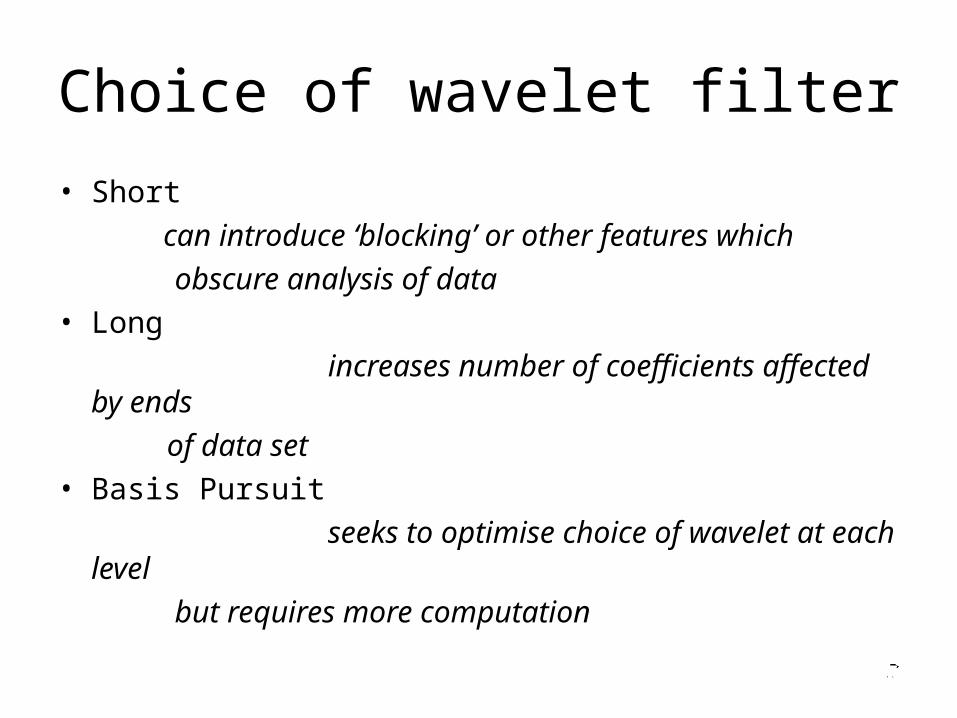
Choice of wavelet filter
• Short
can introduce ‘blocking’ or other features which
obscure analysis of data• Long
increases number of coefficients affected by ends
of data set• Basis Pursuit
seeks to optimise choice of wavelet at each level
but requires more computation

18
FX: USD, GBP, EUR – NZD12 noon buying rates, Jan – Jul 2007
19
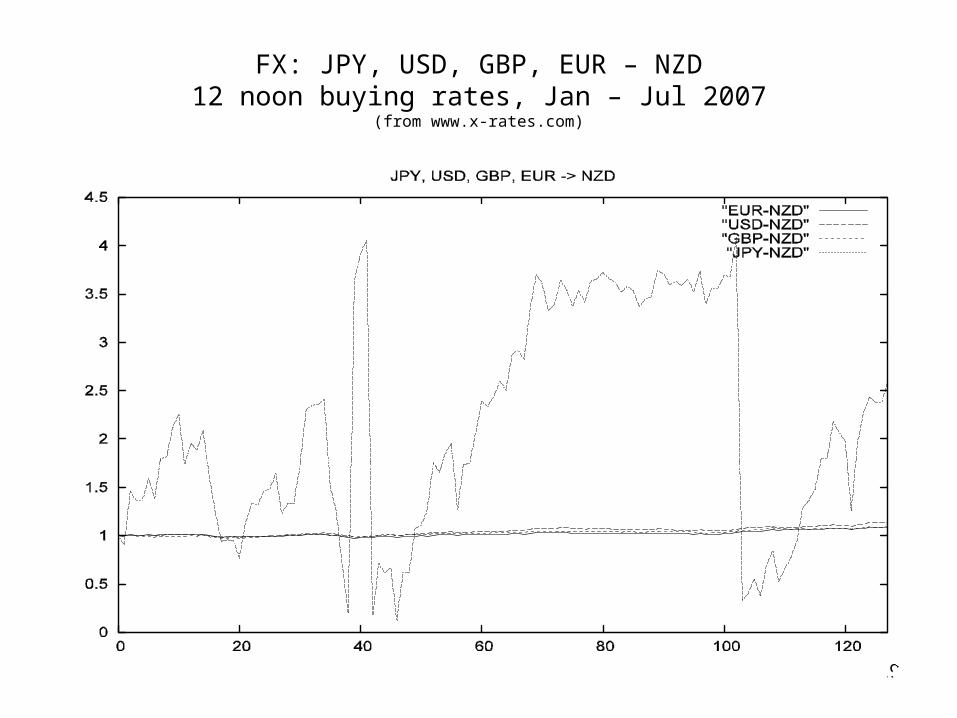
FX: JPY, USD, GBP, EUR – NZD12 noon buying rates, Jan – Jul 2007
(from www.x-rates.com)

20
JPY-NZD, LA(8), MODWT(includes boundary effects)
x(t)
d1
d2
d3
d4

21
JPY-NZD, LA(8) MODWT (includes boundary effects)
x(t)
d5
d6
s6

22
Boundary conditions – end extension
• Wavelet transform applies circular convolution to data• What happens at the ends of the data set?• End extension techniques –
periodic
reflection – whole/half-point
pad with zeros• Boundary effects contaminate wavelet coefficients
software should indicate where output is
influenced by end extension

23
End extension
Periodic Whole-point reflection

24
USD-NZD, Haar, MODWT
Periodic end extension
Level 1 detail coefficients Level 2 detail coefficients

25
USD-NZD, Haar, MODWT(end effects removed)
x(t)
d1
d2
d3

26
USD-NZD, Haar MODWT (end effects removed)
x(t)
d4
d5
d6
s6
27
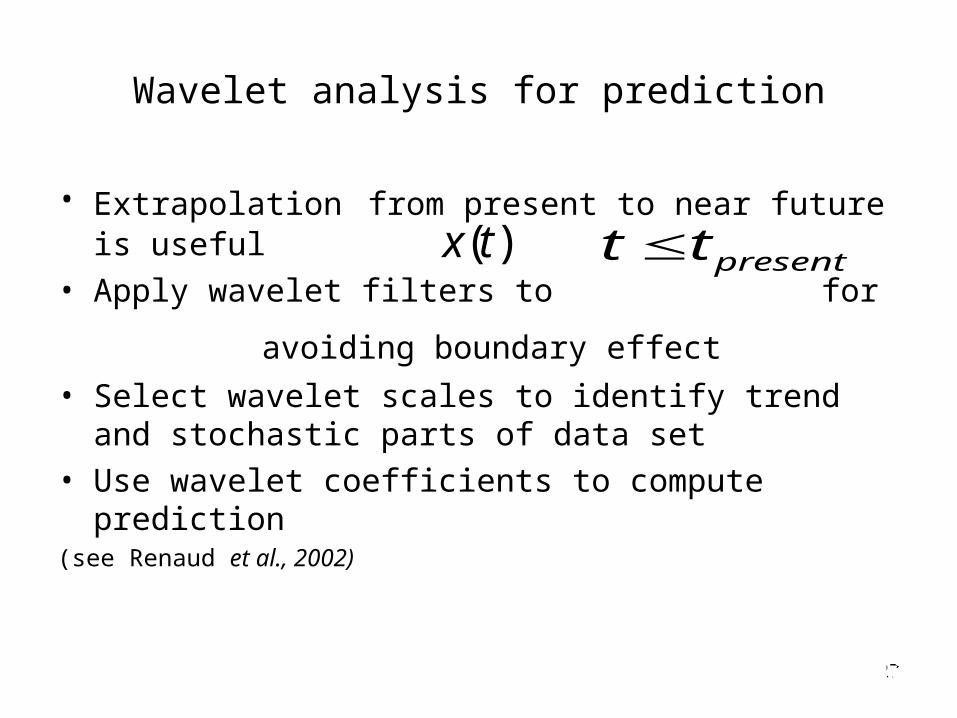
Wavelet analysis for prediction
• Extrapolation from present to near future is useful
• Apply wavelet filters to for
avoiding boundary effect
• Select wavelet scales to identify trend and stochastic parts of data set
• Use wavelet coefficients to compute prediction(see Renaud et al., 2002)
)(tx presenttt

28
Implications for software development
• Reproducibility is desirable – algorithms precisely defined to allow independent implementations
to produce identical results
• Edge effects – contaminate ends of transform for finite signals – software must indicate coefficients affected
• Smoothing/averaging –software should indicate when underlying assumptions likely to be invalid
• Pre-processing – ensure that structure is not introduced by interpolation to give
homogeneous data set

29
Implications for software development
• For extreme events –
must not obscure or remove data relevant to critical events by averaging, smoothing, filtering.