Embed Size (px)
Citation preview

Crossley Farm Superfund Site 2008
Baseline survey of the Fish Community
Benthic Macroinvertibrate Community Water Temperature and Water Chemistry
Of the West Branch Perkiomen Creek Berks County, Pennsylvania
Submitted August 2009

Results of the 2008 Baseline Survey of the Fish Community, Benthic Macroinvertebrate Community, Water Temperature and Water Chemistry of the West Branch Perkiomen Creek, Berks County, Pennsylvania
August2009
Prepared By:
Frank Borsuk Greg Pond Kelly Krock
, U.S. Environmental Protection Agency 1060 Chap line Street, Suite 303 Wheeling, WV 26003 304-234-0241 (phone) 304-234-0260 (fax)

1.0 2.0 3.0 4.0 5.0
5.1 5.2 5.3 5.4 5.5 5.6 5.7
6.0 6.1 6.2 6.3 6.4 6.5 6.6 6.7
7.0 7.1 7.2 7.3 7.4 7.5 7.6 7.7
8.0 9.0 Appendix A Appendix B
Table of Contents
Executive Summary......................................................................... 1 Project Description.......................................................................... 2 Monitoring Design and Rationale . . .. . .. .. . . .. . .. . .. .. . . .. . .. . .. . .. . .. . .. . .. . .. . .. . .. . .. .. 3 Monitoring Parameters and their Frequency of Collection . . . . . . . . . . . . . . . . . . . . . . . . ... 8 Methods and Parameter Table .. .. . .. . .. .. . . .. . .. . .. . .. . .. . .. . .. . .. . .. .. . . .. . .. . ............. 8 In-Situ Physical/Chemical Parameters . . . . . . . . . . . . . . . . . . . . . . . . . . . . . . . . . . . . . . . . . . . . . . . . ... 9 Physical Habitat Evaluations . . .. . .. . .. .. . .. . .. . . .. . .. . .. . .. . .. .. .. .. .. .. .. .. .................. 9 Continuous Water Temperature Monitoring .................................. .......... 9 Fish Surveys ....................................................................... , . . . . . .. .. 9 Benthic Macro invertebrate Surveys . . . . . . . . . . . . . . . . . . . . . . . . . . . . . . . . . . . . . . . . . . . . . . . . . . . . . . 11 Water Chemistry Surveys . . . . . . . . .. . .. . .. . .. . . . . .. . . . . . . . . . . . . . . . . . . . .. . . . . .. .. .... .. .. .... .. . 11 Flow Discharge Surveys . . . . . . . . . . . . . . . . . . . . . . . . . . . . . . . . . . . . . . . . . . . . . . . . . . . . . . . . . . . . . . . . . . 11 Results . . .. . ... .. . .. . .. . .. .... .. ...... .... ............ .. .... .. . .. . ... .. . .. . ... ... .. . .. . .. ..... 11 In-Situ Physical/Chemical Parameters . . . . . . . . . . . . . . . . . . . . . . . . . . . . . . . . . . . . . . . . . . . . . . . .... 12 Physical Habitat Evaluations............................................................... 12 Continuous Water Temperature Monitoring ............................................ 14 Fish Surveys . . . . . . . . . . . . . . . . . . . . . . . . . . . . . . . . . . . . . . . . . . . . . . . . . . . . . . . . . . . . . . . . . . . . . . . . . . . . . . . . . 22 Benthic Macroinvertebrate Surveys . . . . . . . . . . . . . . . . . . . . . . . . . . . . . . . . . . . . . . . . . . . . . . . . . . . . . . 25 Water Chemistry Surveys . . . . . . . . . . . . . . . . . . . . . . . . . . . . . . . . . . . . . . . . . . . . . . . .. .. .. .. .. .. .. ...... .. . 28 Flow Discharge Surveys ................................................ :. .. .. .. .. . .. . .. . . 29 Discussion . . . . . . . . . . . . . . . . . . . . . . . . . . . . . . . . . . . . . . . . . . . . . . . . . . . . . . . . . . . . . . . . . . . . . . . . . . . . . . . . .. . 31 In-Situ Physical/Chemical Parameters .. . .. . .. .. .. . . .. .. . . .. . .. . .. . .. . .. .. . . .. . .. .. . . .. .. 31 Physical Habitat Evaluations . . . . . . . . . . . . . . . . . . . . . . . . . . . . . . . . . . . . . . . . . . . . . . . . . . . . . . . . . . . . . . 31 Continuous Water Temperature Conditions . . . . . . . . . . . . . . . . . . . . . . . . . . . . . . . . . . . . ... . . . . . . . 31 Fish Surveys ......................................................... ·........................ 32 Quality ofthe Benthic Macroinvertebrate Community................................ 32 Water Quality Conditions . .. . . .. . .. .. . . .. .. . .. . .. . . .. . .. . .. . .. . .. .. .. .. .. .. ...... .............. 33 Flow Discharge Conditions ....... :............................................................. 33 Conclusions . . . . . . . . . . . . . . . . . . . . . . . . . . . . . . . . . . . . . . . . . . . . . . . . . . . . . . . . . . . . . . . . . . . . . . . . . . . . . . . . . . 33 References . . . . . . . . . . . . . . . . . . . . . . . . . . . . . . . . . . . . . . . . . . . . . . . . . . . . . . . . . . . . . . . . . . . . . . . . . . . . . . . . . .. . · 34 Tables & Figures Brown Trout Data .. .. .. .. . . .. .. .. .. .. .. .. .. .. .. .. .. .. .. .. .. .. . .. .... 35 Macro invertebrate Taxa List . . . . . . . . . . . . . . . . . . . . . . . . . . . . . . . . . . . . . . . . . . . . . . . .. .......... ....... 40

l.OExecutive Summary
The purpose of this study was to establish baseline condition assessments of the fish community with a focus on the brown trout fishery, benthic macroinvertebrate community, water temperature regime and water quality conditions of the West Branch Perkiomen Creek (WBPC) upstream and downstream of the Crossley Farm Superfund Site and Bally Superfund Site. The study was requested by the USEP A Region ill Biological Technical Assistance Group (BTAG) to inform remediation and treatment decisions at both Superfund sites. We collected data in the Spring and Summer of 2008 to exazp.ine the fish community, benthic macro invertebrate community, water temperature regime and water quality conditions at monitoring sites located in West Branch Perkiomen Creek both upstream and downstream of the Crossley Farm and Bally Groundwater Superfund sites in addition to a site on an unnamed tributary selected to receive treated groundwater from the Crossley Farm Superfund site. The section of the West Branch Perkiomen Creek upstream of the community of Bally, Pennsylvania is classified as an Exceptional Value Cold Water Fishery (EV -CWF) Stream by the Commonwealth of Pennsylvania.
The baseline survey indicates that the West Branch Perkiomen Creek support a high quality brown trout (Salmo trutta) fishery (Class A/Class B) along with other coolwater/coldwater native fish species and a high quality benthic macroinvertebrate community. The West Branch Perkiomen Creek is not limited by physical habitat or water quality conditions; however, current summer/fall water temperature conditions are approaehing or exceeding published temperature criteria for preference, tolerance and mortality of adult brown trout. Additional thermal inputs from any sources must be evaluated to avoid potential impairment of the brown trout fishery, as well as other coolwater/coldwater fish species.
Page 1 of40

2.0 Project Description
The USEP A Region III Biological Technical Assistance Group (BTAG) requested that the Environmental Assessment Innovation Division (EAID) Freshwater B.iology Team complete a baseline survey of the fish community, benthic macroinvertebrate community and water temperature regime ofthe West Branch Perkiomen Creek and the unnamed tributary identified to receive treated groundwater from the Crossley Farm and Bally Groundwater Superfund sites in Berks County, Pennsylvania. Tetra Tech, Inc. completed the collection of the water chemistry and flow assessment components of the project which were incorporated into this report. BTAG deployed and recovered the HOBO continuous water temperature monitors during the April 2008 to November 2008 time period and the November 2008 to April 2009 time period for the survey and the information was incorporated into the report. The baseline surveys were requested to inform remediation and treatment decisions at both Superfund sites in response to the existing aquatic resources.
The USEP A plans to install pump-and-treat treatment facilities at the Crossley Farm and the Bally Groundwater Superfund sites. The proposed treated groundwater discharges may have the potential to affect the thermal regime of the West Branch Perkiomen Creek which in turn may have an effect on the biological communities. The main objective of the study was to establish a baseline condition assessment of the fish community, benthic macroinvertebrate community, water quality conditions and water temperature regime of the West Branch Perkiomen Creek at locations associated with the Crossley Farm and Bally Groundwater Superfund sites prior to the installation of any treatment facilities. A secondary objective was to compare the 2008 brown trout survey results to the Pennsylvania Fish & Boat Commission (P AFBC) historical data from two historic monitoring locations on the West Branch Perkiomen Creek.
The Commonwealth ofPennsylvania designated the West Branch Perkiomen Creek as a cold water fisheries (CWF) and an exceptional value (EV) stream upstream ofthe community of Bally, Pennsylvania. The proposed Crossley Farm treated groundwater discharge and the Bally treated groundwater discharge would occur within the designated EV stream reach. The majority ofland use for all monitoring sites is forest (~40%), followed by cropland (~20%) and old fields (~20%). The remaining land use is distributed between pasture, commercial and residential (~5% each).
The objective was met by completing baseline surveys at seven established monitoring stations (six stations on the mainstem of West Branch Perkiomen Creek and one on the unnamed tributary selected to receive treated groundwater from the Crossley Farm site). Continuous temperature monitors were deployed at all seven monitoring stations. Benthic macroinvertebrate surveys, habitat assessments, in-situ water chemistry and laboratory water chemistry samples were collected at all seven monitoring stations. Fish surveys were completed at five mainstem monitoring stations. Fish surveys were not completed on the unnamed tributary due to on-site conditions (i.e., small stream size and dense overhanging vegetation conditions). These on-site conditions limited access to the stream and the small stream size(< 1 meter wide). In addition, the mainstem station immediately upstream of the unnamed tributary (WBPC-3) was not sampled for fish due to being in close proximity to WBPC-1 which was designated as the representative upstream location for the Crossley Farm site.
Page 2 of40

3.0Monitoring Design and Rationale
This project used a basic before-after control-impact (BACI) design for both the Crossley Farm and Bally Groundwater Superfund Sites. Monitoring stations WBPC-1, 3, 4 and 5 were established for the Crossley Farm Groundwater Superfund Site. Monitoring stations WBPC-2, 6 and 7 were established for the Bally Groundwater Superfund Site. The 'before' bioassessment surveys were completed in July 2008 and the baseline temperature data was collected from April 2008 to April 2009.
For the Crossley Farm Superfund Site, two control sites (WBPC-1 and WBPC-3) were established upstream of the unnamed tributary associated with the Crossley Farm property. Two control stations were used because we wanted to take advantage of the established long-term Pennsylvania Fish & Boat Commission's Brown Trout Survey Site (P AFBC 0201) located on the West Branch Perkiomen Creek (WBPC-1). In addition, we added WBPC-3 (fish survey was not completed at this site) as an upstream control site which was located directly upstream of the confluence of the unnamed tributary because it was located closer to the proposed treated groundwater discharge. WBPC-4 is the designated downstream site and is located downstream of the confluence of the unnamed tributary and West Branch Perkiomen Creek. Duplicate temperature monitors were deployed at WBPC-3 and WBPC-4 in order to evaluate any potential in-stream water temperature differences.
For the Bally Groundwater Superfund Site, two control sites (WBPC-2 and WBPC-7) were established upstream of the Bally Groundwater Superfund Site. Two control stations were designated because we wanted to take advantage of the established long-term Pennsylvania Fish & Boat Commission's Brown Trout Survey Site (PAFBC 0202) located on the West Branch Perkiomen Creek (WBPC-2). In addition, we added WBPC-7 as an upstream control site which was located upstream of the proposed treated groundwater discharge. WBPC-7 is located closer to the proposed discharge. WBPC-6 is the designated downstream location and located downstream of the proposed discharge from the Bally Groundwater Superfund treatment facility. Detailed monitoring site descriptions are provided in Table l and Figure 1.
Page 3 of40

table t;;~,Sj)fit~~dodont.f<if·.the~W-~tBrallcb rerkfomea ~teelt hOlect · ·~n~~~·-~~/~ (t-~ USEPASite Site Descriptions Latitude Comment
ID# Lonsdtude WBPC-1 WEST BRANCH PERKIOMEN CREEK 40.428889 Upstream Control for
150M DOWNSTREAM OF AIRPORT 75.624167 Crossley Site ROAD IDSTORICAL PENNSYLVANIA FISH & BOAT COMMISSION MONITORING STATION #0201@ RivER MILE 9.7 UPSTREAM OF MOUTII)
WBPC-2 WEST BRANCH PER.KlOMEN CREEK 40.403056 Upstream Control for 10M UPSTREAM LDB OF ANTHONY'S 75.613056 Bally Site MILL BRIDGE (A.K.A. RUSH BRIDGE) IllSTORICAL PENNSYLVANIA FISH & BOAT COMMISSION MONITORING STATION #0202@ RIVER MILE 7.1 UPSTREAM OF MOutH)
WBPC-3A WEST BRANCH PERKIOMEN CREEK 40.426000 Upstream Control for 150M UPSTREAM OF THE UNT 75.617083 Crossley Site CROSSLEY FARM TRIBUTARY -LOCATED 15 M UPSTREAM OF OLD HOUSE ON LEFT DESCENDING BANK
WBPC-3B WEST BRANCH PERKIOMEN CREEK 40.426000 Duplicate 60 M UPSTREAM OF THE UNT 75.617083 Temperature CROSSLEY FARM TRIBUTARY -
Monitoring Site A IT ACHED TO A ROOTW AD OF A LEANING TREE
WBPC-4 A WEST BRANCH PERK! OMEN CREEK 40.425472 Downstream 60 M DOWNSTREAM OF THE UNT 75.617139 . Monitoring Site for CROSSLEY FARM TRIBUTARY Crossley Site
WBPC-4B WEST BRANCH PERK.IOMEN CREEK 40.425472 Duplicate DOWNSTREAM OF CROSSLEY FARM- 75.617139 Temperature 100M DOWNSTREAM OF THE UNT
Monitoring Site CROSSLEY FARM TRIBUTARY
WBPC-5 UNNAMED TRIBUTARY OF WEST 40.425944 TRIBUTARY BRANCH PERKIOMEN CREEK ON 75.615028 Draining Crossley CROSSLEY FARM-300M UPSTREMi
Farm Property OF THE DALE ROAD CULVERT
WBPC-6 WEST BRANCH PERKIOMEN CREEK 40.388500 Downstream DOWNSTREAM OF THE BALLY 75.599694 Monitoring Site for SUPERFUND SITE ON THE LONGACRES
Bally Site RETREAT FARM PROPERTY
WBPC-7 WEST BRANCH PERKIOMEN CREEK 40.395889 Upstream Control for UPSTREAM OF THE BALLY 75.608833 Bally Site SUPERFUND SITE NEAR THE OLD ROUTE 100 BRIDGE
Page 4 of40

_,
Page 5 of40

Figure l(b). Map of the USEPA 2008 Monitoring Sites for the Crossley Farm Groundwater Superfund Site
Page 6 of40
(

i. \ '_ 0 - · -
.~- .·· Figure l(c). Map of the USEPA 2008 Monitoring Sites for the
Bally Groundwater Superfund Site
Page 7 of40
·~ ' •.
. ·.

4.0Monitoring Parameters and their Frequency of Collection
Hourly temperature measurements were recorded at each ofthe seven monitoring stations using HOBO continuous temperature monitors which were deployed in April 2008 and downloaded in November 2008 and April2009. Water chemistry samples were collected at all seven locations by Tetra Tech, Inc. during July 8-10, 2008 in conjunction with the bioassessment surveys. Benthic macro invertebrate samples were collected at all seven locations during July 8-10, 2008. Fish surveys were completed between July 8-10, 2008 and July 15-16, 2008 at five of the seven locations. In-situ water chemistry and habitat assessments were completed during July 8-10, 2008 at all locations in conjunction with the bioassessment surveys. Flow discharge monitoring was completed at selected sites associated with the Crossley Farm site by Tetra Tech, Inc. on March 17-18, 2009.
5.0Methods and Parameter Table
The methods used during the 2008/2009 baseline survey are summarized in Table 2 and detailed in the following sections.
. T3.b(~~·-PIIJ'aiuete.f.laformadou ··~ .~~: · t:~·(;l~·~~:4 . ~~t;~.~:~ ;;~~~~~:; ~ ~~~, .. ~: .. \!:~·=·~~~~- · r-:~~:r . ·.~:·: ·.i~: .. :. :-~~ ~-~.=~·> ~:~-~~:·;:~ ~-Parameter Method Reference Sample Preservation Holding Time Iri-situ USEPA YSI Meter N/ A - all in-situ N/A Physical/Chemical measurements Parameters (temperature, pH, conductivity, dissolved oxygen) Physical Habitat USEP A RBP Visual Nl A - all field N/A Characterizations Qualitative Habitat measurements
Assessment Temperature HOBO Continuous Nl A - all field NIA
Temperature Monitor measurements Fish Surveys Pennsylvania Fish All fish returned alive N/A
Boat Commission' s to stream except for Standard Mark- voucher fish Recapture Methods preserved in 10%
formalin Benthic Pennsylvania DEP 95% ethanol in the N/A Macroinvertebrates ICE methods field Surveys Laboratory Based See Tetra Tech QAPP See Tetra Tech QAPP See Tetra Tech QAPP Water Chemistry for details for details for details Flow (Discharge) See Tetra Tech QAPP N/A N/A
for details
Page 8 of40
(

5.1 In-Situ Physical/Chemical Parameters In-situ water quality parameters (pH, temperature, dissolved oxygen and conductivity) were collected at each monitoring site. The probe was calibrated at the start of the sampling week as per manufacturer's guidance.
5.2 Physical Habitat Characterization Visual rapid habitat assessments were performed at each site using the Pennsylvania Department of Environmental Protection (PADEP 2005) protocols.
5.3 Continuous Water Temperature Monitoring HOBO U22 Water Temperature Sensors were activated to collect hourly readings prior to deployment by the USEPA-BTAG Team. The units were installed within metal pipe shafts and deployed at the selected monitoring stations. The units were attached with 118 inch cable to the shoreline or in-stream structures. Deployment information (e.g., latitude/longitude coordinates, date & time of deployment, site photographs) was recorded for each sensor and location. Monitors were deployed at each of the seven monitoring stations. However, the duplicate monitor (WBPC-3A) was inadvertently programmed to record water temperature at the minute interval rather than the hourly interval.
The hourly water temperature data between the months of April 2008 to April 2009 were compared to th~ published temperature criteria of preference (12.4°C to 1~). tolerance (18°C to 20°C) and mortality (high mortality ~2°C versus complete mortality ~5°C) of brown trout (Bell 2006).
5.4 Fish Surveys Establishment of Stream Reach Length - We followed the approach of the P AFBC in the establishment of stream reach length for each fish assessment zone. The P AFBC has a miirim.um 300 m survey length for trout assessment waters. The wetted width was measured approximately every 30 meters to determine average wetted width. This was used to determine the reach length which was 40X the average wetted width. The wetted width of the mainstem of the West Branch Perkiomen Creek varied between 6 and 10 meters. The length of the assessment reaches was extended to conclude at a channel break (e.g., toe of a riflle )~ We did not use blocknets during these surveys since the P AFBC did not use blocknets during the historical surveys.
','
Collection of fish community samples - We followed the sampling methods outlined in McCormick and Hughes (1998). We used a Smith-Root backpack electrofishing unit which was set to pulsed 300 volt-amperes (VA) with a frequency of 60-70 Hz. Beginning at the downstream end of the reach, we electrofished in an upstream direction, parallel to the current, sweeping the electrodes from side to side in the water. We sampled available cut-bank and, snag habitats as well as riflles and pools. The netters followed the operator and netted stunned fish which were deposited into buckets and tubs for processing. The fish were processed and identified at interim points along the reach to reduce mortality. ·
The collection of the brown trout population data followed the PAFBC Standard Mark-Recapture Method which can be found in the P AFBC 2008 Standard Operating Procedures manual and is outlined in the Quality Assurance Project Plan (QAPP) for this project.
Page 9 of40
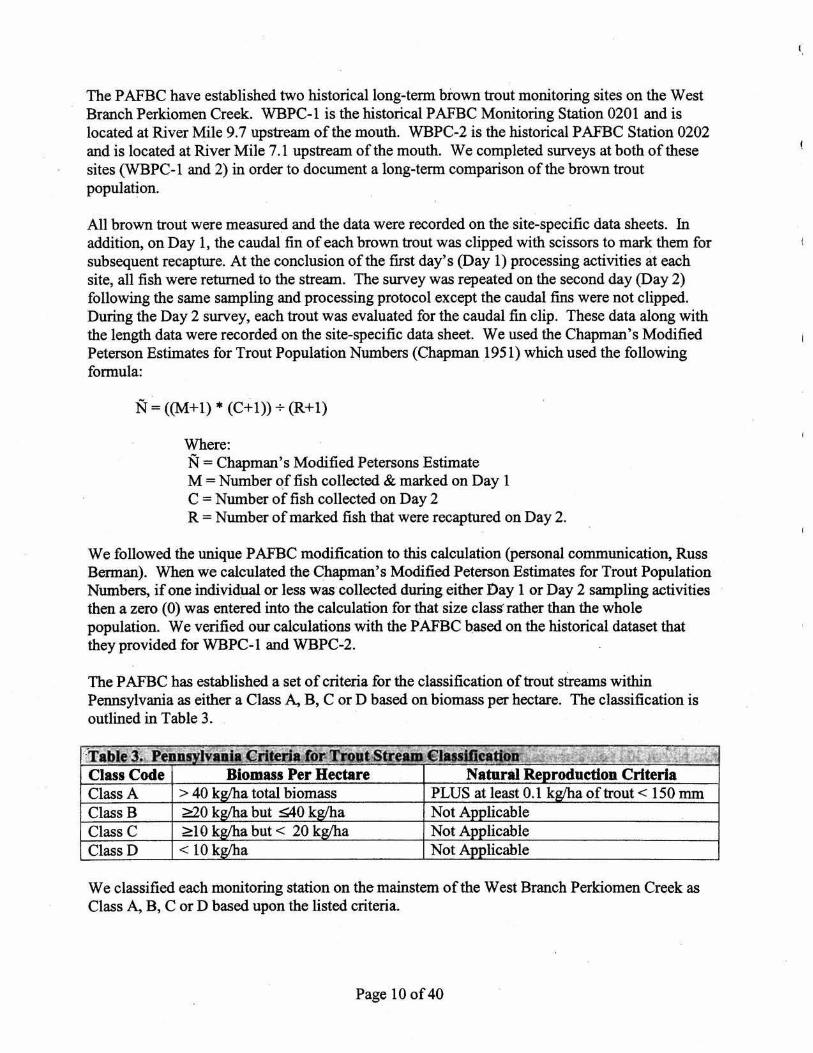
The P AFBC have established two historicallong-tenn brown trout monitoring sites on the West Branch Perkiomen Creek. WBPC-1 is the historical P AFBC Monitoring Station 0201 and is located at River Mile 9.7 upstream of the mouth. WBPC-2 is the historical PAFBC Station 0202 and is located at River Mile 7.1 upstream of the mouth. We completed surveys at both of these sites (WBPC-1 and 2) in order to document a long-tenn comparison of the brown trout population.
All brown trout were measure~ and the data were recorded on the site-specific data sheets. In addition, on Day 1, the caudal fin of each brown trout was clipped with scissors to mark them for subsequent recapture. At the conclusion of the first day's (Day 1) processing activities at each site, all fish were returned to the stream. The survey was repeated on the second day (Day 2) following the same sampling and processing protocol except the caudal fins were not clipped. During the Day 2 survey, each trout was evaluated for the caudal fin clip. These data along with the length data were recorded on the site-specific data sheet. We used the Chapman's Modified Peterson Estimates for Trout Population Numbers (Chapman 1951) which used the following fonnula:
N = ((M+ l) * (C+l)) + (R+1)
Where: N = Chapman's Modified Petersons Estimate M =Number of fish collected & marked on Day 1 C = Number of fish collected on Day 2 R = Number of marked fish that were recaptured on Day 2.
We followed the unique P AFBC modification to this calculation (personal communication, Russ Berm~). When we calculated the Chapman' s Modified Peterson Estimates for Trout Population Numbers, if one individual or less was·collected during either Day 1 or Day 2 sampling activities then a zero (0) was entered into the calculation for that size class rather than the whole population. We verified our calculations with the P AFBC based on the historical dataset that they provided for WBPC-1 and WBPC-2.
The P AFBC has established a set of criteria for the classification of trout streams within Pennsylvania as either a Class A, B, C or D based on biomass per hectare. The classification is outlined in Table 3.
We classified each monitoring station on the mainstem of the West Branch Perkiomen Creek as Class A, B, C or D based upon the listed criteria.
Page 10 of 40
The 2008 brown trout data from WBPC-1 and WBPC-2 were compared to the PAFBC historical data for these two sites in order to gain a better understanding of the brown trout fishery on West Branch Perkiomen Creek. 5.5 Benthic Macroinvertebrate Surveys Benthic macroinvertebrate samples were collected at each of the seven monitoring stations following the P ADEP Standard Operating Procedures based on the Instream Comprehensive Evaluation (ICE) 2007 methods (6 kicks per station using aD-framed net). A replicate was collected at one of the seven sites. The samples were preserved in 95% ethanol and returned to the USEP A laboratory for processing and identification. The laboratory methods are provided in the USEP A Standard Operating Procedures manual and outlined in the project-specific QAPP. Briefly, a 200±20% random, organism subsample was removed from a gridded picking pan. All organisms were identified using PADEP methodology (usually genus, except Chironomidae and Oligochaeta (family-level). Some taxonomic groups were left as Class or Phylum (e.g. flatworms and mites).
The benthic macroinvertebrate data from each site were evaluated with the P ADEP Freestone Index of Biotic Integrity and an assessment of the coldwater/coolwater indicator taxa
5.6 Water Chemistry Samples Tetra Tech, Inc. was responsible for the collection and analysis of water samples. Samples were collected at each of the seven monitoring stations following the Tetra Tech, Inc.'s Quality Assurance Project Plan (QAPP) for the project. We have incorporated the analytical water chemistry data into this report. The data were evaluated with the P ADEP water quality criteria standards.
5. 7 Flow Discharge Monitoring Tetra Tech, Inc. was responsible for the collection and analysis of the flow discharge data from select sites within the West Branch Perkiomen Creek watershed. Samples were collected at each of the monitoring stations following the Tetra Tech, Inc.'s QAPP for the project. We have incorporated the data into this report as a baseline of site conditions.
6.0Results
The baseline surveys were completed in July 2008 except for the continuous water temperature monitoring which occutted between April 2008 and April 2009 for this report. As outlined in the monitoring schematic table (Table 4), the parameters (water temperature, water chemistry, habitat assessment and benthic macro invertebrate surveys) were completed at all seven monitoring sites. Fish surveys were completed at five of the seven sites.
Page 11 of40
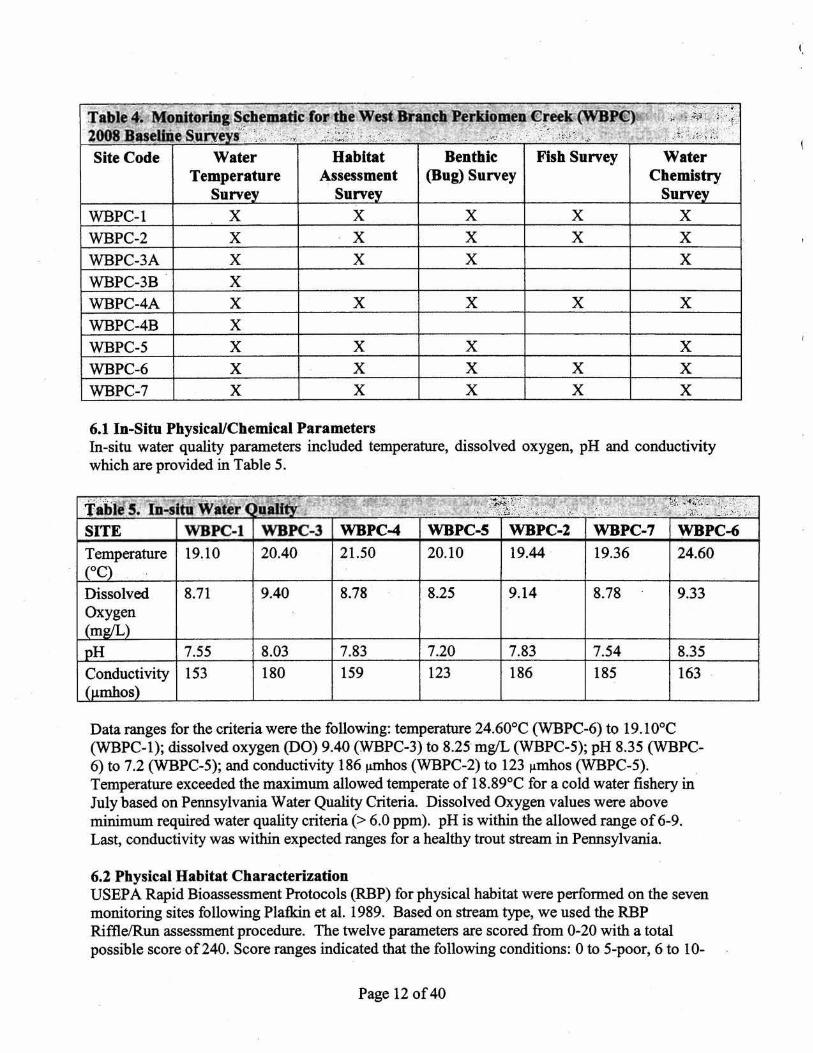
Site Code Water Habitat Benthic Fish Survey Temperature Assessment (Bug) Survey
Survey Survey WBPC-1 X X X X
WBPC-2 X X X X WBPC-3A X X X
WBPC-3B X
WBPC-4A X X X X
WBPC-4B X
WBPC-5 X X X
WBPC-6 X X X X WBPC-7 X X X X
6.1 In-Situ Physical/Chemical Parameters
Water Chemistry
Survey X X X
X
X X
X
In-situ water quality parameters included temperature, dissolved oxygen, pH and conductivity which are provided in Table 5.
t•IJie.s. fn-Sit.{wa·~r~•i.aiiii .. ~ · ·., :~1~~t::~: _r .~-~~·- ,, ~· .. ~ -~~f:~ :,~f~ J~~~;:~:; ...
. ·'~'""' ~
,, .. . , SITE WBPC-1 WBPC-3 WBPC-4 WBPC-5 WBPC-2 WBPC-7 WBPC-6 Temperature 19.10 20.40 21.50 20.10 19.44 19.36 24.60 ec) ..
Dissolved 8.71 9.40 8.78 8.25 9.14 8.78 9.33 Oxygen (mg/L)
pH 7.55 8.03 7.83 7.20 7.83 7.54 8.35
Conductivity 153 180 159 123 186 185 163 (JJ,mhos)
Data ranges for the criteria were the following: temperature 24.60°C (WBPC-6) to 19.1 0°C (WBPC-1); dissolved oxygen (DO) 9.40 (WBPC-3) to 8.25 mg/L (WBPC-5); pH 8.35 (WBPC-6) to 7.2 (WBPC-5); and conductivity 186 j.Llllhos (WBPC-2) to 123 ~mhos (WBPC-5). Temperature exceeded the maximum allowed temperate of 18.89°C for a cold water fishery in July based on Pennsylvania Water Quality Criteria. Dissolved Oxygen values were above minimum required water quality criteria(> 6.0 ppm). pH is within the allowed range of 6-9. Last, conductivity was within expected ranges for a healthy trout stream in Pennsylvania.
6.2 Physical Habitat Characterization USEP A Rapid Bioassessment Protocols (RBP) for physical habitat were performed on the seven monitoring sites following Plafkin et al. 1989. Based on stream type, we used the RBP Riffle/Run assessment procedure. The twelve parameters are scored from 0-20 with a total possible score of240. Score ranges indicated that the following conditions: 0 to S-poor, 6 to 10-
Page 12 of40
\,

marginal, 11 to IS-suboptimal, and 16 to 20 optimal. Total and individual RBP scores are shown in Table 6.
ta"bf '6: B:~bttit:~s"lm::.~r~ults , .-:;;:··~· ·~-·, . .,;.
~ li~~~·~ ... , .. ;~~/ ~:·~:-: f:;;,_..t_ r.t:;s.,. ... :~ ... ~ . . __ , .. J~ - . -~ - ~ ~ . . '. . u.~
Site WBPC-1 WBPC-3 WBPC-4 WBPC-5 WBPC-2 WBPC-7 WBPC-6
Jnstrearn Cover 18 15 15 13 18 17
Epifa~al Substrate 17 16 17 11 18 16
Embeddedness 16 17 18 18 16 15
Velocity/Depth 18 14 16 10 17 14 Regimes
Channel Alteration 15 17 18 18 15 14
Sediment Deposition 16 16 15 14 15 10
Frequency of Riffles 18 15 16 11 18 17
Channel Flow Status 17 18 16 17 18 18
Condition of Banks 17 16 15 14 18 17
Bank Vegetative 16 14 15 16 14 18 Protection ~
Grazing or Other 16 16 16 16 18 15 Disruptive Pressure
Riparian Vegetative 16 12 15 15 13 15 Zone Width
TOTAL SCORE 200 186 192 173 198 186
%of Total Possible 83% 78% 800/o 72% 83% 78% Score (240)
Rating (OP-optimal, OP SUB OP SUB OP SUB SUB-suboptimal)
Overall, the RBP habitat scores fell in the optimaVsuboptimal range for aquatic life. WBPC-1 and WBPC-2 were the most optimal sites, scoring the highest in instream cover, velocity/depth regime and frequency of riflles. The combined highest score was 200 at the uppermost site (WBPC-1) which is upstream from the proposed Crossley Farm treated groundwat~ discharge. The lowest score was 160 at WBPC-6, the most downstream site associated with the Bally site. This lower WBPC-6 score is attributable to sediment deposition, grazing pressure and little or no riparian zone. WBPC-6 is adjacent to Longacres Dairy Farm and includes an electrifie4 cow crossing through the stream.
Poor and marginal scores (bold type in the table) are deemed non-sufficient for the maintenance of aquatic life. These scores include velocity/depth regimes at WBPC-5 in the unnamed tributary; grazing/other disruptive pressure and riparian vegetative zone width at WBPC-6; and sediment deposition at WBPC-7. WBPC-5, the tributary located near the Crossley Farms property, does not have well-developed riffles. WBPC-6 has grazing pressure and little riparian zone due· to agricultural land use. WBPC-7 had a sedimentation problem. WBPC-4, immediately downstream of the proposed Crossley Farm thermal discharge, was assessed as one
Page 13 of40
15
15
13
16
14
11
16
16
15
15
10
4
160
67%
SUB
of the better sites in terms of overall RBP score. WBPC-4 received optimal scores in embeddedness, velocity/depth regimes, channel alteration, frequency of riffles, channel flow ·status and grazing or other disruptive pressure. ·
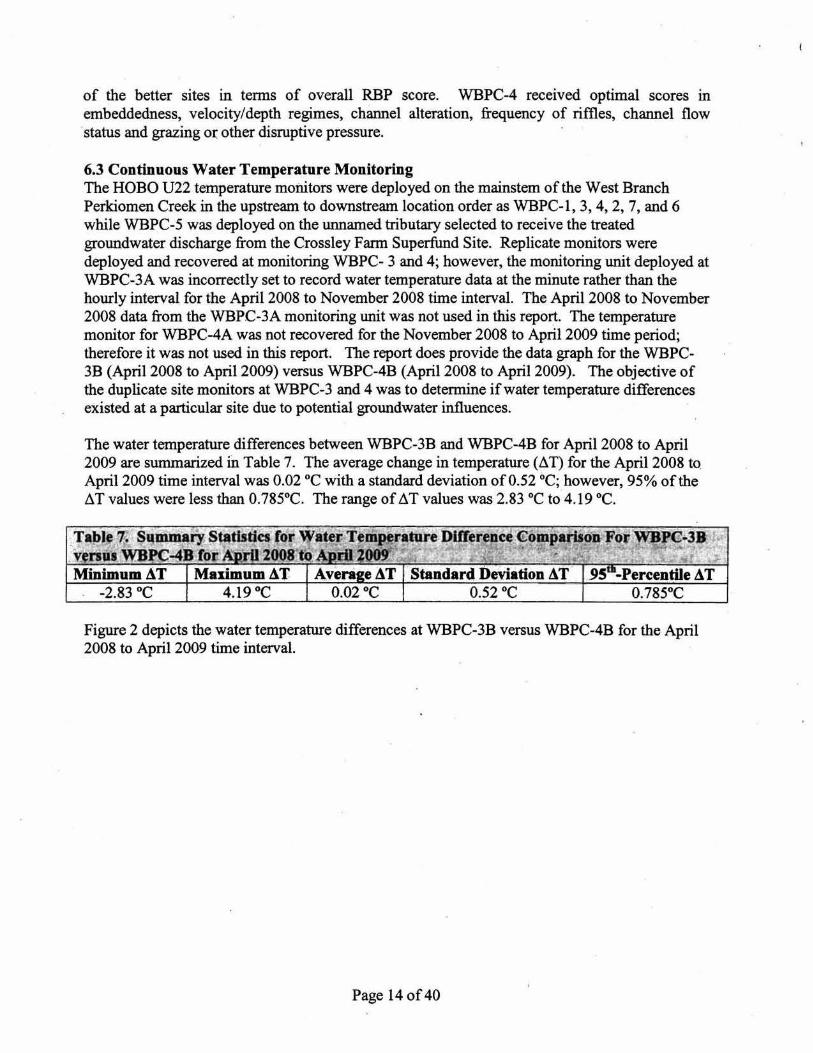
6.3 Continuous Water Temperature Monitoring The HOBO U22 temperature monitors were deployed on the mainstem of the West Branch Perkiomen Creek in the upstream to downstream location order as WBPC-1, 3, 4, 2, 7, and 6 while WBPC-5 was deployed on the unnamed tributary selected to receive the treated groundwater discharge from the Crossley Farm Superfund Site. Replicate monitors were deployed and recovered at monitoring WBPC- 3 and 4; however, the monitoring unit deployed at WBPC-3A was incorrectly set to record water temperature data at the minute rather than the hourly interval for the April 2008 to November 2008 time interval. The April 2008 to November 2008 data from the WBPC-3A monitoring unit was not used in this report. The temperature monitor for WBPC-4A was not recovered for the November 2008 to April 2009 time period; therefore it was not used in this report. The report does provide the data graph for the WBPC-3B (Apri12008 to April 2009) versus WBPC-4B {April 2008 to April 2009). The objective of the duplicate site monitors at WBPC-3 and 4 was to determine if water temperature differences existed at a particular site due to potential groundwater influences.
The water temperature differences between WBPC-3B and WBPC-4B for April 2008 to April 2009 are summarized in Table 7. The average change in temperature (~T) for the April2008 to April2009 time interval was 0.02 oc with a standard deviation of0.52 °C; however, 95% of the ~T values were less than 0.785°C. The range of ~T values was 2.83 octo 4.19 °C.
Standard Deviation At -Percentile AT . -2.83 oc 0.52 oc
Figure 2 depicts the water temperature differences at WBPC-3B versus WBPC-4B for the April 2008 to April 2009 time interval.
Page 14 of 40

-(.) - 30
Comparison of Water Temperatures at W8PC.SITE-38 versus W8PC.SITE-48 for April 2008 to Aprll2009 Time Interval
o +-~~~--~--~--~~---r~~~~~~~~
,~~~~~###'#'#'b#' ~ .# ~' ~(# / ~ ,/ ----~ ,/ ,# -1 .#
COLLECTION DATE
Figure 2. Water Temperature Comparison
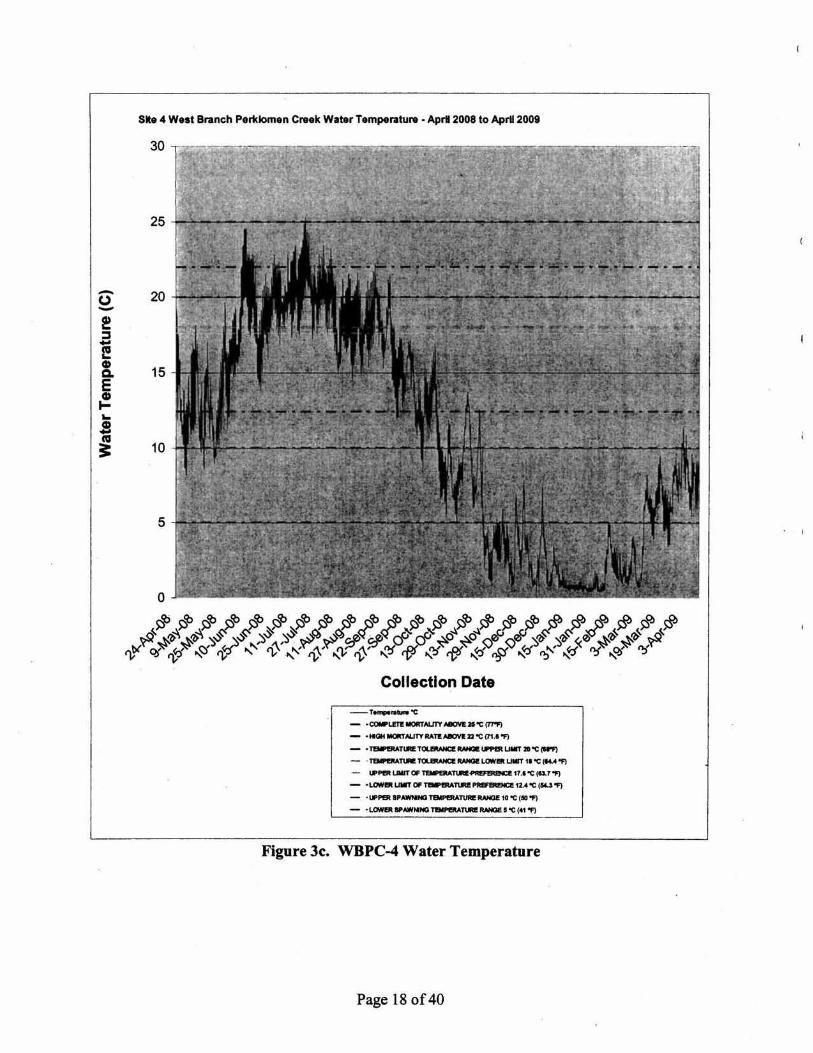
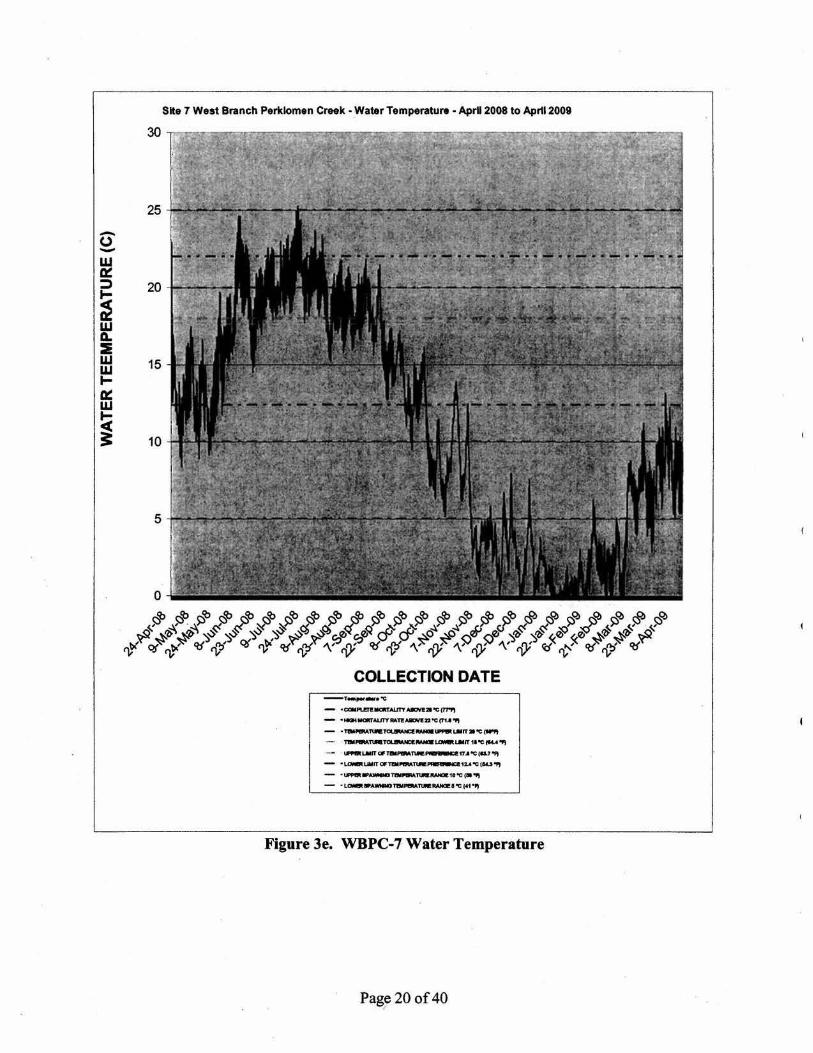
The USEPA retrieved the HOBO temperature monitors from six of the seven monitoring locations during the April 2008 to November 2008 time interval and from five of the seven monitoring locations during the November 2008 to April 2009 time interval. The HOBO temperature monitor from WBPC-6 was pot retrieved and therefore no data is available for the April 2008 to April 2009 time interval. The hourly temperature data from the six temperature monitors were graphically plotted with temperature criteria endpoints (e.g., summer/fall mortality, summer/fall preference, summer/fall tolerance, and spring reproductive). The results of the six sites are provided in the following figures in order from upstream to downstream with tributary WBPC-5 listed last.
Page 15 of40

-(.) -e :s -l! & E G> ..... ""' G> li ~
SIT~ 1 West . Branch Per1domen Creek Water Temperature· Apr112008 to Aprll 2009
30 y-,~~~~~~--~~----~--~------~~----------------~~~
20
15
10
5
0~~~~~~~01~~~~
~/~~~~~~£~~~~~~~~ft~~~~~~~~~~~ ,Y~ ... '<~~.?.,.~~~v~~':.;t-... ~.._qjt'.._~~~ ... ~~-- ... ~~o~.p n?.._~~~ ... 'r}-~4< '\ -._~'V"
Collection Date
---'C - • cx:u:u:rEt.DRTAUJY AJIJCNE26-c(1'7"'f)
- • HGH Y:RI'""-"" M l'tAIIOIE22 'C(7t.e •F)
- •1'8.flf!:AA'I\IIIE'Ttl.lfWr«::EI\VG!t.JIP9:t:L.MT2D•c<•'l
- Tal'8¥.l\AE-T0..EAU.a.At.JrrOEl~LUf 1t•C(e4 .• .,
..,..,_Uolf'OF1"811V'An.w.E~n.e•e (a.7.,
- •LOMAL.MTC#-~l\RE~ t2.4•C(64.)•F)
- . .,_,.......,,__...,_10"c:(OI)•F) - '"lON8tSM'MeO~T\.AeM~t•c(4\ -t:)
Figure 3a. WBPC-1 Water Temperature
Page 16 of40

Site 3 West Branch Pertdomen Creek- Water Temperature- Aprtl 2008 to Aprtl 2009
~ T-~~~~~~~~~~~~~--~~~~--~--~~~~~~~
- 20 (.) -~· f :s -., ... l 15 E G»
?) 1-... G» -~ 10
5
0
iJ> ~ l'~'b jl>,~jl> ,/:.~~./' ~~ £~ / ,!> .fl> rfr -~/:.l:~ft_ft,/ ~~ )f' ~,'X,..~~ ~16 ~ ~.:s.r.:s ";s ... ~ ,....;; ,.,t>_l,{, .s-? .... ~ .y:,p 'rtP .... ~-;~f'.sl'~,t::f tv~'£! r;s ..:« ~~,~~ ,.,~ ~"'
'); 'U ... ~ ..,... " '); ·o. "" 'V' 'U ....... " .,; "' " ~ '\." .,; ...... "0" .._c::r 1l
Collection Date /
r .. ,., .... -c
- • oc...u:ri.MCIIU'AUTY AKJ¥1:211 "'C en""\
- •ttc»tMCia'AUTYMTeMOtiZI"-c(rU..,
- ·~tu.1"CL.-.ucaM-.....,_LMtr»~C...,
- .,_,_ __ ..._ ........ 'C!KA"'
- · I.PfWIUIUTOII,..,.._tl.R......:ZtT.I"'CIG.f..,
- ·~UMrrOfl,.......~....-.c:a12.A"C (IA.I..,
- •\PPM ........ ~llleMN:ate"'C • .,
- •LO...IPA...,,....._,l\N..MMIII'C~1.,
Figure Jb. WBPC-3 Water Temperature
Page 17 of 40
-(.) -! :I -I! • Q.
E • ... .. .s ca ~
Site 4 West Branch Pertdomen Creek Water Temperatu,. • Aprl 2008 to Aprtl2009
20
15
10
5
0 .J.o.ile:llilll
~ »ro »ro l>ro s§> s§> »ro s§> »ro . ~ro &.> »ro »ro »ro ~ ~ _5:>ro ~ ~ ~ ~ ~ ~ :/f ~~ ~~ )jS_ ':::i~~ ;::,~ ,~~ ~ ~<:5.> <J!'.q f:J'q_cY dJ~o~ ~o~ ~ 9r11 ~~~ -:-:,~~ x~ ~t§ o):-t§ ~ ~~~~~-~~~~~~~~~~~~~~~~~~
Collection Date
-r-ra .... "C
- • COIII'IZT! _,.ALITY-:II"C (TI'f)
- •11011 _,.ALITY AAn-22 'C (7U 'f)
- ·~TIN TOI.IIWII%--UIIIT lO'C(WF)
- · ~ru. 'I'OlJIWIC:e- LOWI!II uwr 11 "C (I4A 'f)
- I.PPI!ItiJIIITOfi-'1\N~ 17.1'C (IU'f)
- ·lOWI!IIUWTOfi-TIN~1U"C(IY'f)
- •UPPBtiPAWNHQ-T\Me-10"C(IO'f)
- ·lOWI!IIWAWNIIIO T&IPI!IIA'I\N -I"C (41 'f)
Figure Jc. WBPC-4 Water Temperature
Page 18 of40

-(J -! :;:, -t! !. E G) .... ...
!.' G) -~
Site 2 West Branch Pertdomen Creek Water Temperature • Aprl2008 to April 200i
25
20
15
10
5
0
~$lib ~()fb ~ib ~()ib ~()ib ~()ib ri()fb ri()fb ~fb "-:~ "-:(;;}ib Nf:libqfl()ib ~ib ~(;;}C?J ~(;;}C?J 'Sf~ ~f:lC?J ~,(;;}C?J ~f:lC?J bt~n~'1> .. ~'1> ~~v l(f'S n':l~~-~ "-'~.;) o..f::>0 1,,Pv ~j:Pn*"0 ..,_fJ n.P0 '\'~~ ~~~ nf<0 tV~ .... ~~Of~
'}) '\V ~' "\: V ....... ~ "V '); '\V "V '); '\V J ');.
Collection Date
- • CCIIIIJ!l.aWMCRFAUTY ...,.,..-c {71"'ft
- .,...IIICia'AUNMTI~u-crru.,.
- .. ~,._~ ..... WIPWtl.MITJO"C~
- ~T\NTOt..aWCa--.I..CifllllaiMIT U«<C CMA,.,
... \llfllltLMTO/ITW,_.T\IR..-c:atJ.J-cfii.J.,
- ·~UMrf011W,.,_TUJIR ........ 12A"C(M.J.,
- ...... ~,....,..,... ....... .,. 'C( ....
- .... ~~,........,1'\NIIWmi'C (ft .,
Figu.re 3d. WBPC-2 Water Temperature
Page 19 of 40
25
-0 -w a:: ~ 20 .... ~ w Q. ~ w 15 w t-0:: w .... ~ 10
Site 7 West Branch Perklomen Creek ·Water Temperatura • AprU 2008 to Apr112009
T..,., ... -c - • .,........._..AUn'._.aoe!I'T'I'I - •MCIHIIIOKI'Al/TYMft~D-c(TtA-tt - .,...._nR....__ __ .., ... oe ....,
____. ,..~1\R.TOI..8WUMICII:~~" ,.-.:fiU ..,
- '-""'t~OI~n..-...catYAec (a.f.,
- •L.QIIil8lUMnOII'Y1N..-na~'a... ..:r&U-,
- ·~~~n..IWm11~<-., - •• ._ .. ___ T\R_I"Cf41 "fl
Figure 3e. WBPC-7 Water Temperature
Page 20 of40 r
?)
Site 5 West Branch Per1domen Creek Water Temperature • Aprtl 2008 to Aprtl 2009
--0 -! ~ -l! 0 a. E 0 .... .. s ~
20
15
10
5
0
~~~~~~~~~~~~~~~~~~~~ ~ 'K" 'Kv ~ :¥" :¥" ~ ~ ~ ~ ~ ~ qJJ', qJJ . ~ ~ 'd"' ~ ~ ~v
'X~n~'lj .. ~~ OJ~\$"\'~ n~ 'X"{-.;s ";:1 ~t;J'J OJ0~"\>Y~~O bf<J _,.,p tr~'li Pf~'li((f«({) "~~((f~'li ~~ '}: V ~' "\ v "'\ ~" ~ " ·v "\ ~ "\ ' ~ "
Collection Date -r ... ..., ..... '"C
- • CCIIIIPUft.IICIRfAUTV J«N~a-c..,...,
- •ttci4IIICICAUTYRA.ftAM:IIIaU'Cf71.1 ...
- ·~~~fii!UG!"""'-tMifa-c(Wft
~ ,..JIIW'An.~--~..-fT ,.-c ..... .,
- ~LAUfC#~TlN ......... iT.I"C.(t:l.f..,
- ·~I.IUI'OI,....,....~~12A"C{IU..,
- . ..... _.A'tiiiNfG,..,._..,..IW«<I11'CI•.,
- • L.C:IWM.._ .... TIIII.-Al"\N IW«R I"C ~ "'t
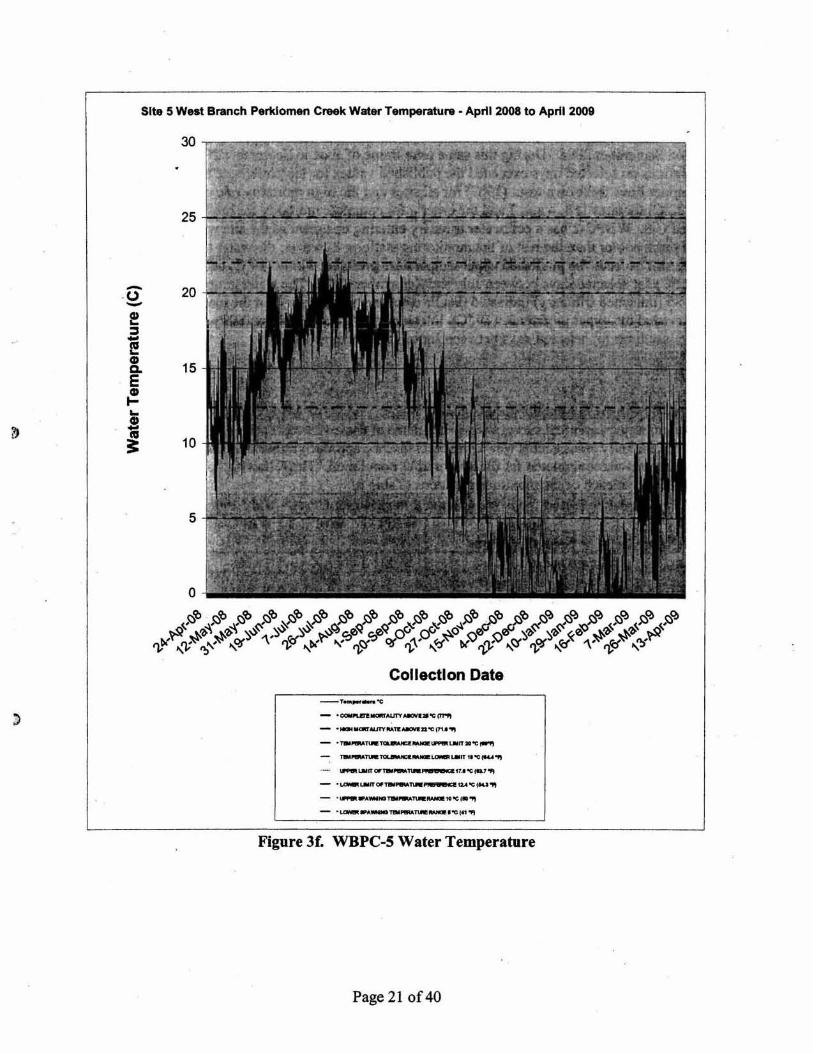
Figure Jf. WBPC-5 Water Temperature
Page 21 of 40

The water temperature plots for the 6 mainstem monitoring locations indicate that April 2008 to April 2009 water temperatures within the West Branch Perkiomen Creek exceed temperature tolerance range upper limit (20°C) for adult brown trout for selected days between the months of June and September 2008. During this same time frame of June to September 2008, water temperatures on selected days exceeded the published values for the preference temperature range upper limit for brown trout (19°C) for all sites and the high mortality rate criteria for brown trout (22°C) for sites 1, 3, 4 and 7 and the criteria for complete mortality for brown trout (25°C) for WBPC-3. WBPC-2 has a coldwater tributary entering upstream of the site which keeps this stream reach cooler than the rest of the monitoring stations; however, the water temperature at this site still exceeds the published upper temperature preference limit (1 ~C) and high mortality rate (22°C) for selected days between July and September 2008. The water temperature plot for WBPC-5 (unnamed tributary) indicated that the tributary was cooler than the mainstem sites but still exceeded the upper preference (19 °C), tolerance (20 °C) and high mortality rate (22 °C) temperature limit for selected days between June and September 2008.
6.4 Fish Surveys
6.4.1 Fish Community Assessment Fish community assessment surveys were completed at five of the seven sites. The objective of the fish community assessments was a presence/absence approach rather than the population assessment that was completed for the brown trout population. The following species of fish were collected at each of the monitoring stations (Table 8}.
Tihl~·a::. ... tiftittan UJt·eoUected r..OmWest.Bnuaoh.PettiQmea c'-"k ~July 200&':>;h :~~-~ ~t · .. , · ;~ ·~~:. ::~:: \ · Species Speci~ . WBPC-1 WBfC-l WBPC-4 WBPC-6 WBPC-7
Common Name Scl~ntiflc Name Brown Trout Salmo trutta X X X X X White Sucker Catostomus commersonnii X X X X Blacknose Dace Rhinichthys atratulus X X X X X Longnose Dace Rhinichthys catarat:;tae X X X Creek Chub Semotilus atromaculatus X X X Fallfish Semotilus corpora/is X X X X Central Stoneroller Campostoma anomalum X Golden Shiner Notemigonus crysoleucas X Bluntnose Minnow Pimephales notatus X Common Shiner Luxiius cornutus X X X X Cutlips Minnow * Exoglossum maxillingua X X X X X Banded Killifish Fundulus diaphanus X Pumpkinseed Lepomis gibbosus X X Sunfish Bluegill Lepomis macrochirus X X Green Sunfish Lepomis cyanellus X Largemouth Bass Micropterus salmoides X Rock Bass Ambloplites rupestris X X Brown Bullhead Ameiurus nebulosus X Margined Madtom Noturus insignis X X Tesselated Darter Ethestoma olmstedi X X
Page 22 of40

The rationale for this approach was that the West Branch Perkiomen Creek is classified as an exceptional value coldwater fishery upstream of the community of Bally, Pennsylvania and we wanted to focus on the brown trout since they are the most temperature sensitive fish species.
6.4.2 Brown Trout Population Surveys Brown trout surveys were completed at five of the seven sites. Surveys were not completed at WBPC-5 because it was the unnamed tributary which was too shallow and overgrown with vegetation to complete a representative fish survey. In addition, a survey was not completed on WBPC-3 because it was in the same proximity ofWBPC-1 as a representative upstream control.
The brown trout data collected from each site in 2008 are summarized in tables and graphically displayed in figures (Appendix A). The summary tables als.o provide biomass calculations based on standard weight values used by the P AFBC.
Each of the. reach lengths met the P AFBC requirement of a minimum of 300 meters for trout stream assessments. Stream width and total electrofishing time for each site are provided in Table 9.
354 N/A 300 N/A 320 300 300 8 9 6 2 8 10 10
2628 N/A 2565 N/A 2261 2573 2695
The PAFBC typically calculates the Chapman's Modified Peterson Population Estimate for their trout stream assessments. Table 10 provides the estimate along with the standard error and 95% confidence interval for the 5 sites assessed in 2008.
·'fable~l~i1 ehflpmab'• 'M:odJiJe'd. ,, .... Ettl~. fOF Bi'9.n TnNt PoJtdaUoa 9f:West . ~:: ,~s:n.••C.ddo~~~ta iJ:eek:~ . .Jal¥.; -;.,t ;~"" . -~··'-t-z· · ·~..!-_::"':. • . .. ..._ • ... •
Site Chapmaq'~ Pet~non· Standard Error 95% ConfJdence Estimate . Interval .
WBPC-1 269 12.4 24.3 WBPC-2 360 23.1 45.4
WBPC-4 222 21.9 42.9
WBPC-6 151 28.0 54.9 WBPC-7 138 13.6 26.7
The Chapman's Modified Peterson Estimates are used to calculate population statistics for each site. The population statistics include biomass of brown trout per hectare, number of brown trout per kilometer, and number of brown trout per mile. Brown trout population statistics were calculated for each monitoring site and summarized in Table 11 .
Page 23 of40

Tabl~ u-~.:;Brown·.'Itou•'-PoJ»atation Stattstk'l_to•~Wli:Pt ..:.·Juiy .lOOB!:;:· :-:~·:. .. .,(~~i. ~;;:f{;:~~ ~;;,;'_. ~( . f
Biomass Reproductive Chapman's Per Endpoint Number Number Modified
Hectare Biomass Per ' Per Peterson Site (kglha) Brown Trout Kilometer Mile Estimate of
<150mm Population (k2fba) Numbers
WBPC-1 37.64 0.569 760 1216 269 WBPC-2 76.21 0.295 1125 1800 360 WBPC-4 45.22 0.380 740 1184 222 WBPC-6 34.48 0.428 503 805 151 WBPC-7 55.88 0.262 460 736 138
According to the. P AFBC criteria for high quality trout streams, WBPC-2, 4, and 7 would be classified as Class A trout stream sections because it met the miniinum of 40 kglha and the natural reproduction criteria of biomass > 0.1 kglha of trout less than 150 mm. WBPC-1 and 6 met the Class B classification of ~0 kglha but ~0 kglha. The Class B category does not require a reproduction criterion.
In order to gain a better understanding of the brown trout fishery of the West Branch Perkiomen Creek, the results on historical Chapman's Modified Peterson Population Estimates for surveys completed from 1990 through 2002 for WBPC-1 and WBPC-2 were compared to the 2008 results. The results are summarized in Table 12(a) and 12(b).
~~b~"~- t:t(a>; . ~~Qnc~ c~.,P~~·~l\f~~opaJat!on;•~:~~~(9~~~~~-• · : (199.~1008) :·.:, ·.. - -~~. ; '; ' .,1., • ~ . ·-> . .... ;··~· ~ . ,, . -:.·;-t,.;,.,· ' <-~:.: ~.;-:·": . .:.:.:.:)~ ;_. ,:' . ::: : ... ,.:; ;., ' .. :.... ,.
Sample Year Chapman's Standard Error 95% Confidence . Modified Peterson Interval Estimate
1990 130 9.6 18.9 1993 56 4.9 9.7 1998 329 13.1 25.6 2000 217 14.8 29.0 2002 423 26.4 51.8 2008 269 12.4 24.3
• ~--· ~- ... . ... ,. < ' . .. . ~R"Q,J.. . ·-- P.9 .,", . .,., ... ,.. ~·-· . . .. ~f:.. . . ' . · , . . ·Ta lt't2(b)r,Bi$tonc,;.c~ · ···"' ·. ; ··: Mcidiileti·Pcf !at(on Esdfuatel rei' -·WBR€-2-'. ~, . .. -(199~cf.:2008)~': . ' ... .. .. ~ .Y .. :~.' ,· .. -,-,: .. ·- . .. ~: ·Y , .. ... .......... ·-: • ... , ..... , .. ··::· - -~· • • · . • ,..,, ..... ... I ·' : · •
8 • ' • • .. • • t • 'i ;.. J. .:; .• ~ - ~ . ~ '- • . • • .1 • " • ;. • • • • , .
Sample Year Chapman's Standard Error 95% Confidence Modified Peterson Interval Es.timate
1990 136 8.6 16.8 1993 269 9.0 17.6 1998 408 12.7 25.0 2000 467 14.3 28.0 2002 727 30.0 52.8 2008 360 23.1 45.4
Page24of40
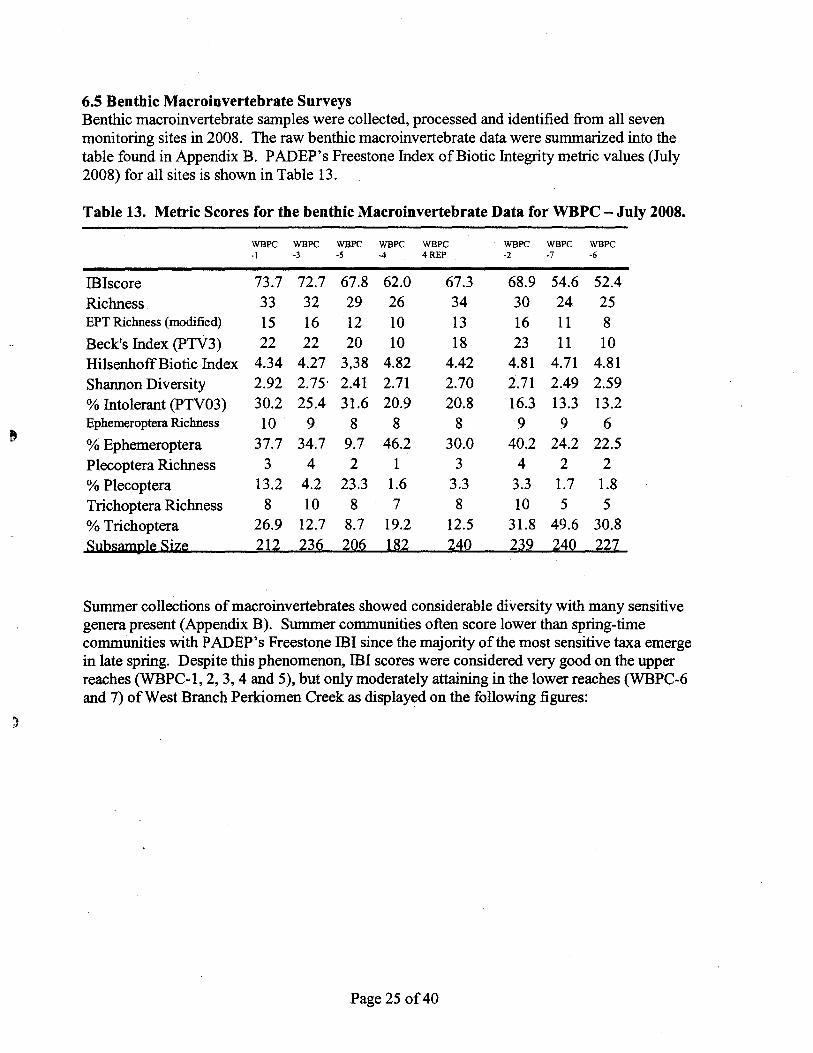
6.5 Benthic Macroinvertebrate Surveys Benthic macroinvertebrate samples were collected, processed and identified from all seven monitoring sites in 2008. The raw benthic macroinvertebrate data were summarized into the table found in Appendix B. P ADEP's Freestone Index of Biotic Integrity metric values (July 2008) for all sites is shown in Table 13.
Table 13. Metric Scores for the benthic Macroinvertebrate Data for WBPC - July 2008.
WBPC WBPC WBPC WBPC WBPC WBPC WBPC WBPC -I -3 -5 -4 4REP -2 -7 -6
IBiscore 73.7 72.7 67.8 62.0 67.3 68.9 54.6 52.4 Richness 33 32 29 26 34 30 24 25 EPT Richness (modified) 15 16 12 10 13 16 11 8 Beck's Index (PTV3) 22 22 20 10 18 23 11 10 HilsenhoffBiotic Index 4.34 4.27 3,38 4.82 4.42 4.81 4.71 4.81 Shannon Diversity 2.92 2.75· 2.41 2.71 2.70 2.71 2.49 2.59 % Intolerant (PTV03) 30.2 25.4 31.6 20.9 20.8 16.3 13.3 13.2 Ephemeroptera Richness 10 . 9 8 8 8 9 9 6 % Ephemeroptera 37.7 34.7 9.7 46.2 30.0 40.2 24.2 22.5 Plecoptera Richness 3 4 2 1 3 4 2 2 % Plecoptera 13.2 4.2 23.3 1.6 3.3 3.3 1.7 1.8 Trichoptera Richness 8 10 8 7 8 10 5 5 % Trichoptera 26.9 12.7 8.7 19.2 12.5 31.8 49.6 30.8
S:ubsamgl~ Si z~ 212 2JQ 'QQ 1B2 '~Q 2J2 '4Q 227
Summer collections ofmacroinvertebrates showed considerable diversity with many sensitive genera present (Appendix B). Summer communities often score lower than spring-time communities with PADEP's Freestone IBI since the majority of the most sensitive taxa emerge in late spring. Despite this phenomenon, IBI scores were considered very good on the upper reaches (WBPC-1, 2, 3, 4 and 5), but only moderately attaining in the lower reaches (WBPC-6 and 7) of West Branch Perkiomen Creek as displayed on the following figures:
Page 25 of40

Benthic 181
80.0
70.0
60.0
50.0
40.0
30.0
20.0
10.0
0.0 WBPC-1 WBPC-3 WBPC-E WBPC-4 WBPC-2 WBPC-7 WBPC-6
Figure 4. Benthic Macroinvertebrate IBI scores from West Branch Perkiomen Creek, July 2008
35~-----------------------------------,
5 ···--- ------------------------ -- --------------------------------------------------------------
0 +-----r---~----~-----r----,-----~--~
WBPC-' WBPC-3 WBPC-5 WBPC-4 WBPC-2 WBPC-7 WBPC-6 ' -
~Richness
_._M>d.EPT __.,_ Beck's<3
Figure 5. Total richness, Modified EPT richness and Beck's IndexWest Branch Perkiomen Creek, July 2008.
Page26 of40

Only a few cool/cold water taxa were collected frequently at the upstream control site (WBPC-1) and at the Crossley unnamed tributary (WBPC-5). Cool/cold water taxa (e.g., Leuctra, Rhyacophilafuscula, Paragnetina immarginata, Ceratopsyche slossonae) at mainstem sites corresponded to greater trout populations. Downstream sites often lost many of the cool/cold water obligate taxa, particularly the stonefly Leuctra (Appendix B). However, the distribution of the five dominant taxa across all sites was relatively uniform as shown in Table 14.
Table 14. Distribution of the five dominant benthic macroinvertebrate taxa across all sites
WBPC-1 WBPC-3 WBPC~5 WBPC-4 WBPC-4Rep WBPC-2 WBPC-7 WBPC-6
Baetis optioserv'!s Opt/QS9fV!JS Caenis OptloseNus , Baetls Chimsrra OptioSSIVUS
Leuctra . Chironomidae Leuctra OptlosetVUs Csenis Csenls Ceratopsyche Cara_topsyche
Ceratopsyche Serrate/Is Dlphetor Bsetis Serrate/Is . OptiosetVus OptiosetVUS Chironomidae
Csenls Csenls Oulimnius .Chlmsrra Baetls , Cef73toesyche .. <;seals Cheumstopsyche
Cheumstopsyche Baetls Chironomldse Chironomldae Psephenus Chimsrrs Chlronomklae Baetls
Page 27 of40
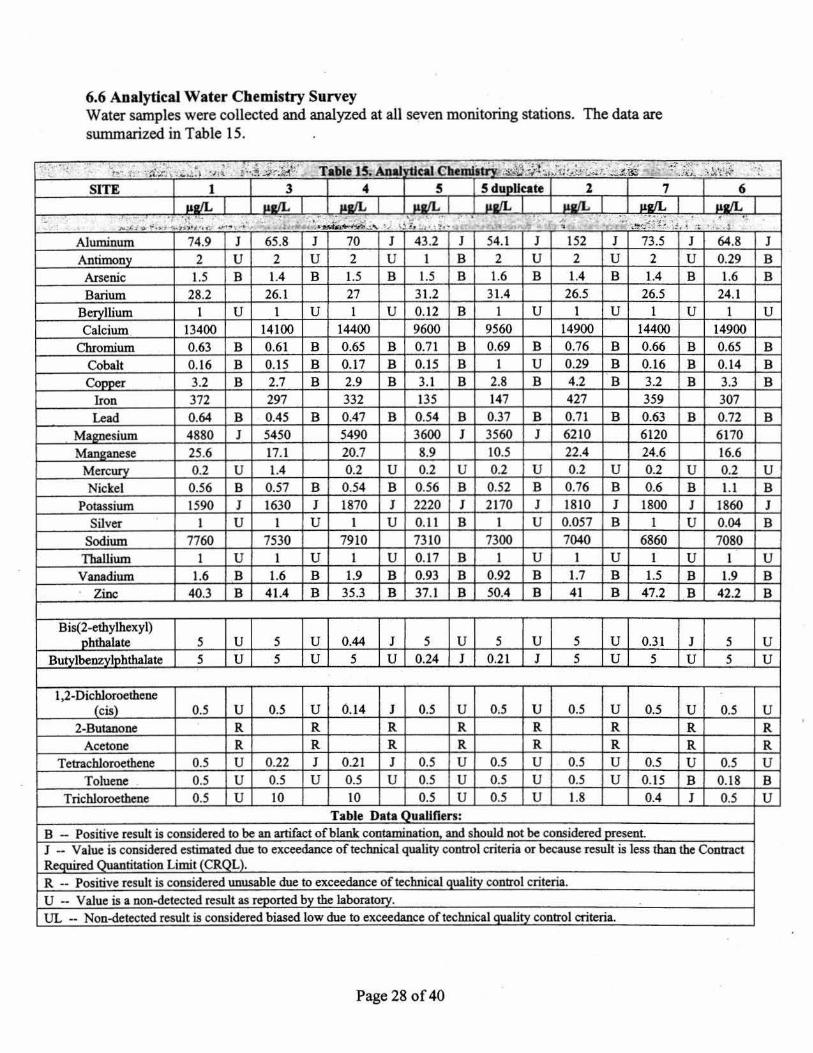
6.6 Analytical Water Chemistry Survey Water samples were collected and analyzed at all seven monitoring stations. The data are summarized in Table 15.
SITE 1
Aluminum Antimony
Arsenic
Barium Beryllium
Calcium. Chromium
Cobalt Copper
Iron
Lead Magnesium
Manganese Mercury
Nickel
Potassium Silver
Sodium
Thallium Vanadium
Zinc
Bis(2-ethylhexyl) phthalate
Butylbenzylphthalate
1 ,2-Dichloroethene (cis)
2-Butanone Acetone
Tetrachloroethene
Toluene
Trichloroethene
74.9
2 1.5
28.2
13400
0.63
0.16 3.2 372 0.64 4880
25.6 0.2
0.56
1590
7760
1.6 40.3
5 5
0.5
0.5
0.5 0.5
J u B
u
B B B
B J
u B J u
u B B
u u
u R R u u u
3 4 5 5 duoUcate Z 7 &&RIL &&2IL uRIL ua/1:.
. ) "" ~ ·.• , .. • .... ~ \.. \. . . ...-:~~"' ~ .. '!: .it ~ .. ~ , ~ .....
65.8 J 70 J 43.2 J 54.1 J 152 J 73.5 J 2 u 2 u 1 B 2 u 2 u 2 u
1.4 B 1.5 B 1.5 B 1.6 B 1.4 B 1.4 B 26.1 27 31.2 31.4 26.5 26.5
1 u 1 u 0.12 B u u 1 u 14100 14400 9600 9560 14900 14400
0.61 B 0.65 B 0.71 B 0.69 B 0.76 B 0.66 B 0.15 B 0.17 B 0.15 B u 0.29 B 0.16 B
2.7 B 2.9 B 3.1 B 2.8 B 4.2 B 3.2 B 297 332 135 147 427 359
0.45 B 0.47 B 0.54 B 0.37 B 0.71 B 0.63 B 5450 5490 3600 J 3560 J 6210 6120
17.1 20.7 8.9 10.5 22.4 24.6
1.4 0.2 u 0.2 u 0.2 u 0.2 u 0.2 u 0.57 B 0.54 B 0.56 B 0.52 B 0.76 B 0.6 B
1630 J 1870 J 2220 J 21 70 J 1810 J 1800 J I U I U 0.11 B u 0.057 B 1 u
7530 7910 7310 7300 7040 6860 I U 1 u 0.17 B u u 1 u
1.6 B 1.9 B 0.93 B 0.92 B 1.7 B 1.5 B 41.4 B 35.3 B 37.1 B 50.4 B 41 B 47.2 B
5 u 0.44 J 5 u 5 u 5 u 0.31 J 5 u 5 u 0.24 J 0.21 1 5 u 5 u
0.5 u 0.14 1 0.5 u 0.5 u 0.5 u 0.5 u R R R R R R R R R R R R
0.22 J 0.21 J 0.5 u 0.5 u 0.5 u 0.5 u 0.5 u 0.5 u 0.5 u 0.5 u 0.5 u 0.15 B 10 10 0.5 u 0.5 u 1.8 0.4 J
Table Data Oualiflers: B - Positive result is considered to be an artifact of blank contamination, and should not be considered present.
··. 6
64.8 J 0.29 B 1.6 B
24.1
1 u 14900
0.65 B 0.14 B
3.3 B 307
0.72 B
6170 16.6
0.2 u 1.1 B
1860 J 0.04 B
7080 1 u
1.9 B 42.2 B
5 u 5 u
0.5 u R R
0.5 u 0.18 B 0.5 u
1 -- Value is considered estimated due to exceedance of technical quality control criteria or because result is less than the Contract Required Quantitation Limit (CRQL).
R -- Positive result is considered unusable due to exceedance of technical quality control criteria.
U -- Value is a non-detected result as reported bv the laboratorv. UL -- Non-detected result is considered biased low due to exceedance of technical quality control criteria.
Page 28 of40
)
The results of the analytical chemistry analyses have a few quality assurance issues as noted by the data qualifiers. The only parameters that did not have data qualifiers were for barium, calcium, iron, manganese, sodium, 2-Butanone, acetone and trichloroethene. The only parameter the exceeded P ADEP water quality criteria was dissolved iron (maximum of 300 J,lg/L) at WBPC-1, 2, 4,6, and 7.
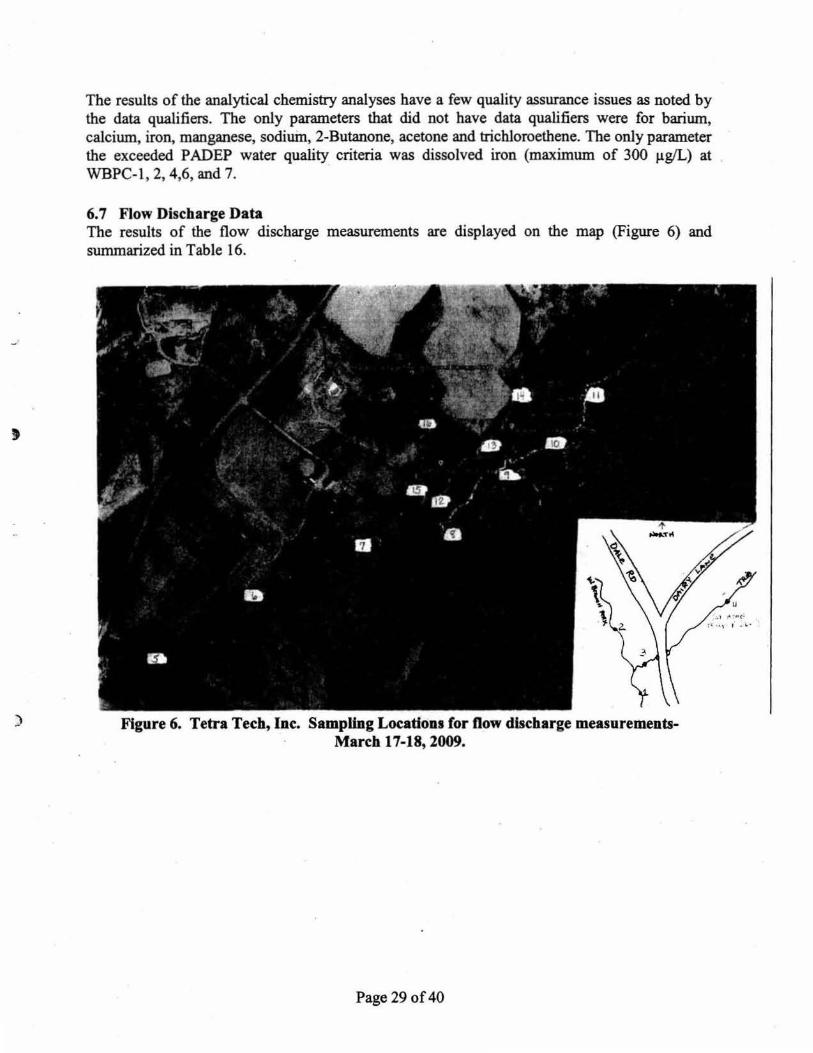
6. 7 Flow Discharge Data The results of the flow discharge measurements are displayed on the map (Figure 6) and summarized in Table 16.
Figure 6. Tetra Tech, Inc. Sampling Locations for now discharge measurementsMarch 17-18, 2009.
Page 29 of40

1
2
3
4
5
6
7
8
9
10
11
12
13
14
15
16
Table 16. West Branch Perkiomen Creek Stream Discharge Measurements (March 17-18, 2009)
Downstream location 40°25.520 N 32.8 0.6
Upstream location
Downstream point on unnamed tributary Unnamed tributary
Unnamed tributary
Unnamed tributary
Unnamed tributary
Unnamed tributary
Unnamed tributary
Unnamed tributary
Unnamed tributary
Unnamed tributary
Unnamed tributary
Unnamed tributary
Unnamed tributary
Unnamed tributary
075°37.013 w 40°25.582 N 22.7 075°37.023 w 40°25.537 N 8.0 075°37.008 w 40°25.546 N 075°36.948 w 40°25.656N 075°36.835 w
8.0
8.3
40°25.705 N 5.2 075°36.758 w 40°25.762 N 7.6 075°36.661 w 40°25.767 N 3.7 075°36.577 w 40°25.817 N 5.3 075°36.512 w 40°25.834 N 5. 7 075°36.453 w 40°25.872 N 6.2 075°36.435 w 40°25.797 N 3.0 075°36.593 w 40°25.826 N 2.0 075°36.553 w 40°25.858 N 2.6 075°36.518 w 40°25.802 N 2.7 075°36.603 w 40°25.862 N 2.0 075°36.590 w
Page30of40
0.5
0.37
0.46
0.333
0.4
0.30
0.43
0.3
0.4
0.233
0.133
0.166
0.133
0.033
0.033
Discli'~roe --: ..,...., , ;
(cubic feet i;_
per - ~ .. .. ~ .. ~~OQll});~ ,.: 10.24
7.49
0.92
0.68
0.85
0.57
0.72
0.336
0.445
0.515
0.409
0.051
0.060
0.050
0.010
0.002

7.0 Discussion
A baseline survey of the water/habitat quality conditions, fish community, brown trout population, and benthic macroinvertebrate community was successfully completed at selected sites within the West Branch Perkiomen Creek watershed in 2008.
7.1In-Situ Physical/Chemical Parameters In-situ water quality parameters included temperature, dissolved oxygen, pH and conductivity. Three of the four parameters have Pennsylvania water quality standards. Temperature was the only in-situ measurement to exceed water quality criteria for trout streams. In-situ temperature ranged from 24.60°C (WBPC-6) to 19.10°C (WBPC-1). All seven monitoring sites had water temperatures greater than the maximum allowed temperature of 18.89°C for a cold water fishery in July (PADEP Water Quality Criteria). Dissolved Oxygen values were above minimum required water quality criteria. pH was within the allowed range of 6-9. Finally, conductivity does not have a Pennsylvania Water Quality Standard; however, the values meet the allowable range for sustenance of aquatic life. Basically. other than water temperature, the in-situ physical/chemical parameters indicate a healthy trout stream.
7.2 Physical Habitat Characterization Overall, the RBP habitat scores fell in the optimal/suboptimal range for aquatic life which indicates that all seven sites are good quality stream reaches. Poor and marginal scores at selected sites are deemed non-sufficient for the maintenance of sensitive aquatic life. Physical habitat is not limiting the quality of the aquatic communities at the seven monitoring sites.
7.3 Continuous Water Temperature Monitoring
Bell (2006) provided a review of the ''Thermal Impacts on Habitat Selection, Growth. Reproduction, and Mortality in Brown Trout (Salmo tru.tta )." The main objective of the Bell (2006) document was to "understand the range and tolerance limits of temperature that are necessary to maintain a self-sustaining brown trout fishery'' in the Vermillion River, Minnesota. The literature based temperature 'criteria values and other information summarized by Bell (2006) were used to evaluate the thermal conditions of the seven monitoring sites within the West Btanch Perkiomen Creek near Bally, .Pennsylvaniil.
As noted in the Bell (2006) document, water ''temperature is the most critical habitat factor affecting trout distribution in a stream." The current watet temperature regime of the West Branch Perkiomen Creek and the unnamed tributary documents that the stream reaches are approaching the upper thermal limits for brown trout on selected days between June and September. The data also strongly suggests the importance of groundwater discharge areas within the- stream and the resultant provision of areas of cold water refugia. Any additional thermal inputs from any sources during the summer months must be evaluated to avoid potential impairment of the brown trout fishery. The thermal regime during the non-summer months is within acceptable limits and should not be an issue. In fact, Smith et al. (1994) documented that slightly warmer stream temperatures (~ 1 oc above background) in the winter months in trout streams improve growth ofbrown trout.
Page 31 of40

Finally, the water temperature differences between the two representative replicate monitors (WBPC-3B versus WBPC-4B) indicate that for the April2008 to April2009 time interval that the average difference was only 0.02 °C and the 95% ofthe values were less than 0.785 °C. Basically, the West Branch Perkiomen Creek appears to exhibit water temperature differences at selected sites; however, the overall mean is only on average 0.02 °C different from one another.
7.4 Fish Surveys
7.4.1 Fish Community Assessment A total of 21 species of fishes was collected from the five monitoring stations located on the mainstem of the West Branch Perkiomen Creek. The fish community was comprised of coldwater, coolwater _and warmwater species of fishes. The source ofthe warmwater species of fishes are probably local ponds.
The overall fish community of the West Branch Perkiomen Creek can not be compared to other exceptional value cold water fishery streams within Pennsylvania because the survey focused on the assessment of the brown trout population not the overall fish community. However, based upon the diversity and number of fish observed during the surveys, the West Branch Perkiomen Creek is a healthy stream.
7.4.2 Brown Trout Population Surveys The West Branch Perkiomen Creek is a designated exceptional value cold water fisheries upstream from the community of Bally, Pennsylvania. A baseline survey of the brown trout fishery was completed at 5 of the 7 monitoring sites within the West Branch Perkiomen Creek watershed in 2008. The results of the surveys indicate that according to the P AFBC criteria for high quality trout streams, WBPC-2, 4, and 7 would be classified as Class A trout stream sections while WBPC-1 and 6 meet the Class B classification criterion as the sites met the reproductive endpoint for a Class A stream but had a biomass· value slightly below the Class A criterion. Both of these sites were borderline in 2008 and have the potential for a Class A Trout Stream Classification. In summary, the mainstem of West Branch Perkiomen Creek supports a Class A/Class B Brown Trout Fishery.
In order to gain a better understanding of this brown trout fishery, the results from 1990 through 2002 for WBPC-1 and 2 were compared to the 2008 results. The data suggests that the quality of the brown trout fishery is variable over the years but the stream reaches are typically a Class A or Class B Trout Stream.
7.5 Benthic Macroinvertebrate Surveys The data from the results of the benthic macroinvertebrate surveys indicate a longitudinal pattern where declining benthic macro invertebrate IDI scores indicated increasing stress (either through nutrients, temperature and /or sediments). The higher gradient reaches appeared to offer better conditions for resident macroinvertebrates than lower gradient sites. This pattern was likely most related to increasing anthropogenic stressors acting on in-stream conditions. For example, the upper-most sites (WBPC-1 and WBPC-3) had the highest IDI scores, most sensitive taxa and highest relative abundance of sensitive taxa. The lowest site (downstream ofBally; WBPC- 6)
Page 32 of40

showed less sensitive genera and more facultative to tolerant forms. Here, it is suspected that cumulative land use and potentially the stormwater drainage from the town of Bally and an adjacent dairy operation may have contributed to nutrient and sediment stressors to this reach. The Commonwealth of Pennsylvania has designated the West Branch Perkiomen Creek upstream of the Community of Bally, Pennsylvania as a PAFBC-designated exceptional value coldwater fishery. Since WBPC-6 is located downstream of the community of Bally, it would be downstream of the designated EV -CWF reach.
7.6 Analytical Water Chemistry Survey A baseline survey of the water quality was completed at seven monitoring sites within the West Branch Perkiomen Creek watershed. Quality assurance issues limit the assessment of the water quality for these stream reaches. The only parameters without data qualifiers are for barium, calcium, iron, manganese, sodium, 2-Butanone, acetone, and trichloroethene. The only parameter the exceeded PADEP water quality criteria was dissolved iron (maximum of 300 J.tg/L) at WBPC-1 ,2,4,6,and 7. Based on the baseline data that could be a.Ssessed, the aquatic community located on the West Branch Perkiomen Creek is not limited by water quality.
7.7 Flow Discharge Conditions The data represent a baseline condition assessment of the 16 monitoring stations within the West Branch Perkiomen Creek Watershed.
8.0 Conclusions
The P AFBC designates the West Branch Perkiomen Creek upstream of the community of Bally, P A as a Exceptional Value Cold Water Fishery. A baseline survey of the fish community, benthic macroinvertebrate community and water/habitat quality conditions was successfully completed. The baseline surveys indicate that the West Branch Perkiomen Creek support a quality fish community, high quality benthic macroinvertebrate community and a Class A/Class B brown trout fishery. The West Branch Perkiomen Creek is not limited by physical habitat or water quality conditions; however, current summer/fall water temperature conditions are approaching or exceeding published temperature criteria for preference, tolerance and mortality of adult brown trout. Any additional thermal inputs during the summer/fall months from any sources must be evaluated to avoid potential impairment of the aquatic community. Thermal conditions should not be an issue on the mainstem of the West Branch Perkiomen Creek during the winter months.
Page 33 of40

9.0 Literature Cited
Barbour, M.T., J. Gerritsen, B.D. Snyder, and J.B. Stribling. 1999. Rapid Bioassessment Protocols for Use if Streams and Wadeable Rivers: Periphyton, Benthic Macroinvertebrates and fish, Second Edition. EPA 841-B-99-002. U.S. Environmental Protection Agency; Office of Water; Washington, D.C.
Berman, Russ 2009. Pennsylvania Fish & Boat Commission. Personal Communication.
Chapman, D. W., in Methods for Assessment ofFish Production in Fresh Waters (ffiP Handbook No.3) (edit. by Ricker, W. E.) (Blackwell, Oxford, 1968).
J.M. Bell. 2006. The Assessment of Thermal Impacts on habitat Selection, Growth, Reproduction, and Mortality in Brown Trout (Salmo trutta L): A Literature Review. Vermillion River USEP A Grant #WS 97512701-0 Vermillion River watershed Joint Powers Board.
McCormick F.H., and R.M. Hughes. 1998. Aquatic Vertebrates. Section 12 JNLazorchak:, J.M., Klemm, D.J., and D.V. Peck (editors). Environmental Monitoring and Assessment Program -Surface Waters: Field Operations and Methods for Measuring the Ecological Condition of Wadeable Streams. EPA/620/R-94/004F. U.S. Environmental Protection Agency, Washington, D.C.
Pennsylvania Department of Environmental Protection. 2005. Draft Standardized Biological Field Collecting and Laboratory Methods.
Plafkin J.L., M.T.Barbour, K.D. Porter, S.K. Gross, and R.M. Hughes. 1989. Rapid Bioassessment protocols for use in streams and rivers: Benthic macroinvertebrates and fish. U.S. Environmental Protection Agency, Office of Water Regulations and Standards, Washington, D.C. EPA 440-4-89-001.
G.A. Smith. 1994. The effect of temperature on growth of Age-0 Brown Trout. M.S. Thesis. The Pennsylvania State University. 59 pp.
Page 34 of40

,
APPENDIX A- Brown Trout Data
WBPC 1 -WEST BRANCH PERKIOMEN CREEK- UPSTREAM OF CROSSLEY FARM istorical P AFBC Site 201 River Mile 9. - JULY 2008
SIZE CLASS RANGE
(mm)
0-24 25-49 50-74 75-99
100-124 125-149 150-174 175-199 200-224 225-249 250-274 275-299 300-324 324-349 350-374
. 375-399
TOTALS
DAY 1 DAY2 MARK UNMARKE
ED D
0 0 0 0 9 8 2 2 0 0 15 4 44 18 12 7 8 5 9 3 8 3 0 3 0 0 0 0 0 0 0
48
DAY2 RECAPTURE
D
0 0 0 0 0 7 27 .
8 6 5 3 2 0 0 0
TOTAL NUMBE
R TROUT (DAY 2)
0 0 8 2 0 11 45 15 11 8 4 2 0 0 0
TOTAL NUMB EROF TROUT (DAY 1+ 2 ,o 0 17 4 0 19 62 19 13 12 9 3 3 0 0
PA STATEWIDE
AVERAG E
WEIGHTS
0
3 6 14 26 43 67 97 135 182 238 306 388 483 603
., ' I
BIOMAS s
PER SIZE
CLASS
0 0
51 24 0
494 2666 1273 1261 1620 1638 714 918 0 0 0
i0659 '
10659
SITE 1 -WEST BRANCH PERKIOMEN CREEK UPSTRJ:AM OF CROSSLEY FARMS SITE
(Historical PAFBC M.onlt~rlng Station 0201)
• MARKED (M) • UNMARKED '(C) D RECAPTURED MARKED ('R)
Page35 of40
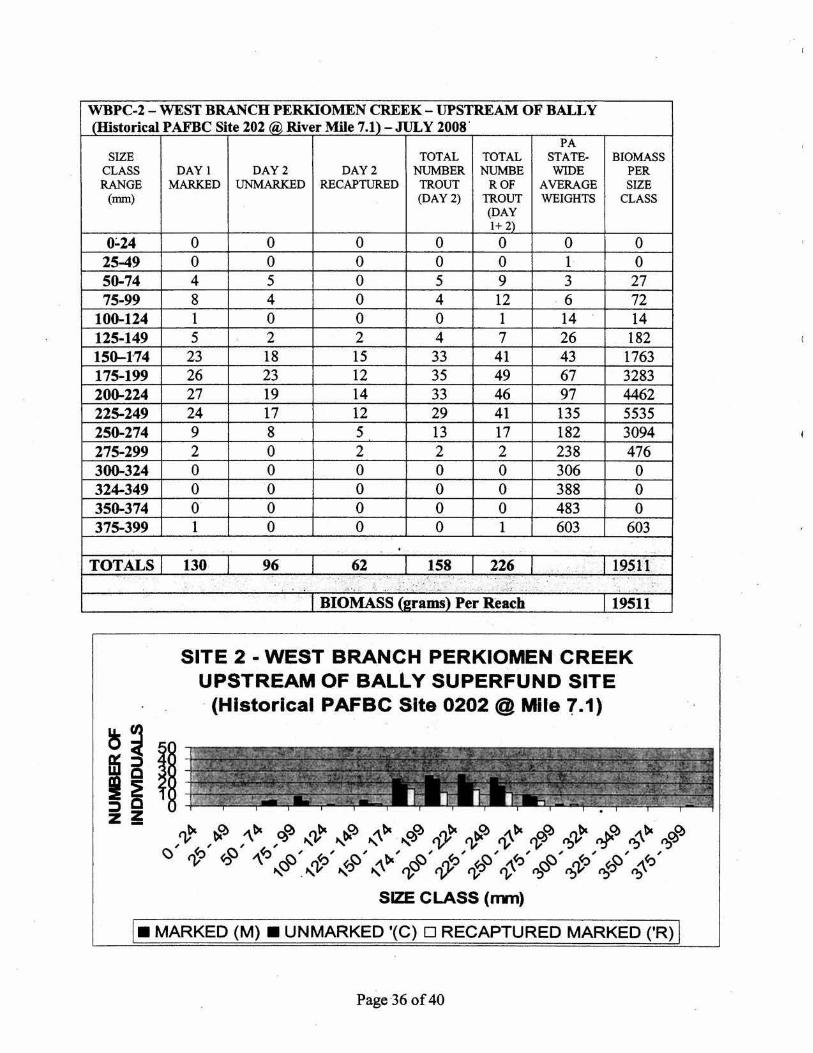
WBPC-2- WEST BRANCH PERKIOMEN CREEK- UPSTREAM OF BALLY (Historical P AFBC Site 202 (Q) River Mile 7.1) - JULY 2008 ·
PA SIZE TOTAL TOTAL STATE- BIOMASS
CLASS DAY l DAY2 DAY2 NUMBER NUMBE WIDE PER RANGE MARKED UNMARKED RECAPTURED TROUT ROF AVERAGE SIZE
(mm) (DAY 2) TROUT WEIGHTS CLASS (DAY 1+ 2)
o:.24 0 0 0 0 0 0 0 25-49 0 0 0 0 0 1 0 50-74 4 5 0 5 9 3 27 75-99 8 4 0 4 12 . 6 72
100-124 1 0 0 0 1 14 14 125-149 5 2 2 4 7 26 182 150--174 23 18 15 33 41 43 1763 175-199 26 23 12 35 49 67 3283 200-224 27 19 14 33 46 97 4462 225-249 24 17 12 29 41 135 5535 250-274 9 8 5 13 17 182 3094 275-299 2 0 2 2 2 238 476 300-324 0 0 0 0 0 306 0 324-349 0 0 0 0 0 388 0 350-374 0 0 0 0 0 483 0 375-399 1 0 0 0 1 603 603
. TOTALS 130 96 62 158 226 19S.fl . ; . .. . . . ... ' • . · ' . . . ;.;.· . ... ... . ,_ ~ : .. ' ..
BIOMASS (2rams) Per Reach 19511
SITE 2 - WEST BRANCH PERKIOMEN CREEK UPSTREAM OF BALLY SUPERFUND SITE · (Historical PAFBC Site 0202 @ Mile ('.1)
I• MARKED (M). UNMARKED '(C) 0 RECAPTURED MARKED ('R) I
Page -36 of 40
,
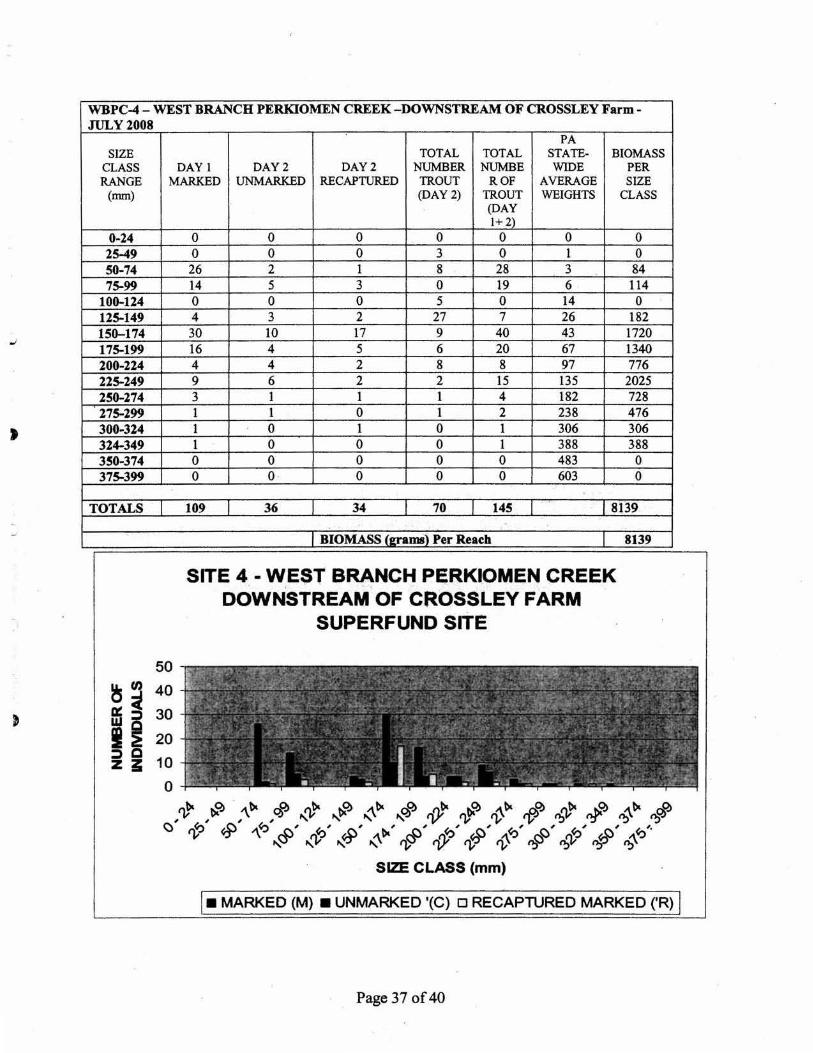
WBPC-4- WEST BRANCH PERKIOMEN CREEK -DOWNSTREAM OF CROSSLEY Farm -JULY2008
PA SIZE TOTAL TOTAL STATE- BIOMASS
CLASS DAY 1 DAY2 DAY2 NUMBER NUMBE WIDE PER RANGE MARKED UNMARKED RECAPTURED TROUT ROF AVERAGE SIZE
(mm)
0-24 25-49 50-74 75-99
100-124 125-149 150-174 175-199 200-224 225-249 250-274 275-299 300-324 324-349 350-374 375-399
TOTALS
50
~ ~ 40 a: 5 30 ~ ~ 20 ~Q z ~ 10
0
(DAY2) TROUT WEIGHTS CLASS (DAY 1+2
0 0 0 0 0 0 0 0 0 0 3 0 1 0 26 2 1 8 28 3 84 14 5 3 0 19 6 114 0 0 0 5 0 14 0 4 3 2 27 7 26 182 30 10 17 9 40 43 1720 16 4 5 6 20 67 1340 4 4 2 8 8 97 776 9 6 2 2 15 135 2025 3 1 1 1 4 182 728
1 0 1 2 238 476 0 1 0 1 306 306
1 0 0 0 1 388 388 0 0 0 0 0 483 0 0 0 - 0 0 0 603 0
36 8139
8139
SITE 4 - WE$T BRANCH PERKIOMEN CREEK DOWNSTREAM OF CROSSLEY FARM
SUPERFUND SITE
~~--. ""'" cry"J;• -, .,_ ':. : -~:;-.7~ -, . ..,.~ -- " -·-·o.r ~.,,.
~··: . -.. :>i. .. ., ~~.· ..... '":·." ..: :~ ; ,. ... c --t:) ' .- ..
,r -· > .. >· .,. . I .. l .. .- .
~ I '
; ~
~. - I - ·-1 • ~ ' I -,. • ... ~~·-·- .!. .. ~ 5.!; ---- -~ -· -~
I• MARKED (M) • UNMARKED '(C) 0 RECAPTURED MARKED ('R) I
Page 37 of 40

WBPC-6- WEST BRANCH PERKIOMEN CREEK- DOWNSTREAM OF BALLY-JULY 2008
SIZE CLASS RANGE
(mm)
0-24 25-49 50-74 75-99
100-124 125-149 150-174 175-199 200-224 225-249 250-274 275-299 300-324 324-349 350-374 375-399
TOTALS
PA TOTAL TOTAL STATE-
DAY1 DAY2 DAY2 NUMBER NUMBE WIDE MARKED UNMARKED RECAPTURED TROUT ROF AVERAGE
(DAY 2) TROUT WEIGHTS (DAY 1+
2) 0 0 0 0 0 0 0 0 0 3 5 1 2 3 0 1 1 3 0 1 0 0 0 6 0 0 0 3 4 14 1 3 0 10 14 26 5 9 1 6 10 43 5 5 1 6 11 67 6 5 1 8 11 97 6 5 3 10 15 135 7 8 2 3 5 182 3 2 1 6 7 238 4 3 3 4 5 306 4 1 3 2 4 388 3 1 1 0 0 483 0 0 0 0 0 603
46 46 16 62 92
BIOMASS (&rams) Per Reacb
SITE 6 -WEST BRANCH PERKIOMEN CREEK DOWNSTREAM OF BALLY SUPERFUND SITE
SIZE CLASS (mm)
BIOMASS PER SIZE
CLASS
0 5 3 0 56
364 430 737 1067 2025 910 1666 1530 1552
0 0
10345 ..
10345
I• MARKED (M) • UNMARKED '(C) 0 RECAPTURED MARKED ('R) I
Page 38 of40

)
WBPC- 7- WEST BRANCH PERKIOMEN CREEK - UPSTREAM OF BALLY-JULY 2008
SIZE CLASS RANGE
(mm)
0-24 25-49 S0-74 75-99
100-124 125-149 150-174 175-199 200-224 225-249 250-274 275-299 300-324 324-349 350-374 375-399
TOTALS
PA TOTAL TOTAL STATE-
DAY1 DAY2 DAY2 NUMBER NUMBE WIDE MARKED UNMARKED RECAPTURED TROUT ROF AVERAGE
(DAY2) TROUT WEIGHTS (DAY 1+
2) 0 0 0 0 0 0 0 0 ·o 0 0 1 1 1 0 1 2 3 6 4 0 4 10 6 1 0 0 0 1 14 1 5 1 6 7 26
21 11 10 21 42 43 10 4 4 - 8 18 67 12 8 8 16 28 97 10 6 6 12 22 135 7 4 4 8 15 182 3 1 1 2 5 238 1 0 0 0 1 306 1 1 1 2 3 388 1 2 2 4 5 483 0 0 0 0 0 603
75 47 37 84 159
BIOMASS (r rams) Per Reach
SITE 7 ·WEST BRANCH PERKIOMEN CREEK UPSTREAM OF BALLY SUPERFUND SITE
SIZE CLASS (mm)
BIOMASS PER SIZE
CLASS
0 0 6
60 14 182 1806 1206 2716 2970 2730 1190 306 1164 2415
0
16765
I• MARKED (M) • UNMARKED '(C) 0 RECAPlURED MARKED ('R) I
Page 39 of40

Acentrella
Acerpenna
Acroneuna
Agnetlna
Ancyttdae
Antocha
Athenx
Baetis
Caenls
Cambarus
Caratopsyche
Cheumatopsyche
Ctitmarra Chlronorridae
Dlcranota
Dlphetor Dolophllodes
Drunelta
Dublraphia
Brridae
Epeorus
Ephemerella
Garrmarus Glossosorna
~idae
Hemerodronia
Heptagenlldae
Hexatoma
Hydracarina
Hydropsyche
Hydropsychldae
Hydroptlla
Hydroptllidae
lsonychla
Lanthus
Lepldostorna
Leptophleblldae
Leucotrichla
Leucrocuta
Leuctra
Limnophila
Lype
Maocaffmium
Miaasema
Nematoda
Nemortea
Oligochaeta
Optioservus
Oulimnius
Paragnetina
Peltoperlidae
Perlesta
Perlidae
Plauditus
PromJresia Psephenus
Psycilomyia
Rhyacopbila
Serralella
Simulium
Stenelmis
Stylog~us
Tipula Turbellaria
3
2
2
2
31
17
1
24
16
7
12
2
2
2
11
3
25
11
4
4
4
4
1
3
1
3
17
20
6
9
31
2
2
3
5
13
S1
16
20
4
3
3
14
3
7
3
2
3
2
2
2
3
42
6S
20
17
34
4
6
17
15
2
2
3
8
2
2
2
4
27
3
3
14
Page40 of40
3
5
4
18
25 1
5
8
9
13
2
3
1
1
5
4
69
14
20
2
2
36
33
32
12
16
15
5
2
4
2
9
3
2
33
3
15
14
36
16
11
28
2
3
3
13
44
2
4
11
7
17
46
13
56
15
3
13
7
2S
4