Embed Size (px)
Citation preview

Results of «Ak Bars» Bank Group in according with IFRS FY’2012

1
•AK BARS plays an important role in the economic development of AK BARS plays an important role in the economic development of Tatarstan by supporting leading industries in the regionTatarstan by supporting leading industries in the region
•Ak Bars is the leading bank in the Republic of Tatarstan (37% of Ak Bars is the leading bank in the Republic of Tatarstan (37% of the total assets and 51% of the total capital in the banking sector the total assets and 51% of the total capital in the banking sector of the Republic)of the Republic)((11))
•At 31 December 2012 the Tatarstan Republic, through ministries, At 31 December 2012 the Tatarstan Republic, through ministries, government agencies and related companies ultimately controlled government agencies and related companies ultimately controlled the Bank. the Bank.
•Top-20 bank in Russia: Top-20 bank in Russia: 117th by assets and 16th by capital7th by assets and 16th by capital(2)(2)
•AK BARS Bank had 4AK BARS Bank had 433 branches and branches and 3344 other offices44 other offices(3)(3). . The Bank The Bank has a broad geographic footprint in 3has a broad geographic footprint in 322 regions in Russia regions in Russia(3)(3). .
AK BARS’s Position in Tatarstan
(1) National Bank of Tatarstan, as of January 1, 2013.(2) Profile, as of January 1, 2013.(3) As of December 31,2012.

2
Reputational Importance
• The Cabinet of Ministers of Tatarstan singled out the Bank as the backbone in the region
Shareholders and Role in Tatarstan’s Economy
AK BARS Bank plays an important role in the implementation of Tatarstan’s regional policy
• AK BARS Bank services the largest companies in Tatarstan (KAMAZ, Tattelekom, TAIF)
• The Bank cooperates closely with the local business community, providing quality service and support
Economic Importance
Financial Importance
• Continuous increase in a number of clients indicate a growth of confidence in the Bank. Clients from Tatarstan accounts for 67% of banks’ customer accounts
Tatarstan Officials represented on the Board of Directors
• Midkhat ShagiakhmetovMinister of Economy of Tatarstan
• Farida VolkovaHead of the State Legal
Directorate of the President of the Republic
• Valery SorokinGeneral Director, OJSC “Svyazinvestneftekhim”
•AK BARS bank is an official agent of the Government of the Tatarstan Republic.
•At 31 December 2012 the Tatarstan Republic, a constituent of the Russian Federation, through ministries, government agencies and related companies ultimately controlled the Bank.

3
• Among Russia’s top 30 retail banks
• Retail portfolio represents almost 20% of the total loan book and advances to customers before provision
• Predominantly focused on consumer and mortgages lending – 44% of retail portfolio respectively
• Offers a wide range of deposits tailored to serve all client segments
• AK BARS Bank services 50% of Tatarstan Republic population
• Principal member of the international MasterCard and VISA payment systems
• About 787,000 plastic cards issued as of December 31, 2012
• 949 ATMs, 2,623 POS terminals, over 486 cash advance terminals as of December 31, 2012
Retail Business
Retail lending Deposits Plastic Cards Operations
Retail business is the most dynamically growing segment – 2.5mn clients as of December 31, 2012, over 300,000 new clients since 2009)

4
• AK BARS Bank had over 51,000 customers
• Loans to corporate customers represent 80% of total loan book
• 62% of the corporate portfolio is represented by companies from construction, trade and finance sectors
• 65% (1) of customer accounts are provided by corporate clients
• State and public organizations are the largest depositors: 21% of total term deposits
• Core services investment banking services includes advisory in corporate finance, arrangement and underwriting of debt capital markets transactions, equity and bonds trading, including REPO
Corporate business is a key segment – represents 47% of total revenues
Corporate Business
Lending Deposits Investment Services
(1 ) Including Government-related entities as of December 31, 2012.

5Asset Analysis
Asset Structure (RUB mln / %) Asset Growth (RUB mln)
• Assets have grown steadily over the last periods
• Assets growth in 2012 was due to the increase of cash and cash equivalents and loans to customers
by 90% and 16% respectively vs. 2011
• Loans and advances to customers represent the largest part of assets structure (64%) as of December 31, 2012.
CAGR=17.3%

6Loan Portfolio
Loan Portfolio Breakdown
Net Loan Portfolio Maturity Profile (RUB m)
• 54% of the portfolio has a maturity of 1 to 5 years
Net Loan Portfolio Breakdown by Industry (%)
2011
• The industry breakdown of the portfolio have changed during 2012 due to the change in share of loans granted to finance industries and individuals.
2012

7Security Portfolio(1)
Securities as of December 31, 2012 (RUB m)
(1) Security portfolio includes securities at fair value through profit or loss and repurchase receivables
Securities as of December 31, 2011 (RUB m)
Corporate shares6 668(22%)
GDR1 323(4%)
ADR20
(0%)
Corporate bonds11 044(37%)
Federal loan bonds8 935(30%)
Investments in mutual funds340(1%)
Municipal bonds1 350(4%)
Corporate Eurobonds625(2%)

8Liabilities / Funding
Liabilities Composition (%) Total Liabilities Growth (RUB m)
• Customer accounts represent the largest part of liabilities (61%) and amounted to RUB 175,315 million as of December 31, 2012.
CAGR = 19.8%

Liabilities / Funding 9
• In September 2012 the Group redeemed syndicated Murabaha facility of USD 60,000 thousand attracted by the Group in September 2011.
• In December 2012 the Group redeemed medium term Eurobonds with a nominal amount of USD 280,000 thousand issued in December 2009 with maturity date in December 2012 and an interest rate of 10.25% p.a.
• In July 2012 the Group redeemed its subordinated debt in the amount of RUB 6,670,000 thousand attracted in August 2005 with an interest rate of 9.5% p.a. in accordance with the contractual maturity; and early repaid the subordinated deposit in the amount of RUB 3,000,000 thousand attracted in May 2012 with an interest rate of 8.0% p.a. and maturing in May 2017.
• In July 2012 the Group issued subordinated Eurobonds in the amount of USD 600,000 thousand with maturity in July 2022 and interest rate of 8.0% p.a.
• In November 2012 the Group issued medium term Eurobonds with a nominal amount of USD 500 000 thousand with a maturity date in November 2015 and an interest rate of 8.75% p.a.

Customer accounts 10
Customer Accounts Maturity Profile (RUB m)
•The industry breakdown of the customer accounts have changed during 2012 due to the change in share of accounts of government authorities and organisations and financial services.
Customer Accounts Breakdown by Industry
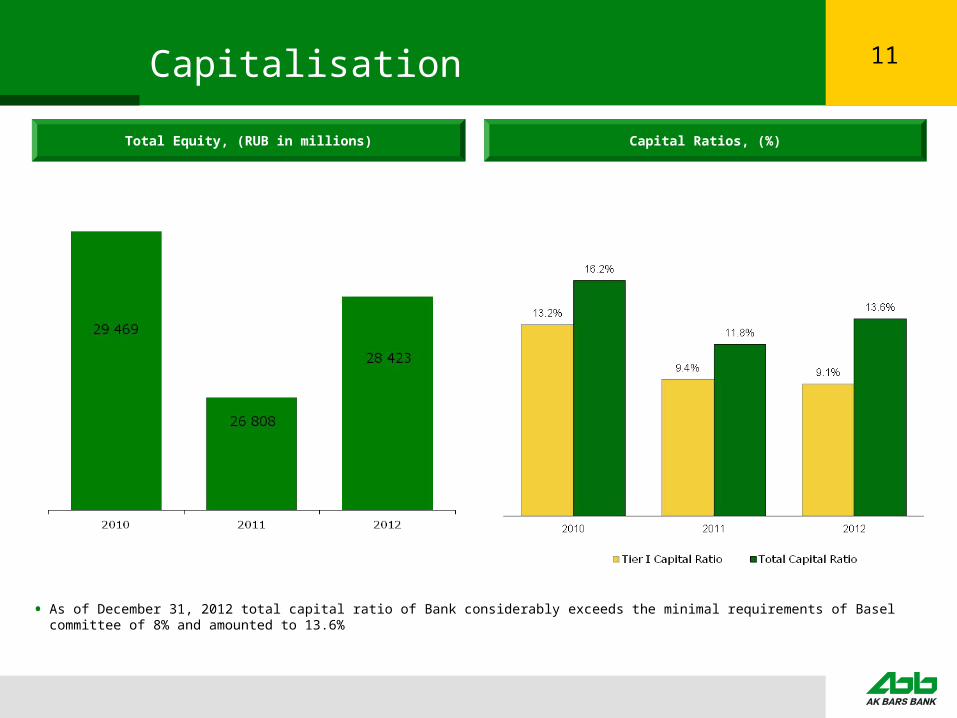
11Capitalisation
Total Equity, (RUB in millions) Capital Ratios, (%)
• As of December 31, 2012 total capital ratio of Bank considerably exceeds the minimal requirements of Basel committee of 8% and amounted to 13.6%

12Financial Highlights (RUB in millions)
Balance SheetVariation,2010-2012
Cash and Equivalents 16 719
Due from other Banks 3 024
Gross Loans 162 452
Provisions (20 275)
Net Loans 142 178
Other Assets
22 938
Total Assets 230 808Due to other Banks 10 865Customer Accounts 126 518
Other Liabilities
Total Liabilities 201 339
Equity 29 469
Total Liabilities and Equity 230 808
Key RatiosNet Loans / Deposits 112.4%
Provisions / Gross Loans 12.5%
Deposits / Assets 54.8%
Equity / Assets 12.8%
Tier 1 Capital Ratio 13.2%
Total Capital Ratio 16.2%
2010 2011 201218 948
3 426194 222(18 267)
175 955
286 94540 404
163 543
26 808
107.6%
9.4%
57.0%
9.3%
9.4%
11.8%
286 945
260 137
Securities portfolio (1)
Investment properties
31 086 47 323
25 67714 863 15 617
Subordinated debt
Murabaha facility and Eurobonds
1 697 1 916
17 622
6 756
10 462
6 725
Securities issued 37 881 37 088
46.7%
13.5%17.7%1.6%
19,8%
5,2%
(1.3%)
7,4%
(1) Security portfolio includes securities at fair value through profit or loss and repurchase receivables
36 004
3 894225 113(20 923)204 190
317 43837 455
175 315
2 158289 015
28 423
317 438
16 573
30 301
26 476
15 251
18 82840 008
116.5%
9.3%
55.2%
9.0%
9.1%13.6%
17,3%85,7%17,7%
66,9%
19,8%
(1,8%)
17,3%
(7,0%)2,8%
12,8%
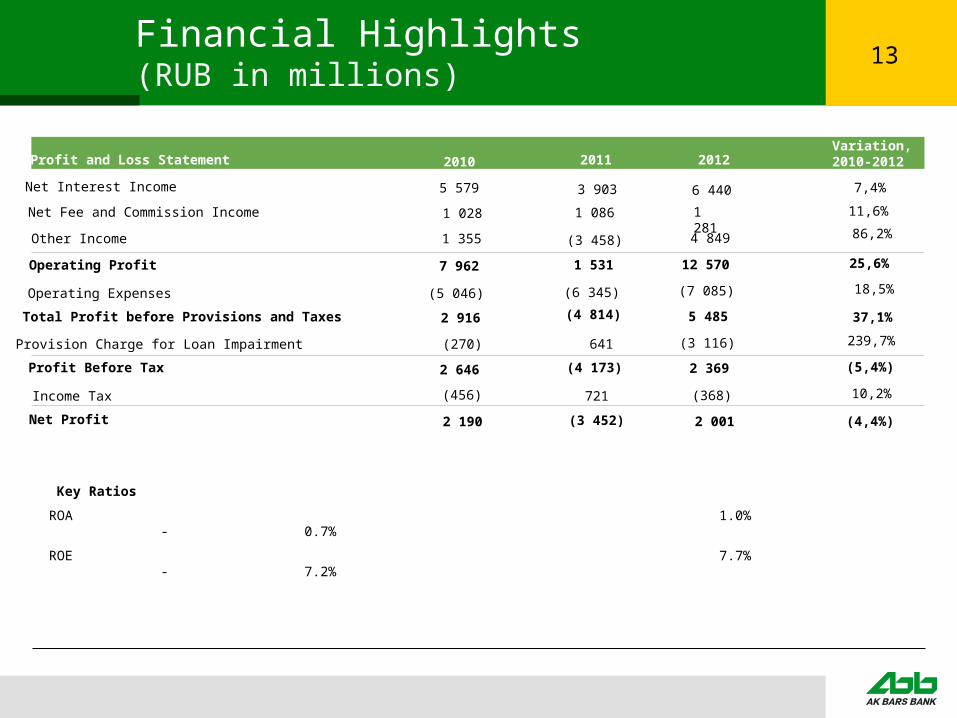
13Financial Highlights (RUB in millions)
Net Interest Income
Net Fee and Commission Income
Other Income
Operating Profit
Operating Expenses
Total Profit before Provisions and Taxes
Provision Charge for Loan Impairment
Profit Before Tax
Income Tax
Net Profit
2010 2011Variation,2010-2012Profit and Loss Statement
Key Ratios
ROA 1.0% - 0.7%
ROE 7.7% - 7.2%
2012
5 579 3 903
1 028 1 086
1 355 (3 458)
7 962 1 531
(5 046) (6 345)
2 916 (4 814)
(270) 641
2 646 (4 173)
(456) 721
2 190 (3 452)
6 440
1 281
4 849
12 570
(7 085)
5 485
(3 116)
2 369
(368)
2 001
7,4%
86,2%
25,6%
18,5%
37,1%
10,2%
(5,4%)
(4,4%)
11,6%
239,7%