Embed Size (px)
Citation preview
PRESS RELEASETuesday 28 February 2019
regulated information
Results of financial year 2018
Thursday 28 February 2019regulated information
2
• Strong revenue growth in the three divisions• Good resilience of results at DEME• Net income, share of the group, remains high despite the absence of non-recurring income in Real Estate Development • Stable dividend compared to previous financial year : € 2.40 gross per share • All-time high order book, marked increase for DEME
In million € 2018 2017 Change2018/2017
Revenue 3,640.6 3,066.5 +18.7%
Self-financing capacity (EBITDA) (*)% of revenue
488.013.4%
500.7 16.3%
-2.5%
Operating income (EBIT) (*)% of revenue
227.26.2%
249.48.1% -8.9%
Net income share of the group% of revenue
171.54.7%
180.45.9% -4.9%
Earnings per share (in euro) Gross dividend per share (in euro) (**)
6.782.40
7.132.40
-4.9%0.0%
1. Key figures 2018
(*) The definitions are included in the ‘Consolidated financial statements’ section of the financial report.(**) Amount to be submitted for approval to the annual general meeting of 2 May 2019.
In million € 2018 2017 Change2018/2017
Equity – share of the group 1,720.9 1,641.9 +4.8%
Net financial debt (*) 648.3 351.9 +84.2%
Order book 5,385.9 4,850.8 +11.0%
Results of financial year 2018
Thursday 28 February 2019regulated information
3
General introduction
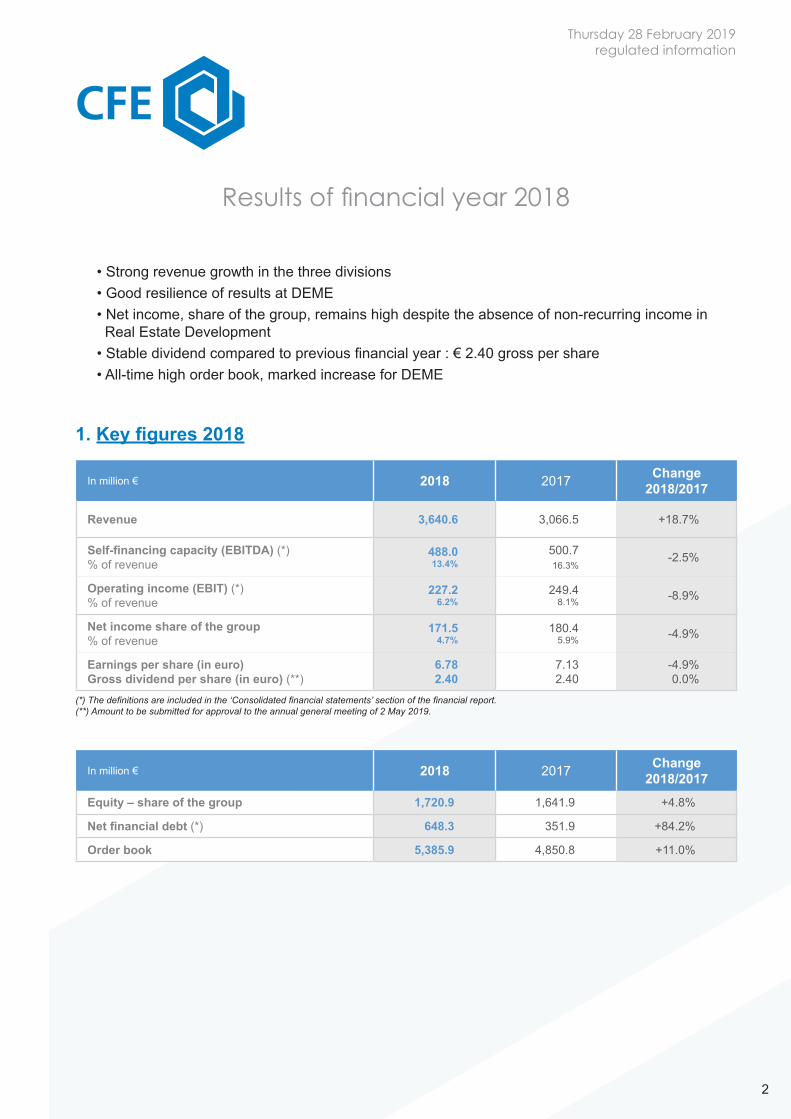
The CFE group reported a substantial consolidated revenue growth in 2018, increasing by 18.7% to € 3,640.6 million in 2018 compared to € 3,066.5 million in 2017. The three divisions reported a vigorous growth in activity.
EBITDA stood at € 488 million, which is slightly down compared to 2017 (€ 500.7 million).
The net result, share of the group, came to € 171.5 million in 2018, or 4.7% of revenue. Where the net result, share of the group, remained stable at DEME and in Contracting, it decreased, as expected, in Real Estate Development, which in 2017 had recorded two extraordinary gains on disposal.
The equity, share of the group, increased by 4.8% to € 1,720.9 million.
The investments in the renewal and expansion of DEME’s fleet increased the net financial debt to € 648.3 million, or 37% of the equity, share of the group.
The order book amply topped € 5 billion, confirming the good commercial positioning of the companies.
Thursday 28 February 2019regulated information
4
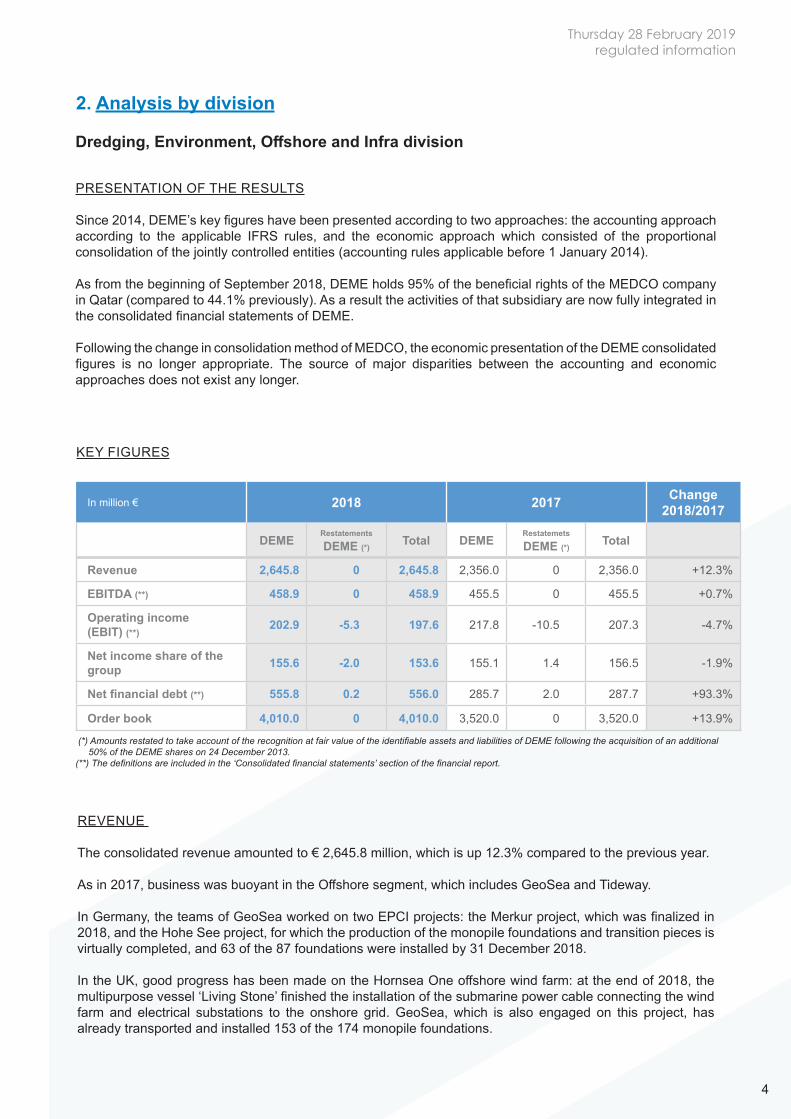
In million € 2018 2017 Change2018/2017
DEMERestatements
DEME (*) Total DEMERestatemets
DEME (*) Total
Revenue 2,645.8 0 2,645.8 2,356.0 0 2,356.0 +12.3%
EBITDA (**) 458.9 0 458.9 455.5 0 455.5 +0.7%
Operating income (EBIT) (**) 202.9 -5.3 197.6 217.8 -10.5 207.3 -4.7%
Net income share of thegroup 155.6 -2.0 153.6 155.1 1.4 156.5 -1.9%
Net financial debt (**) 555.8 0.2 556.0 285.7 2.0 287.7 +93.3%
Order book 4,010.0 0 4,010.0 3,520.0 0 3,520.0 +13.9%
2. Analysis by division
Dredging, Environment, Offshore and Infra division
KEY FIGURES
(*) Amounts restated to take account of the recognition at fair value of the identifiable assets and liabilities of DEME following the acquisition of an additional 50% of the DEME shares on 24 December 2013.(**) The definitions are included in the ‘Consolidated financial statements’ section of the financial report.
PRESENTATION OF THE RESULTS
Since 2014, DEME’s key figures have been presented according to two approaches: the accounting approach according to the applicable IFRS rules, and the economic approach which consisted of the proportional consolidation of the jointly controlled entities (accounting rules applicable before 1 January 2014).
As from the beginning of September 2018, DEME holds 95% of the beneficial rights of the MEDCO company in Qatar (compared to 44.1% previously). As a result the activities of that subsidiary are now fully integrated in the consolidated financial statements of DEME.
Following the change in consolidation method of MEDCO, the economic presentation of the DEME consolidated figures is no longer appropriate. The source of major disparities between the accounting and economic approaches does not exist any longer.
REVENUE
The consolidated revenue amounted to € 2,645.8 million, which is up 12.3% compared to the previous year.
As in 2017, business was buoyant in the Offshore segment, which includes GeoSea and Tideway.
In Germany, the teams of GeoSea worked on two EPCI projects: the Merkur project, which was finalized in 2018, and the Hohe See project, for which the production of the monopile foundations and transition pieces is virtually completed, and 63 of the 87 foundations were installed by 31 December 2018.
In the UK, good progress has been made on the Hornsea One offshore wind farm: at the end of 2018, the multipurpose vessel ‘Living Stone’ finished the installation of the submarine power cable connecting the wind farm and electrical substations to the onshore grid. GeoSea, which is also engaged on this project, has already transported and installed 153 of the 174 monopile foundations.
Thursday 28 February 2019regulated information
5
In Denmark, GeoSea was in charge of the production, transport and installation of the 49 monopile foundations and transition pieces, as well as the installation of the masts and wind turbines for the Horns Rev 3 offshore wind farm. The works are virtually completed.
In the dredging segment, DEME continued work on the TTP1 project (Tuas Terminal - Phase 1), which has entered its final phase, and has just started dredging work to deepen the access channel to the port of Szczecin in Poland. Maintenance dredging activity was primarily concentrated in Belgium, Africa, India and Germany.
DEME’s Environment division achieved a revenue increase in 2018. In this activity, there is a dispute with the client Rijkswaterstaat (Netherlands) regarding the execution of the Julianakanaal contract.
DIMCO, the subsidiary specializing in marine civil engineering, reported a substantial growth of business, particularly in the Netherlands where three major projects are in the start-up phase: the RijnlandRoute link, the Terneuzen lock, and the A24-Blankenburg connection.
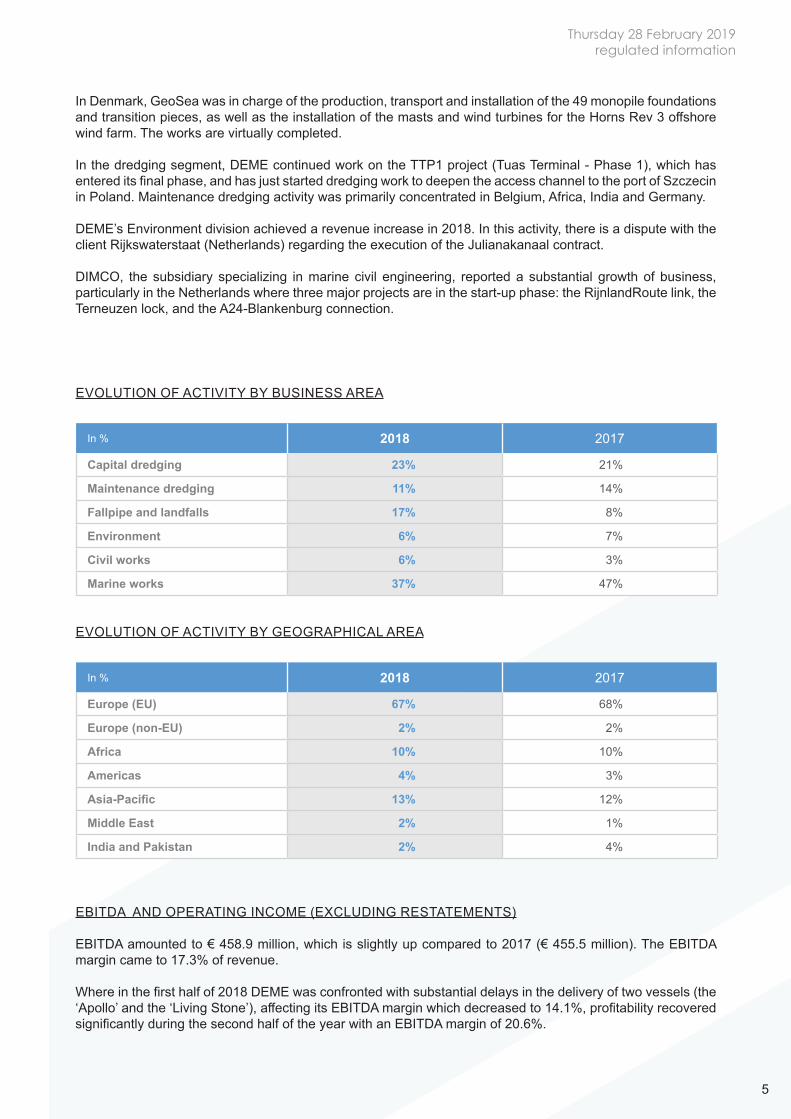
EVOLUTION OF ACTIVITY BY BUSINESS AREA
In % 2018 2017
Capital dredging 23% 21%
Maintenance dredging 11% 14%
Fallpipe and landfalls 17% 8%
Environment 6% 7%
Civil works 6% 3%
Marine works 37% 47%
EVOLUTION OF ACTIVITY BY GEOGRAPHICAL AREA
In % 2018 2017
Europe (EU) 67% 68%
Europe (non-EU) 2% 2%
Africa 10% 10%
Americas 4% 3%
Asia-Pacific 13% 12%
Middle East 2% 1%
India and Pakistan 2% 4%
EBITDA AND OPERATING INCOME (EXCLUDING RESTATEMENTS)
EBITDA amounted to € 458.9 million, which is slightly up compared to 2017 (€ 455.5 million). The EBITDA margin came to 17.3% of revenue.
Where in the first half of 2018 DEME was confronted with substantial delays in the delivery of two vessels (the ‘Apollo’ and the ‘Living Stone’), affecting its EBITDA margin which decreased to 14.1%, profitability recovered significantly during the second half of the year with an EBITDA margin of 20.6%.
Thursday 28 February 2019regulated information
6
The operating income amounted to € 202.9 million in 2018, or a 6.8% decrease due, among other things, to an increase in depreciation cost as several new vessels were brought into service.
ORDER BOOK
The order book amounted to € 4.01 billion, which is up 13.9% compared to year-end 2017.
Order intake was particularly high in the fourth quarter of 2018, during which DEME won three major contracts worth a total of around € 1.5 billion:
• The EPCI contract for the design, construction, transport and installation of 100 wind turbine foundations and the transport and installation of three electrical substations for the Moray East offshore wind farm in the United Kingdom.
• The EPCI contract for the design, construction, transport and installation of 58 wind turbine foundations, electrical substations and two submarine power cables for the SeaMade offshore wind farm 50 km off the Belgian coast. This order is worth around € 500 million for DEME. Offshore work will start in June 2019 and will finish at the end of 2020. The wind farm will have a capacity of 487 MW.
• The DBFM contract for the Blankenburg connection, for which the financial close was reached on 17 October 2018. The Blankenburg connection involves the design, construction, financing and 20-year maintenance of a three-lane motorway link over a length of 4 km with two tunnels, one of which is a 900-metre immersed tunnel. This project is worth around € 1 billion, just under half of which is for DEME.
As regards the Fehmarnbelt link, which was not yet included in the order book at 31 December 2018 (€ 710 million), the environmental permits on the German side have been granted but are still open to appeal.
INVESTMENTS
Investments amounted to € 441.3 million in 2018, and primarily consist of down payments on the vessels ‘Orion’ and ‘Spartacus’, and payment of the remaining balance on the vessels ‘Living Stone’ and ‘Apollo’, which became operational in mid-2018.
In the second half of 2018, DEME started the construction of four new vessels for a total amount of € 133 million. They include two trailing suction hopper dredgers with a capacity of 2,300 m³ and 8,300 m³ respectively (‘River Thames’ and ‘Meuse River’), and two self-propelled barges with a capacity of 3,500 m³ each (‘Bengel’ and ‘Deugniet’). These four vessels will be built by the IHC shipyard, and are due for completion in 2020.
In addition to investments in its fleet, DEME invested more than € 30 million in its minority interests in offshore wind farm concessions.
Following the change in consolidation method of MEDCO, the fleet of that company, which essentially consists of two cutters, was recognized at fair value in the group’s non-current assets for an amount of € 79.6 million.
NET FINANCIAL DEBT
DEME’s net financial debt amounted to € 555.8 million at 31 December 2018. This had increased by € 270.1 million in 2018 as a result of the investments in the maintenance, renewal and expansion of the fleet and the increased working capital requirement (decrease in cash advances).
DEME has successfully refinanced its € 200 million bond, which matured on 14 February 2019.
Thursday 28 February 2019regulated information
7
CEO CHANGE AT DEME
Luc Vandenbulcke became the new CEO of DEME with effect from 1 January 2019. He succeeds Alain Bernard, who remains a director of DEME and some of its subsidiaries, as well as chairman of the board of directors of DEME Concessions and GSR.
The boards of directors of DEME and CFE thank Alain Bernard very much for the work he has done over the past 12 years. Under his leadership, DEME became one of the leading Belgian groups with a solid international reputation.
DEME OFFSHORE
As of 2019, the activities of GeoSea, Tideway, A2Sea and EverSea are integrated in DEME’s Offshore segment (DEME Offshore).
DEME Offshore offers a comprehensive package of solutions and services to customers in the offshore oil, gas and renewable energy industries.
Thursday 28 February 2019regulated information
8
Contracting division
KEY FIGURES
In million € 2018 2017 Change2018/2017
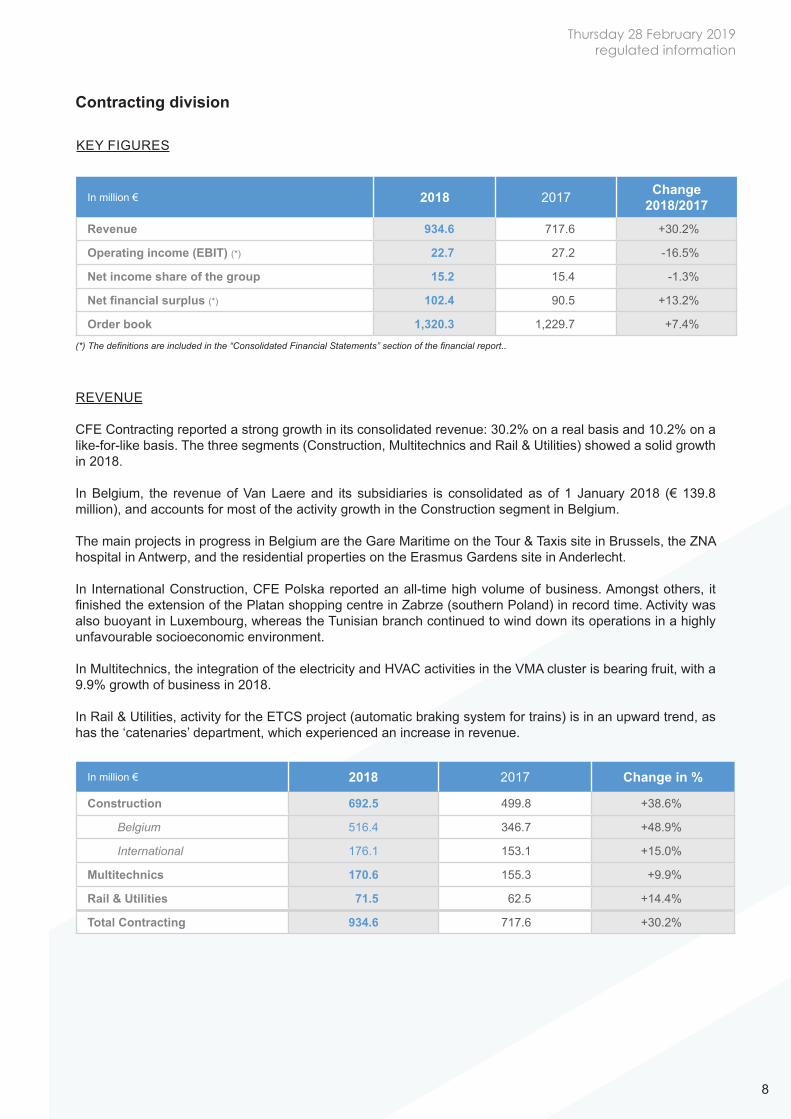
Revenue 934.6 717.6 +30.2%
Operating income (EBIT) (*) 22.7 27.2 -16.5%
Net income share of the group 15.2 15.4 -1.3%
Net financial surplus (*) 102.4 90.5 +13.2%
Order book 1,320.3 1,229.7 +7.4%
(*) The definitions are included in the “Consolidated Financial Statements” section of the financial report..
REVENUE
CFE Contracting reported a strong growth in its consolidated revenue: 30.2% on a real basis and 10.2% on a like-for-like basis. The three segments (Construction, Multitechnics and Rail & Utilities) showed a solid growth in 2018.
In Belgium, the revenue of Van Laere and its subsidiaries is consolidated as of 1 January 2018 (€ 139.8 million), and accounts for most of the activity growth in the Construction segment in Belgium.
The main projects in progress in Belgium are the Gare Maritime on the Tour & Taxis site in Brussels, the ZNA hospital in Antwerp, and the residential properties on the Erasmus Gardens site in Anderlecht.
In International Construction, CFE Polska reported an all-time high volume of business. Amongst others, it finished the extension of the Platan shopping centre in Zabrze (southern Poland) in record time. Activity was also buoyant in Luxembourg, whereas the Tunisian branch continued to wind down its operations in a highly unfavourable socioeconomic environment.
In Multitechnics, the integration of the electricity and HVAC activities in the VMA cluster is bearing fruit, with a 9.9% growth of business in 2018.
In Rail & Utilities, activity for the ETCS project (automatic braking system for trains) is in an upward trend, as has the ‘catenaries’ department, which experienced an increase in revenue.
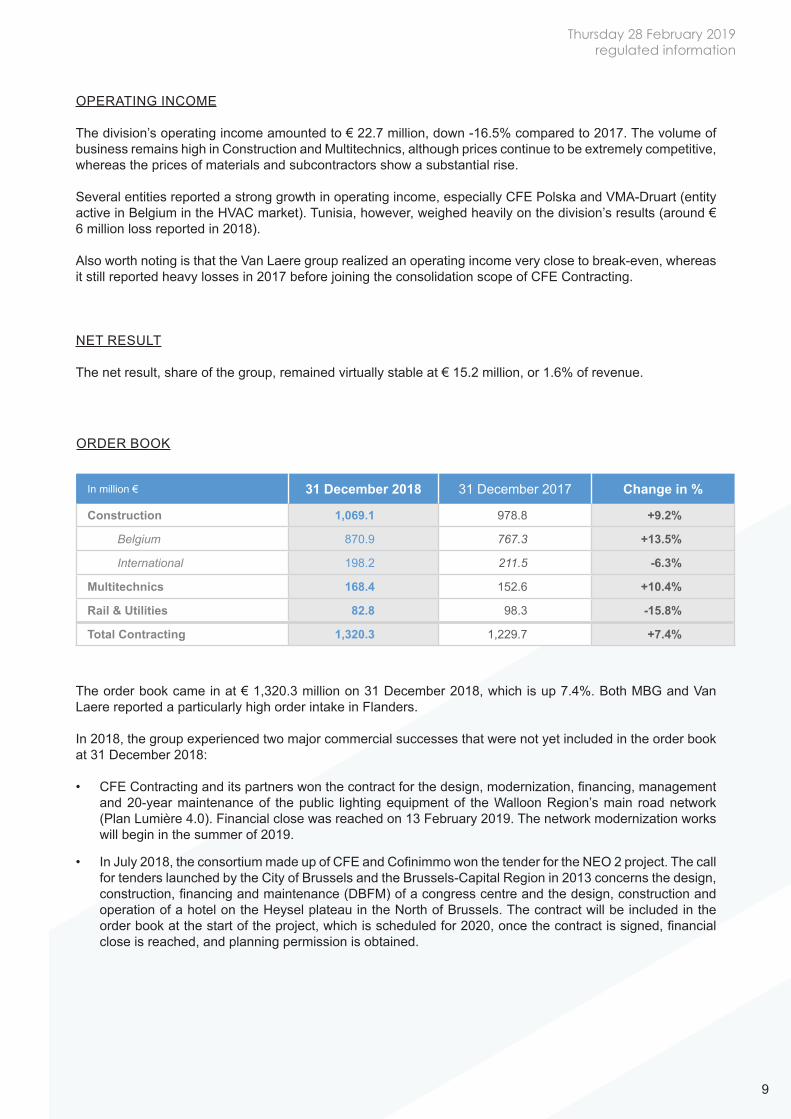
In million € 2018 2017 Change in %
Construction 692.5 499.8 +38.6%
Belgium 516.4 346.7 +48.9%
International 176.1 153.1 +15.0%
Multitechnics 170.6 155.3 +9.9%
Rail & Utilities 71.5 62.5 +14.4%
Total Contracting 934.6 717.6 +30.2%
Thursday 28 February 2019regulated information
9
OPERATING INCOME
The division’s operating income amounted to € 22.7 million, down -16.5% compared to 2017. The volume of business remains high in Construction and Multitechnics, although prices continue to be extremely competitive, whereas the prices of materials and subcontractors show a substantial rise.
Several entities reported a strong growth in operating income, especially CFE Polska and VMA-Druart (entity active in Belgium in the HVAC market). Tunisia, however, weighed heavily on the division’s results (around € 6 million loss reported in 2018).
Also worth noting is that the Van Laere group realized an operating income very close to break-even, whereas it still reported heavy losses in 2017 before joining the consolidation scope of CFE Contracting.
NET RESULT
The net result, share of the group, remained virtually stable at € 15.2 million, or 1.6% of revenue.
ORDER BOOK
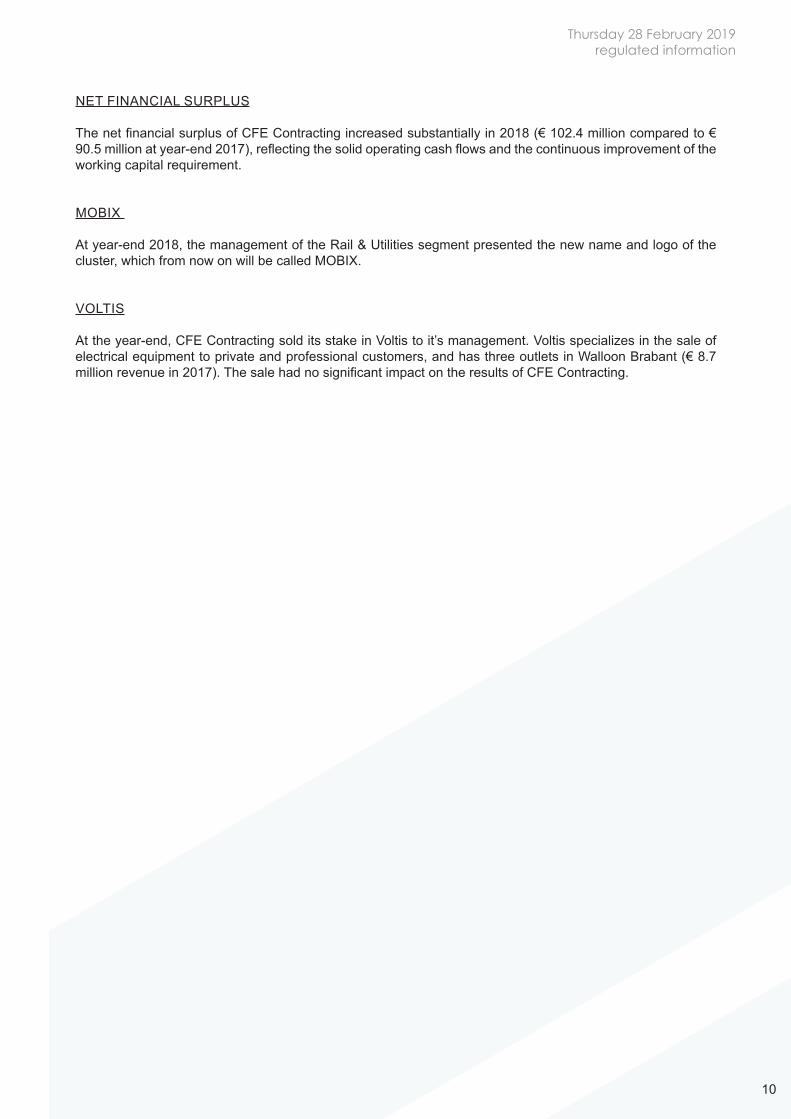
In million € 31 December 2018 31 December 2017 Change in %
Construction 1,069.1 978.8 +9.2%
Belgium 870.9 767.3 +13.5%
International 198.2 211.5 -6.3%
Multitechnics 168.4 152.6 +10.4%
Rail & Utilities 82.8 98.3 -15.8%
Total Contracting 1,320.3 1,229.7 +7.4%
The order book came in at € 1,320.3 million on 31 December 2018, which is up 7.4%. Both MBG and Van Laere reported a particularly high order intake in Flanders.
In 2018, the group experienced two major commercial successes that were not yet included in the order book at 31 December 2018:
• CFE Contracting and its partners won the contract for the design, modernization, financing, management and 20-year maintenance of the public lighting equipment of the Walloon Region’s main road network (Plan Lumière 4.0). Financial close was reached on 13 February 2019. The network modernization works will begin in the summer of 2019.
• In July 2018, the consortium made up of CFE and Cofinimmo won the tender for the NEO 2 project. The call for tenders launched by the City of Brussels and the Brussels-Capital Region in 2013 concerns the design, construction, financing and maintenance (DBFM) of a congress centre and the design, construction and operation of a hotel on the Heysel plateau in the North of Brussels. The contract will be included in the order book at the start of the project, which is scheduled for 2020, once the contract is signed, financial close is reached, and planning permission is obtained.
Thursday 28 February 2019regulated information
10
NET FINANCIAL SURPLUS
The net financial surplus of CFE Contracting increased substantially in 2018 (€ 102.4 million compared to € 90.5 million at year-end 2017), reflecting the solid operating cash flows and the continuous improvement of the working capital requirement.
MOBIX
At year-end 2018, the management of the Rail & Utilities segment presented the new name and logo of the cluster, which from now on will be called MOBIX.
VOLTIS
At the year-end, CFE Contracting sold its stake in Voltis to it’s management. Voltis specializes in the sale of electrical equipment to private and professional customers, and has three outlets in Walloon Brabant (€ 8.7 million revenue in 2017). The sale had no significant impact on the results of CFE Contracting.
Thursday 28 February 2019regulated information
11
Real Estate Development division
KEY FIGURES
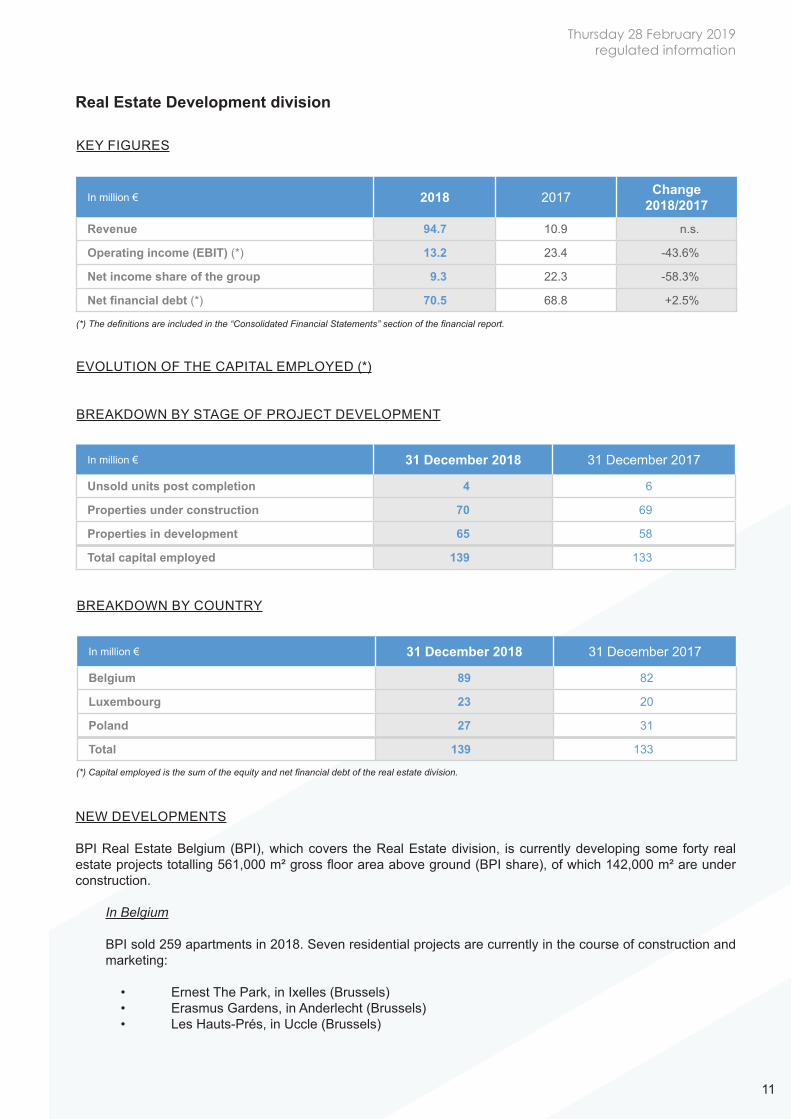
In million € 2018 2017 Change2018/2017
Revenue 94.7 10.9 n.s.
Operating income (EBIT) (*) 13.2 23.4 -43.6%
Net income share of the group 9.3 22.3 -58.3%
Net financial debt (*) 70.5 68.8 +2.5%
(*) The definitions are included in the “Consolidated Financial Statements” section of the financial report.
EVOLUTION OF THE CAPITAL EMPLOYED (*)
BREAKDOWN BY STAGE OF PROJECT DEVELOPMENT
In million € 31 December 2018 31 December 2017
Unsold units post completion 4 6
Properties under construction 70 69
Properties in development 65 58
Total capital employed 139 133
BREAKDOWN BY COUNTRY
In million € 31 December 2018 31 December 2017
Belgium 89 82
Luxembourg 23 20
Poland 27 31
Total 139 133
(*) Capital employed is the sum of the equity and net financial debt of the real estate division.
NEW DEVELOPMENTS
BPI Real Estate Belgium (BPI), which covers the Real Estate division, is currently developing some forty real estate projects totalling 561,000 m² gross floor area above ground (BPI share), of which 142,000 m² are under construction.
In Belgium
BPI sold 259 apartments in 2018. Seven residential projects are currently in the course of construction and marketing:
• Ernest The Park, in Ixelles (Brussels)• Erasmus Gardens, in Anderlecht (Brussels)• Les Hauts-Prés, in Uccle (Brussels)
Thursday 28 February 2019regulated information
12
• Voltaire, in Schaerbeek (Brussels)• Park West, in Brussels• Zen Factory, in Lot-Beersel (Flanders)• Godsheide, in Hasselt (Flanders)
Where the five Brussels projects show highly satisfactory take-up rates, sales are slower for the two projects in Flanders.
Besides its residential projects, BPI is also developing, in joint venture, two office projects in Liège, the Grand Poste project and the Renaissance project, on the Val Benoît site, which is already partially let to a public body.
BPI and its partners have filed a planning application for the NEO 1 project, comprising a shopping centre and more than 500 housing units on the Heysel plateau in Brussels.
The first planning applications for the Samaya project in Ottignies and the Bavière project in Liège have also been filed, while those for the Allianz and Key West projects will be filed in the next few months.
At the end of December 2018, BPI agreed with Cofinimmo on the future acquisition (mid-2020) of the property rights of its office buildings on the Serenitas and Moulin à Papier sites in Auderghem (Brussels), with a total floor area of nearly 23,000 m². The transaction amounts to approximately € 27 million. Those buildings will primarily be converted into residential properties, while part of the Serenitas site will accommodate the future head office of CFE.
In Luxembourg
BPI and its partners obtained planning permission for the Livingstone project situated along Route d’Esch in Luxembourg City (35,000 m²). All the apartments of phases 1 and 2, or 247 housing units, have already been taken up, although work on the first phase has only just begun. On the Kirchberg plateau, the Kiem project has entered its final phase, and acceptance of the apartments is scheduled for the spring of 2019.
BPI has also filed a planning application for the Domaine des Vignes project in Mertert.
In Poland
In June 2018, BPI delivered two mixed-use buildings totalling 40,400 m²: the Immo Wola project in Warsaw, and phase 1 of the Bulwary Kasiazece project in Wroclaw. Virtually all housing units have been sold.
Four residential projects are currently in the course of construction and marketing, totalling 57,000 m² and situated in three large cities in Poland: Warsaw, Wroclaw and Poznan.
BPI also acquired a new building plot in Gdansk for 240 serviced housing units (Sadowa project).
CAPITAL EMPLOYED
The capital employed of real estate projects increased slightly during 2018 to € 139 million. The stock of unsold units post completion remained very low (less than 3%).
Thursday 28 February 2019regulated information
13
NET FINANCIAL DEBT
After having successfully launched its first private placement at the end of 2017 (€ 30 million), BPI further strengthened its financial structure in 2018 by setting up € 40 million worth of confirmed bilateral credit lines, and a Multi-Term treasury Notes programme of € 40 million.
NET RESULT
The net result, share of the group, amounted to € 9.3 million, and was favourably impacted by, among other things, the result recognized according to percentage of completion of the Ernest The Park, Kiem (Luxembourg) and Erasmus Gardens projects, and by the recognition of the margin on the two completed projects in Poland. Unlike under the accounting rules applied in Belgium and in Luxembourg, the margin on the Polish residential projects is only recognized upon delivery.
In 2017, the sale of the Kons project in Luxembourg and the Oosteroever project in Ostend (Belgium) had made an exceptional contribution to BPI’s net result.
Thursday 28 February 2019regulated information
14
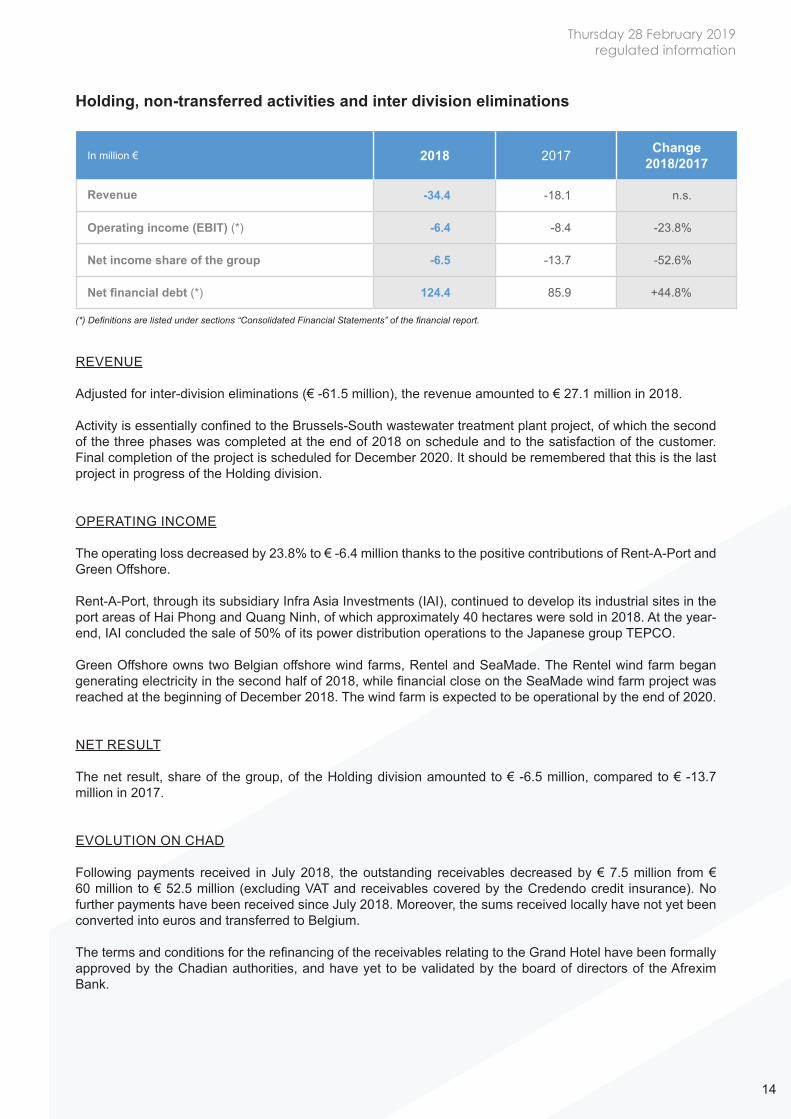
Holding, non-transferred activities and inter division eliminations
In million € 2018 2017 Change2018/2017
Revenue -34.4 -18.1 n.s.
Operating income (EBIT) (*) -6.4 -8.4 -23.8%
Net income share of the group -6.5 -13.7 -52.6%
Net financial debt (*) 124.4 85.9 +44.8%
(*) Definitions are listed under sections “Consolidated Financial Statements” of the financial report.
REVENUE
Adjusted for inter-division eliminations (€ -61.5 million), the revenue amounted to € 27.1 million in 2018.
Activity is essentially confined to the Brussels-South wastewater treatment plant project, of which the second of the three phases was completed at the end of 2018 on schedule and to the satisfaction of the customer. Final completion of the project is scheduled for December 2020. It should be remembered that this is the last project in progress of the Holding division.
OPERATING INCOME
The operating loss decreased by 23.8% to € -6.4 million thanks to the positive contributions of Rent-A-Port and Green Offshore.
Rent-A-Port, through its subsidiary Infra Asia Investments (IAI), continued to develop its industrial sites in the port areas of Hai Phong and Quang Ninh, of which approximately 40 hectares were sold in 2018. At the year-end, IAI concluded the sale of 50% of its power distribution operations to the Japanese group TEPCO.
Green Offshore owns two Belgian offshore wind farms, Rentel and SeaMade. The Rentel wind farm began generating electricity in the second half of 2018, while financial close on the SeaMade wind farm project was reached at the beginning of December 2018. The wind farm is expected to be operational by the end of 2020.
NET RESULT
The net result, share of the group, of the Holding division amounted to € -6.5 million, compared to € -13.7 million in 2017.
EVOLUTION ON CHAD
Following payments received in July 2018, the outstanding receivables decreased by € 7.5 million from € 60 million to € 52.5 million (excluding VAT and receivables covered by the Credendo credit insurance). No further payments have been received since July 2018. Moreover, the sums received locally have not yet been converted into euros and transferred to Belgium.
The terms and conditions for the refinancing of the receivables relating to the Grand Hotel have been formally approved by the Chadian authorities, and have yet to be validated by the board of directors of the Afrexim Bank.
Thursday 28 February 2019regulated information
15
NET FINANCIAL DEBT
On 21 June 2018, CFE redeemed its € 100 million bond that had reached maturity. Refinancing was done by setting up a total of €160 million worth of confirmed bilateral credit lines (maturing in 2023), of which € 130 million was drawn down at 31 December 2018. At the year-end, CFE set up a Multi-Term treasury Notes programme of € 50 million. The first issues took place at the beginning of 2019.
The significant increase in net financial debt is explained by the injection of funds into Rent-A-Port and Green Offshore, and by the utilization of provisions for losses to completion and the decrease in working capital requirement.
Thursday 28 February 2019regulated information
16
3. Overview of the financial statements
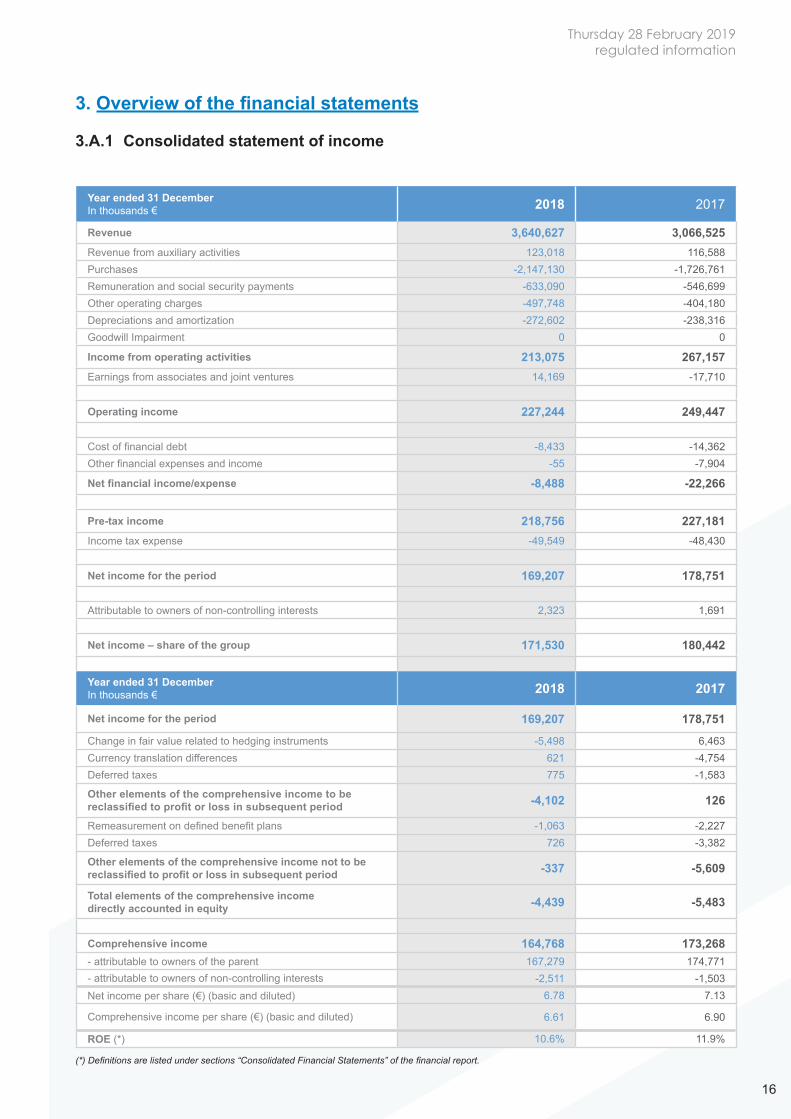
3.A.1 Consolidated statement of income
Year ended 31 DecemberIn thousands € 2018 2017
Revenue 3,640,627 3,066,525Revenue from auxiliary activities 123,018 116,588Purchases -2,147,130 -1,726,761Remuneration and social security payments -633,090 -546,699Other operating charges -497,748 -404,180Depreciations and amortization -272,602 -238,316Goodwill Impairment 0 0
Income from operating activities 213,075 267,157Earnings from associates and joint ventures 14,169 -17,710
Operating income 227,244 249,447
Cost of financial debt -8,433 -14,362Other financial expenses and income -55 -7,904
Net financial income/expense -8,488 -22,266
Pre-tax income 218,756 227,181Income tax expense -49,549 -48,430
Net income for the period 169,207 178,751
Attributable to owners of non-controlling interests 2,323 1,691
Net income – share of the group 171,530 180,442
Year ended 31 DecemberIn thousands € 2018 2017
Net income for the period 169,207 178,751
Change in fair value related to hedging instruments -5,498 6,463Currency translation differences 621 -4,754Deferred taxes 775 -1,583
Other elements of the comprehensive income to be reclassified to profit or loss in subsequent period -4,102 126
Remeasurement on defined benefit plans -1,063 -2,227Deferred taxes 726 -3,382
Other elements of the comprehensive income not to be reclassified to profit or loss in subsequent period -337 -5,609
Total elements of the comprehensive incomedirectly accounted in equity -4,439 -5,483
Comprehensive income 164,768 173,268- attributable to owners of the parent 167,279 174,771- attributable to owners of non-controlling interests -2,511 -1,503Net income per share (€) (basic and diluted) 6.78 7.13
Comprehensive income per share (€) (basic and diluted) 6.61 6.90
ROE (*) 10.6% 11.9%
(*) Definitions are listed under sections “Consolidated Financial Statements” of the financial report.
Thursday 28 February 2019regulated information
17
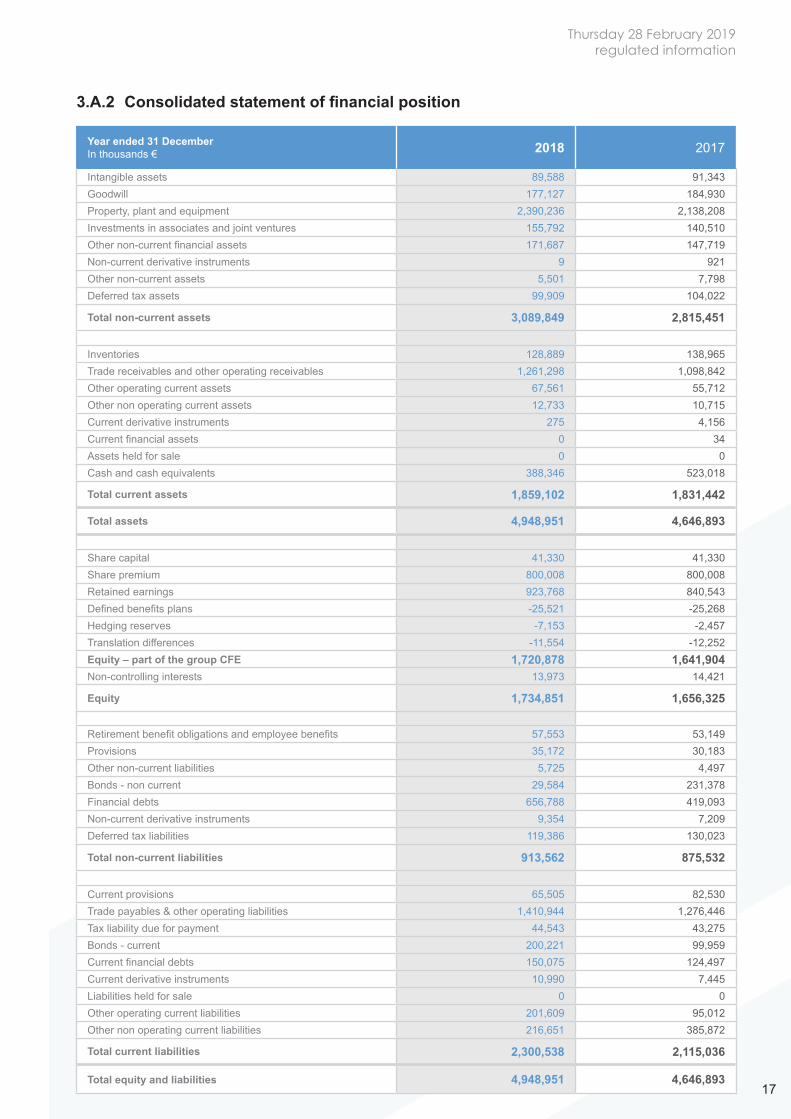
3.A.2 Consolidated statement of financial position
Year ended 31 DecemberIn thousands € 2018 2017
Intangible assets 89,588 91,343Goodwill 177,127 184,930Property, plant and equipment 2,390,236 2,138,208Investments in associates and joint ventures 155,792 140,510Other non-current financial assets 171,687 147,719Non-current derivative instruments 9 921Other non-current assets 5,501 7,798Deferred tax assets 99,909 104,022
Total non-current assets 3,089,849 2,815,451
Inventories 128,889 138,965Trade receivables and other operating receivables 1,261,298 1,098,842Other operating current assets 67,561 55,712Other non operating current assets 12,733 10,715Current derivative instruments 275 4,156Current financial assets 0 34Assets held for sale 0 0Cash and cash equivalents 388,346 523,018
Total current assets 1,859,102 1,831,442
Total assets 4,948,951 4,646,893
Share capital 41,330 41,330Share premium 800,008 800,008Retained earnings 923,768 840,543Defined benefits plans -25,521 -25,268Hedging reserves -7,153 -2,457Translation differences -11,554 -12,252Equity – part of the group CFE 1,720,878 1,641,904Non-controlling interests 13,973 14,421
Equity 1,734,851 1,656,325
Retirement benefit obligations and employee benefits 57,553 53,149Provisions 35,172 30,183Other non-current liabilities 5,725 4,497Bonds - non current 29,584 231,378Financial debts 656,788 419,093Non-current derivative instruments 9,354 7,209Deferred tax liabilities 119,386 130,023
Total non-current liabilities 913,562 875,532
Current provisions 65,505 82,530Trade payables & other operating liabilities 1,410,944 1,276,446Tax liability due for payment 44,543 43,275Bonds - current 200,221 99,959Current financial debts 150,075 124,497Current derivative instruments 10,990 7,445Liabilities held for sale 0 0Other operating current liabilities 201,609 95,012Other non operating current liabilities 216,651 385,872
Total current liabilities 2,300,538 2,115,036
Total equity and liabilities 4,948,951 4,646,893
Thursday 28 February 2019regulated information
18
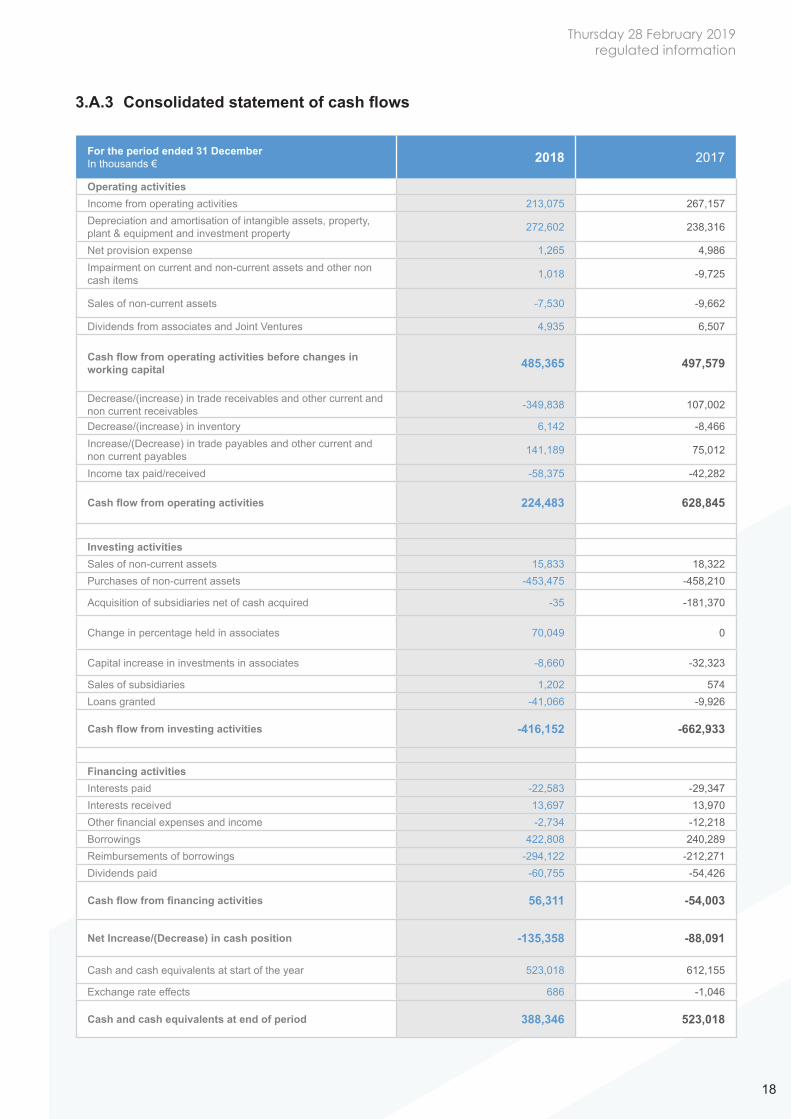
3.A.3 Consolidated statement of cash flows
For the period ended 31 DecemberIn thousands € 2018 2017
Operating activitiesIncome from operating activities 213,075 267,157Depreciation and amortisation of intangible assets, property,plant & equipment and investment property 272,602 238,316
Net provision expense 1,265 4,986Impairment on current and non-current assets and other non cash items 1,018 -9,725
Sales of non-current assets -7,530 -9,662
Dividends from associates and Joint Ventures 4,935 6,507
Cash flow from operating activities before changes in working capital 485,365 497,579
Decrease/(increase) in trade receivables and other current and non current receivables -349,838 107,002
Decrease/(increase) in inventory 6,142 -8,466Increase/(Decrease) in trade payables and other current and non current payables 141,189 75,012
Income tax paid/received -58,375 -42,282
Cash flow from operating activities 224,483 628,845
Investing activitiesSales of non-current assets 15,833 18,322Purchases of non-current assets -453,475 -458,210
Acquisition of subsidiaries net of cash acquired -35 -181,370
Change in percentage held in associates 70,049 0
Capital increase in investments in associates -8,660 -32,323
Sales of subsidiaries 1,202 574Loans granted -41,066 -9,926
Cash flow from investing activities -416,152 -662,933
Financing activitiesInterests paid -22,583 -29,347Interests received 13,697 13,970Other financial expenses and income -2,734 -12,218Borrowings 422,808 240,289Reimbursements of borrowings -294,122 -212,271Dividends paid -60,755 -54,426
Cash flow from financing activities 56,311 -54,003
Net Increase/(Decrease) in cash position -135,358 -88,091
Cash and cash equivalents at start of the year 523,018 612,155
Exchange rate effects 686 -1,046
Cash and cash equivalents at end of period 388,346 523,018
Thursday 28 February 2019regulated information
19
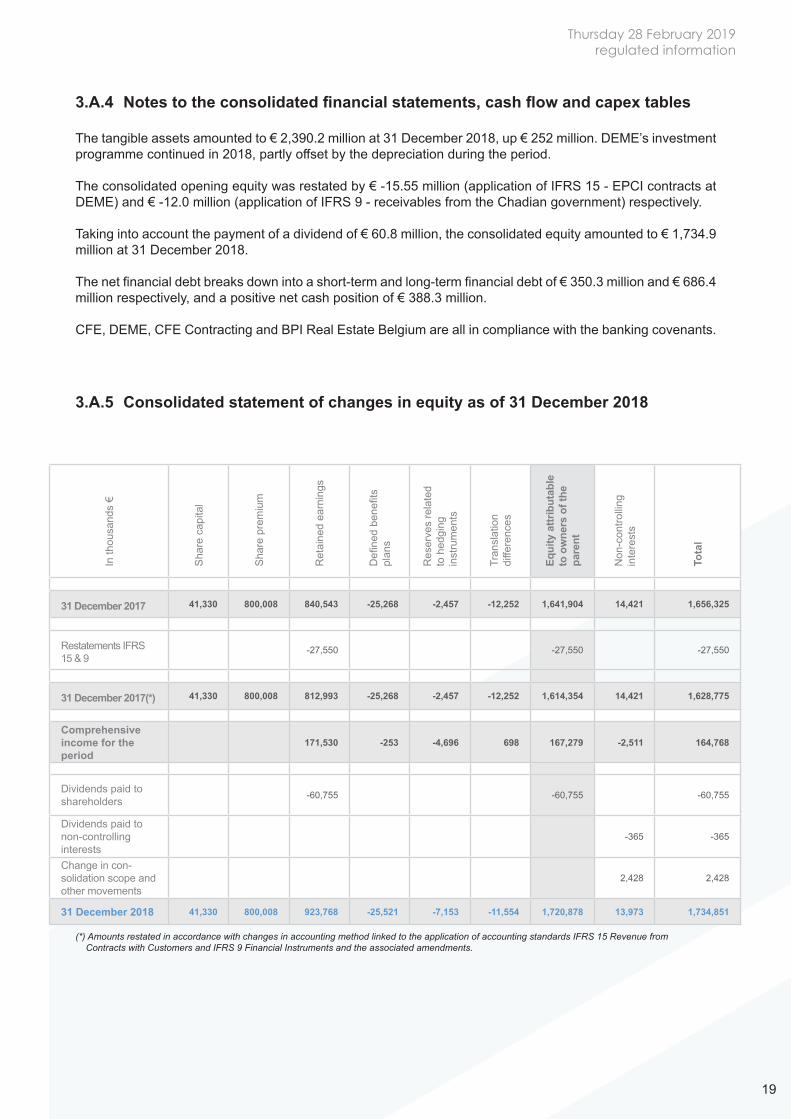
3.A.4 Notes to the consolidated financial statements, cash flow and capex tables
The tangible assets amounted to € 2,390.2 million at 31 December 2018, up € 252 million. DEME’s investment programme continued in 2018, partly offset by the depreciation during the period.
The consolidated opening equity was restated by € -15.55 million (application of IFRS 15 - EPCI contracts at DEME) and € -12.0 million (application of IFRS 9 - receivables from the Chadian government) respectively.
Taking into account the payment of a dividend of € 60.8 million, the consolidated equity amounted to € 1,734.9 million at 31 December 2018.
The net financial debt breaks down into a short-term and long-term financial debt of € 350.3 million and € 686.4 million respectively, and a positive net cash position of € 388.3 million.
CFE, DEME, CFE Contracting and BPI Real Estate Belgium are all in compliance with the banking covenants.
3.A.5 Consolidated statement of changes in equity as of 31 December 2018
In th
ousa
nds
€
Shar
e ca
pita
l
Shar
e pr
emiu
m
Ret
aine
d ea
rnin
gs
Defi
ned
bene
fits
plan
s
Res
erve
s re
late
dto
hed
ging
inst
rum
ents
Tran
slat
ion
diffe
renc
es
Equi
ty a
ttrib
utab
leto
ow
ners
of t
hepa
rent
Non
-con
trollin
gin
tere
sts
Tota
l
31 December 2017 41,330 800,008 840,543 -25,268 -2,457 -12,252 1,641,904 14,421 1,656,325
Restatements IFRS 15 & 9
-27,550 -27,550 -27,550
31 December 2017(*) 41,330 800,008 812,993 -25,268 -2,457 -12,252 1,614,354 14,421 1,628,775
Comprehensiveincome for theperiod
171,530 -253 -4,696 698 167,279 -2,511 164,768
Dividends paid toshareholders -60,755 -60,755 -60,755
Dividends paid tonon-controllinginterests
-365 -365
Change in con-solidation scope and other movements
2,428 2,428
31 December 2018 41,330 800,008 923,768 -25,521 -7,153 -11,554 1,720,878 13,973 1,734,851
(*) Amounts restated in accordance with changes in accounting method linked to the application of accounting standards IFRS 15 Revenue from Contracts with Customers and IFRS 9 Financial Instruments and the associated amendments.
Thursday 28 February 2019regulated information
20
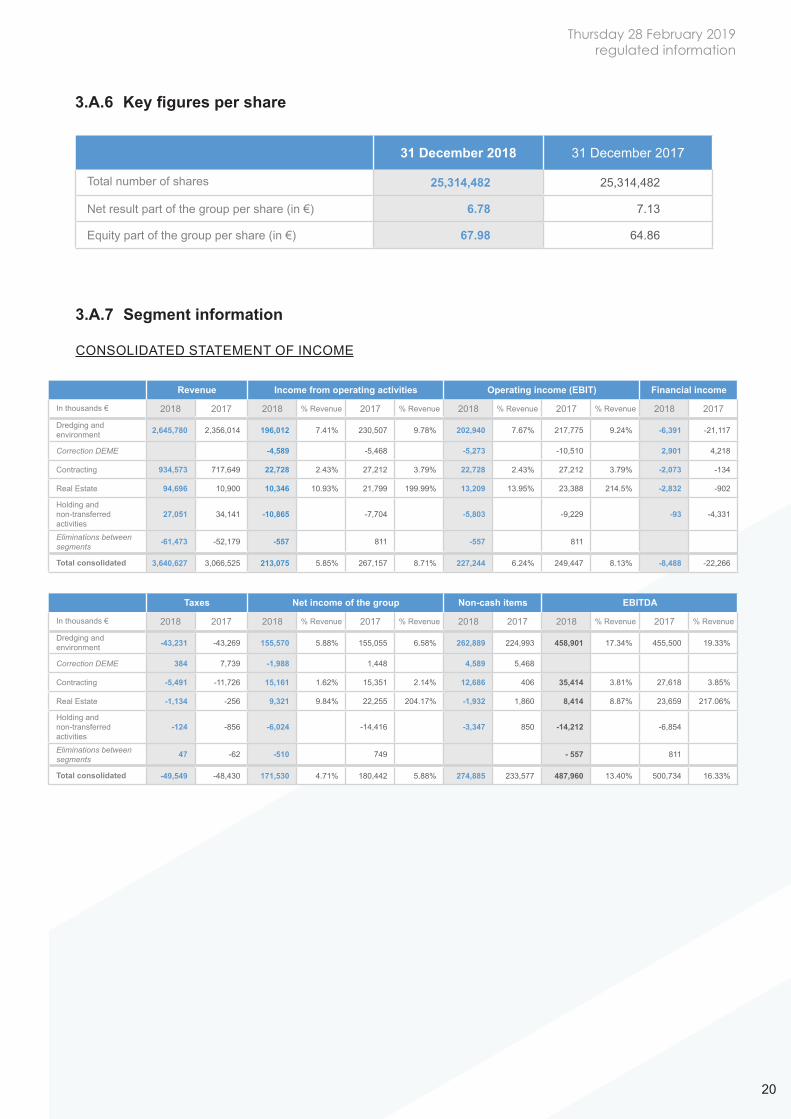
3.A.7 Segment information
CONSOLIDATED STATEMENT OF INCOME
3.A.6 Key figures per share
31 December 2018 31 December 2017
Total number of shares 25,314,482 25,314,482
Net result part of the group per share (in €) 6.78 7.13
Equity part of the group per share (in €) 67.98 64.86
Revenue Income from operating activities Operating income (EBIT) Financial income
In thousands € 2018 2017 2018 % Revenue 2017 % Revenue 2018 % Revenue 2017 % Revenue 2018 2017
Dredging andenvironment 2,645,780 2,356,014 196,012 7.41% 230,507 9.78% 202,940 7.67% 217,775 9.24% -6,391 -21,117
Correction DEME -4,589 -5,468 -5,273 -10,510 2,901 4,218
Contracting 934,573 717,649 22,728 2.43% 27,212 3.79% 22,728 2.43% 27,212 3.79% -2,073 -134
Real Estate 94,696 10,900 10,346 10.93% 21,799 199.99% 13,209 13.95% 23,388 214.5% -2,832 -902
Holding andnon-transferredactivities
27,051 34,141 -10,865 -7,704 -5,803 -9,229 -93 -4,331
Eliminations betweensegments -61,473 -52,179 -557 811 -557 811
Total consolidated 3,640,627 3,066,525 213,075 5.85% 267,157 8.71% 227,244 6.24% 249,447 8.13% -8,488 -22,266
Taxes Net income of the group Non-cash items EBITDA
In thousands € 2018 2017 2018 % Revenue 2017 % Revenue 2018 2017 2018 % Revenue 2017 % Revenue
Dredging andenvironment -43,231 -43,269 155,570 5.88% 155,055 6.58% 262,889 224,993 458,901 17.34% 455,500 19.33%
Correction DEME 384 7,739 -1,988 1,448 4,589 5,468
Contracting -5,491 -11,726 15,161 1.62% 15,351 2.14% 12,686 406 35,414 3.81% 27,618 3.85%
Real Estate -1,134 -256 9,321 9.84% 22,255 204.17% -1,932 1,860 8,414 8.87% 23,659 217.06%
Holding andnon-transferredactivities
-124 -856 -6,024 -14,416 -3,347 850 -14,212 -6,854
Eliminations betweensegments 47 -62 -510 749 - 557 811
Total consolidated -49,549 -48,430 171,530 4.71% 180,442 5.88% 274,885 233,577 487,960 13.40% 500,734 16.33%
Thursday 28 February 2019regulated information
21
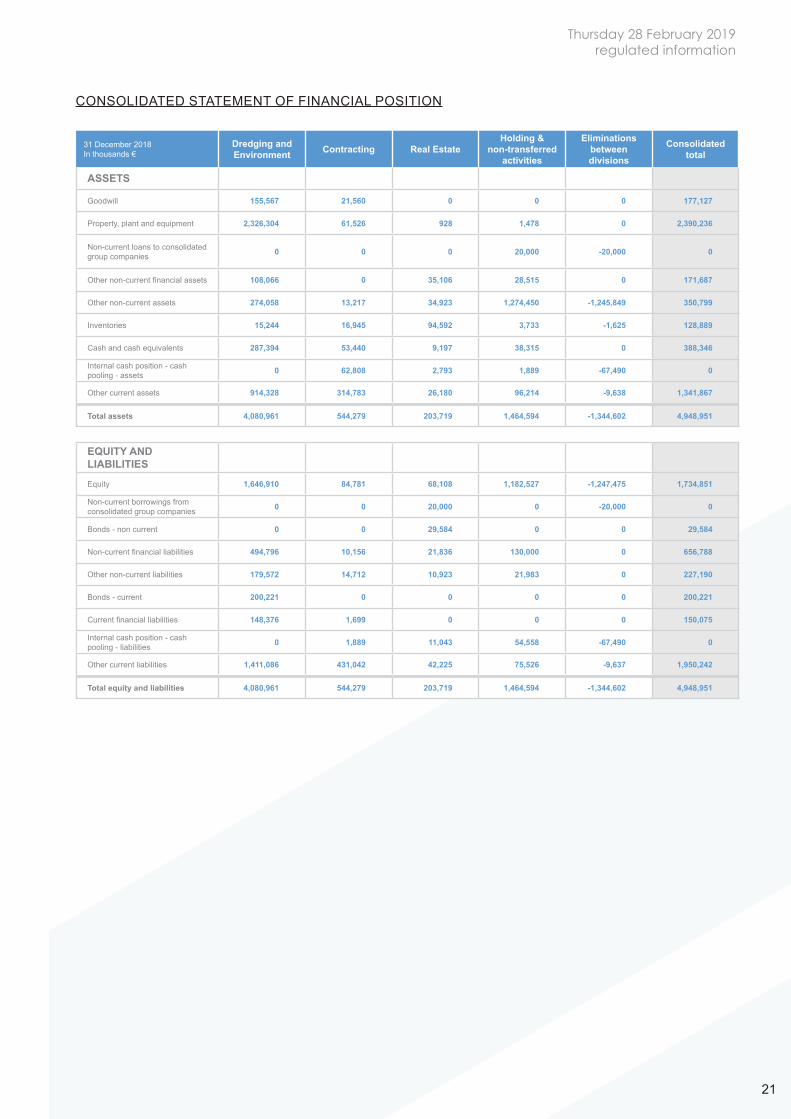
CONSOLIDATED STATEMENT OF FINANCIAL POSITION
31 December 2018In thousands €
Dredging andEnvironment Contracting Real Estate
Holding &non-transferred
activities
Eliminationsbetweendivisions
Consolidatedtotal
ASSETS
Goodwill 155,567 21,560 0 0 0 177,127
Property, plant and equipment 2,326,304 61,526 928 1,478 0 2,390,236
Non-current loans to consolidatedgroup companies 0 0 0 20,000 -20,000 0
Other non-current financial assets 108,066 0 35,106 28,515 0 171,687
Other non-current assets 274,058 13,217 34,923 1,274,450 -1,245,849 350,799
Inventories 15,244 16,945 94,592 3,733 -1,625 128,889
Cash and cash equivalents 287,394 53,440 9,197 38,315 0 388,346
Internal cash position - cashpooling - assets 0 62,808 2,793 1,889 -67,490 0
Other current assets 914,328 314,783 26,180 96,214 -9,638 1,341,867
Total assets 4,080,961 544,279 203,719 1,464,594 -1,344,602 4,948,951
EQUITY ANDLIABILITIESEquity 1,646,910 84,781 68,108 1,182,527 -1,247,475 1,734,851
Non-current borrowings fromconsolidated group companies 0 0 20,000 0 -20,000 0
Bonds - non current 0 0 29,584 0 0 29,584
Non-current financial liabilities 494,796 10,156 21,836 130,000 0 656,788
Other non-current liabilities 179,572 14,712 10,923 21,983 0 227,190
Bonds - current 200,221 0 0 0 0 200,221
Current financial liabilities 148,376 1,699 0 0 0 150,075
Internal cash position - cashpooling - liabilities 0 1,889 11,043 54,558 -67,490 0
Other current liabilities 1,411,086 431,042 42,225 75,526 -9,637 1,950,242
Total equity and liabilities 4,080,961 544,279 203,719 1,464,594 -1,344,602 4,948,951
Thursday 28 February 2019regulated information
22
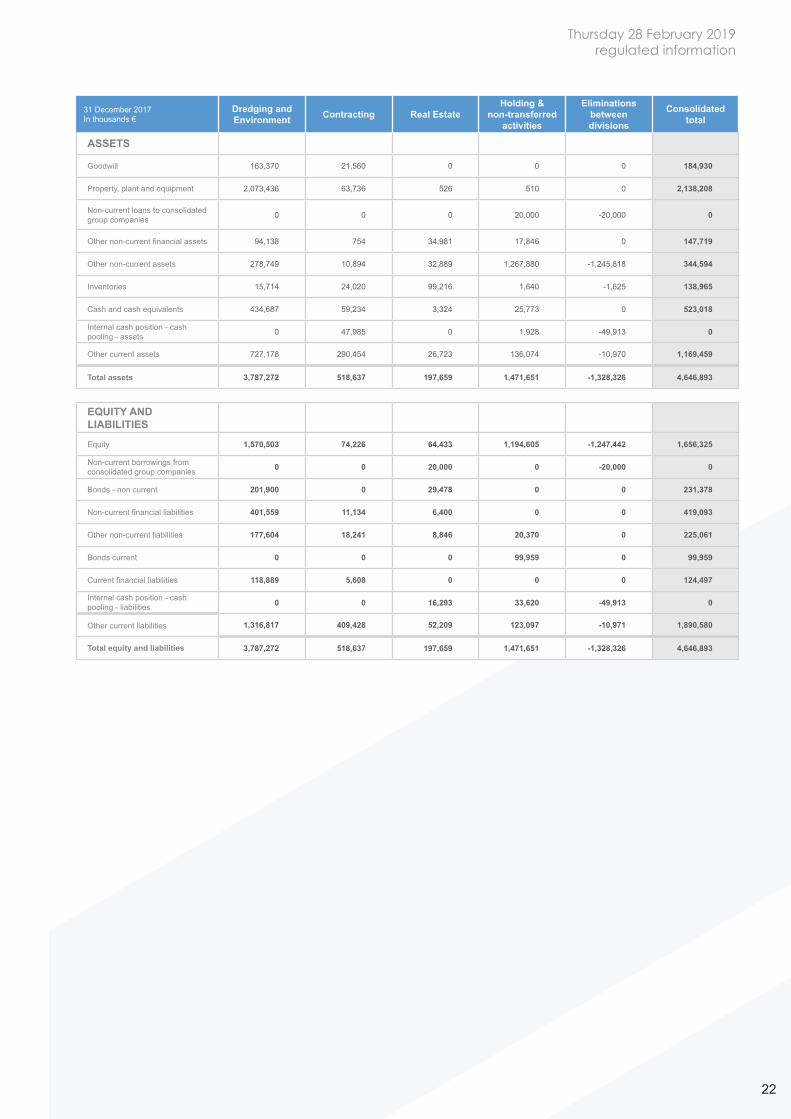
31 December 2017In thousands €
Dredging andEnvironment Contracting Real Estate
Holding &non-transferred
activities
Eliminationsbetweendivisions
Consolidatedtotal
ASSETS
Goodwill 163,370 21,560 0 0 0 184,930
Property, plant and equipment 2,073,436 63,736 526 510 0 2,138,208
Non-current loans to consolidatedgroup companies 0 0 0 20,000 -20,000 0
Other non-current financial assets 94,138 754 34,981 17,846 0 147,719
Other non-current assets 278,749 10,894 32,889 1,267,880 -1,245,818 344,594
Inventories 15,714 24,020 99,216 1,640 -1,625 138,965
Cash and cash equivalents 434,687 59,234 3,324 25,773 0 523,018
Internal cash position - cashpooling - assets 0 47,985 0 1,928 -49,913 0
Other current assets 727,178 290,454 26,723 136,074 -10,970 1,169,459
Total assets 3,787,272 518,637 197,659 1,471,651 -1,328,326 4,646,893
EQUITY ANDLIABILITIESEquity 1,570,503 74,226 64,433 1,194,605 -1,247,442 1,656,325
Non-current borrowings fromconsolidated group companies 0 0 20,000 0 -20,000 0
Bonds - non current 201,900 0 29,478 0 0 231,378
Non-current financial liabilities 401,559 11,134 6,400 0 0 419,093
Other non-current liabilities 177,604 18,241 8,846 20,370 0 225,061
Bonds current 0 0 0 99,959 0 99,959
Current financial liabilities 118,889 5,608 0 0 0 124,497
Internal cash position - cashpooling - liabilities 0 0 16,293 33,620 -49,913 0
Other current liabilities 1,316,817 409,428 52,209 123,097 -10,971 1,890,580
Total equity and liabilities 3,787,272 518,637 197,659 1,471,651 -1,328,326 4,646,893
Thursday 28 February 2019regulated information
23
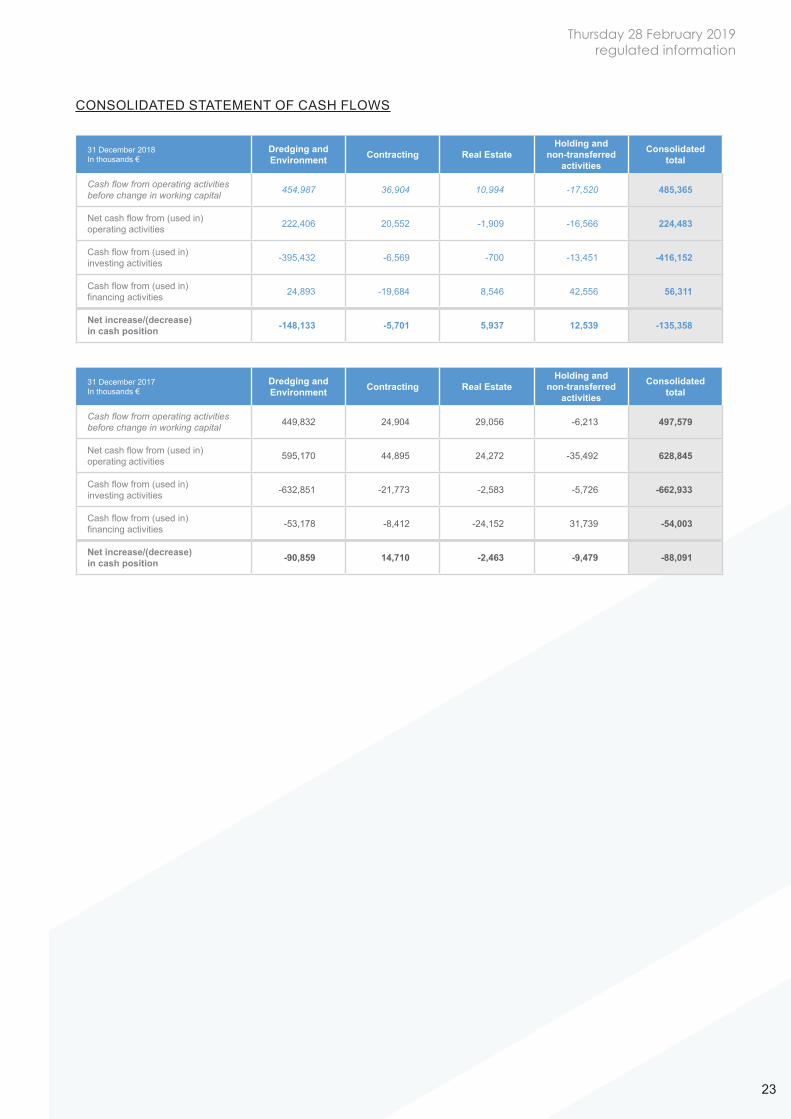
CONSOLIDATED STATEMENT OF CASH FLOWS
31 December 2018In thousands €
Dredging andEnvironment Contracting Real Estate
Holding andnon-transferred
activities
Consolidatedtotal
Cash flow from operating activitiesbefore change in working capital 454,987 36,904 10,994 -17,520 485,365
Net cash flow from (used in)operating activities 222,406 20,552 -1,909 -16,566 224,483
Cash flow from (used in)investing activities -395,432 -6,569 -700 -13,451 -416,152
Cash flow from (used in)financing activities 24,893 -19,684 8,546 42,556 56,311
Net increase/(decrease)in cash position -148,133 -5,701 5,937 12,539 -135,358
31 December 2017In thousands €
Dredging andEnvironment Contracting Real Estate
Holding andnon-transferred
activities
Consolidatedtotal
Cash flow from operating activitiesbefore change in working capital 449,832 24,904 29,056 -6,213 497,579
Net cash flow from (used in)operating activities 595,170 44,895 24,272 -35,492 628,845
Cash flow from (used in)investing activities -632,851 -21,773 -2,583 -5,726 -662,933
Cash flow from (used in)financing activities -53,178 -8,412 -24,152 31,739 -54,003
Net increase/(decrease)in cash position -90,859 14,710 -2,463 -9,479 -88,091
Thursday 28 February 2019regulated information
24
3.A.8 Change in the consolidation method of MEDCO
On 3 September 2018, DEME NV acquired additional beneficial rights of Middle East Dredging Company QSC “Medco”, increasing the group’s shareholding percentage from 44.1% to 95%. This led to a change in the consolidation method of Medco, which was consolidated according to the equity method until the begin-ning of the third quarter, after which it became fully consolidated.
This acquisition of control meets the definition of a business combination in accordance with the standard IFRS 3 - Business Combinations, which requires the application of the “acquisition method”, whereby the identifiable assets and liabilities of Medco must be included at fair value on the acquisition date in CFE’s consolidated financial statements. Moreover, according to this method, the historical stake of 44.1% must also be remeasured at fair value through profit and loss. Finally, the total goodwill generated on that trans-action results from the difference between the consideration transferred and the fair value of the assets and liabilities of Medco.
The fair value assessment of the identifiable assets and liabilities could be completed within the time limits set by the annual closing. This assessment, which was carried out according to the accounting methods of the CFE group, became final on 31 December 2018.
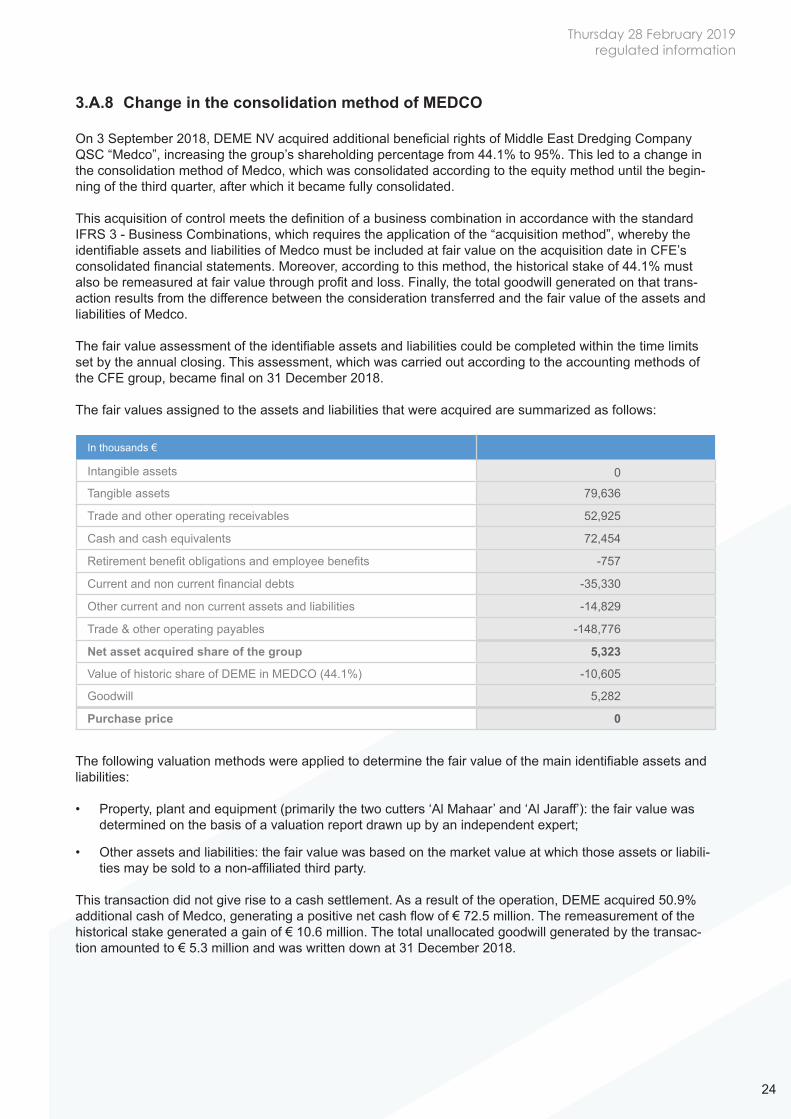
The fair values assigned to the assets and liabilities that were acquired are summarized as follows:
The following valuation methods were applied to determine the fair value of the main identifiable assets and liabilities:
• Property, plant and equipment (primarily the two cutters ‘Al Mahaar’ and ‘Al Jaraff’): the fair value was determined on the basis of a valuation report drawn up by an independent expert;
• Other assets and liabilities: the fair value was based on the market value at which those assets or liabili-ties may be sold to a non-affiliated third party.
This transaction did not give rise to a cash settlement. As a result of the operation, DEME acquired 50.9% additional cash of Medco, generating a positive net cash flow of € 72.5 million. The remeasurement of the historical stake generated a gain of € 10.6 million. The total unallocated goodwill generated by the transac-tion amounted to € 5.3 million and was written down at 31 December 2018.
In thousands €
Intangible assets 0
Tangible assets 79,636
Trade and other operating receivables 52,925
Cash and cash equivalents 72,454
Retirement benefit obligations and employee benefits -757
Current and non current financial debts -35,330
Other current and non current assets and liabilities -14,829
Trade & other operating payables -148,776
Net asset acquired share of the group 5,323
Value of historic share of DEME in MEDCO (44.1%) -10,605
Goodwill 5,282
Purchase price 0
Thursday 28 February 2019regulated information
25
3.A.9 Events after balance sheet date
No significant changes have occurred in the financial and commercial situation of the CFE Group since 31 December 2018.
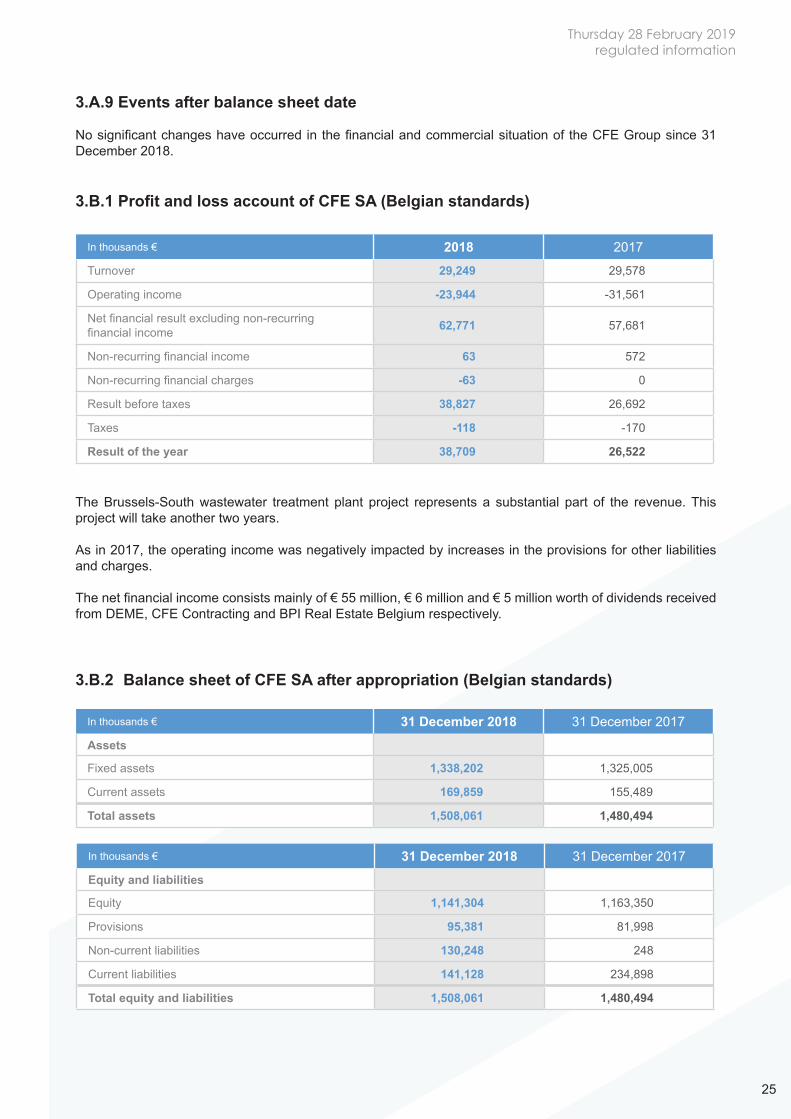
3.B.1 Profit and loss account of CFE SA (Belgian standards)
The Brussels-South wastewater treatment plant project represents a substantial part of the revenue. This project will take another two years.
As in 2017, the operating income was negatively impacted by increases in the provisions for other liabilities and charges.
The net financial income consists mainly of € 55 million, € 6 million and € 5 million worth of dividends received from DEME, CFE Contracting and BPI Real Estate Belgium respectively.
3.B.2 Balance sheet of CFE SA after appropriation (Belgian standards)
In thousands € 2018 2017
Turnover 29,249 29,578
Operating income -23,944 -31,561
Net financial result excluding non-recurringfinancial income 62,771 57,681
Non-recurring financial income 63 572
Non-recurring financial charges -63 0
Result before taxes 38,827 26,692
Taxes -118 -170
Result of the year 38,709 26,522
In thousands € 31 December 2018 31 December 2017
Assets
Fixed assets 1,338,202 1,325,005
Current assets 169,859 155,489
Total assets 1,508,061 1,480,494
In thousands € 31 December 2018 31 December 2017
Equity and liabilities
Equity 1,141,304 1,163,350
Provisions 95,381 81,998
Non-current liabilities 130,248 248
Current liabilities 141,128 234,898
Total equity and liabilities 1,508,061 1,480,494
Thursday 28 February 2019regulated information
26
The non-current assets consist primarily of the stakes in DEME, CFE Contracting and BPI Real Estate Belgium.
The long-term debts include € 130 million drawn down on the confirmed bilateral credit lines. In 2017, the € 100 million bond was reclassified to short-term debts.
4. Information on business trends
In 2019, DEME is expected to realise a revenue of approximately the same size as that of 2018. The impact of new vessels in the fleet for a full year is expected to be compensated by the scheduled major overhaul of the important installation vessel Innovation. In 2019, the EBITDA margin is again expected to remain within the historical range of 16% to 20% for the entire year.
The revenue of the Contracting division should also be stable in 2019, while its operating income should slightly increase.
The operating income 2019 of the Real Estate Development division should remain at a level close to that of 2018.
5. Dividend
At the general meeting of shareholders on 2 May 2019, the board of directors will propose a gross dividend of € 2.40 per share, or a total distribution of € 60.75 million.
6. Share information
At the end of the financial year, CFE’s share capital amounted to €41,329,482.42, divided into 25,314,482 shares, with no declared par value. The Company’s shares are registered or in electronic form.
CFE’s equity base as of 31 December 2018 was as follows :
Shares with no par value 25,314,482
registered shares 18,572,094
shares in electronic form 6,742,288
Shareholders owning 3% or more of the voting rights relating to the shares they hold:
Ackermans & van Haaren NVBegijnenvest, 113B-2000 Antwerp (Belgium) 15,289,521 shares or 60.40%
VINCI Construction SAS5, cours Ferdinand-de-LessepsF-92851 Rueil-Malmaison Cedex (France) 3,066,460 shares or 12.11%
Thursday 28 February 2019regulated information
27
7. Shareholders’ agenda
The statutory auditor, Deloitte, Reviseurs d’Entreprises, represented by Michel Denayer and Rik Neckebroeck, has confirmed that it has no reservations as to the accounting information reported in this press release and that it is in line with the financial statements as approved by the board of directors. Nevertheless, without qualifying its opinion, the auditor draws attention to the uncertainties as to the payment of the outstanding debts due by the Chadian government and the actions undertaken to facilitate their settlement.
* **
About CFE
CFE, founded in 1880 is a Belgian industrial group active in three different divisions. The first, Dredging, Environment, Offshore and Infra, is carried out by its wholly owned subsidiary DEME, one of the world leaders in the field. DEME has a modern fleet of multipurpose vessels equipped with the latest technologies. The second, Contracting, encompasses the group’s construction, multitechnics and rail activities in Belgium, Luxembourg and Poland. The third, Real Estate Development, covers the real estate projects developed by BPI in Belgium, Luxembourg and Poland.
Sustainability and innovation are important themes for which the CFE group is willing to accept responsibility, among other things by the use of digital technology in the areas of productivity, safety, employee well-being and customer satisfaction. The CFE group currently employs more than 8,000 people and is active on every continent. CFE is listed on Euronext Brussels and is 60.40% owned by Ackermans & van Haaren.
This press release is available on our website at www.cfe.be.
* **
Note to editors
For further information, please contact, at CFE:
- Piet Dejonghe, Chief Executive Officer, tel. +32.2.661.13.19, [email protected] Fabien De Jonge, Chief Financial Officer, tel. +32 2 661 13 12, [email protected]
Ordinary shareholders meeting 2 May 2019
Publication of interim statements 2018 23 May 2019 (before opening of the stock market)
Publication of half-year financial statements 2018 30 August 2019 (before opening of the stock market)
Publication of interim statements 2018 22 November 2019 (before opening of the stock market)


![SUMMARY OF FINANCIAL STATEMENTS [IFRS] (CONSOLIDATED) Financial Results … · SUMMARY OF FINANCIAL STATEMENTS [IFRS] (CONSOLIDATED) Financial Results for the Fiscal Year Ended March](https://img.pdfslide.net/doc/110x75/5e92676282566416065a9900/summary-of-financial-statements-ifrs-consolidated-financial-results-summary.jpg)