Embed Size (px)
Citation preview
Results of Operationsfor the Third Quarter of FY2017
8 November, 2017
(Delayed)
8 November, 2017CYBERNET SYSTEMS CO., LTD.
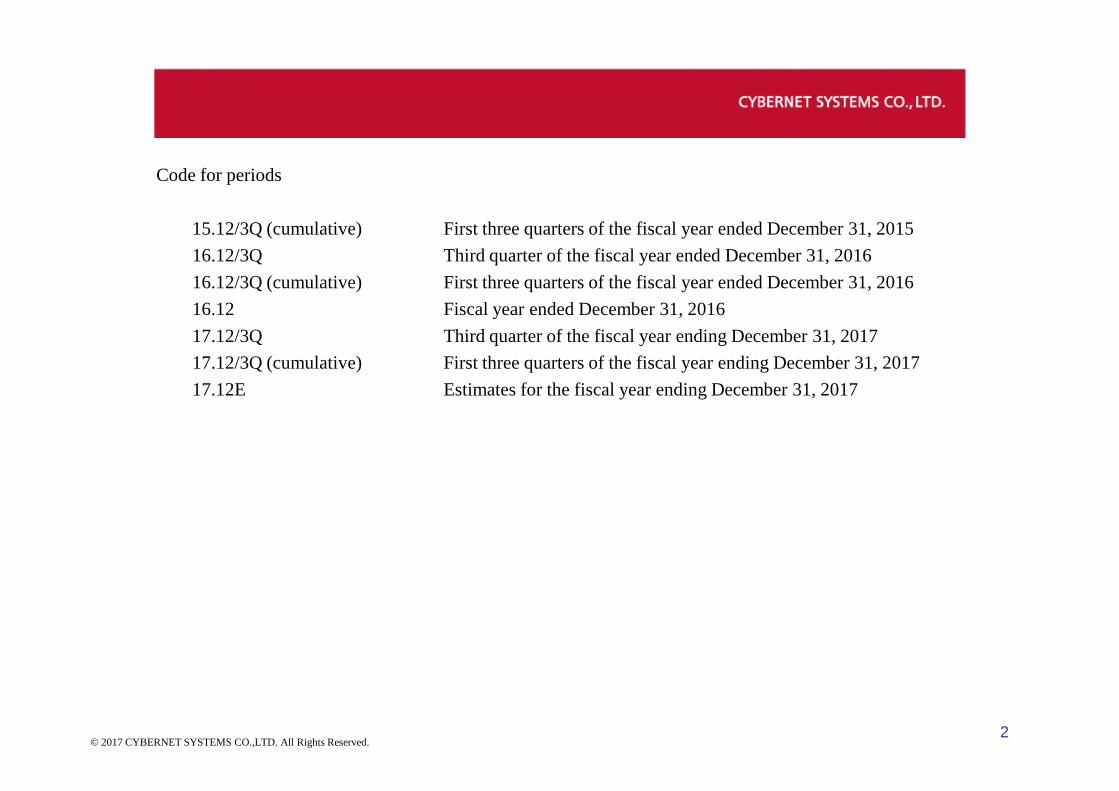
Code for periods
15.12/3Q (cumulative) First three quarters of the fiscal year ended December 31, 2015
16.12/3Q Third quarter of the fiscal year ended December 31, 2016
16.12/3Q (cumulative) First three quarters of the fiscal year ended December 31, 2016
16.12 Fiscal year ended December 31, 2016
17.12/3Q Third quarter of the fiscal year ending December 31, 2017
17.12/3Q (cumulative) First three quarters of the fiscal year ending December 31, 2017
17.12E Estimates for the fiscal year ending December 31, 201717.12E Estimates for the fiscal year ending December 31, 2017
© 2017 CYBERNET SYSTEMS CO.,LTD. All Rights Reserved.2
Contents
◆Business Summary of Financial Results for the First Three Quarters of the Fiscal Year Ending December 31, 2017[Consolidated] Business Summary ・・・・・・・・・・・・・・・・・・・・・・・・・・・・・・・・・・・・・・・・・・・・・・・・・・・・・・・・・・・・・・・・・・・・・・・・・・・・・・・・・・・5
[Consolidated] Changes in Operating Income (YoY comparison) ・・・・・・・・・・・・・・・・・・・・・・・・・・・・・・・・・・・・・・・・・・・・・・・・・・・・・・・・・・・・・6
[Consolidated] Changes in Operating Income (Against Plan) ・・・・・・・・・・・・・・・・・・・・・・・・・・・・・・・・・・・・・・・・・・・・・・・・・・・・・・・・・・・・・・・・・7
[Consolidated] Balance Sheet・・・・・・・・・・・・・・・・・・・・・・・・・・・・・・・・・・・・・・・・・・・・・・・・・・・・・・・・・・・・・・・・・・・・・・・・・・・・・・・・・・・・・・・8
[Consolidated] Cash Flow Statement・・・・・・・・・・・・・・・・・・・・・・・・・・・・・・・・・・・・・・・・・・・・・・・・・・・・・・・・・・・・・・・・・・・・・・・・・・・・・・・・・・9
[Consolidated] Quarterly Net Sales・・・・・・・・・・・・・・・・・・・・・・・・・・・・・・・・・・・・・・・・・・・・・・・・・・・・・・・・・・・・・・・・・・・・・・・・・・・・・・・・・・・・10
[Consolidated] Overview of Results by Segment ・・・・・・・・・・・・・・・・・・・・・・・・・・・・・・・・・・・・・・・・・・・・・・・・・・・・・・・・・・・・・・・・・・・・・11
[Consolidated]Composition ratio of Net Sales・・・・・・・・・・・・・・・・・・・・・・・・・・・・・・・・・・・・・・・・・・・・・・・・・・・・・・・・・・・・・・・・・・12
[Consolidated] Changes in Net Sales by Business (YoY comparison) ・・・・・・・・・・・・・・・・・・・・・・・・・・・・・・・・・・・・・・・・・・・・・・・・・・・・・・・・・13
[Consolidated] Changes in Operating Income by Business (YoY comparison) ・・・・・・・・・・・・・・・・・・・・・・・・・・・・・・・・・・・・・・・・・・・・・・14
© 2017 CYBERNET SYSTEMS CO.,LTD. All Rights Reserved.3
[Consolidated] Changes in Operating Income by Business (YoY comparison) ・・・・・・・・・・・・・・・・・・・・・・・・・・・・・・・・・・・・・・・・・・・・・・14
[Non-consolidated] Net Sales by Application Area・・・・・・・・・・・・・・・・・・・・・・・・・・・・・・・・・・・・・・・・・・・・・・・・・・・・・・・・・・・・・・・・・・・・・・・・・・・・・15
[Non-consolidated] Net Sales by Category of Industry・・・・・・・・・・・・・・・・・・・・・・・・・・・・・・・・・・・・・・・・・・・・・・・・・・・・・・・・・・・・・・・・・・・・・17
[Non-consolidated] Net Sales by Contract・・・・・・・・・・・・・・・・・・・・・・・・・・・・・・・・・・・・・・・・・・・・・・・・・・・・・・・・・・・・・・・・・・・・・・・・・・・・・・・・・・・・・19
[Consolidated] Performance at Overseas Subsidiaries・・・・・・・・・・・・・・・・・・・・・・・・・・・・・・・・・・・・・・・・・・・・・・・・・・・・・・・・・・・・・・・・・・・・・・・・・・20
◆Projection for FY2017[Consolidated] Projection for Current Fiscal Year・・・・・・・・・・・・・・・・・・・・・・・・・・・・・・・・・・・・・・・・・・・・・・・・・・・・・・・・・・・・・・・・・・・・・・・・・・・・・・・・・23
[Consolidated] Dividend Estimate for Current Fiscal Year・・・・・・・・・・・・・・・・・・・・・・・・・・・・・・・・・・・・・・・・・・・・・・・・・・・・・・・・・・・・・・・・・・・・・・・24
◆Reference MaterialsIncluding Non-consolidated Performance and etc
Business Summary of Financial Resultsfor the First Three Quarters of the Fiscal
Year Ending December 31, 2017Year Ending December 31, 2017
4© 2017 CYBERNET SYSTEMS CO.,LTD. All Rights Reserved.
[Consolidated] Business Summary
Million yen
17.12/3Q
(cumulative)
16.12/3Q
(cumulative)
17.12/3Q
(cumulative)
Results Results Plan
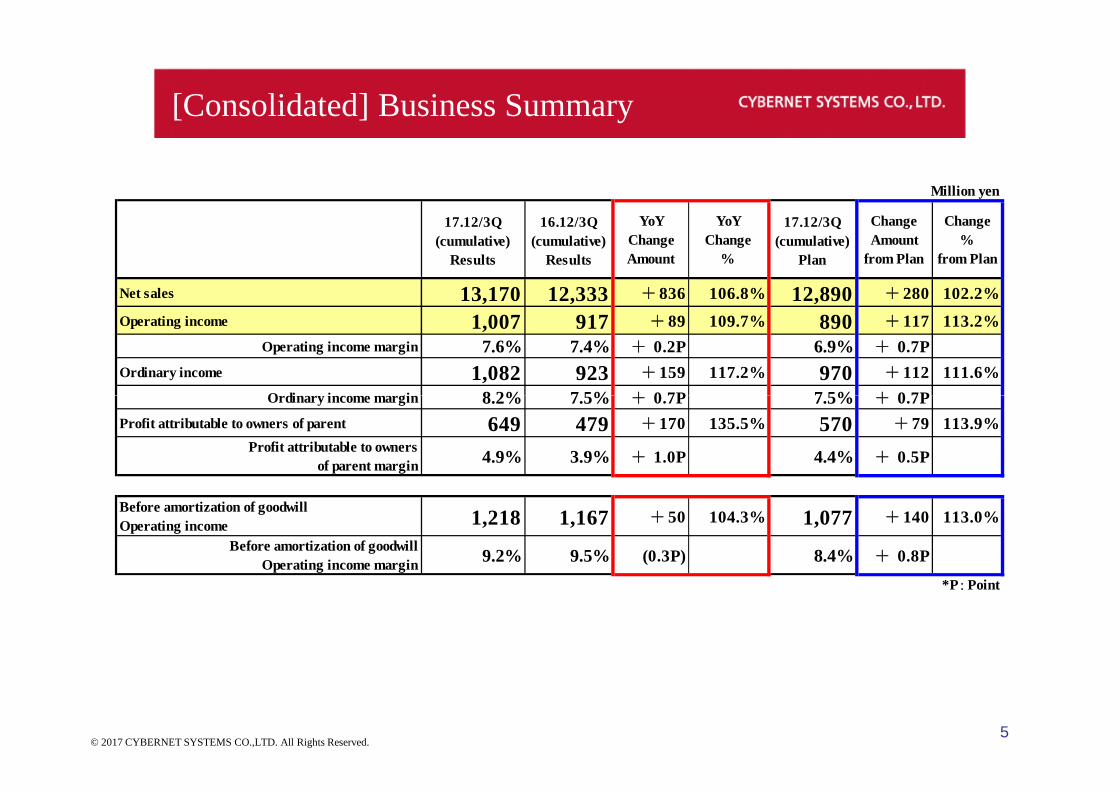
Net sales 13,170 12,333 +836 106.8% 12,890 +280 102.2%
Operating income 1,007 917 +89 109.7% 890 +117 113.2%
Operating income margin 7.6% 7.4% + 0.2P 6.9% + 0.7P
Ordinary income 1,082 923 +159 117.2% 970 +112 111.6%
Ordinary income margin 8.2% 7.5% + 0.7P 7.5% + 0.7P
YoY
Change
Amount
YoY
Change
%
Change
Amount
from Plan
Change
%
from Plan
5© 2017 CYBERNET SYSTEMS CO.,LTD. All Rights Reserved.
Ordinary income margin 8.2% 7.5% + 0.7P 7.5% + 0.7P
Profit attributable to owners of parent 649 479 +170 135.5% 570 +79 113.9%
Profit attributable to owners
of parent margin4.9% 3.9% + 1.0P 4.4% + 0.5P
Before amortization of goodwill
Operating income 1,218 1,167 +50 104.3% 1,077 +140 113.0%
Before amortization of goodwill
Operating income margin9.2% 9.5% (0.3P) 8.4% + 0.8P
*P:Point
1,007
917
++333333
(253)(253)
++99
[Consolidated] Changes in Operating Income
Operating incomemargin 7.6%
Increasein
costof
salesfor
service
Decrease
ofselling,
generaland
administrative
expenses
Operating incomemargin 7.4%
Product
profitsIncrease
Million yen [ YoY comparison]
917
6
incost
of
Decrease
ofselling,
generaland
administrative
6© 2017 CYBERNET SYSTEMS CO.,LTD. All Rights Reserved.
16.12/3Q(cumulative)
Results
17.12/3Q(cumulative)
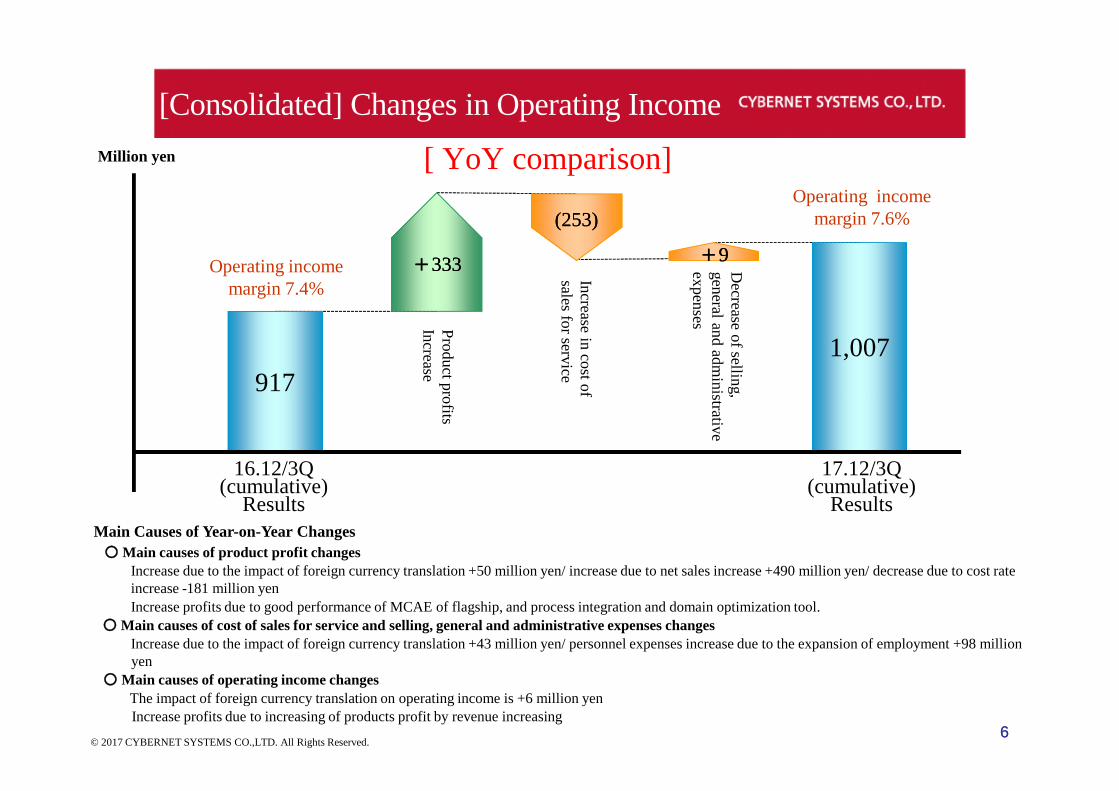
ResultsMain Causes of Year-on-Year Changes
○ Main causes of product profit changes
Increase due to the impact of foreign currency translation +50 million yen/ increase due to net sales increase +490 million yen/ decrease due to cost rateincrease -181 million yen
Increase profits due to good performance of MCAE of flagship, and process integration and domain optimization tool.
○ Main causes of cost of sales for service and selling, general and administrative expenses changes
Increase due to the impact of foreign currency translation +43 million yen/ personnel expenses increase due to the expansion of employment +98 millionyen
○ Main causes of operating income changes
The impact of foreign currency translation on operating income is +6 million yenIncrease profits due to increasing of products profit by revenue increasing
Product
profits
[Consolidated] Changes in Operating Income
Million yenOperating income
margin7.6%
Operating incomemargin6.9%
Increasein
costof
salesfor
service
Decrease
ofselling,
General
andA
dministrative
expense
[Against Plan]
1,007+137
+55 (75)(75)
Product
profitsincrease
7
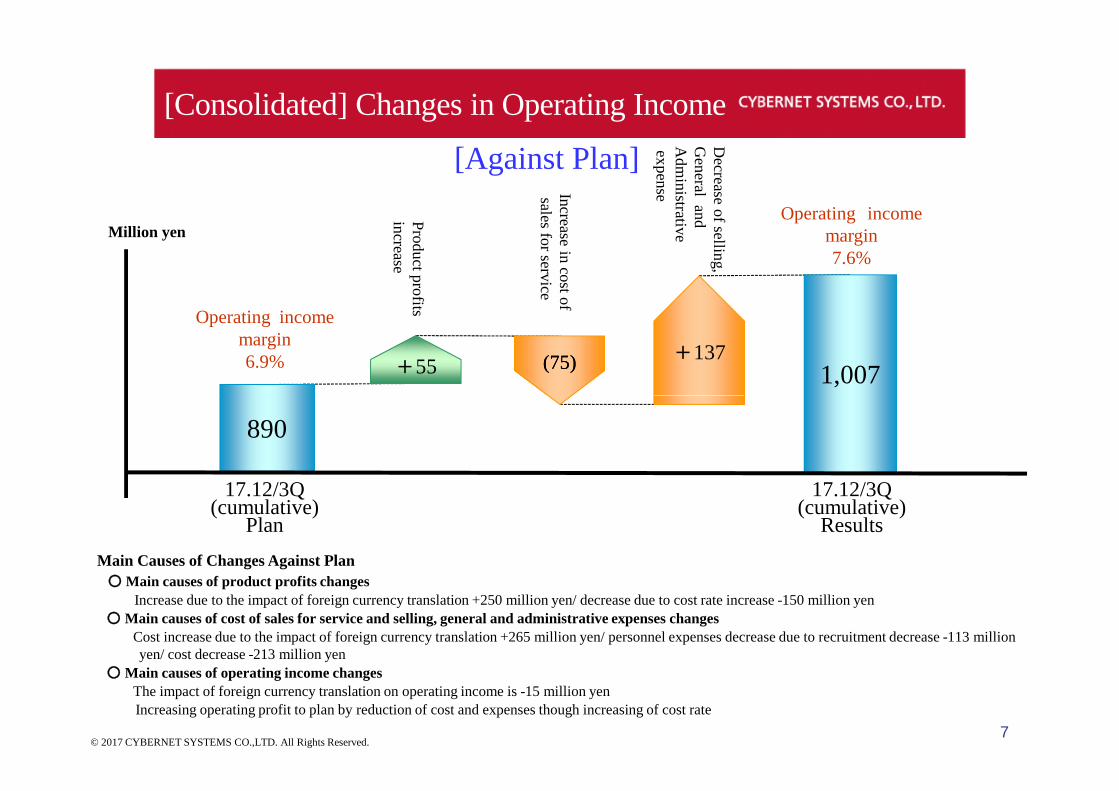
Main Causes of Changes Against Plan
○ Main causes of product profits changes
Increase due to the impact of foreign currency translation +250 million yen/ decrease due to cost rate increase -150 million yen
○ Main causes of cost of sales for service and selling, general and administrative expenses changes
Cost increase due to the impact of foreign currency translation +265 million yen/ personnel expenses decrease due to recruitment decrease -113 millionyen/ cost decrease -213 million yen
○ Main causes of operating income changes
The impact of foreign currency translation on operating income is -15 million yen
Increasing operating profit to plan by reduction of cost and expenses though increasing of cost rate
© 2017 CYBERNET SYSTEMS CO.,LTD. All Rights Reserved.
17.12/3Q(cumulative)
Plan
17.12/3Q(cumulative)
Results
890
Million yen
16.12 17.12/3QYoY
Change
Amount
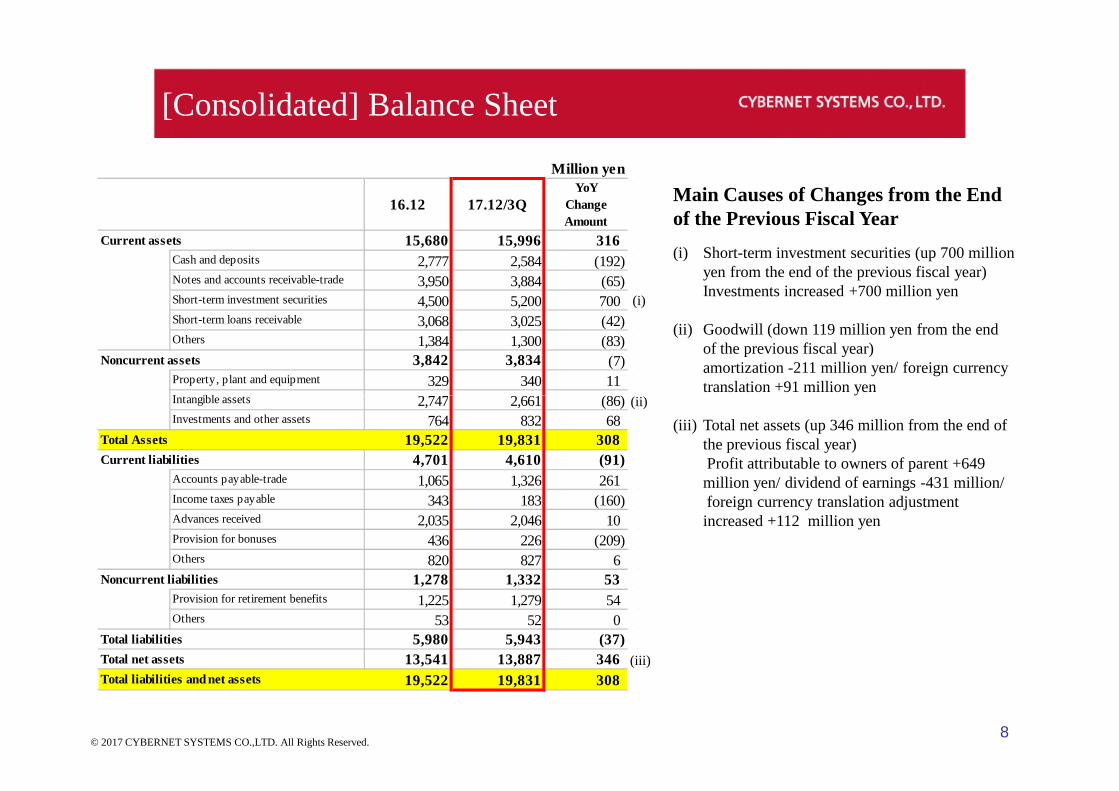
15,680 15,996 316Cash and deposits 2,777 2,584 (192)Notes and accounts receivable-trade 3,950 3,884 (65)Short-term investment securities 4,500 5,200 700Short-term loans receivable 3,068 3,025 (42)Others 1,384 1,300 (83)
3,842 3,834 (7)Property, plant and equipment 329 340 11Intangible assets 2,747 2,661 (86)
Current assets
Noncurrent assets
[Consolidated] Balance Sheet
(i)
(ii)
Main Causes of Changes from the Endof the Previous Fiscal Year
(i) Short-term investment securities (up 700 millionyen from the end of the previous fiscal year)Investments increased +700 million yen
(ii) Goodwill (down 119 million yen from the endof the previous fiscal year)amortization -211 million yen/ foreign currencytranslation +91 million yen
Intangible assets 2,747 2,661 (86)Investments and other assets 764 832 68
19,522 19,831 308
4,701 4,610 (91)Accounts payable-trade 1,065 1,326 261Income taxes payable 343 183 (160)Advances received 2,035 2,046 10Provision for bonuses 436 226 (209)Others 820 827 6
1,278 1,332 53Provision for retirement benefits 1,225 1,279 54Others 53 52 0
5,980 5,943 (37)
13,541 13,887 346
19,522 19,831 308Total liabilities and net assets
Current liabilities
Noncurrent liabilities
Total liabilities
Total net assets
Total Assets
(ii)
8
translation +91 million yen
(iii) Total net assets (up 346 million from the end ofthe previous fiscal year)Profit attributable to owners of parent +649million yen/ dividend of earnings -431 million/foreign currency translation adjustmentincreased +112 million yen
© 2017 CYBERNET SYSTEMS CO.,LTD. All Rights Reserved.
(iii)
544
1,3451,428
472
1,215
500
700
900
1,100
1,300
1,500
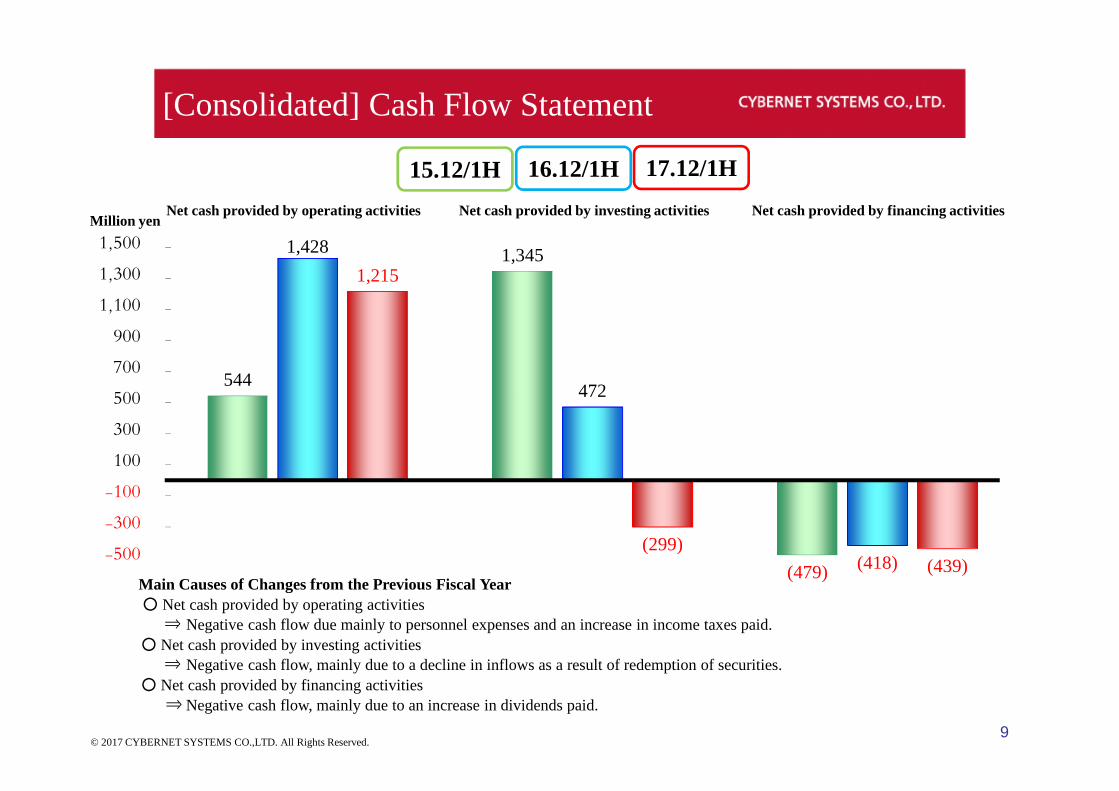
[Consolidated] Cash Flow Statement
16.12/1H15.12/1H 17.12/1H
Net cash provided by operating activities Net cash provided by investing activities Net cash provided by financing activitiesMillion yen
(479)
472
(418)(299)
(439)-500
-300
-100
100
300
500
9
Main Causes of Changes from the Previous Fiscal Year
○ Net cash provided by operating activities⇒ Negative cash flow due mainly to personnel expenses and an increase in income taxes paid.
○ Net cash provided by investing activities⇒ Negative cash flow, mainly due to a decline in inflows as a result of redemption of securities.
○ Net cash provided by financing activities
⇒ Negative cash flow, mainly due to an increase in dividends paid.
© 2017 CYBERNET SYSTEMS CO.,LTD. All Rights Reserved.
3,601
4,776
3,413
3,726
4,036
4,922
3,374
3,698
3,976
5,445
3,7484,000
5,000
6,000
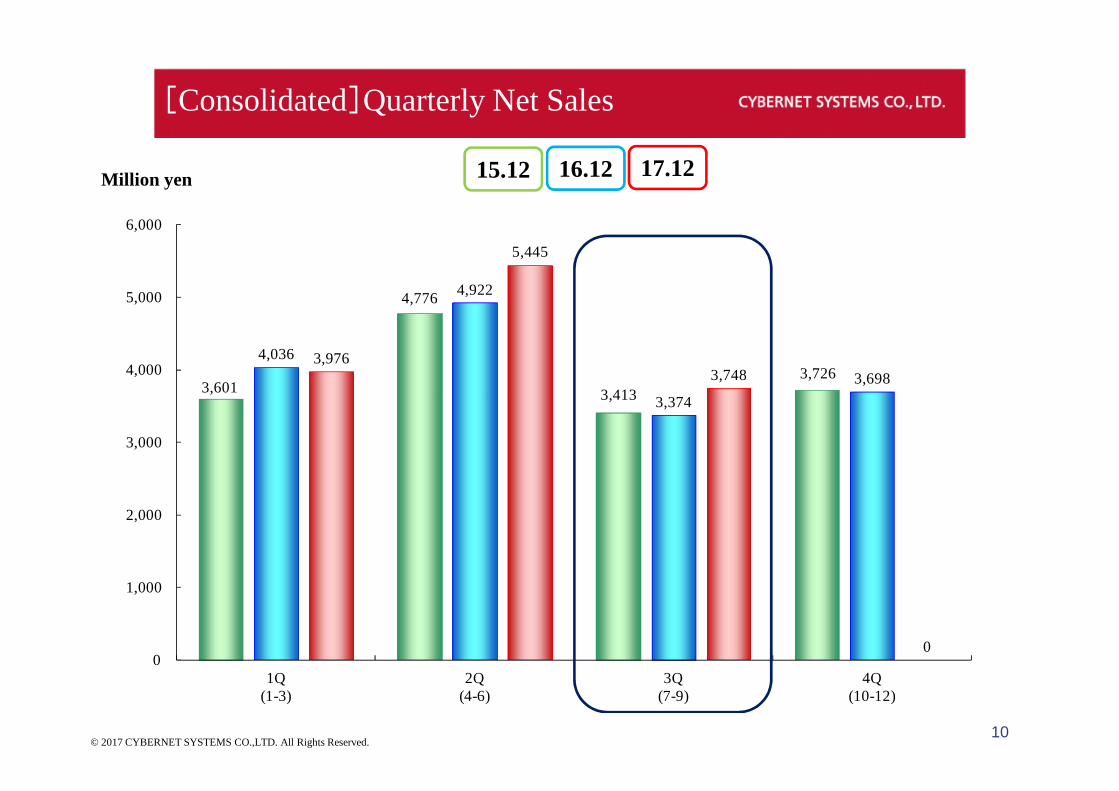
16.1215.12Million yen
[Consolidated]Quarterly Net Sales
17.12
3,601 3,413 3,374
00
1,000
2,000
3,000
1Q(1-3)
2Q(4-6)
3Q(7-9)
4Q(10-12)
10© 2017 CYBERNET SYSTEMS CO.,LTD. All Rights Reserved.
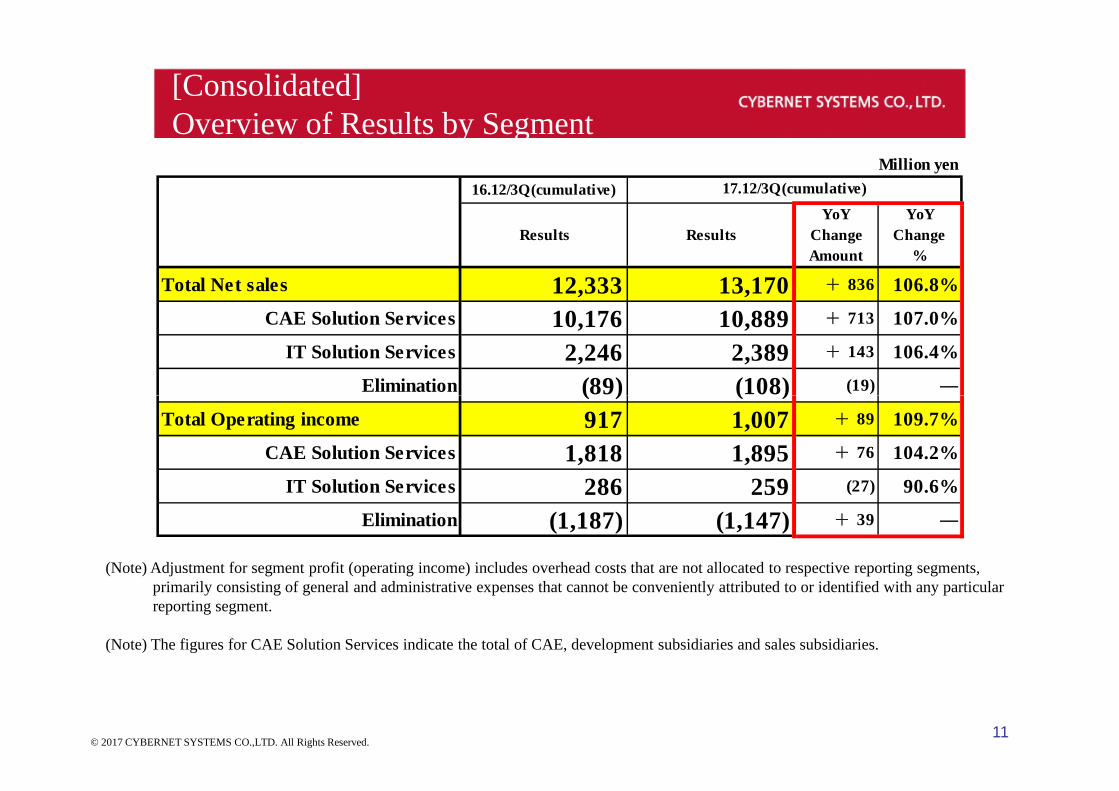
[Consolidated]Overview of Results by Segment
Million yen
16.12/3Q(cumulative)
Results Results
YoY
Change
Amount
YoY
Change
%
Total Net sales 12,333 13,170 + 836 106.8%
CAE Solution Services 10,176 10,889 + 713 107.0%
IT Solution Services 2,246 2,389 + 143 106.4%
Elimination (89) (108) (19) ―
17.12/3Q(cumulative)
11
(Note) Adjustment for segment profit (operating income) includes overhead costs that are not allocated to respective reporting segments,primarily consisting of general and administrative expenses that cannot be conveniently attributed to or identified with any particularreporting segment.
(Note) The figures for CAE Solution Services indicate the total of CAE, development subsidiaries and sales subsidiaries.
© 2017 CYBERNET SYSTEMS CO.,LTD. All Rights Reserved.
Elimination (89) (108) ―
Total Operating income 917 1,007 + 89 109.7%
CAE Solution Services 1,818 1,895 + 76 104.2%
IT Solution Services 286 259 (27) 90.6%
Elimination (1,187) (1,147) + 39 ―
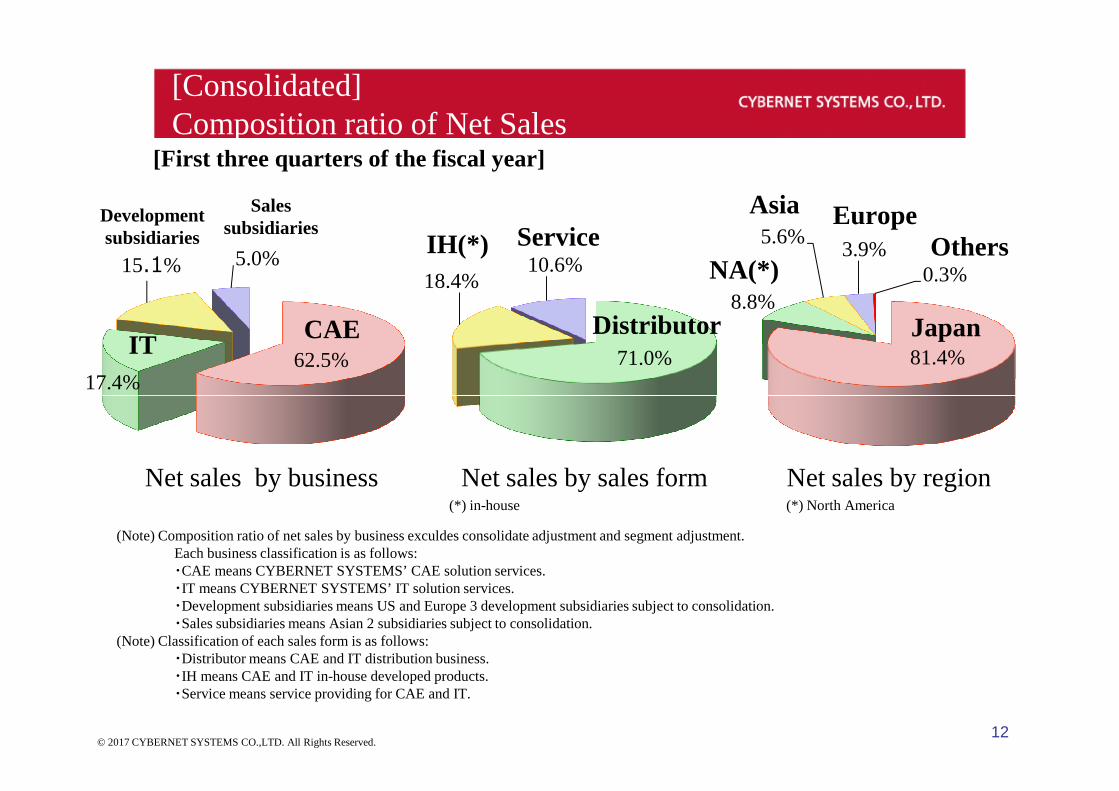
[Consolidated]Composition ratio of Net Sales
[First three quarters of the fiscal year]
71.0%
18.4%10.6%
IH(*) Service
Distributor81.4%
8.8%
5.6%3.9%
0.3%NA(*)
Asia EuropeOthers
Japan62.5%
17.4%
15.1% 5.0%
IT
Developmentsubsidiaries
Salessubsidiaries
CAE
12© 2017 CYBERNET SYSTEMS CO.,LTD. All Rights Reserved.
(Note) Composition ratio of net sales by business exculdes consolidate adjustment and segment adjustment.Each business classification is as follows:・CAE means CYBERNET SYSTEMS’ CAE solution services.・IT means CYBERNET SYSTEMS’ IT solution services.・Development subsidiaries means US and Europe 3 development subsidiaries subject to consolidation.・Sales subsidiaries means Asian 2 subsidiaries subject to consolidation.
(Note) Classification of each sales form is as follows:・Distributor means CAE and IT distribution business.・IH means CAE and IT in-house developed products.・Service means service providing for CAE and IT.
Net sales by business Net sales by sales form Net sales by region(*) in-house (*) North America
Million yen
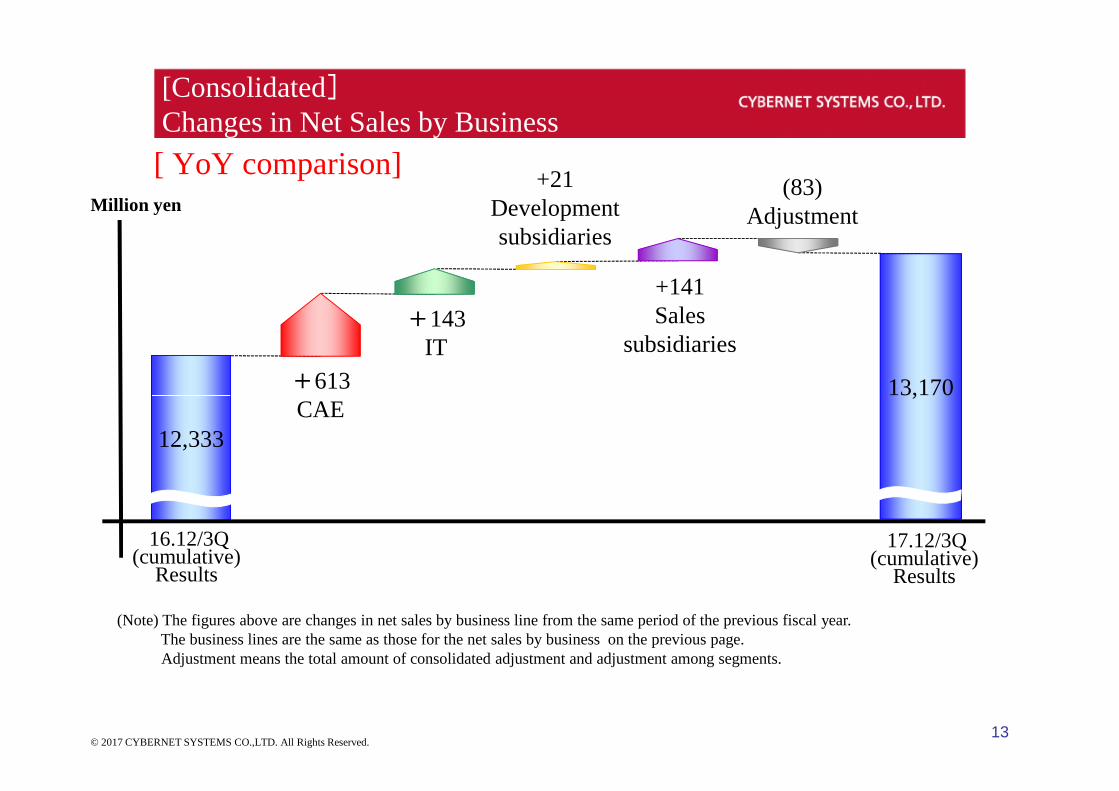
[Consolidated]Changes in Net Sales by Business
+613
+143IT
+21Developmentsubsidiaries
+141Sales
subsidiaries
(83)Adjustment
[ YoY comparison]
13,170
13
CAE
(Note) The figures above are changes in net sales by business line from the same period of the previous fiscal year.The business lines are the same as those for the net sales by business on the previous page.Adjustment means the total amount of consolidated adjustment and adjustment among segments.
© 2017 CYBERNET SYSTEMS CO.,LTD. All Rights Reserved.
12,333
13,170
16.12/3Q(cumulative)
Results
17.12/3Q(cumulative)
Results
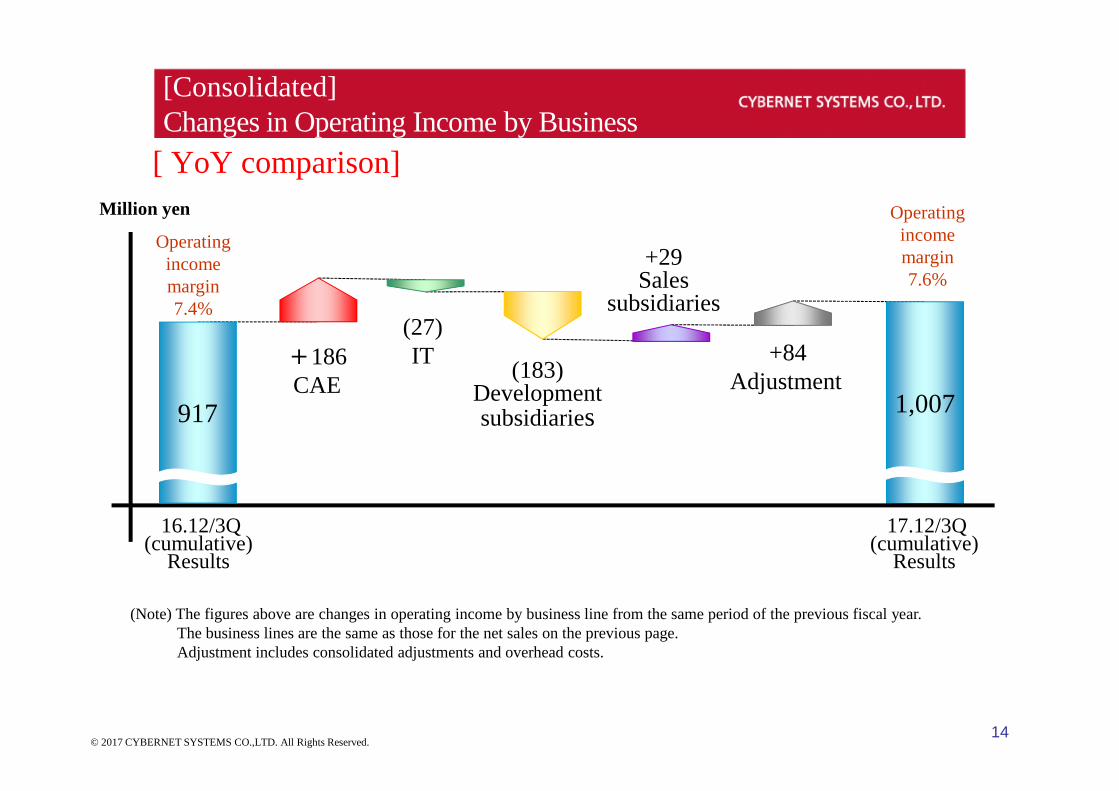
+84Adjustment(183)
Development
+29Sales
subsidiaries
Million yen
[Consolidated]Changes in Operating Income by Business
Operatingincomemargin7.6%
+186CAE
(27)IT
Operatingincomemargin7.4%
[ YoY comparison]
1,007Developmentsubsidiaries
14
CAE
(Note) The figures above are changes in operating income by business line from the same period of the previous fiscal year.The business lines are the same as those for the net sales on the previous page.Adjustment includes consolidated adjustments and overhead costs.
© 2017 CYBERNET SYSTEMS CO.,LTD. All Rights Reserved.
917 1,007
16.12/3Q(cumulative)
Results
17.12/3Q(cumulative)
Results
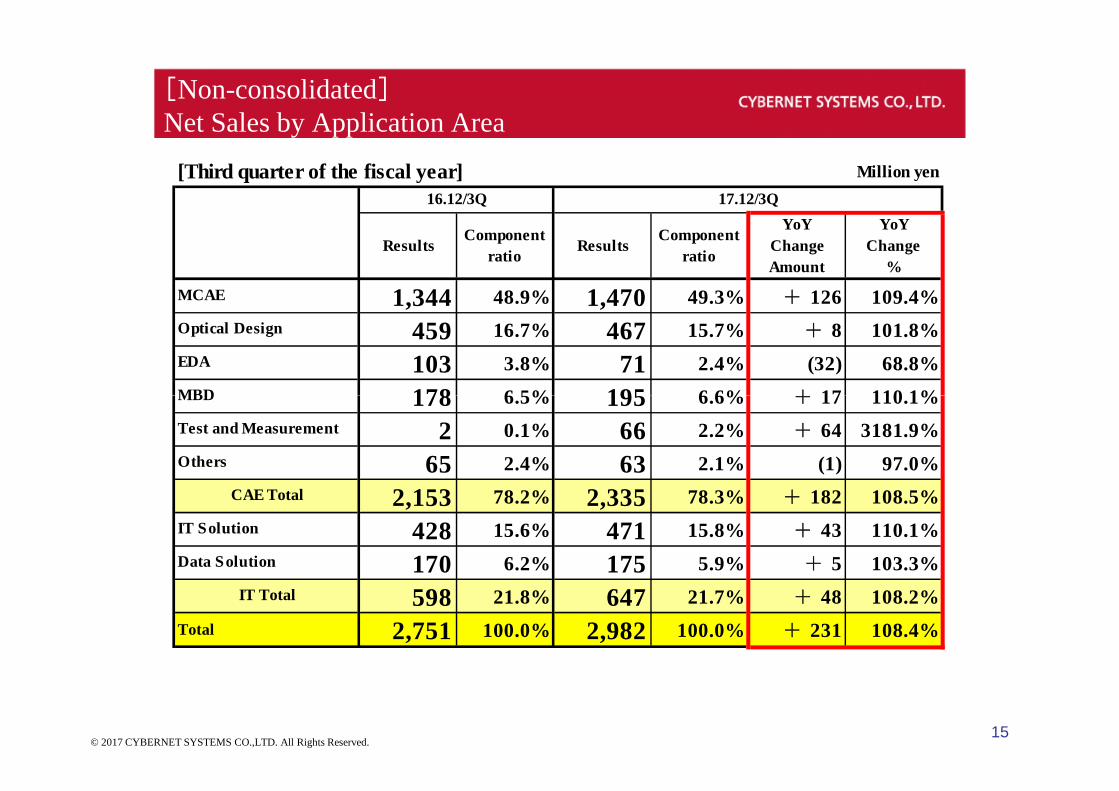
[Non-consolidated]Net Sales by Application Area
[Third quarter of the fiscal year] Million yen
ResultsComponent
ratioResults
Component
ratio
YoY
Change
Amount
YoY
Change
%
MCAE 1,344 48.9% 1,470 49.3% + 126 109.4%
Optical Design 459 16.7% 467 15.7% + 8 101.8%
EDA 103 3.8% 71 2.4% (32) 68.8%
MBD 178 6.5% 195 6.6% + 17 110.1%
16.12/3Q 17.12/3Q
15© 2017 CYBERNET SYSTEMS CO.,LTD. All Rights Reserved.
MBD 178 6.5% 195 6.6% + 17 110.1%
Test and Measurement 2 0.1% 66 2.2% + 64 3181.9%
Others 65 2.4% 63 2.1% (1) 97.0%
CAE Total 2,153 78.2% 2,335 78.3% + 182 108.5%
IT Solution 428 15.6% 471 15.8% + 43 110.1%
Data Solution 170 6.2% 175 5.9% + 5 103.3%
IT Total 598 21.8% 647 21.7% + 48 108.2%
Total 2,751 100.0% 2,982 100.0% + 231 108.4%
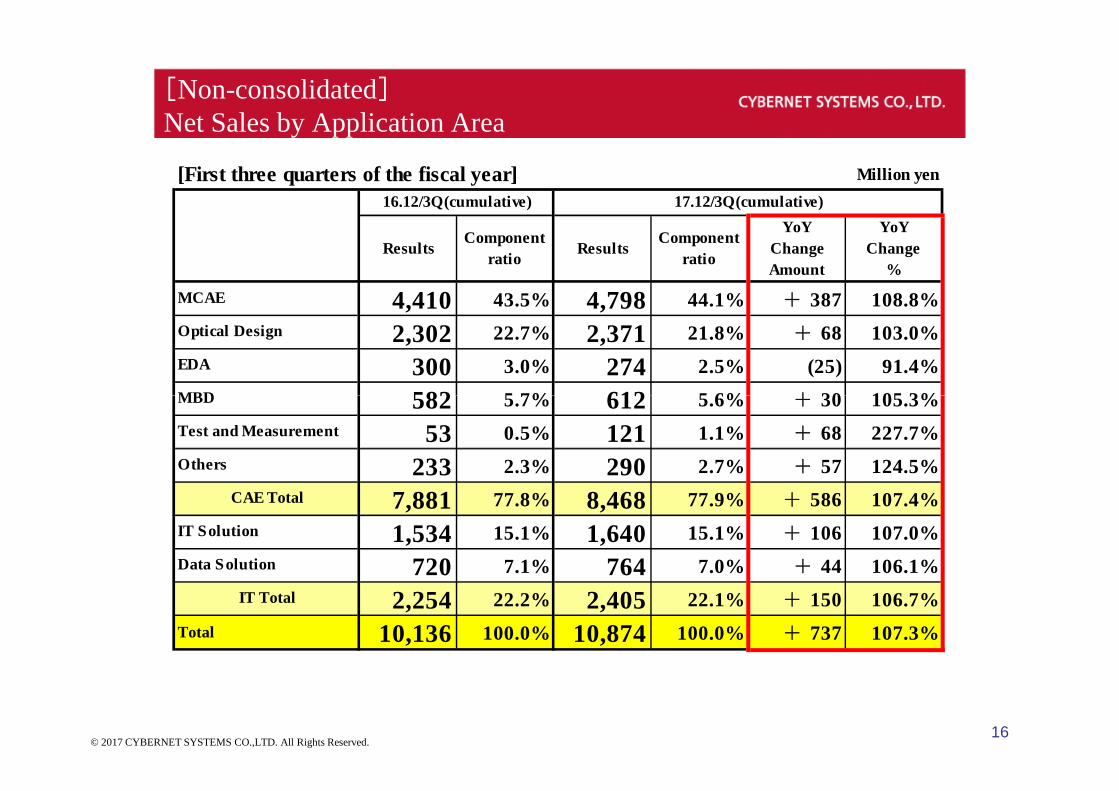
[Non-consolidated]Net Sales by Application Area
[First three quarters of the fiscal year] Million yen
ResultsComponent
ratioResults
Component
ratio
YoY
Change
Amount
YoY
Change
%
MCAE 4,410 43.5% 4,798 44.1% + 387 108.8%
Optical Design 2,302 22.7% 2,371 21.8% + 68 103.0%
EDA 300 3.0% 274 2.5% (25) 91.4%
MBD 582 5.7% 612 5.6% + 30 105.3%
16.12/3Q(cumulative) 17.12/3Q(cumulative)
16© 2017 CYBERNET SYSTEMS CO.,LTD. All Rights Reserved.
MBD 582 5.7% 612 5.6% + 30 105.3%
Test and Measurement 53 0.5% 121 1.1% + 68 227.7%
Others 233 2.3% 290 2.7% + 57 124.5%
CAE Total 7,881 77.8% 8,468 77.9% + 586 107.4%
IT Solution 1,534 15.1% 1,640 15.1% + 106 107.0%
Data Solution 720 7.1% 764 7.0% + 44 106.1%
IT Total 2,254 22.2% 2,405 22.1% + 150 106.7%
Total 10,136 100.0% 10,874 100.0% + 737 107.3%
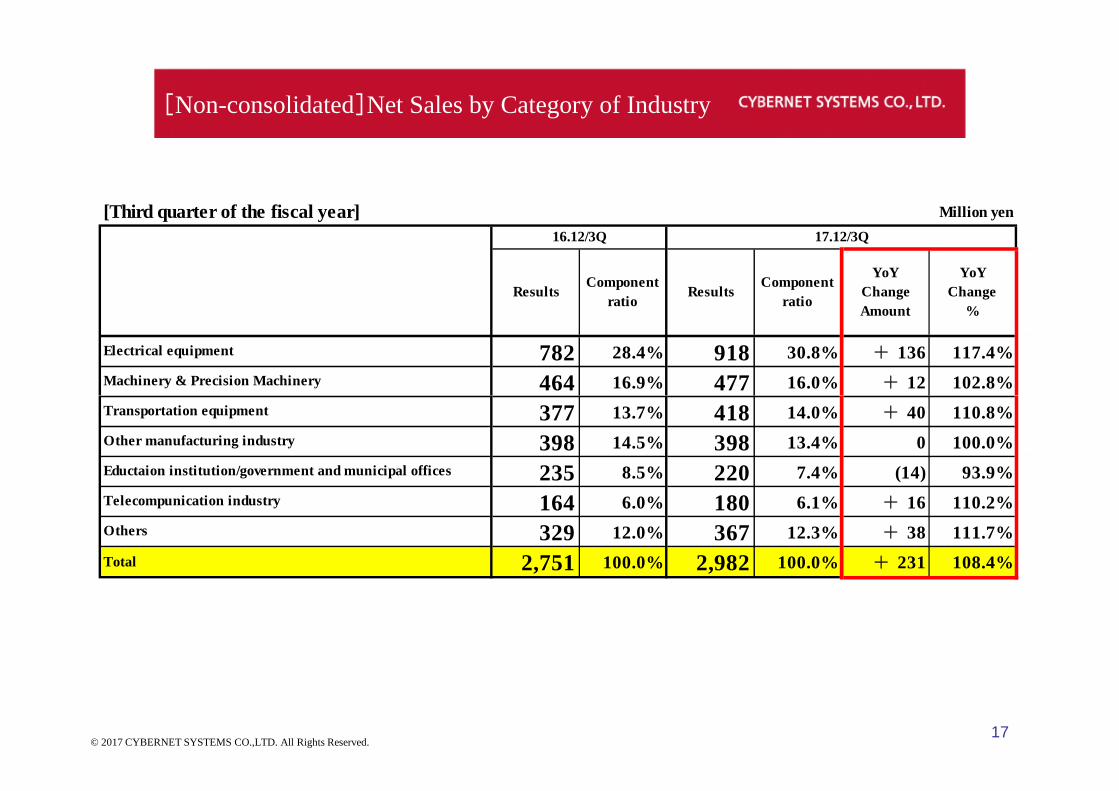
[Non-consolidated]Net Sales by Category of Industry
[Third quarter of the fiscal year] Million yen
ResultsComponent
ratioResults
Component
ratio
YoY
Change
Amount
YoY
Change
%
Electrical equipment 782 28.4% 918 30.8% + 136 117.4%
Machinery & Precision Machinery 464 16.9% 477 16.0% + 12 102.8%
16.12/3Q 17.12/3Q
17© 2017 CYBERNET SYSTEMS CO.,LTD. All Rights Reserved.
Transportation equipment 377 13.7% 418 14.0% + 40 110.8%
Other manufacturing industry 398 14.5% 398 13.4% 0 100.0%
Eductaion institution/government and municipal offices 235 8.5% 220 7.4% (14) 93.9%
Telecompunication industry 164 6.0% 180 6.1% + 16 110.2%
Others 329 12.0% 367 12.3% + 38 111.7%
Total 2,751 100.0% 2,982 100.0% + 231 108.4%
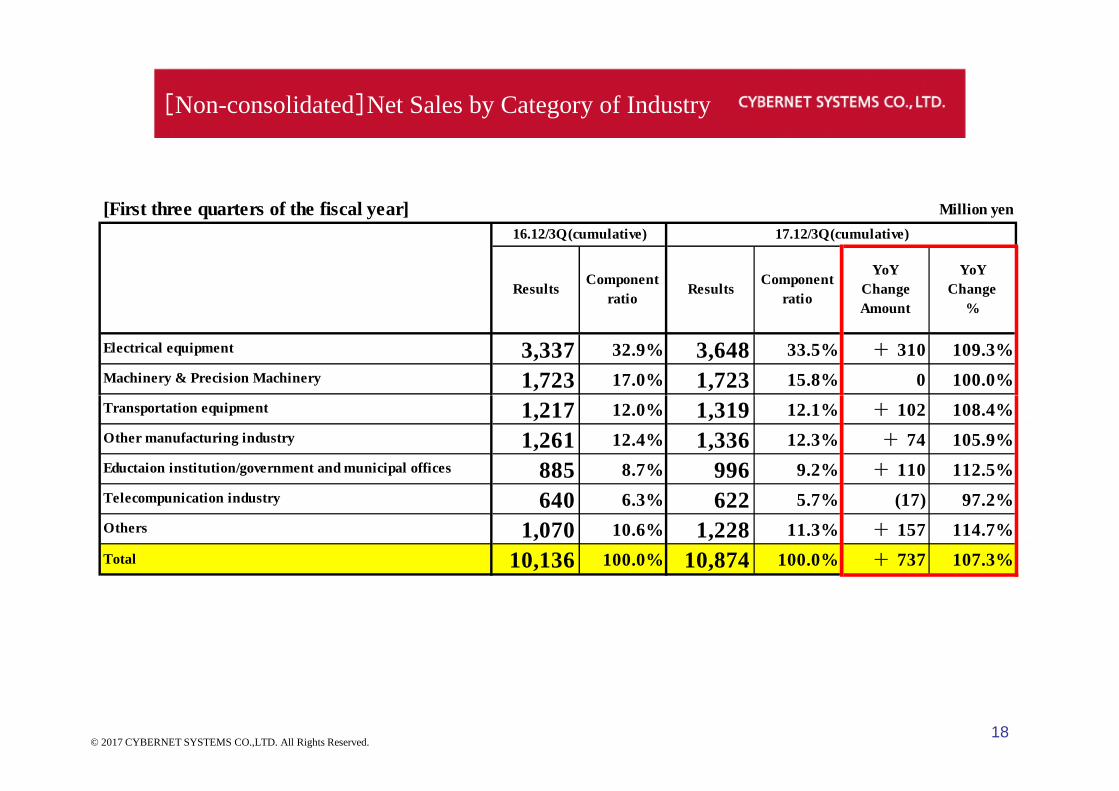
[Non-consolidated]Net Sales by Category of Industry
[First three quarters of the fiscal year] Million yen
ResultsComponent
ratioResults
Component
ratio
YoY
Change
Amount
YoY
Change
%
Electrical equipment 3,337 32.9% 3,648 33.5% + 310 109.3%
Machinery & Precision Machinery 1,723 17.0% 1,723 15.8% 0 100.0%
16.12/3Q(cumulative) 17.12/3Q(cumulative)
18© 2017 CYBERNET SYSTEMS CO.,LTD. All Rights Reserved.
Transportation equipment 1,217 12.0% 1,319 12.1% + 102 108.4%
Other manufacturing industry 1,261 12.4% 1,336 12.3% + 74 105.9%
Eductaion institution/government and municipal offices 885 8.7% 996 9.2% + 110 112.5%
Telecompunication industry 640 6.3% 622 5.7% (17) 97.2%
Others 1,070 10.6% 1,228 11.3% + 157 114.7%
Total 10,136 100.0% 10,874 100.0% + 737 107.3%
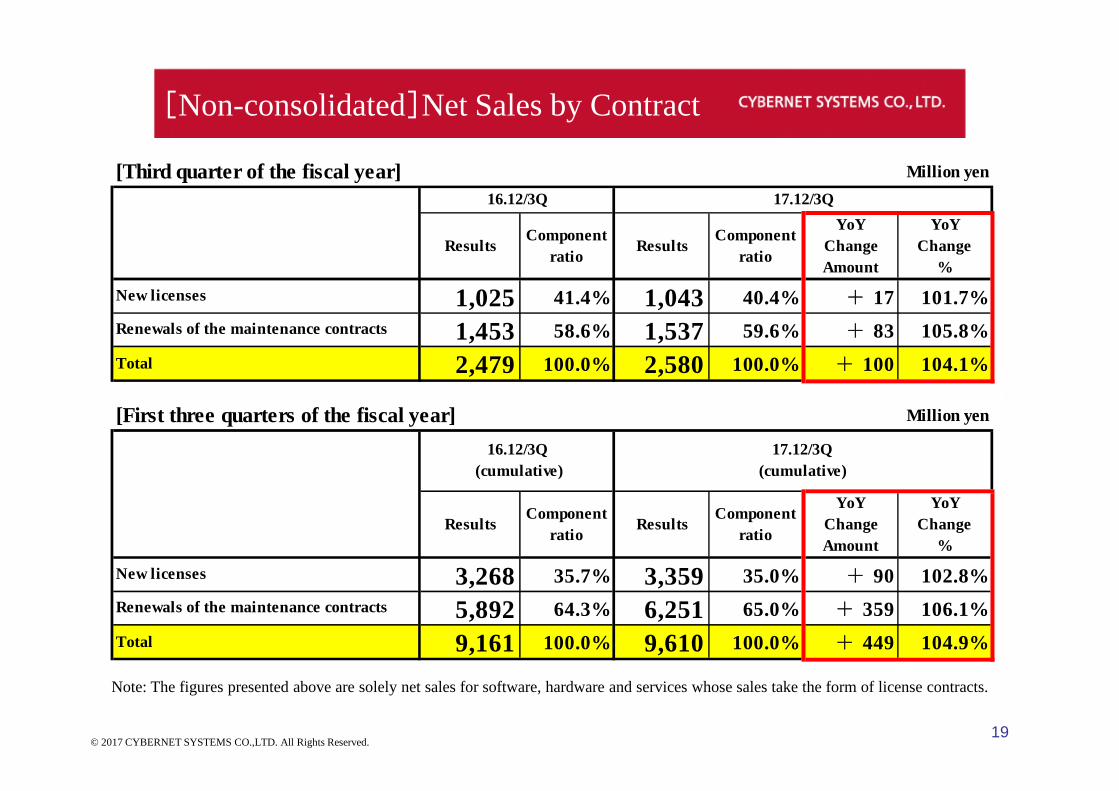
[Non-consolidated]Net Sales by Contract
[Third quarter of the fiscal year] Million yen
ResultsComponent
ratioResults
Component
ratio
YoY
Change
Amount
YoY
Change
%
New licenses 1,025 41.4% 1,043 40.4% + 17 101.7%
Renewals of the maintenance contracts 1,453 58.6% 1,537 59.6% + 83 105.8%
Total 2,479 100.0% 2,580 100.0% + 100 104.1%
16.12/3Q 17.12/3Q
Note: The figures presented above are solely net sales for software, hardware and services whose sales take the form of license contracts.
19© 2017 CYBERNET SYSTEMS CO.,LTD. All Rights Reserved.
[First three quarters of the fiscal year] Million yen
ResultsComponent
ratioResults
Component
ratio
YoY
Change
Amount
YoY
Change
%
New licenses 3,268 35.7% 3,359 35.0% + 90 102.8%
Renewals of the maintenance contracts 5,892 64.3% 6,251 65.0% + 359 106.1%
Total 9,161 100.0% 9,610 100.0% + 449 104.9%
16.12/3Q
(cumulative)
17.12/3Q
(cumulative)
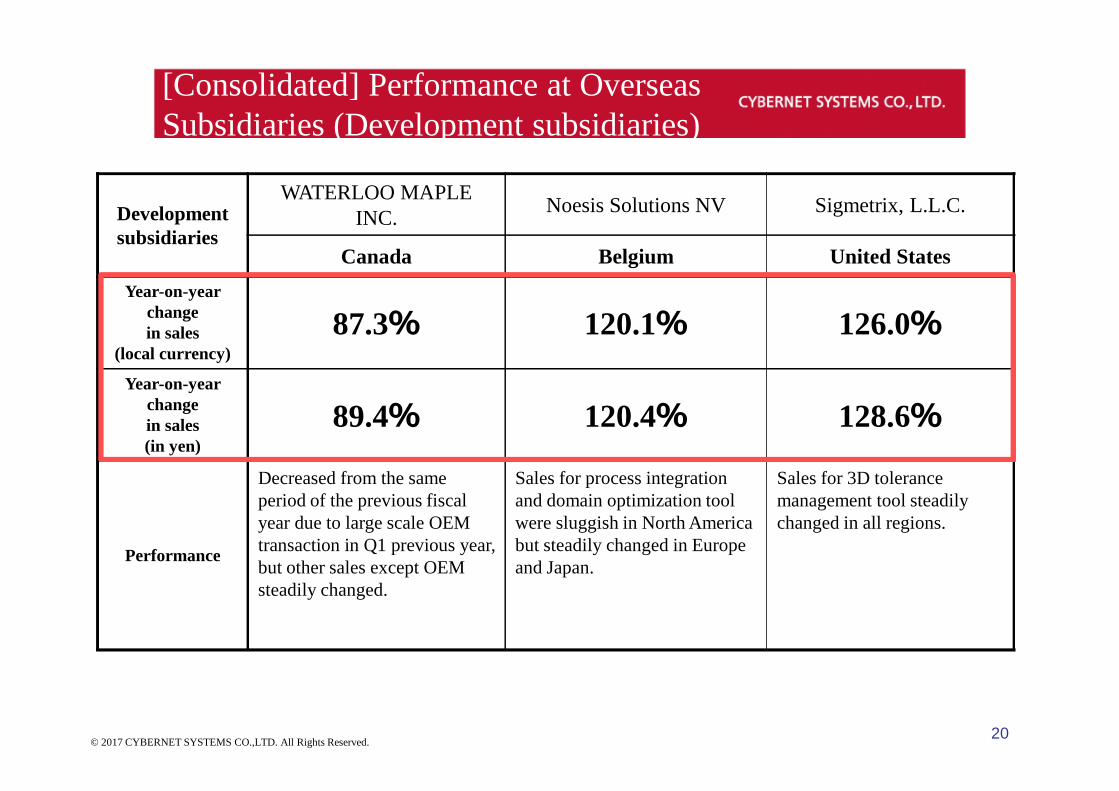
[Consolidated] Performance at OverseasSubsidiaries (Development subsidiaries)
Developmentsubsidiaries
WATERLOO MAPLEINC.
Noesis Solutions NV Sigmetrix, L.L.C.
Canada Belgium United States
Year-on-yearchangein sales
(local currency)
87.3% 120.1% 126.0%
Year-on-yearchange
% % %
20
changein sales(in yen)
89.4% 120.4% 128.6%
Performance
Decreased from the sameperiod of the previous fiscalyear due to large scale OEMtransaction in Q1 previous year,but other sales except OEMsteadily changed.
Sales for process integrationand domain optimization toolwere sluggish in North Americabut steadily changed in Europeand Japan.
Sales for 3D tolerancemanagement tool steadilychanged in all regions.
© 2017 CYBERNET SYSTEMS CO.,LTD. All Rights Reserved.
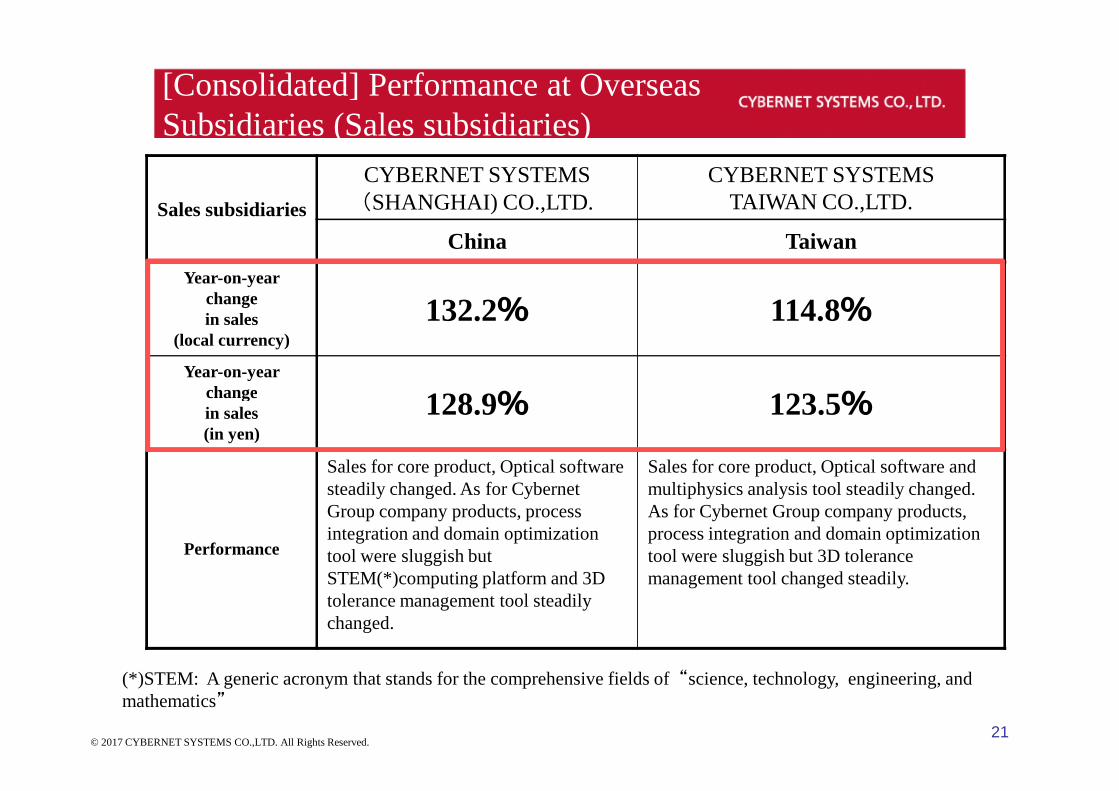
[Consolidated] Performance at OverseasSubsidiaries (Sales subsidiaries)
Sales subsidiaries
CYBERNET SYSTEMS(SHANGHAI) CO.,LTD.
CYBERNET SYSTEMSTAIWAN CO.,LTD.
China Taiwan
Year-on-yearchangein sales
(local currency)
132.2% 114.8%
Year-on-yearchange
128.9% 123.5%
21
changein sales(in yen)
128.9% 123.5%
Performance
Sales for core product, Optical softwaresteadily changed. As for CybernetGroup company products, processintegration and domain optimizationtool were sluggish butSTEM(*)computing platform and 3Dtolerance management tool steadilychanged.
Sales for core product, Optical software andmultiphysics analysis tool steadily changed.As for Cybernet Group company products,process integration and domain optimizationtool were sluggish but 3D tolerancemanagement tool changed steadily.
(*)STEM: A generic acronym that stands for the comprehensive fields of “science, technology, engineering, andmathematics”
© 2017 CYBERNET SYSTEMS CO.,LTD. All Rights Reserved.
Projection for FY2017
22© 2017 CYBERNET SYSTEMS CO.,LTD. All Rights Reserved.
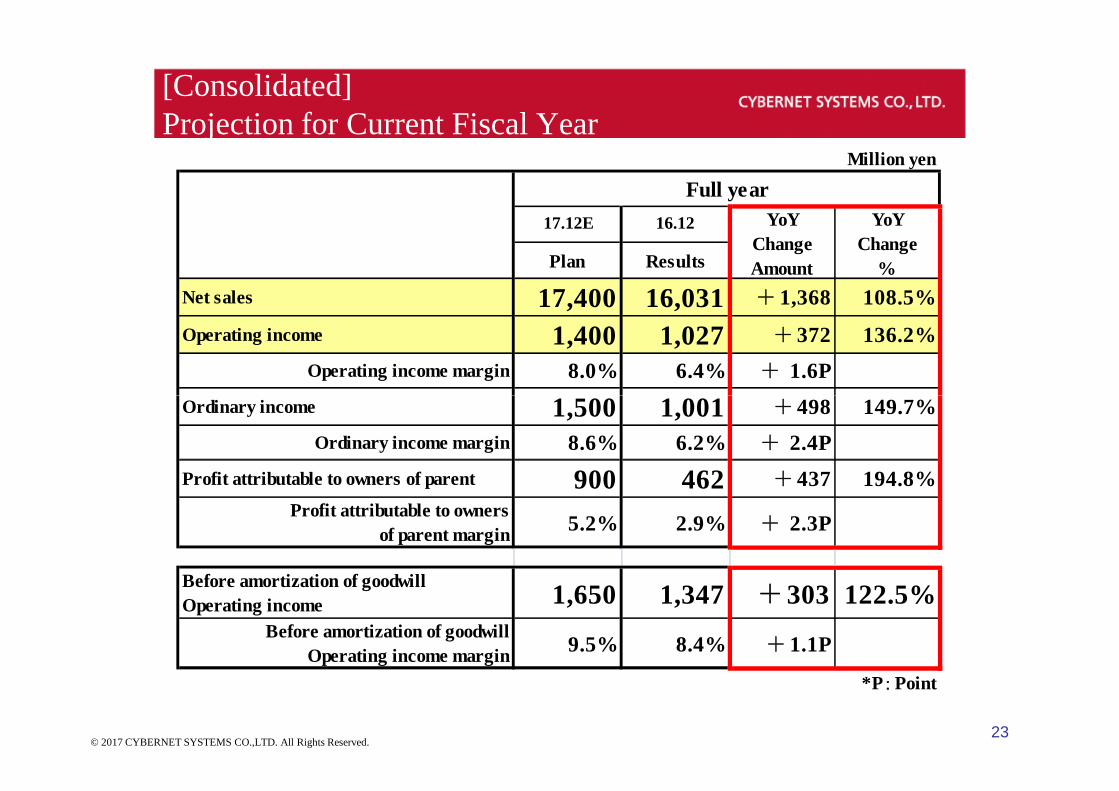
[Consolidated]Projection for Current Fiscal Year
Million yen
17.12E 16.12
Plan Results
Net sales 17,400 16,031 +1,368 108.5%
Operating income 1,400 1,027 +372 136.2%
Operating income margin 8.0% 6.4% + 1.6P
1,500 1,001 498 149.7%
Full year
YoY
Change
Amount
YoY
Change
%
23© 2017 CYBERNET SYSTEMS CO.,LTD. All Rights Reserved.
Ordinary income 1,500 1,001 +498 149.7%
Ordinary income margin 8.6% 6.2% + 2.4P
Profit attributable to owners of parent 900 462 +437 194.8%
Profit attributable to owners
of parent margin5.2% 2.9% + 2.3P
Before amortization of goodwill
Operating income 1,650 1,347 +303 122.5%Before amortization of goodwill
Operating income margin9.5% 8.4% +1.1P
*P:Point
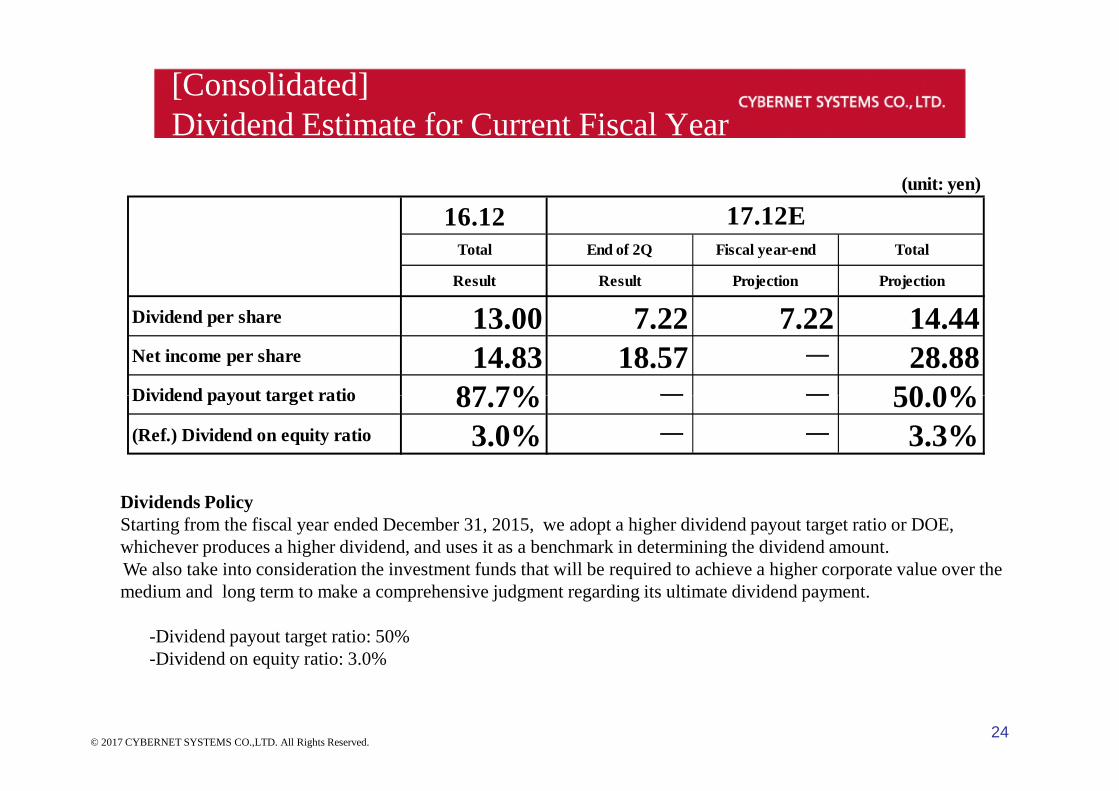
[Consolidated]Dividend Estimate for Current Fiscal Year
(unit: yen)
16.12Total End of 2Q Fiscal year-end Total
Result Result Projection Projection
Dividend per share 13.00 7.22 7.22 14.44Net income per share 14.83 18.57 - 28.88Dividend payout target ratio 87.7% - - 50.0%
17.12E
24
Dividends PolicyStarting from the fiscal year ended December 31, 2015, we adopt a higher dividend payout target ratio or DOE,whichever produces a higher dividend, and uses it as a benchmark in determining the dividend amount.We also take into consideration the investment funds that will be required to achieve a higher corporate value over themedium and long term to make a comprehensive judgment regarding its ultimate dividend payment.
-Dividend payout target ratio: 50%-Dividend on equity ratio: 3.0%
© 2017 CYBERNET SYSTEMS CO.,LTD. All Rights Reserved.
Dividend payout target ratio 87.7% - - 50.0%(Ref.) Dividend on equity ratio 3.0% - - 3.3%
Reference Materials
25© 2017 CYBERNET SYSTEMS CO.,LTD. All Rights Reserved.
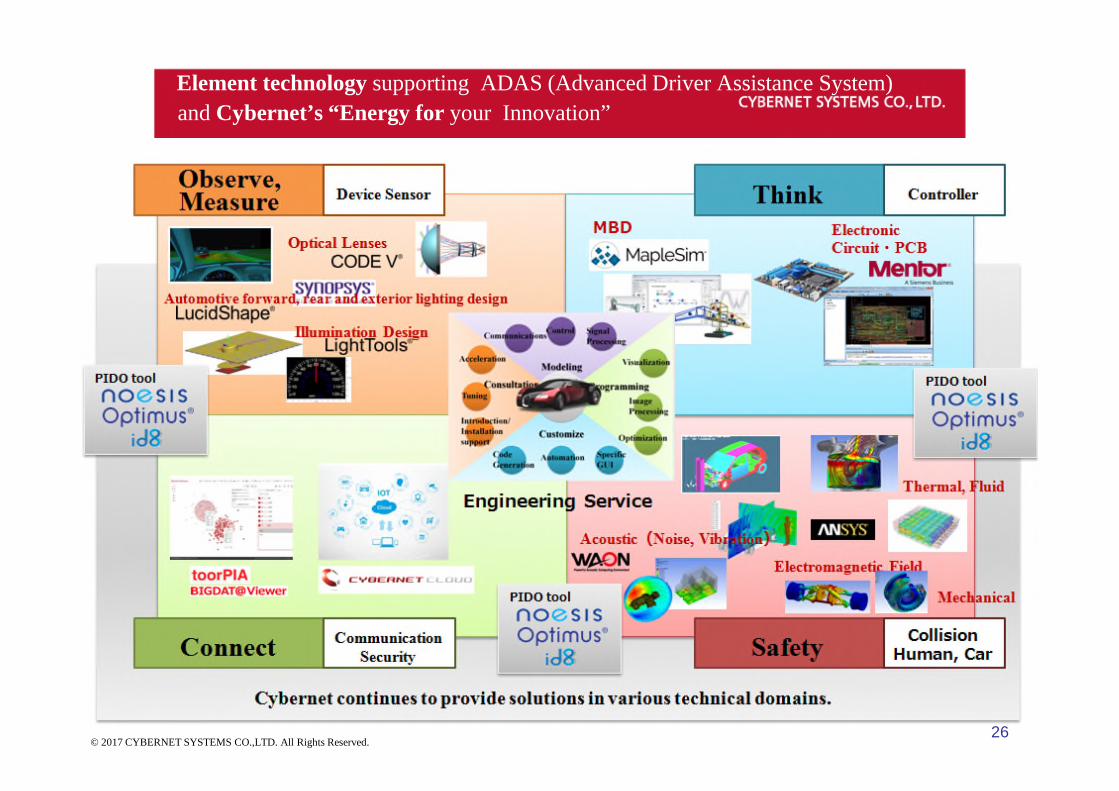
Element technology supporting ADAS (Advanced Driver Assistance System)
and Cybernet’s “Energy for your Innovation”
26© 2017 CYBERNET SYSTEMS CO.,LTD. All Rights Reserved.
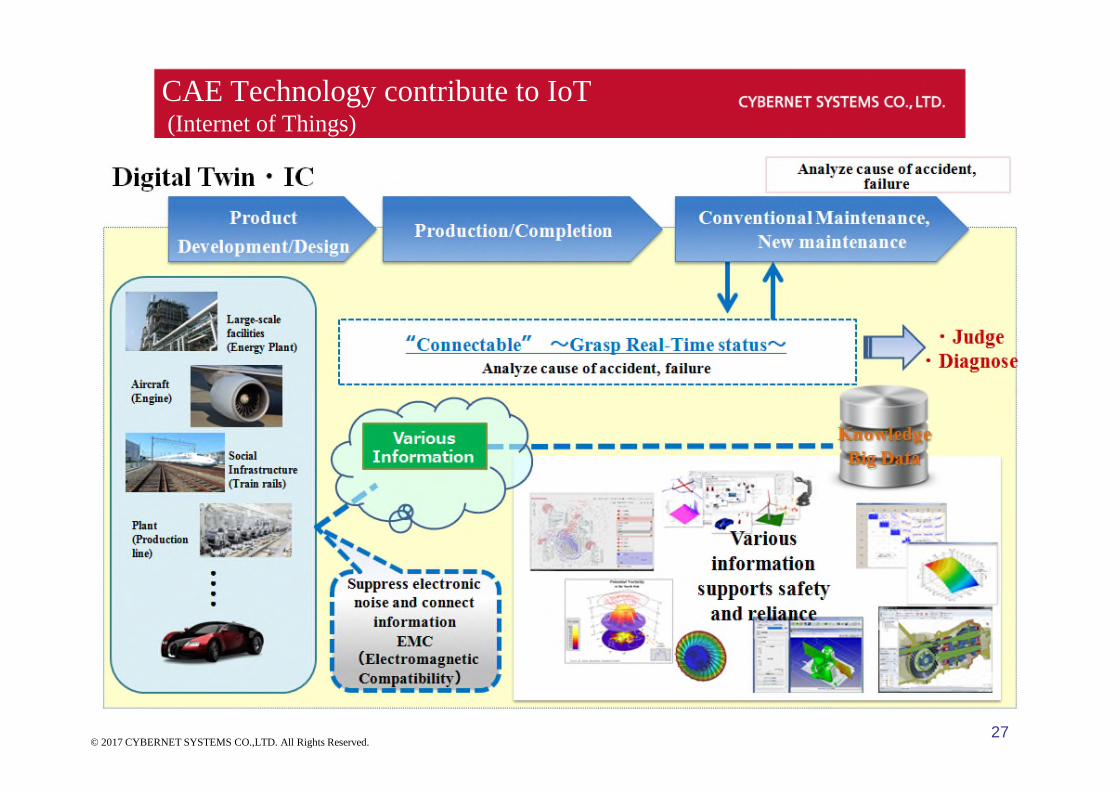
CAE Technology contribute to IoT(Internet of Things)
© 2017 CYBERNET SYSTEMS CO.,LTD. All Rights Reserved.27
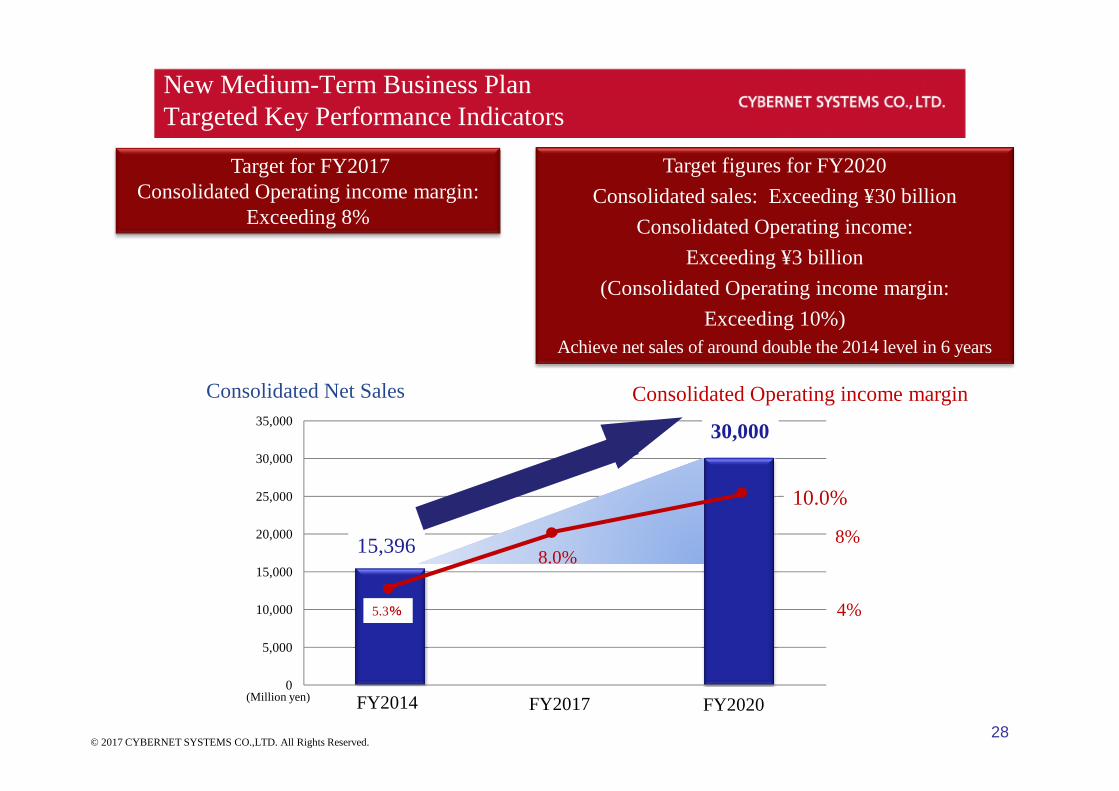
New Medium-Term Business PlanTargeted Key Performance Indicators
Target for FY2017Consolidated Operating income margin:
Exceeding 8%
Target figures for FY2020
Consolidated sales: Exceeding ¥30 billion
Consolidated Operating income:
Exceeding ¥3 billion
(Consolidated Operating income margin:
Exceeding 10%)
Achieve net sales of around double the 2014 level in 6 years
Consolidated Net Sales Consolidated Operating income margin
© 2017 CYBERNET SYSTEMS CO.,LTD. All Rights Reserved.
(Million yen)0
5,000
10,000
15,000
20,000
25,000
30,000
35,000
2014年度 2017年度 2020年度
Consolidated Net Sales Consolidated Operating income margin
15,396
5.3%
10.0%
30,000
4%
8%8.0%
FY2014 FY2017 FY2020
28
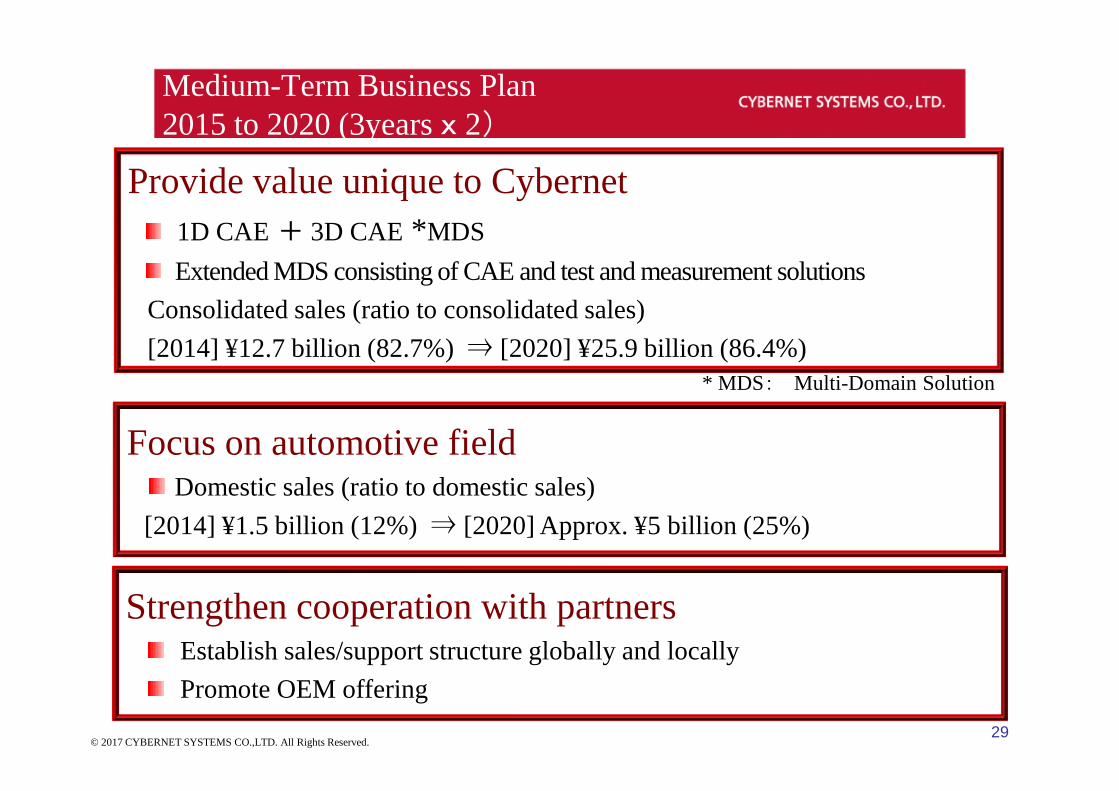
Medium-Term Business Plan2015 to 2020 (3years x 2)
Provide value unique to Cybernet
1D CAE + 3D CAE *MDS
Extended MDS consisting of CAE and test and measurement solutions
Consolidated sales (ratio to consolidated sales)
[2014] ¥12.7 billion (82.7%) ⇒ [2020] ¥25.9 billion (86.4%)* MDS: Multi-Domain Solution
Focus on automotive fieldDomestic sales (ratio to domestic sales)
[2014] ¥1.5 billion (12%) ⇒ [2020] Approx. ¥5 billion (25%)
Strengthen cooperation with partnersEstablish sales/support structure globally and locally
Promote OEM offering
29© 2017 CYBERNET SYSTEMS CO.,LTD. All Rights Reserved.
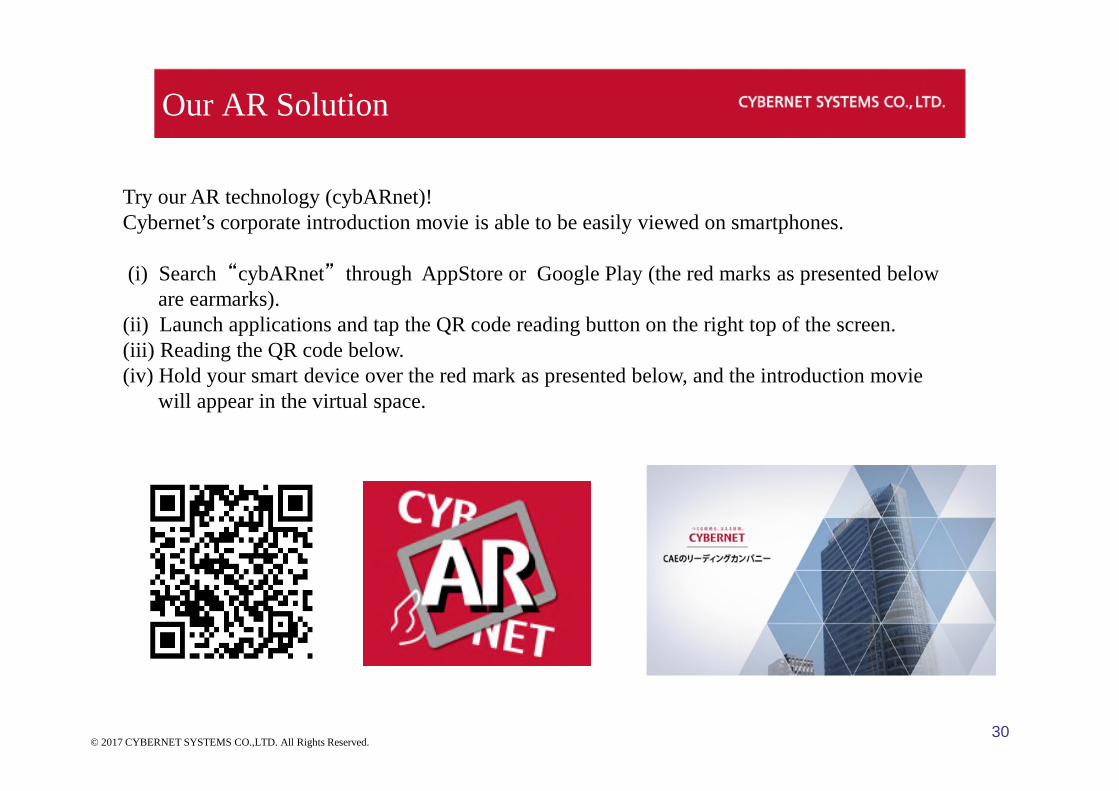
Our AR Solution
Try our AR technology (cybARnet)!Cybernet’s corporate introduction movie is able to be easily viewed on smartphones.
(i) Search “cybARnet” through AppStore or Google Play (the red marks as presented beloware earmarks).
(ii) Launch applications and tap the QR code reading button on the right top of the screen.(iii) Reading the QR code below.(iv) Hold your smart device over the red mark as presented below, and the introduction movie
will appear in the virtual space.
30
will appear in the virtual space.
© 2017 CYBERNET SYSTEMS CO.,LTD. All Rights Reserved.
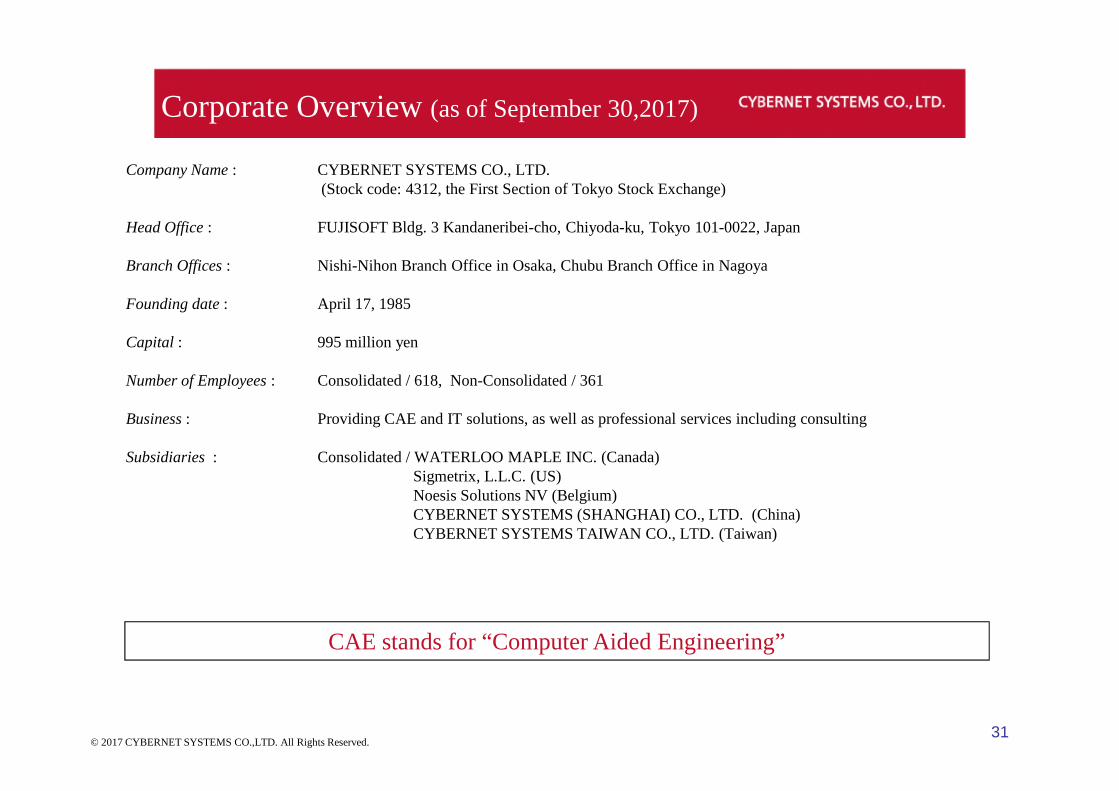
Corporate Overview (as of September 30,2017)
Company Name : CYBERNET SYSTEMS CO., LTD.(Stock code: 4312, the First Section of Tokyo Stock Exchange)
Head Office : FUJISOFT Bldg. 3 Kandaneribei-cho, Chiyoda-ku, Tokyo 101-0022, Japan
Branch Offices : Nishi-Nihon Branch Office in Osaka, Chubu Branch Office in Nagoya
Founding date : April 17, 1985
Capital : 995 million yen
Number of Employees : Consolidated / 618, Non-Consolidated / 361
Business : Providing CAE and IT solutions, as well as professional services including consulting
Subsidiaries : Consolidated / WATERLOO MAPLE INC. (Canada)Sigmetrix, L.L.C. (US)Noesis Solutions NV (Belgium)CYBERNET SYSTEMS (SHANGHAI) CO., LTD. (China)CYBERNET SYSTEMS TAIWAN CO., LTD. (Taiwan)
CAE stands for “Computer Aided Engineering”
© 2017 CYBERNET SYSTEMS CO.,LTD. All Rights Reserved.31
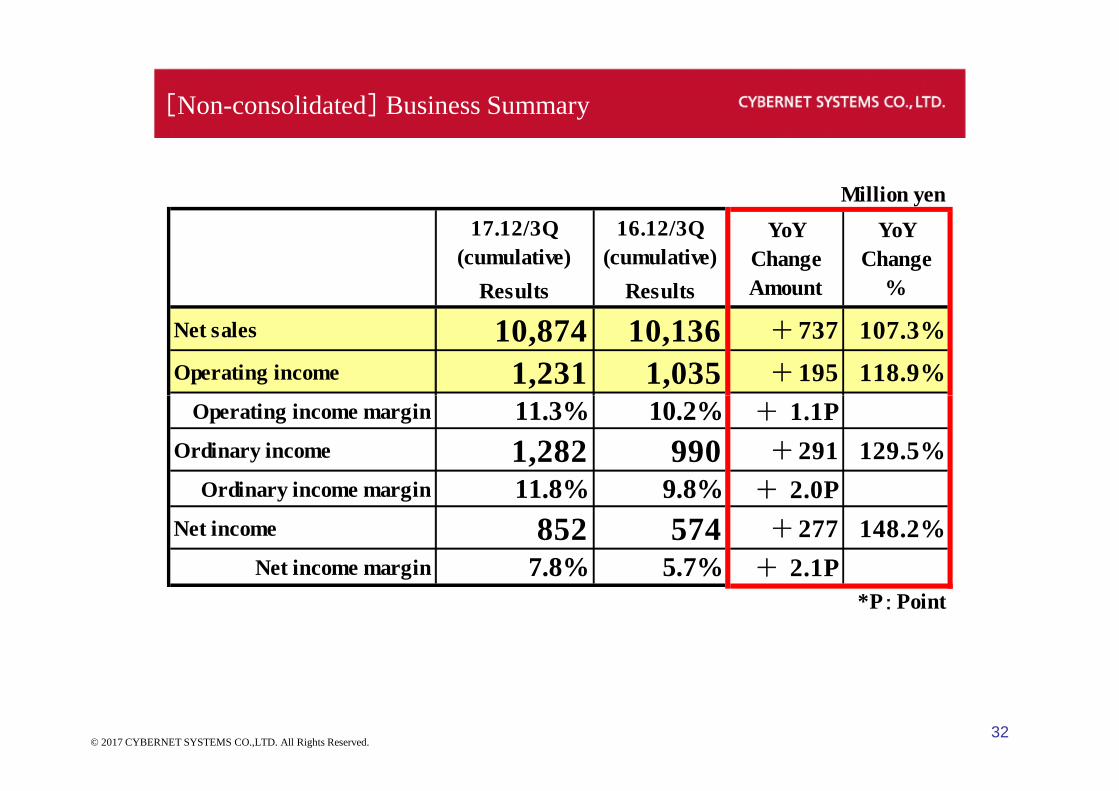
[Non-consolidated] Business Summary
Million yen
17.12/3Q
(cumulative)
16.12/3Q
(cumulative)
Results Results
Net sales 10,874 10,136 +737 107.3%
Operating income 1,231 1,035 +195 118.9%
11.3% 10.2%
YoY
Change
Amount
YoY
Change
%
32© 2017 CYBERNET SYSTEMS CO.,LTD. All Rights Reserved.
Operating income margin 11.3% 10.2% + 1.1P
Ordinary income 1,282 990 +291 129.5%
Ordinary income margin 11.8% 9.8% + 2.0P
Net income 852 574 +277 148.2%
Net income margin 7.8% 5.7% + 2.1P
*P:Point
■ Corporate Planning and IR Department
Address: Fuji Soft Bldg., 3, Kanda Neribei-cho, Chiyoda-ku, Tokyo 101-0022, Japan
TEL.: +81-3-5297-3066
FAX.: +81-3-5297-3609
E-mail: [email protected]
URL: http://www.cybernet.co.jp/english/
These materials are prepared for the sole purpose of providing information as a reference to investors in making investmentdecisions, and are not intended as a solicitation for investment.
These materials were created from data obtained through our operations. We make no guarantees, however, with respect to
integrity. In addition, the opinions and predictions provided in these materials relate to the Company’s outlook at the time the
materials were prepared. No guarantees whatsoever extend to any outcomes over the use of such opinions or predictions.
The contents of these materials are subject to change without notice.The contents of these materials are subject to change without notice.
Investors are requested to use their own judgment in making any final decisions regarding investments.