Embed Size (px)
Citation preview

PLANNED LANDFILL SITE,
ESPERANCE
RESULTS OF PUMPING TESTS
REPORT FOR
SHIRE OF ESPERANCE
AUGUST 2018
Report No 419-0/18/01a

Planned Landfill Site, Esperance Results of Pumping Tests
Rockwater I:\419-0\Report\18-01a_Pumping Test Results.docx
TABLE OF CONTENTS
1. INTRODUCTION 1
2. HYDROGEOLOGICAL SETTING 1
3. DRILLING AND BORE CONSTRUCTION 1
4. PUMPING TESTS 2
4.1. Method 2
4.2. Results 2Nth Production 34.2.1.
Sth Production 34.2.2.
5. GROUNDWATER FLOW VELOCITY 4
5.1. Nth Production 4
5.2. Sth Production 4
6. ASSESSMENT OF OTHER WORK ITEMS 4
6.1. Potential to Recovery Leachate 4
6.2. Need for an EM Survey 5
6.3. Bore into the Werillup Formation 5
6.4. Need for Additional Monitoring Bores to Determine Flow Directions 5
7. CONCLUSIONS 6
REFERENCES 6
Table
Table 1: Details of Test and Monitoring Bores 2
Figures
1 Bore Locations
2 Nth Production Pumping Test at 1.62 L/s, Drawdowns in Pumped and Monitoring Bores
3 Sth Production Pumping Test at 1.6 L/s, Drawdowns in Pumped and Monitoring Bores
4 Calculated Drawdowns after One Year Pumping Recovery Bore at 120 m3/d, and Flow-Paths
REVISION AUTHOR REVIEW AUTHORISED ISSUED
0 PHW JRP 14/8/18
1 PHW JRP 23/8/18

Planned Landfill Site, Esperance Results of Pumping Tests Page 1
Rockwater I:\419-0\Report\18-01a_Pumping Test Results.docx
1. INTRODUCTION
The Shire of Esperance is planning a new landfill at Lot 12 Kirwan Road, located about 16.5 km north-east
of Esperance.
A detailed hydrogeological investigation of the site was completed by Talis Consultants (2017) that
included the drilling of cored holes at 18 sites and completing them as monitoring bores; geological
logging of the cores; conducting falling-head permeability tests; monitoring groundwater levels on several
occasions and determining groundwater levels and flow velocities; and monitoring groundwater quality.
The investigations were reviewed by Pennington Scott (2018), who recommended that additional work be
carried out, including the following:
Conduct a surface EM geophysical survey;
Construct at least two bores into the spongolite aquifer for test-pumping;
Drill an optional hole into the Werillup aquifer and complete as a monitoring bore; and
Drill additional bores to determine whether there is any flow to Lake Warden.
Rockwater was engaged to plan the drilling and construction of two test bores and associated monitoring
bores into the spongolite aquifer, to supervise the test-pumping of the bores, and analyse the results to
determine groundwater flow velocity.
In a second stage, Rockwater was asked to assess whether the additional work items recommended by
Pennington Scott should be completed; and whether the values of hydraulic conductivity determined from
the pumping tests would allow time to recover leachate, should a leak from the landfill occur.
This report presents the results of the pumping tests, and an assessment of whether the additional work
items should be completed, and whether any leachate from the landfill could be recovered.
2. HYDROGEOLOGICAL SETTING
The geological logs and core photographs included in the Talis Consultants report show that the water
table is about 11 m deep at the two test bore sites (near bores GW12 and GW17), below which there is
predominantly fossiliferous, vuggy and jointed siliceous siltstone with clayey interbeds to about 25 m
depth, overlying siltstone and clays. The siliceous siltstone is interpreted to be the spongolite member of
the Pallinup Siltstone, that can be moderately permeable.
Falling-head permeability tests indicated hydraulic conductivities of the spongolite of 0.1 to 0.4 m/d (Talis
Consultants (2017). That report also shows that the groundwater flows to the south-south-west under a
hydraulic gradient of about 0.0055.
3. DRILLING AND BORE CONSTRUCTION
The test bore sites were selected near monitoring bores GW12 and GW17 to be along the groundwater
flow-path between the planned landfill and the southern boundary of the property. They were located
about 30 m along flow direction from bores GW12 and GW17; and an additional monitoring bore was
constructed at each site across-flow direction, about 30 m north-west of the production bores.

Planned Landfill Site, Esperance Results of Pumping Tests Page 2
Rockwater I:\419-0\Report\18-01a_Pumping Test Results.docx
The test bores, named Nth Pumped and Sth Pumped (Fig. 1) were drilled by Kent’s Water Boring using a
Gemco drilling rig and hollow-flight augers with water circulation. They were drilled at 200 mm diameter,
and completed with 100 mm Class 9 uPVC casing, machine-slotted below the water table to 29 m or 30 m
depth with 1.3 mm-wide slots. The annuli were gravel-packed (3 mm to 6 mm gravel) to 1 m above the
slots, then sealed above with cement to the surface.
Cuttings samples were taken at 1 m intervals, although at Nth Pumped there were no cuttings returned
below 8 m depth (all drilling water was lost to the formation).
The new monitoring bores were drilled at 150 mm diameter and completed with 50 mm Class 18 uPVC,
slotted over much the same intervals as the test bores, with annuli gravel-packed, and sealed with
cement. The bores were developed by bailing.
Bore details are summarised in Table 1.
Table 1: Details of Test and Monitoring Bores
4. PUMPING TESTS
4.1. METHOD
The pumping tests were conducted by Kent’s Water Boring under Rockwater supervision, using an electric
submersible pump with a gate valve and a pressure gauge at the borehead to control and monitor flow
rate. The flow rate was measured by timing the flow into a graduated 25 litre bucket. Water was piped
about 100 m from the borehead to minimise the risk of re-circulation.
Each test comprised an eight-hour constant rate test; this is a suitable duration for determining values of
hydraulic conductivity. The tests were to be extended if boundary effects were detected, evidenced by
changes in the rate of water-level drawdown.
Water levels were monitored manually in the pumped bore using a graduated electric probe, and by
pressure transducers coupled to a data logger in the monitoring bores, with manual measurements as a
check. The frequency of measurements ranged from 0.5 minute (start) to 30 minutes in the later stages of
each test. On completion of each test, recovery measurements were made until at least 95 percent water-
level recovery had been achieved.
4.2. RESULTS
Similar results were observed in both tests:
Drawdowns in the production bores followed straight-line trends on semi-logarithmic scale after 8 to 10
minutes of pumping, typical of a laterally extensive aquifer (Figs. 2 and 3). The steeper drawdown trends
Bore mE mNDist. From
Prod. Bore
Depth
Drilled
Casing
Diam.Casing Type Ht Casing Slots SWL
(m) (m) (mm) (magl) (m bgl) (m btc)
Nth Pumped 412836 6261237 0 29 100 Cl. 9 uPVC 0.48 11-29 11.48
Sth Pumped 412670 6260435 0 30 100 Cl. 9 uPVC 0.70 12-30 12.00
N-W Obs 412803 6261255 37 29 50 Cl. 18 uPVC 0.37 11-29 11.68
S-W Obs 412646 6260456 31 31 50 Cl. 18 uPVC 0.64 10-31 11.69
(GPS)

Planned Landfill Site, Esperance Results of Pumping Tests Page 3
Rockwater I:\419-0\Report\18-01a_Pumping Test Results.docx
at the start of each test are attributed to additional head losses due to turbulent flow through the casing
slots.
The pressure transducer data had to be corrected for the effects of a marked decrease in air pressure
during 31 July and early part of 1 August before the passage of a significant frontal system. Before
correction, the drawdowns were up to 0.1 m larger than those indicated by the (accurate) manual
measurements.
At the end of each pumping test, water levels in the pumped bores reached 95 % recovery in less than 10
minutes.
Drawdowns in the monitoring bores were all significantly smaller than would be expected from their
distance from the pumped bore, indicating incomplete hydraulic connection with the pumped bores (due
to discontinuities in the joints and vugs in the aquifer). In an ideal aquifer, the slopes of drawdown-time
curves for the monitoring bores would be the same as for the production bore, on semi-log scale.
NTH PRODUCTION 4.2.1.
Nth Production bore was test-pumped at 1.62 L/s (140 m3/d) for eight hours from 0900 hrs on 31 July
2018. Drawdowns measured in the pumped and monitoring bores are shown in Fig. 2. The maximum
drawdown was 7.3 m in the pumped bore, but only 0.11 m in N-W Obs and 0.08 m in GW12.
Only the data for the pumped bore are suitable for determining aquifer transmissivity and average
hydraulic conductivity. The Jacob’s straight-line method was used (Cooper and Jacob, 1946), where:
T = 2.3Q/4πΔs
T = Transmissivity (m2/d),
Q = Pumping rate (m3/d)
Δs = Drawdown in one log cycle, on semi-log drawdown-time plot.
Using the straight-line section of the drawdown-time plot for the pumped bore in Fig. 2:
T = 36 m2/d, and assuming an aquifer thickness (b) = 14 m, average hydraulic conductivity (KH) = T/b = 2.6
m/d.
STH PRODUCTION 4.2.2.
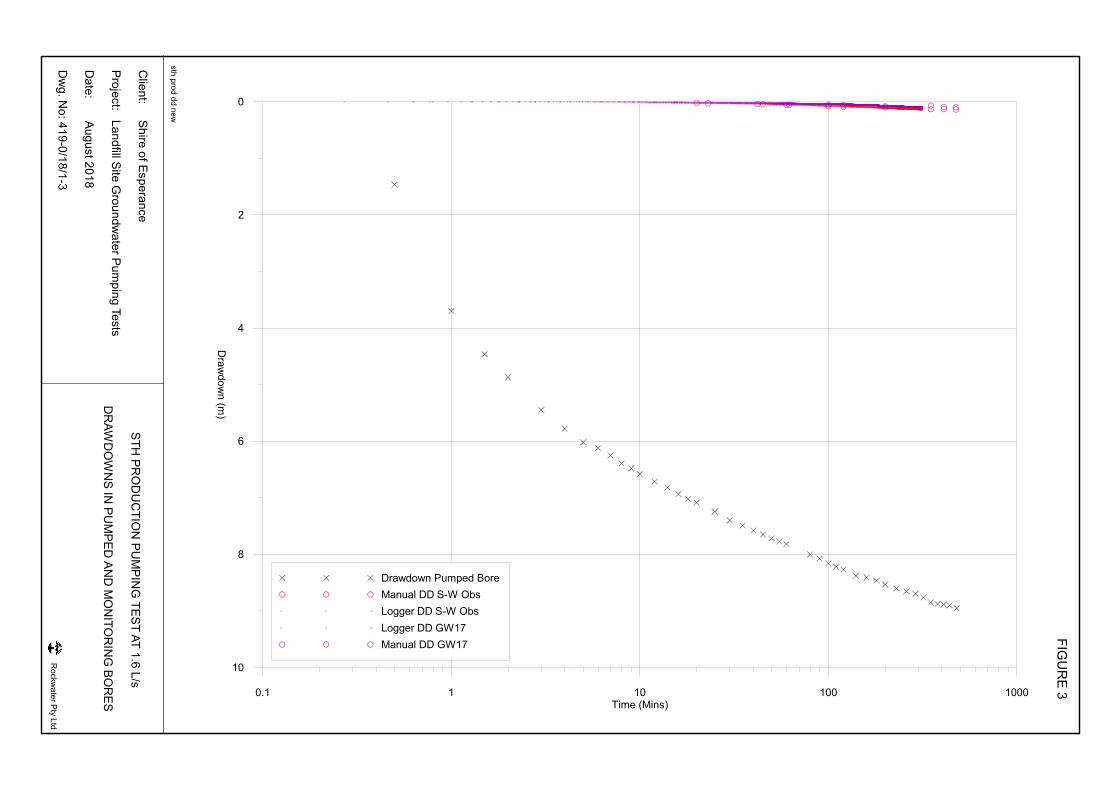
Sth Production bore was test-pumped at 1.6 L/s (138 m3/d) for eight hours from 0815 hrs on 1 August
2018. Drawdowns measured in the pumped and monitoring bores are shown in Fig. 3. The maximum
drawdown was 9.0 m in the pumped bore, but only 0.14 m in S-W Obs and 0.10 m in GW17.
Again, only the data for the pumped bore are suitable for determining aquifer transmissivity and average
hydraulic conductivity:
Using the straight-line section of the drawdown-time plot for the pumped bore in Fig. 3:
T = 21.4 m2/d, and assuming an aquifer thickness (b) = 13 m, average hydraulic conductivity (KH) = 1.65
m/d. This lower value (compared to Nth Production) is in accordance with the steeper hydraulic gradient
in the southern area shown by the groundwater-level contour plans in Talis Consultants (2017).

Planned Landfill Site, Esperance Results of Pumping Tests Page 4
Rockwater I:\419-0\Report\18-01a_Pumping Test Results.docx
5. GROUNDWATER FLOW VELOCITY
Groundwater flow velocity is given by a form of the Darcy Equation:
V = KH x i/n, where:
V = Velocity (m/d);
KH = horizontal hydraulic conductivity (m/d);
i = hydraulic gradient; and
n = effective porosity (i.e. the portion of the rock volume comprising interconnected pores that enable
groundwater flow).
Whereas total porosity might be 0.3 (30% of rock volume) the effective porosity is likely to be about 0.1.
This assumed value is used in the calculations below.
5.1. NTH PRODUCTION
At Nth Production, KH = 2.6 m/d, i = 0.0041 (March 2017 groundwater level contours, Talis Consultants,
2017).
Therefore, V = 2.6 x 0.0041/0.1 = 0.107 m/d or 39 m/yr. With a distance of 1.6 km from the planned
landfill to the southern property boundary, the travel time would be about 41 years.
5.2. STH PRODUCTION
At Sth Production, KH = 1.65 m/d, i = 0.0065 (March 2017 groundwater level contours, Talis Consultants,
2017).
Therefore, V = 1.65 x 0.0065/0.1 = 0.107 m/d or 39 m/yr (as at Nth Production). Again, the travel time
from the planned landfill to the southern property boundary would be about 41 years.
6. ASSESSMENT OF OTHER WORK ITEMS
6.1. POTENTIAL TO RECOVERY LEACHATE
The pumping test results have shown that the Pallinup Siltstone underlying the site is moderately
permeable and suitable for the construction of leachate recovery bores, should they be needed. With a
natural groundwater flow velocity of 39 m/yr, there would be time to construct a bore, say 100 m down-
gradient, to intercept any leachate.
A simple numerical groundwater model was constructed using the average KH value obtained from the
pumping tests, to assess whether there would be sufficient time to recover leachate. The model consists
of:
A rectangular grid of 20 m x 20 m cells centred on the landfill site, extending over a 1 km x 1 km
area, and aligned with the groundwater flow direction (to the south-west);
An unconfined aquifer thickness of 13 m;

Planned Landfill Site, Esperance Results of Pumping Tests Page 5
Rockwater I:\419-0\Report\18-01a_Pumping Test Results.docx
A hydraulic gradient of about 0.005 m/m;
KH = 2.1 m/d, and specific yield 0.1;
Constant-head boundaries in the north-east and south-west to simulate flow into and out of the
model area.
The model utilises Processing Modflow Pro and Modflow-96, finite-difference groundwater modelling
software designed by the U.S. Geological Survey (McDonald and Harbaugh, 1988) to simulate pumping
from a point about 100 m south of a landfill cell, at a rate of 120 m3/d for about one year. Modpath
(Pollock, 19898) was then used to determine flow paths from a 40 m width (of landfill) to the bore.
The results of this indicative modelling using an uncalibrated model suggest that groundwater-level
drawdowns around the bore after one year would extend at least 100 m radially, and that the bore would
capture all of the flow from a 40 m front after about 14 months (Fig. 4). In reality, the aquifer is likely to be
semi-confined rather than unconfined, and so drawdowns (and the capture zone) would be greater.
6.2. NEED FOR AN EM SURVEY
An electromagnetic (EM) survey can delineate variations in ground conductance, and so may be able to
delineate areas of shallow granitic bedrock. However, other factors such as variations in groundwater
salinity, variations in clay content and the presence of carbonaceous sediments can also result in EM
anomalies. There is insufficient information in the Baddock (1995) report to show whether shallow
bedrock was detected using the method in a nearby area.
As stated in the Pennington Scott (2018) review, any sub-surface granitic ridge is likely to be parallel to the
groundwater flow direction, and so would have little impact on the flow. The groundwater flow direction
indicated by groundwater-level contour plans, such as Fig. 19 of the Talis (2017) report give no indications
of any impact from such a ridge, if it exists.
Consequently, an EM survey is considered to be unnecessary.
6.3. BORE INTO THE WERILLUP FORMATION
The Werillup Formation is the main, or one of, the main aquifers in the region, and so a drillhole is
recommended to determine whether that formation occurs (at one location) beneath the site, and its
local characteristics.
The hole should be completed as a monitoring bore so that groundwater quality in the Werillup Formation
can be monitored. Although the Pallinup Siltstone would restrict the vertical movement of groundwater,
some flow down to the Werillup Formation could occur.
A suitable site would be between GW02 and GW17, in the western part of the southern boundary of the
property, down-gradient of the planned landfill.
6.4. NEED FOR ADDITIONAL MONITORING BORES TO DETERMINE FLOW DIRECTIONS
Pennington Scott (2018) suggested that additional monitoring bores might be needed to show that
groundwater flow from the site is not towards Lake Warden, north of Esperance and some 15 km west of
the site.

Planned Landfill Site, Esperance Results of Pumping Tests Page 6
Rockwater I:\419-0\Report\18-01a_Pumping Test Results.docx
Groundwater-level contour plans, such as Fig. 19 of the Talis (2017) report show that the groundwater
flow is to the south-west towards an ancient shoreline (escarpment) 1.4 km away. Groundwater beneath
the landfill property eventually discharges to seeps and springs on and below the escarpment, and to
small lakes and wetlands further towards the coast.
There is no need for additional bores to define the groundwater flow direction. Monitoring of bores on
the landfill property will be required to show there is no groundwater contamination, irrespective of the
groundwater discharge area.
7. CONCLUSIONS
The results of two pumping tests on bores constructed along the groundwater flow-path from the planned
landfill site to the southern boundary of the property indicate that the Pallinup Siltstone (probably
Spongolite Member) from the water table to about 25 m depth is moderately permeable, with hydraulic
conductivity values of 2.6 and 1.65 m/d determined. These values coincide with lower and higher
hydraulic gradients, respectively, and calculations indicate the same groundwater flow velocity of 0.107
m/d or 39 m/yr for both test locations.
The nature of the siltstone at both locations is similar, although there appear to be more vugs at Nth
Production (and GW12) than at Sth Production (and GW17). There are no indications from either the test
results or the groundwater-level contours that there are any zones of preferred groundwater flow
beneath the site that would result from, for example, a major karstic feature such as a solution pipe.
In the event of leachate reaching groundwater beneath the landfill, the Pallinup Siltstone down-gradient
will be a suitable aquifer for a recovery bore or bores, should they be needed.
Neither an EM geophysical survey to delineate shallow granite, nor additional bores to define
groundwater flow directions, are considered necessary. However, a hole is recommended to see whether
the Werillup Formation occurs beneath the Pallinup Siltstone, and if so the hole should be completed as a
monitoring bore.
Dated: 23 August 2018 Rockwater Pty Ltd
P H Wharton Principal
REFERENCES
Baddock, L.J., 1995, Coramup – Bandy Creek Esperance groundwater investigation. Geological Survey of
Western Australia Hydrogeology report 1995/13.

Planned Landfill Site, Esperance Results of Pumping Tests Page 7
Rockwater I:\419-0\Report\18-01a_Pumping Test Results.docx
Cooper, H.H. & Jacob, C.E., 1946, A generalised Graphical Method for Evaluating Formation Constants and
Summarising Well Field History. Transactions of the American Geophysics Union, Vol. 27, pp. 526-
534.
McDonald, M.G., and A.W. Harbaugh, 1988, A Modular Three-Dimensional Finite-Difference
Ground-Water Flow Model. Book 6, Chapter A1, Techniques of Water Resources Investigations.
U.S. Geol. Surv., Washington, DC. (A:3980).
Pennington Scott, 2018, Independent technical review of Esperance waste management facility Env
Referral. Report to Shire of Esperance.
Pollock, D.W., 1989, Documentation of computer programs to compute and display pathlines using results
from the U.S. Geological Survey modular three-dimensional finite-difference groundwater flow
model. U.S. Geol. Surv. Open-File Report 89-381, 199p.
Talis Consultants, 2017, Phase I – hydrogeological investigation, Lot 12 Kirwan Road. Report to Shire of
Esperance.

Rockwater I:\419-0\Report\18-01a_Pumping Test Results.docx
FIGURES

Nth Pumped
N-W Obs
Sth PumpedS-W Obs
GW17
411000 411500 412000 412500 413000 413500 414000
6260000
6260500
6261000
6261500
6262000
6262500
6263000
Landfill Site
Base Map from Talis Consultants, 2017

0.1 1 10 100 1000Time (Mins)
10
8
6
4
2
0
Dra
wdow
n (m
)
Drawdown Pumped Bore
Manual DD N-W Obs
Logger DD N-W Obs
Logger DD GW12
Manual DD GW12
Clie
nt: S
hire
of E
sp
era
nce
Pro
ject: L
an
dfill S
ite G
rou
nd
wa
ter P
um
pin
g T
ests
Da
te: A
ug
ust 2
01
8
Dw
g. N
o: 4
19
-0/1
8/1
-2
NT
H P
RO
DU
CT
ION
PU
MP
ING
TE
ST
AT
1.6
2 L
/s
DR
AW
DO
WN
S IN
PU
MP
ED
AN
D M
ON
ITO
RIN
G B
OR
ES
FIG
UR
E 2
Ro
ckw
ate
r Pty
Ltd
nth
pro
d d
d
0.1 1 10 100 1000Time (Mins)
10
8
6
4
2
0
Dra
wdow
n (m
)
Drawdown Pumped Bore
Manual DD S-W Obs
Logger DD S-W Obs
Logger DD GW17
Manual DD GW17
Clie
nt: S
hire
of E
sp
era
nce
Pro
ject: L
an
dfill S
ite G
rou
nd
wa
ter P
um
pin
g T
ests
Da
te: A
ug
ust 2
01
8
Dw
g. N
o: 4
19
-0/1
8/1
-3
ST
H P
RO
DU
CT
ION
PU
MP
ING
TE
ST
AT
1.6
L/s
DR
AW
DO
WN
S IN
PU
MP
ED
AN
D M
ON
ITO
RIN
G B
OR
ES
FIG
UR
E 3
Ro
ckw
ate
r Pty
Ltd
sth
pro
d d
d n
ew

0.2
0.2
0.2
0.4
0.6
412350 412400 412450 412500 412550 412600 412650 412700 412750 412800
6261000
6261050
6261100
6261150
6261200
6261250
6261300
6261350
6261400
6261450
6261500
Each Arrow-Head Represents Two Months Flow


![Guide to Conducting Pumping Tests - B.C. … 4 ] HOW IS PUMPING RATE SELECTED? The well should be pumped at or above the intended pumping rate of the well and the well should not be](https://img.pdfslide.net/doc/110x75/5ccd45bc88c993de558dee0c/guide-to-conducting-pumping-tests-bc-4-how-is-pumping-rate-selected-the-well.jpg)