Embed Size (px)
Citation preview

Commonwealth Bank of Australia ACN 123 123 124
Results PresentationFor the half year ended 31 December 2009
10 February 2010
Results PresentationFOR THE FULL YEAR ENDED 30 JUNE 2011
DETERMINED TO BE BETTER THAN WE‟VE EVER BEEN.
Ralph Norris
Chief Executive Officer
David Craig
Chief Financial Officer
10 AUGUST 2011 | COMMONWEALTH BANK OF AUSTRALIA | ACN 123 123 124

Notes
Disclaimer
The material that follows is a presentation of general background information about the Group‟s activities
current at the date of the presentation, 10 August 2011. It is information given in summary form and does not
purport to be complete. It is not intended to be relied upon as advice to investors or potential investors and
does not take into account the investment objectives, financial situation or needs of any particular investor.
These should be considered, with or without professional advice when deciding if an investment is appropriate.
Cash Profit
The Management Discussion and Analysis discloses the net profit after tax on both a „Statutory basis‟ and a
„Cash basis‟. The Statutory basis is prepared in accordance with the Corporations Act 2001 and the Australian
Accounting Standards, which comply with International Financial Reporting Standards (IFRS). The Cash basis
is used by management to present a clear view of the Group‟s underlying operating results, excluding a
number of items that introduce volatility and/ or one off distortions of the Group‟s current period
performance. These items, such as hedging and IFRS volatility, are calculated consistently year on year and
do not discriminate between positive and negative adjustments. A complete list of items excluded from
statutory profit is provided in the reconciliation of the Net profit after tax (“Cash basis”) on page 3 of the Profit
Announcement (PA) and described in greater detail on page 10 of the PA and can be accessed at our website
http://www.commbank.com.au/about-us/shareholders/financial-information/results/
2

3
Agenda
Ralph Norris, CEO – Company Update and Outlook
David Craig, CFO – Financial Overview
Questions and Answers
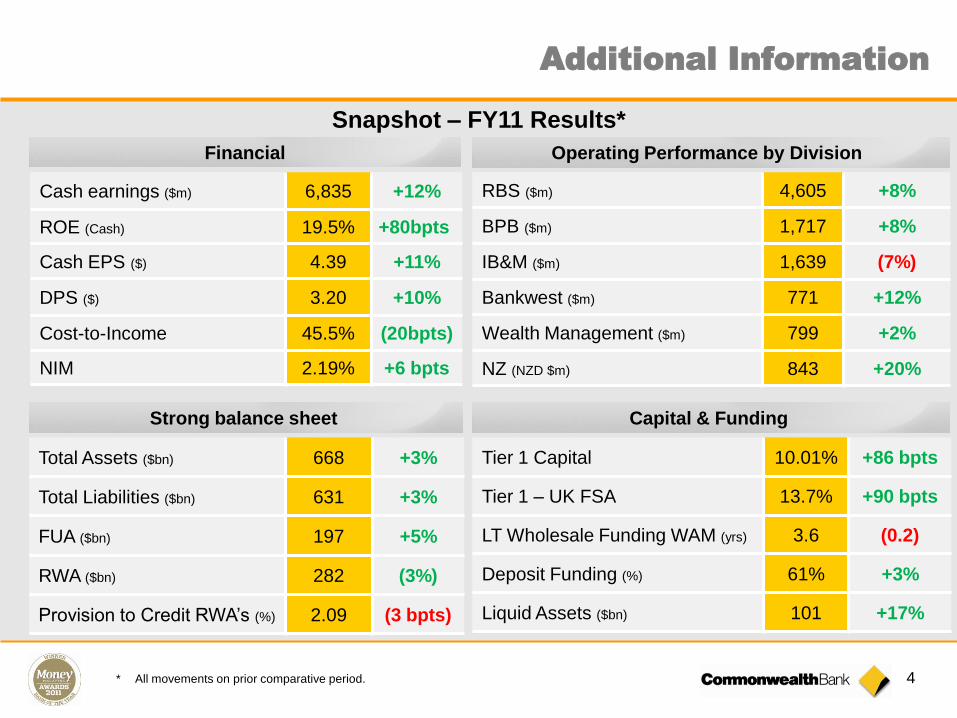
Cash earnings ($m) 6,835 +12%
ROE (Cash) 19.5% +80bpts
Cash EPS ($) 4.39 +11%
DPS ($) 3.20 +10%
Cost-to-Income 45.5% (20bpts)
NIM 2.19% +6 bpts
RBS ($m) 4,605 +8%
BPB ($m) 1,717 +8%
IB&M ($m) 1,639 (7%)
Bankwest ($m) 771 +12%
Wealth Management ($m) 799 +2%
NZ (NZD $m) 843 +20%
Total Assets ($bn) 668 +3%
Total Liabilities ($bn) 631 +3%
FUA ($bn) 197 +5%
RWA ($bn) 282 (3%)
Provision to Credit RWA‟s (%) 2.09 (3 bpts)
Tier 1 Capital 10.01% +86 bpts
Tier 1 – UK FSA 13.7% +90 bpts
LT Wholesale Funding WAM (yrs) 3.6 (0.2)
Deposit Funding (%) 61% +3%
Liquid Assets ($bn) 101 +17%
* All movements on prior comparative period.
Financial
Strong balance sheet Capital & Funding
Operating Performance by Division
4
Additional Information
Snapshot – FY11 Results*

5
Overview
A good result in a difficult year
Continued disciplined approach to execution of strategy underpins result
Strong financial position – capital, funding and provisions
Supporting our customers in uncertain times
Challenging year ahead

18.8%
21.5% 21.7%20.4%
15.8%
18.7%19.5%
2005 2006 2007 2008 2009 2010 2011
6
Return on Equity (Cash)
Additional Information

7
Jun 11 vs Jun 10
Cash NPAT ($m) 6,835 12%
Statutory NPAT ($m) 6,394 13%
ROE - Cash 19.5% +80bpts
Cash EPS ($) 4.39 11%
Dividend per Share ($) 3.20 10%
Another good financial result

Notes
8

9
Strategy delivering results
Customer Satisfaction
Gap to No. 1 closed from 12.5% to 3.6%
Highest products-per-customer of peer group*
No 1 in key Wealth & Business segments
Business Banking
Market share up from 12.1% to 18.1%
Significant improvement in satisfaction
CommBiz a leading online platform
Profitable Growth
Targeted Asian expansion
Bankwest acquisition
Trust &
Team Spirit
Strong staff engagement
Supporting communities in need
Technology &
Operational Excellence
Core Banking Modernisation
Market leading online platformsFavourable complaints profile
Cost-to-Income improvement
Australia’s
Finest Financial
Services
Organisation
Profit After Capital Charge & ROE focus
* Major banks

10
Notes

11
Customer Satisfaction
Products per customerRetail MFI Customer Satisfaction1
77.4%78.8%
64.9%
75.2%
Jun 06 Jun 11
Top Rated Peer CBA
1, 2 – Refer note slide at back of this presentation for source information
2
Avera
ge n
um
ber
of
pro
ducts
at
the F
inancia
l In
stitu
tion
2.64Major Banks
Rank
1st
Rank
4th
2.00
2.10
2.20
2.30
2.40
2.50
2.60
2.70
CBA Peer Average
2.08
Jun 07 Jun 09 Jun 11
Major Banks

Bank of the Year 2011
Credit Card Issuer of the Year
Banking Website of the Year
Margin Lender of the Year (CommSec)
Australian‟s Financial Institution of the Year – Major Bank
Chief Information Officer of the Year (Michael Harte)
Chief Risk Officer of the Year (Alden Toevs)
Innovative Mortgage Product of the Year (No Fee
Variable rate home loan)
Best Retail Bank in Australia
Best Retail Bank in Asia Pacific
Best consumer lending (personal loans)
Achievement Award, Cash Management in Australia
World‟s Best Banks in Developed Markets: Best
Bank in Australia
Australia‟s Best Foreign Exchange Provider
Best in Class, Banking (Projects.CBA Intranet)
Outstanding Achievement Award, Investor Relations
(Shareholder Centre)
eCommerce (eVolve iShop)
Banking (NetBank)
B2B (IB&M microsite)
Chief Financial Officer of the Year (David Craig)
Australian Issuer of the Year – Australian Bond
Market (Group Treasury)
Best Bank in Australia 2010
Best Private Bank for Super Affluent Clients
Best Private Bank for High Net Worth 1 Clients
Best Private Bank for Family Office Services
Outstanding Private Banking Institution of the Year
Service Excellence in the Financial and Insurance
Services
Product Innovation (Travel Money Card)
Five star rating, online share trading, CommSec
Five star rating, all deposit and transaction accounts
Innovation Award for the iPhone Property Guide app
Youth Banking and Education Award
Best Online Banking Australia Award
Best Fund Manager
Ranked No. 1 by advisers for overall platform
satisfaction (FirstWrap)
Service Excellence Award in the Large Business
category (Commonwealth Bank Group)
The Best Medium Business in NSW (CommInsure
General Insurance team)
Highly commended in the National Medium Business
category (CommInsure General Insurance team)
Customer Service Executive NSW (Fred Pollock, EGM,
Group Sales and Service)
Customer Service CEO of the Year (CEO Ralph Norris)
12
Additional Information
2011 Awards

13
Business Banking Growth Strategy
Investment delivering dividends:
Business Bankers in branches
Extended footprint
CommBiz
Supporting our business customers with
above system lending growth
Good momentum
Well positioned to continue to outperform
55.063.1
67.7
FY09 FY10 FY11
736 898
1,039
FY09 FY10 FY11
BPB Cash NPAT
7%15%
16%22%
$bn
$m
BPB
Interest Earning Assets

CommSec
15 yrs as the
market leading
online retail
broking platform
CommBiz
Secure, online
business and
corporate
banking
FirstChoice
Leading wealth
platform online
functionality
NetBank
Market leading
online/mobile
banking solution
14
Additional Information
Leading position,
leading platforms
CommSee
Single view of customer
Now integrated into
Core Banking for real
time banking 24x7

15
Core Banking – transformational change
Proof-of-
concept
“Steel-thread”
Capability
tested
Largest migration in
Australian banking
history
18 million customers
(53 million records)
migrated
Telling & NetBank
systems integrated
11 million
accounts migrated
Real time 24x7
banking
18,000 jobs
changed
Migration of
business
deposit and
transaction
accounts
Integration of
CommBiz
New capabilities
Migration of
lending
accounts
Next Phase;
2013+
Bankwest
2008 2009 2010 2011 2012
Pre-LaunchCustomer
Records
Retail
Deposits &
Transactions
Business
Deposits &
Transactions
Lending
Underway Next Step

212231
VIB contribution
included from
September 2010
Strong performance and
demand in First State
Investments Asia-Pacific
Equity Funds
PTBC branch/front
line expansion and
support
1. Total customers at institutions where CBA holds more than 50% equity. Excludes investments in CCB‟s, BoCommLife and VIB
2. Includes Asia region Cash NPAT from Business & Private Banking, Institutional Banking & Markets, Wealth Management
and IFS Asia businesses (excluding head office support costs, including head office funding costs).
3. Includes China, India and Japan IFS Asia businesses
160,000
189,000
239,000
Jun 09 Jun 10 Jun 11
+50%
Customer Numbers Cash NPAT
(proprietary)
FY10 Vietnam Indonesia Other Wealth
Management
IB&M
and BPB
FY113
+9%
$m
1
2
Strong Hangzhou result
offset by strengthening AUD
and investment in County
Banks and BoCommLife
16
Additional Information
CBA in Asia – strong growth
IFS Asia +18%

17
Beijing
Jinan
Shanghai
Hangzhou
Mumbai
Ho Chi Minh City
Jakarta
Hanoi
Hong Kong
CBA in Asia
HenanTokyoOpened 3 County
Banks in Henan
Province
Another 10 PTBC
branches opened
Mumbai branch
opened
Acquired 15%
stake in VIB
Country Representation
China Bank of Hangzhou (20%) – 107 branches
Qilu Bank (20%) – 81 branches
County Banking (84%) – 3 Banks
Beijing Representative Office
BoCommLife JV (37.5%)
Shanghai (China Head Office)
First State Cinda JV, FSI Hong Kong
Hong Kong and Shanghai branches
Indonesia PTBC (97.86%) – 84 branches
PT Commonwealth Life (80%) – 24 branches
First State Investments
Vietnam VIB (15%) – 136 branches
CBA Branch Ho Chi Minh City
Hanoi Representative Office
India CBA branch, Mumbai
Japan CBA branch, Tokyo, FSI Tokyo
Singapore CBA Branch, First State Investments
New developments
in FY11
Singapore
Shenzhen
Additional Information
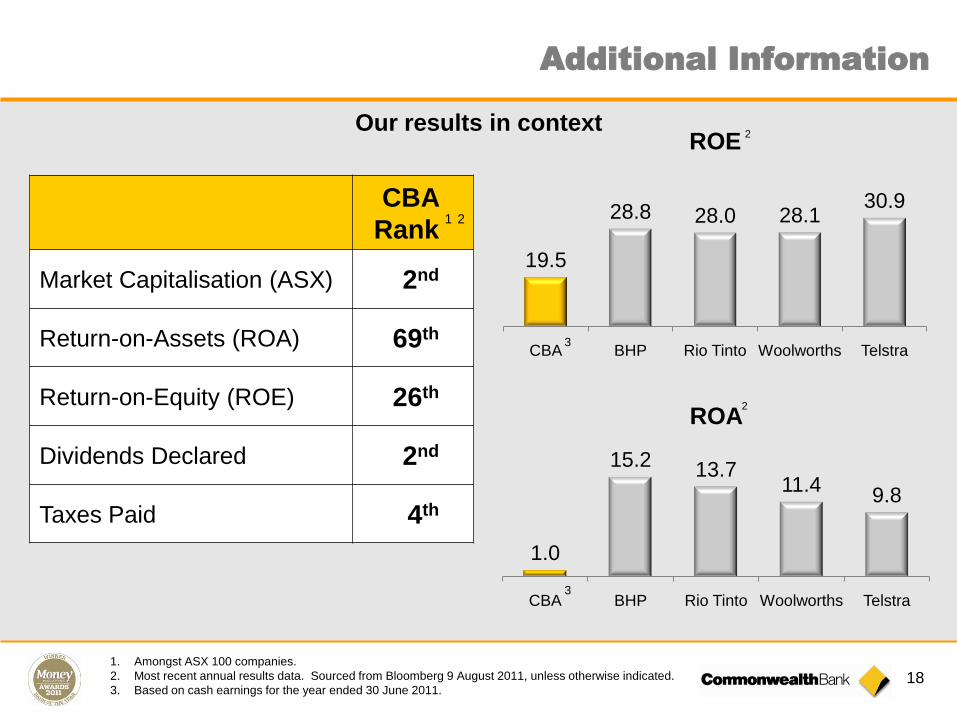
CBA
Rank
Market Capitalisation (ASX) 2nd
Return-on-Assets (ROA) 69th
Return-on-Equity (ROE) 26th
Dividends Declared 2nd
Taxes Paid 4th
1. Amongst ASX 100 companies.
2. Most recent annual results data. Sourced from Bloomberg 9 August 2011, unless otherwise indicated.
3. Based on cash earnings for the year ended 30 June 2011.
19.5
28.8 28.0 28.130.9
CBA BHP Rio Tinto Woolworths Telstra
ROE2
3
1.0
15.2 13.711.4
9.8
CBA BHP Rio Tinto Woolworths Telstra
ROA2
3
18
Our results in context
1 2

19
Transformational change - scorecard
1
5
1, 2, 3, 4 – Refer note slide at back of this presentation for source information5 Source RBA/APRA. June 2006 market shares do not include Bankwest6 Major banks
4
2
Jun 06
6
Jun 11
Progress
3
Customer Satisfaction
Retail 64.9% 75.2%
Business - DBM n/a Ranked equal 2nd
FirstChoice Ranked 2nd Ranked 1st
Market Shares
Home Lending 18.7% 25.7%
Business Lending 12.1% 18.1%
Household Deposits 29.3% 30.0%
Business Deposits 11.9% 21.2%
Products per Customer 2.17 2.64
System Reliability – Sev. 1 incidents pa 66 10
Employee Engagement – Percentile 69th 73rd
Total Shareholder Return – RankingRanked 1st
( 2, 3, 4, 5yrs)

Driver FY12 Outlook
System
Credit Growth*
► Total Credit: 3-5%
► Housing Credit: 4-6%
► Business Credit: 2-4%
Margins► Elevated funding costs
► Many variables – specific outlook hard to predict
Other Banking Income ► Likely subdued overall growth
Funds Management
Income► Leverage to equity market performance
Costs► Continued cost discipline + investing in the business
► Inflationary pressures
Impairment Expense ► Stabilising
* CBA Economists forecasts 20
Additional Information
Key Earnings Drivers
21
Outlook
A challenging environment:
Fragile consumer and business confidence
Political and regulatory uncertainty
International instability
Subdued system credit growth
Intense competition
Continuation of our disciplined approach in FY12, with focus on:
Productivity improvements
Maintaining superior shareholder returns

22
Notes

23
Strength in uncertain times
Strong capital and funding,
conservative provisioning
Strong operating performance
and industry leading ROE
Solid returns to shareholders
and strong dividend growth
Supporting our customers – over
$90 billion in new lending in 2011
Supporting the wider community
Where does net income go?
FY11
Expenses
Taxes Paid
SalariesRetained
for growth
4.0
5.0
4.91.8
3.0
1.3
Loan
Impairment
Dividends
Employing
52,000 people
Serving
11 million
Australians
Australia‟s 4th
largest tax
payer
Over $90
billion in new
lending in
FY1173% of profit
returned to
800,000
shareholders
$bn

24
Notes

Commonwealth Bank of Australia ACN 123 123 124
Results PresentationFor the half year ended 31 December 2009
10 February 2010
Results PresentationFOR THE FULL YEAR ENDED 30 JUNE 2011
DETERMINED TO BE BETTER THAN WE‟VE EVER BEEN.
David Craig
Chief Financial Officer
10 AUGUST 2011 | COMMONWEALTH BANK OF AUSTRALIA | ACN 123 123 124

26
Notes

27
Good profit growth
Jun 11
$m
Jun 10
$m
Jun 11 vs
Jun 10
Operating income 19,538 18,823 4%
Operating expenses (8,891) (8,601) 3%
Operating performance 10,647 10,222 4%
Investment experience 121 236 (49%)
Impairment expense (1,280) (2,075) (38%)
Tax and non-controlling interest (2,653) (2,282) 16%
Cash NPAT 6,835 6,101 12%

Hedging and IFRS volatility
Unrealised accounting gains and losses arising
from the application of “AASB 139 Financial
Instruments: Recognition and Measurement”
(22) (44)
(7) (23)
(29) (67)
Jun 11
$m
Jun 10
$m
Bankwest
Merger related amortisation
Integration expenses
Impairment charge
(265) 17
(81) 25
(66) (29)
- (212)
(147) (216)
Other
Treasury shares adjustment
Sale of controlled entities/investments
NZ tax expense
Tax on NZ structured finance transactions - (171)
28
Additional Information
Non-cash items

29
Statutory Profit
Jun 11
$m
Jun 10
$m
Cash NPAT 6,835 6,101
Bankwest non-cash items (147) (216)
Hedging and IFRS volatility (265) 17
NZ tax expense - (171)
Other non-cash items (29) (67)
Statutory NPAT 6,394 5,664
12%
13%

FY11
$m
FY10
$m
Jun 11
vs Jun 10
Commissions 1,946 2,006 (3%)
Lending Fees 1,467 1,435 2%
Other 351 333 5%
Sub-total 3,764 3,774 -
Trading Income 717 597 20%
IFRS reclassification
of net swap costs(498) (259) (92%)
Total 3,983 4,112 (3%)
1,4681,286
1,410 1,433 1,475 1,422
Dec 08 Jun 09 Dec 09 Jun 10 Dec 10 Jun 11
Funds & Insurance Income
$m
442
293 291 306
426
291
Dec 08 Jun 09 Dec 09 Jun 10 Dec 10 Jun 11
Trading Income
$m
Funds Insurance
30
Additional Information
Other Banking Income

31
Operating Income up 4%
Funds &
Insurance
+4%
Other Banking
Income
Net Interest
Income
FY 10 FY 11
19,538 Average FUA balances 5%
Insurance Income 9%
$m
Commissions, Fees, Other ($10m) flat
Trading Income $120m 20%
IFRS hedging reclassification ($239m)
1 Change in mix on Treasury earnings (OBI v‟s NII). In the prior period, RBA rate tightening resulted in a
negative mark-to-market position in the Treasury trading book – with offsetting gains on interest rate
swaps accounted for in Net Interest Income.
Volume $477m 4%
Margin $92m 1%
IFRS hedging reclassification $239m 2%
18,823
+7%
(3%)
+2%
1

Jun 07 Dec 07 Jun 08 Dec 08 Jun 09 Dec 09 Jun 10 Dec 10 Jun 11
* Long term and short term. Includes basis risk
Change in Funding costs since June 2007
Increased
funding
cost
+1.31%
+1.54%
x 61%
+0.94%
x 39%
Wholesale
Funding*
Deposit
Funding
224
213 211
221
Australia NIM
IFRS
229
218 219
231
Dec 09 Jun 10 Dec 10 Jun 11
Underlying
32
Additional Information

33
Group NIM
bpts
213
203 204
215
6 month movement
218
208
212
225
+2bpts
208 210 210
5 (2)(4)
3
4
Assets
& mix
Deposits* IFRS
Hedging
Volatility
FY11FY10 Treasury
and
Other
Group
Underlying
New
Zealand
* Includes Replicating Portfolio
IFRSUnderlying
Dec 09 Jun 10 Dec 10 Jun 11
219
215
IFRSUnderlying
213
12 month movement

34
Additional Information
Continuing to invest
Investment Spend Investment Spend Profile
258405
697 626 693
527
615
378410
486
FY07 FY08 FY09 FY10 FY11
785
1,0201,075 1,036
$m 1,179
CapitalisedExpensed
% of Total Investment Spend
Risk /
compliance
Branch
refurbishment
Core
Banking
Other
Productivity
& Growth
10%
13%
42%
30%
5%

35
Continued cost discipline
8,601 8,815 8,891
271 (57) 76
FY11FY10 BAU
Staff Expense
Investment
$m
+1%
BAU
Other
Includes salary
increases of 4%
+2%

1,066927 920
1,108969
43162 116
139177
620 733956
922979
1,7291,822
1,992
2,169
Jun 09 Dec 09 Jun 10 Dec 10
Individual Provisions ($m)
Jun 11
2,125
Bankwest
Consumer
Commercial
Total and New Impaired Assets to GLATotal and New Impaired Assets to GLA
Jun 09 Dec 09 Jun 10 Dec 10 Jun 11
bpts
3540 34
CBA (Including ASB) Bankwest NewCBA (Including ASB) Bankwest New
28
58
$4,210m
61
$4,823m
62
$5,216m
3
102
86 96102
$5,184m
51 49 4640
68
34
102
68
45
$5,297m
1 Includes defaulted / well secured exposures and exposures where there is a potential for default within ~ 12
months if a sustained improvement in financial performance is not achieved within the short term. Does not
include impaired exposures.
2 As a percentage of total commercial exposures.
3 As a percentage of Gross Loans and Advances.
36
2.94.5 4.9 5.5 5.7 4.9 4.5
1.01.3
1.72.8
2.82.3
Jun 08 Dec 08 Jun 09 Dec 09 Jun 10 Dec 10 Jun 11
CBA (including ASB) Bankwest
$bn
bpts 2 101 166 197 238 275 248
Troublesome Exposures 1
241
6.87.7
8.5
7.26.2
5.5
2.9
Additional Information

37
Credit Quality
1 Includes ASB and Bankwest from December 08. December 08 includes Bankwest on a pro forma basis.
Basis points as a percentage of average Gross Loans and Acceptances
Commercial
Jun 11 vs
Dec 10
$m
Economic overlay
strengthened+50
Lower modelled
outcome as credit
quality improves(36)
Amortisation of
BWA fair value
provision(42)
Flood and other
overlays utilised(134)
Total (162)681 630 588
830 782 808
758704 598
Jun 11
3,461
Jun 10 Dec 10
3,327
3,043
1,1921,211
1,049
Consumer Bankwest Overlay
1519
32
85
6155
28 24
Jun 07 Dec 07 Jun 08 Dec 08 Jun 09 Dec 09 Jun 10 Stat
Dec 10 Jun 11
40
2228
pro forma
Review of Bankwest pre acquisition business book
Flood /earthquake related overlay
4
Loan Impairment Expense to Gross Loans Collective Provisions1
$mSix months annualised
(basis points)

$m
Operating
Performance
Impairment
Expense
Investment
Experience
Tax & non-
controlling
interests
Cash
NPAT
Jun 11
Cash
NPAT
Jun 10
Mvt
Cash
NPAT
Mvt
Operating
Performance
RBS 4,605 (558) - (1,202) 2,845 2,461 16% 8%
BPB 1,717 (261) - (417) 1,039 898 16% 8%
IB&M 1,639 (324) - (311) 1,004 1,173 (14%) (7%)
WM 799 - 83 (240) 642 718 (11%) -
NZ 673 (54) 1 (150) 470 388 21% 15%
Bankwest 771 (109) - (199) 463 (45) Large 12%
Other 443 26 37 (134) 372 508 (27%) (18%)
Total 10,647 (1,280) 121 (2,653) 6,835 6,101 12% 4%
1 Comparatives include the St Andrew‟s insurance business which was sold effective 1 July 2010.
2 NZ in AUD
3 Includes Group Treasury, Centre functions, Asia
2
3
38
Additional Information
Business unit profitability
1

39
4,605
1,717 1,639799 843 771
RBS BPB IB&M WM NZ Bankwest
Business unit operating performance
+8%
(7%)+8%
+20%+2% +12%
1 Operating revenue less operating expense. All movements on prior comparative period
2 NZ result in NZD
3 Comparatives excluding the St Andrew‟s insurance business which was sold effective 1 July 2010.
1
Deposit balances 8%
Cost:Income now <39%
Cash NPAT 16%
Income 5%
Markets income 11%
Costs flat
Income 5%
Costs 1%
Cash NPAT $463m
FUA 5%
Income 5%
GAM Income 14%
Income 15%
Margins stronger
Cash NPAT 28%
Lending growth > system
Costs 3%
Cash NPAT 16%
2
3

Jun 11
$m
Jun 11 vs
Jun 10
Home loans 2,893 20%
Consumer finance 1,700 9%
Retail deposits 2,609 (7%)
Distribution 306 11%
Total banking income 7,508 7%
Operating expenses (2,903) 4%
Operating performance 4,605 8%
Impairment expense (558) (24%)
Tax (1,202) 13%
Cash net profit after tax 2,845 16%
10%
12%
14%
16%
18%
20%
22%
24%
26%
28%
Jun-0
7
Sep-0
7
Dec-0
7
Mar-
08
Jun-0
8
Sep-0
8
Dec-0
8
Mar-
09
Jun-0
9
Sep-0
9
Dec-0
9
Mar-
10
Jun-1
0
Sep-1
0
Dec-1
0
Mar-
11
Jun-1
1
CBA ANZ NAB WBC
Home Loan Market Share
Source : RBA/APRA
Bankwest
acquisition
St George
acquisition
40
Additional Information
Retail Banking
Services

41
RBS MarginFY11 Operating Performance
Retail Banking Services
Source : RBA/APRA
269256
239 234 233219 223
239
1H06 1H07 1H08 1H09 1H10 1H112H10 2H11
NIM recovering but still below pre-GFC levels
1310
8 8
6
11
15
20
11
4
2007 2008 2009 2010 2011
System CBA
Year to June
20%
9%
(7%)
Home
Loan
Consumer
Finance
Retail
Deposits
7%
4%
8%
Income Costs Operating
Performance
Income
RBS Home Loan Balance Growth MFI Customer Numbers
June 2011
CBA (incl BWA)
+0.2%
WBC (incl SGB)
-0.2%NAB
+0.5%
ANZ
flat
Other
-0.5%
bpts
Movement on
June 2010
1
33.2%
20.3%10.4%
13.5%
22.6%
1. Source: Roy Morgan Research. Australians 14+, Proportion of Banking and Finance MFI Customers
that nominated each bank as their Main Financial Institution, 12 months to June 2011 and 2010.
%

42
Notes
43
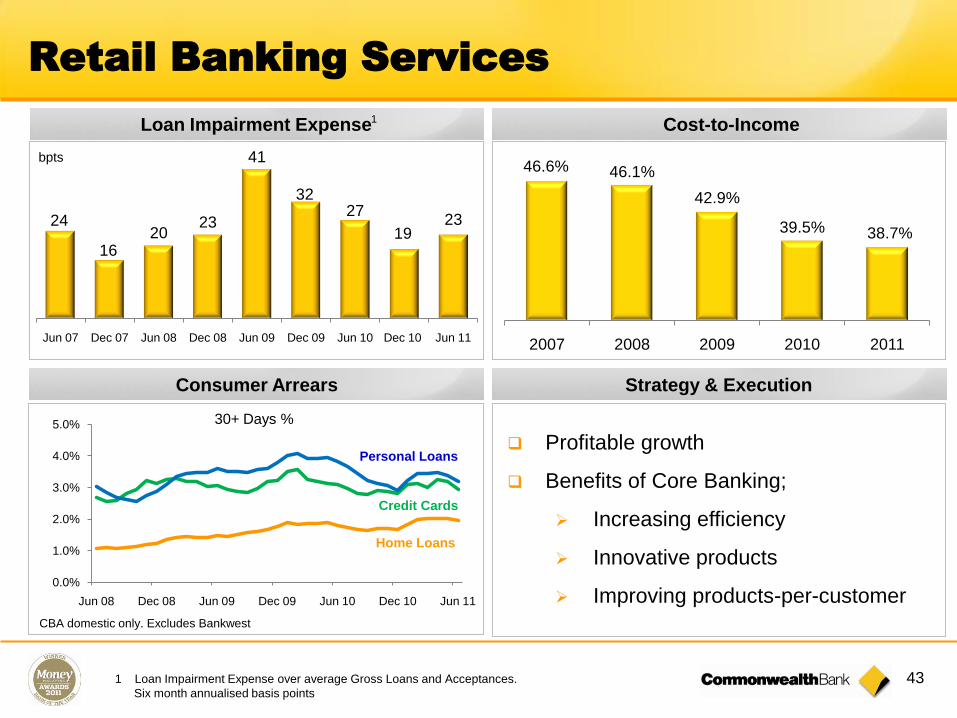
Retail Banking Services
Strategy & Execution
Cost-to-Income
46.6% 46.1%
42.9%
39.5% 38.7%
2007 2008 2009 2010 2011
Profitable growth
Benefits of Core Banking;
Increasing efficiency
Innovative products
Improving products-per-customer
Home Loans
Credit Cards
Personal Loans
CBA domestic only. Excludes Bankwest
30+ Days %
24
1620
23
41
3227
1923
Jun 07 Dec 07 Jun 08 Dec 08 Jun 09 Dec 09 Jun 10 Dec 10 Jun 11
Loan Impairment Expense
bpts
Consumer Arrears
1
1 Loan Impairment Expense over average Gross Loans and Acceptances.
Six month annualised basis points
0.0%
1.0%
2.0%
3.0%
4.0%
5.0%
Jun 08 Dec 08 Jun 09 Dec 09 Jun 10 Dec 10 Jun 11
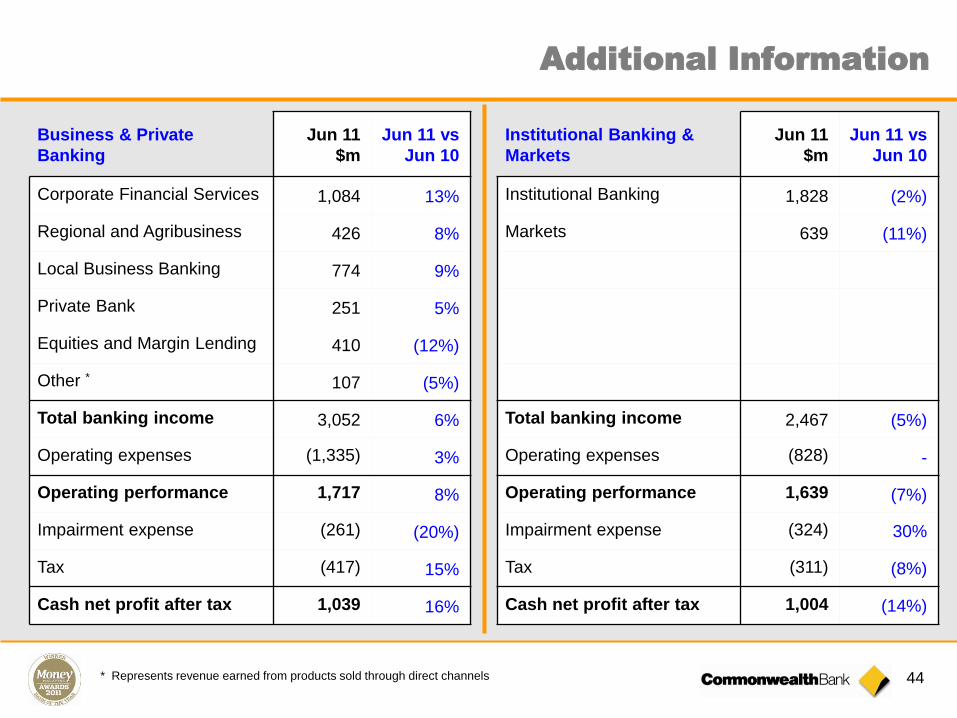
Business & Private
Banking
Jun 11
$m
Jun 11 vs
Jun 10
Corporate Financial Services 1,084 13%
Regional and Agribusiness 426 8%
Local Business Banking 774 9%
Private Bank 251 5%
Equities and Margin Lending 410 (12%)
Other * 107 (5%)
Total banking income 3,052 6%
Operating expenses (1,335) 3%
Operating performance 1,717 8%
Impairment expense (261) (20%)
Tax (417) 15%
Cash net profit after tax 1,039 16%
* Represents revenue earned from products sold through direct channels
Institutional Banking &
Markets
Jun 11
$m
Jun 11 vs
Jun 10
Institutional Banking 1,828 (2%)
Markets 639 (11%)
Total banking income 2,467 (5%)
Operating expenses (828) -
Operating performance 1,639 (7%)
Impairment expense (324) 30%
Tax (311) (8%)
Cash net profit after tax 1,004 (14%)
44
Additional Information

45
FY11 Operating Performance – IB&M
Corporate
13%
8% 9%
5%
CFS RAB LBB Private
Bank
Equities
& ML
6%3%
8%
Income Costs Operating
Performance
(2%)
Institutional
Banking
Markets
(5%)
0%
(7%)
Income Costs
bpts
4.7
(3.3%)
(21.8%)
8.0%
(3.8%)
2.1%
BPB BWA
de-riskingCBA
Group
System
Operating
Performance
Income
FY11 Operating Performance – BPB FY11 Business Lending Growth
NIM
145 145
172186 188
FY07 FY08 FY09 FY10 FY11
IB&M
Income
1
1 Combined Institutional Banking and Markets and Business and Private Banking.
Includes Markets income, excludes all line fees and commitment fees on loans & Commercial Bills
BWA new
business
Bankwest total (13.8%)
(12%)
(11%)

46
Notes
47
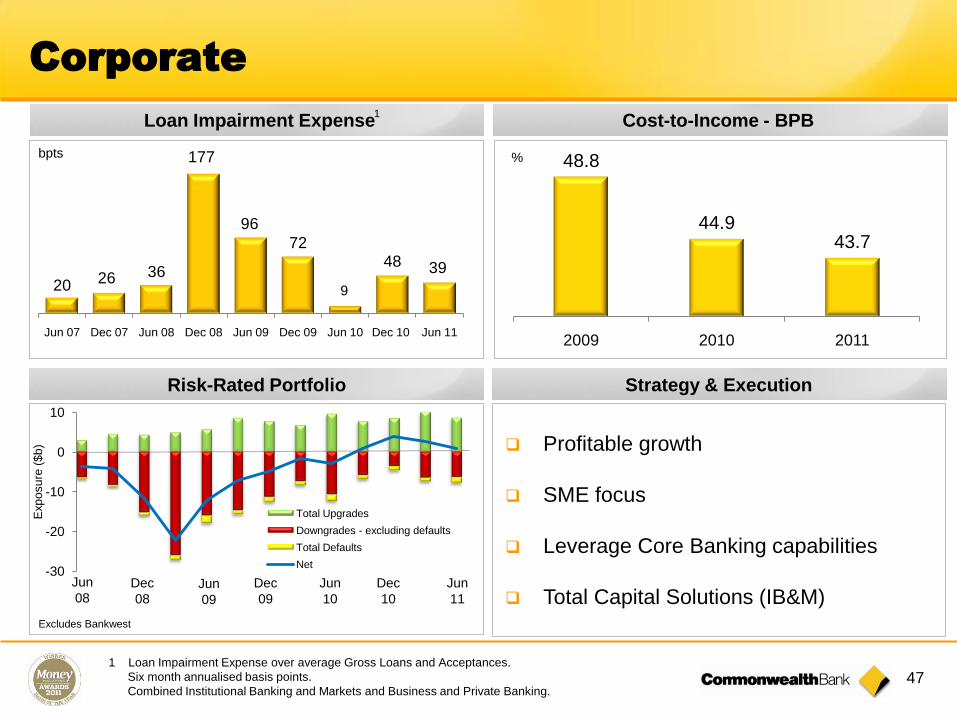
Corporate
Profitable growth
SME focus
Leverage Core Banking capabilities
Total Capital Solutions (IB&M)
48.8
44.943.7
2009 2010 2011
%
Risk-Rated Portfolio
Loan Impairment Expense
20 26 36
96
7248
Jun 07 Dec 07 Jun 08 Dec 08 Jun 09 Dec 09 Jun 10 Dec 10 Jun 11
bpts
9
177
Exp
osu
re (
$b
)
Dec
08
Dec
09
Jun
10
Dec
10
Jun
08Jun
11
-30
-20
-10
0
10
Total Upgrades
Downgrades - excluding defaults
Total Defaults
Net
Jun
09
Excludes Bankwest
39
Cost-to-Income - BPB1
Strategy & Execution
1 Loan Impairment Expense over average Gross Loans and Acceptances.
Six month annualised basis points.
Combined Institutional Banking and Markets and Business and Private Banking.

Jun 11
$m
Jun 11 vs
Jun 10*
CFSGAM 756 14%
Colonial First State 689 6%
CommInsure 635 (5%)
Other (1) 67%
Net operating income 2,079 5%
Operating expenses (1,280) 7%
Tax (218) 6%
Underlying profit after tax 581-
Investment experience 61 (50%)
Cash net profit after tax 642 (9%)
* Comparatives excluding the St Andrew‟s insurance business which was sold
effective 1 July 2010
48
Additional Information
Wealth Management

49
Wealth Management
Quarterly Net Flows
FY11 Operating Performance FirstChoice net flows strong
Strong investment performance – 5 years
$m
872
513603
440
940
Jun 10 Sep 10 Dec 10 Mar 11 Jun 11
100%100%
33%
71%
100%
50%40%
67%
100%
67%
0%
83%
Domestic
Equities
Global
Resources
Property
Securities
Fixed
InterestCash Infra
structure
Unlisted
Property
Listed
PropertyGEM/AP Global
Equities
Infra
securities
Average
Number of funds in each asset class outperforming benchmark
CFSGAM
Capitalise on global growth opportunities (now
54% of income) and enhance domestic business
Colonial First State
Profitable growth with aligned cost management
CommInsure
Improving service and streamlining processes
Strategy & Execution
14%
6%
(5%)
5%7%
2%
CFSGAM CFS CommInsure Income Costs Operating
Performance
Income

$bn
1 Maturity profile includes all long term wholesale debt. Weighted Average Maturities of 3.6 years includes all deals with first call or maturity of 12 months or greater.
2 Weighted Average Maturity. Includes all deals with first call or contractual maturity of 12 months or greater.3 Percentage of funding excluding equity; no netting of excess liquid assets
Weighted Average Maturity 3.6yrs
4.45.0
4.43.93.7 3.8 3.6 3.6
Dec 09 Jun 10 Dec 10 Jun 11
New Issuance Portfolio
Years
$bn
3
297 305 324 336 349
56% 56%58% 60% 61%
Jun 09 Dec 09 Jun 10 Dec 10 Jun 11
Customer Deposits % of funding
Funding tenor2Term maturity profile1
Customer Deposit Funding
2215 12 14 12 16
7
6 145
2012 2013 2014 2015 2016 >2016FY
Long Term Wholesale Debt Government Guaranteed
Recent Issuance
50
Additional Information
-5
10 15 20 25 30 35 40
Dec 09 Jun 10 Dec 10 Jun 11
Domestic Offshore Private Offshore Public
Note: Dec 09 Issuance includes A$0.4bn Domestic GG Bonds, A$8.6bn Offshore
GG Bonds and A$2bn PERLS 5
$bnSix-Monthly

51
Deposit funded
Funded
assets
Jun 10
Funded
assets
Jun 11
Wholesale
Funding
Deposits
1 Funded assets includes securitisation, bank acceptances of customers and accounting gross-ups
2 Adjusted from prior period disclosures to include offshore branch liquid assets and exclude the Interbank
Deposit Agreement
Short term Long term
$bn
593
617606
26 4 (8)2 (11)
Total
funded
assets
IFRS &
FX on
debt issues
61% Deposit
Funded
Equity
61%19%
4%
13%
2% 1%
Regulatory
Minimum
$53bn19
31
26
30
41
40
Jun 10 Jun 11
86
101$bn
Internal RMBS
Bank, NCD, Bills, RMBS, Supra
Cash, Govt, Semi-Govt
Liquid Assets
Customer Deposits
LT Wholesale maturing
<12 months
RMBS
ST Wholesale Funding
LT Wholesale maturing >
=12 months
Hybrids
1
2

52
Notes

53
9.15%9.71% 0.38% (0.08%) 10.01%
13.7%
Strong capital position
Tier 1 Capital movement
Customer Deposit FundingBasel III Common Equity Ratio
Dec 10 Organic
growth
Tier 1 Capital 10.01%
UK FSA equivalent of 13.7%
Well placed for Basel III:
Strong organic growth
Global Harmonisation estimate
of 9.6% Common Equity
APRA due to release Basel III
details mid August
7.7% (0.6%)
Jun 11 Basel III
Estimated
Global
Harmonisation
Basel III
Additional
Requirements
Jun 11 Jun 11
UK FSA
Other
Min
Target
4.5%
Buffer
2.5%
Basel III
Minimum
Basel III
Full
Alignment
7%
1 Other includes some one off movements including increase in deferred tax assets and capitalised software
costs, partially offset by decrease in IRRBB RWA .
2 Downsides include impact of expected loss moving to 100% Common Equity deduction and increase in
RWA (credit, securitisation and market risk).
3 Upsides include removal of minimum floors on LGD mortgages, IRRBB and dividends.
9.6%2.5%
2 3
1Jun 10

Cash earnings ($m) 6,835 +12%
ROE (Cash) 19.5% +80bpts
Cash EPS ($) 4.39 +11%
DPS ($) 3.20 +10%
Cost-to-Income 45.5% (20bpts)
NIM 2.19% + 6 bpts
RBS ($m) 2,845 +16%
BPB ($m) 1,039 +16%
IB&M ($m) 1,004 (14%)
Bankwest ($m) 463 Large
Wealth Management ($m) 642 (11%)
NZ (NZD $m) 588 28%
Total Assets ($bn) 668 +3%
Total Liabilities ($bn) 631 +3%
FUA ($bn) 197 +5%
RWA ($bn) 282 (3%)
Provision to Credit RWA‟s (%) 2.09 (3 bpts)
Tier 1 Capital 10.01% +86 bpts
Tier 1 – UK FSA 13.7% +90 bpts
LT Wholesale Funding WAM (yrs) 3.6 (0.2)
Deposit Funding (%) 61% +3%
Liquid Assets ($bn) 101 +17%
* All movements on prior comparative period.
Financial
Strong Balance Sheet Capital & Funding
Cash NPAT by Division
54
Additional Information
Snapshot – FY11 Results*

55
Strong capital and funding positions Impairment expense lower
Margins recoveringA good profit result
Profitable growth, well placed
224213 211
221
Dec 09 Jun 10 Dec 10 Jun 11
9.15%
10.01%
Tier 1 Deposit Funding
6,1016,835
Cash NPAT
+12%
4%
2%
3%
Investment
Jun 10 Jun 11
FY10 FY11 Income Expenses
$m
Australia NIM
(ex IFRS)
bpts
58%
61%3,392
2,075
1,280
FY10
Cash earnings
FY09
Pro forma
FY11
$m
Jun 10 Jun 11
FY11
Positive “Jaws”
Commonwealth Bank of Australia ACN 123 123 124
Results PresentationFor the half year ended 31 December 2009
10 February 2010
Results PresentationFOR THE FULL YEAR ENDED 30 JUNE 2011
DETERMINED TO BE BETTER THAN WE‟VE EVER BEEN.
10 AUGUST 2011 | COMMONWEALTH BANK OF AUSTRALIA | ACN 123 123 124
Supplementary Slides

57
Index
Strategy 57
Business Performance 63
Risk and Credit Quality 86
Capital, Funding & Liquidity 104
Economic Indicators 114
Housing 129

58
CBA Overview
Largest Australian Bank by market cap. and 2nd largest listed company
AA Credit Rating
Tier 1 Capital Ratio of 10.01%; or 13.7% on UK FSA basis
Total Assets of $668bn
13 million customers; large distribution footprint
#1 in household deposits – 30% share
#1 in home lending ~26% share
#1 FirstChoice platform ~11% share

59
Sources of growth
Core Banking – efficiency improvement, enhanced customer satisfaction
Business Banking Growth Strategy – well-placed for upturn in system growth
Peer leading products-per-customer
Wealth Management – exposure to eventual rebound in equity markets
Targeted Asian growth strategy
ROE and PACC focus – not chasing volume for volume‟s sake
Strong track record of ongoing efficiency gains
Bankwest – exposure to fast growing sectors of the economy
60
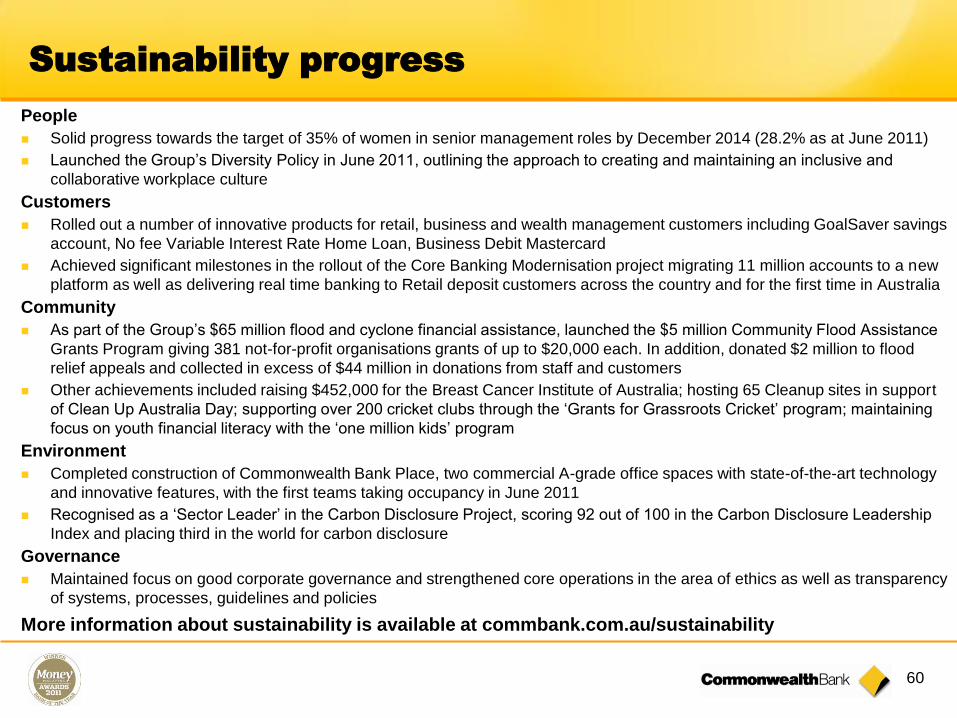
People
Solid progress towards the target of 35% of women in senior management roles by December 2014 (28.2% as at June 2011)
Launched the Group‟s Diversity Policy in June 2011, outlining the approach to creating and maintaining an inclusive and
collaborative workplace culture
Customers
Rolled out a number of innovative products for retail, business and wealth management customers including GoalSaver savings
account, No fee Variable Interest Rate Home Loan, Business Debit Mastercard
Achieved significant milestones in the rollout of the Core Banking Modernisation project migrating 11 million accounts to a new
platform as well as delivering real time banking to Retail deposit customers across the country and for the first time in Australia
Community
As part of the Group‟s $65 million flood and cyclone financial assistance, launched the $5 million Community Flood Assistance
Grants Program giving 381 not-for-profit organisations grants of up to $20,000 each. In addition, donated $2 million to flood
relief appeals and collected in excess of $44 million in donations from staff and customers
Other achievements included raising $452,000 for the Breast Cancer Institute of Australia; hosting 65 Cleanup sites in support
of Clean Up Australia Day; supporting over 200 cricket clubs through the „Grants for Grassroots Cricket‟ program; maintaining
focus on youth financial literacy with the „one million kids‟ program
Environment
Completed construction of Commonwealth Bank Place, two commercial A-grade office spaces with state-of-the-art technology
and innovative features, with the first teams taking occupancy in June 2011
Recognised as a „Sector Leader‟ in the Carbon Disclosure Project, scoring 92 out of 100 in the Carbon Disclosure Leadership
Index and placing third in the world for carbon disclosure
Governance
Maintained focus on good corporate governance and strengthened core operations in the area of ethics as well as transparency
of systems, processes, guidelines and policies
Sustainability progress
More information about sustainability is available at commbank.com.au/sustainability

61
Sustainability scorecard
Metric 2011 2010 2009 2008
Customers
Customer satisfaction Roy Morgan MFI retail customer satisfaction % (1)
(6-month moving average)
75.2(ranked 4th )
75.6(ranked 2nd)
73.0(ranked 3rd)
70.1(ranked equal
3rd)
Customer satisfaction DBM Business Financial Services Monitor (2)
(6-month moving average)
7.1(ranked equal 2nd)
7.0(ranked equal 1st) - -
Customer satisfaction Wealth Insights Platform Service Level Survey % 84.7(ranked 1st)
86.5(ranked 1st)
84.1(ranked 1st)
88.2(ranked 1st)
People
Safety Lost Time Injury Frequency Rate (LTIFR) (3) 1.9 2.9 2.4 3.1
Staff satisfaction Gallup Survey GrandMean4.30(73rd
percentile)
4.32(76th
percentile)
4.37(80th
percentile)
4.28(78th
percentile)
Absenteeism Average days per FTE (4) 6.0 5.9 5.9 6.5
Employee Turnover Voluntary % 12.65 12.73 11.37 18.45
Environmental
Carbon emissions Property and fleet emissions (tonnes CO2-e) (5) 172,087 176,806 172,752 173,397
Complete definitions for scorecard metrics are available at www.commbank.com.au/sustainability
(1) Retail MFI Customer Satisfaction – Roy Morgan Research. Australian Population 14+, % “Very Satisfied” or “Fairly Satisfied” with relationship with that Main Financial Institution. 6 month
rolling averages to June. Competitor set changed in 2010/11 to reflect the four major banks, rank adjustments have been applied historically.
(2) Business customer satisfaction measured by DBM Business Financial Services Monitor from August 2010 (previously monitored by TNS).
(3) 2010 figure previously reported has been adjusted based on additional data on incidents that occurred during the year.
(4) Absenteeism is reported a month in arrears.
(5) Due to the electricity billing cycle, 26% of the 2010-11 electricity data was estimated to meet publication deadlines.

62
Core Banking Modernisation
Enhanced Customer Experience
Greater Efficiency
Improved Risk Management
Industrialisation
Future Proofing
Real-time banking, 24x7
Instant account opening
Customised product offers
Straight through processing
Faster speed-to-market
Lower cost-to-income
Greater system reliability
Less manual re-work & errors
“Bank of the Future”
Greater flexibility
Separate distribution/manufacturing
Broader growth opportunities

63
Index
Strategy 57
Business Performance 63
Risk and Credit Quality 86
Capital, Funding & Liquidity 104
Economic Indicators 114
Housing 129

64
Return on Assets
Cash NPAT ($bn)
Assets ($bn)
Group ROA (%)
1.1%
1.0%

65
Dividends per Share
2007 2008 2009 2010 2011
62%
63%84%63%
84%
74%
87%Payout Ratio
61%
Interim
Final
88%
cents 107 113 113 120 132149 153 115 170
84%
188

66
219
205
198
216 218
208212
Jun 06 Jun 07 Jun 08 Jun 09 Dec 09 Jun 10 Dec 10 Jun 11
Margins – Six Monthly
NIM decline as GFC
drives term funding
costs higher
NIM recovery as pricing
adjusted for higher
funding costs and
increased risk
Asset re-pricing
for higher
funding costs
Group NIM (six-month periods)
bpts
IFRS
NIM under
pressure from
higher funding
costs
218
200193
211
213
203 204215
225
Underlying

67
203 204
215 215
208212 7
3 1
2232 225
Group Margin – Six Month Movement
Assets &
Mix
Sub-totalNew
Zealand
2H10 1H11 Bankwest IFRS
Volatility
2H11
bpts
IFRS Underlying

68
RBS – 6 month periods
Jun 11 Dec 10 Jun 10
Jun 11 vs
Jun 10
(6 months)
Net interest income Home loans 1,441 1,265 1,122 28%
Consumer finance 660 621 594 11%
Retail deposits 1,115 1,107 1,092 2%
3,216 2,993 2,808 15%
Other banking income Home loans 87 100 93 (6%)
Consumer finance 204 215 205 (0%)
Retail deposits 187 200 209 (11%)
Distribution 157 149 158 (1%)
635 664 665 (5%)
Total banking income Home loans 1,528 1,365 1,215 26%
Consumer finance 864 836 799 8%
Retail deposits 1,302 1,307 1,301 0%
Distribution 157 149 158 (1%)
3,851 3,657 3,473 11%Operating expenses (1,486) (1,417) (1,406) 6%Impairment expense (305) (253) (345) (12%)Expense to income 38.6% 38.7% 40.5% (5%)Cash net profit after tax 1,453 1,392 1,217 19%

69
Jun 11
$m
Jun 11 vs
Jun 10
Home loans 2,893 20%
Consumer finance 1,700 9%
Retail deposits 2,609 (7%)
Distribution 306 11%
Total banking income 7,508 7%
Operating expenses (2,903) 4%
Operating performance 4,605 8%
Impairment expense (558) (24%)
Tax (1,202) 13%
Cash net profit after tax 2,845 16%
Retail Banking Services
Strong business performance with
income growing faster than
expenses
Solid volume growth and margin
improvement in the lending
portfolios
Competitive market maintaining
pressure on deposit margins
Cost-to-income ratio further
improves to 38.7%
Improvement in impairment
expense

70
Growth profile
External refinancing similar to prior years
* Source: RBA/APRA
250 261
5228 (63)
(6)
RBS Home Loan Balance Growth 2011
$bn
2009 2010 2011
% of
Balances
Broker 34% 12% 5% 37%
Branch 18% 10% 5% 45%
Premium 6% 6% 2% 18%
Total CBA 20% 11% 4% 100%
System* 8% 8% 6%
Growth by Channel (%) Growth by State 2011 (%)
Jul Aug Sep Oct Nov Dec Jan Feb Mar Apr May Jun
FY 05/06 FY 06/07 FY 07/08
FY 08/09 FY 09/10 FY 10/11
5% % of Total Balances
Opening
balance
New
fundings
Redraw &
interest
Repayments /
Other
External
refinance
Closing
balance
3%
6%5% 5%
7%
5%
NSW/ACT Vic/Tas Qld SA/NT WA Total CBA
Includes Bankwest
Excludes Bankwest
Excludes Bankwest
Excludes Bankwest
External refinancing -
limited impact on net
balance growth
4%

71
36.2
30.3 29.9
Jun 10 Dec 10 Jun 11
Efficiency improvements in Mortgage processing
1,5671,451
1,130 1,093955
912
Mortgage Services
Home Loans serviced
Home Loan settlements
Home Loans total turn around time
FTEs
2007 2011
per mortgage services FTE per day
Feb 09 Jun 11
per mortgage services FTE
Feb 09 Jun 11
981
1,380No. of days
2008 2009 2010
1 2
3 4
1. Represents total mortgage services FTEs as at the end of each financial year (excluding staff on leave).2. Represents total number of home loan accounts where finance settlement has been undertaken by mortgage services
FTE that perform finance settlement activities. The figure excludes branch settlements and settlements related to Viridian Line of Credit loans.
3. Represents the total number of home loan accounts as at the end of the month serviced by Mortgage Services FTE. 4. Average days taken for end to end home loan process (application received to loan funded, including time with customer)

72
IB&M – 6 month periods
Jun 11 Dec 10 Jun 10
Jun 11 vs
Jun 10
(6 months)
Net interest income Institutional Banking 528 545 558 (5%)
Markets 115 105 93 24%
643 650 651 (1%)
Other banking income Institutional Banking 410 345 401 2%
Markets 154 265 173 (11%)
564 610 574 (2%)
Total banking income Institutional Banking 938 890 959 (2%)
Markets 269 370 266 1%
1,207 1,260 1,225 (1%)
Operating expenses (413) (415) (424) (3%)
Profit before impairment expenses 794 845 801 (1%)
Impairment expense (131) (193) 72 Large
Expense to income 34.2% 32.9% 34.6% (1%)
Cash net profit after tax 506 498 632 (20%)

73
Institutional Banking and Markets
Jun 11
$m
Jun 11 vs
Jun 10
Institutional Banking 1,828 (2%)
Markets 639 (11%)
Total banking income 2,467 (5%)
Operating expenses (828) -
Operating performance 1,639 (7%)
Impairment expense (324) 30%
Tax (311) (8%)
Cash net profit after tax 1,004 (14%)
IB&M Cash NPAT 14% due to:
► Operating Income 5% due to
lower markets trading income as a
result of lower domestic market
volatility and the effect of decline in
lending balances;
► A reduction in investment allowance
tax credits compared to prior year;
and
► Higher impairment expense as a
result of lower write-backs in
specific provisions.
Continued strong customer satisfaction
ratings in DBM and East & Partners
survey.

74
BPB – 6 month periods
Jun 11 Dec 10 Jun 10
Jun 11 vs
Jun 10
(6 months)
Net interest income Corporate Financial Services 258 270 271 (5%)
Regional & Agribusiness 133 132 129 3%
Local Business Banking 260 255 241 8%
Private Bank 54 56 55 (2%)
Equities and Margin Lending 86 91 92 (7%)
Other 45 47 33 36%
836 851 821 2% Other banking income Corporate Financial Services 291 265 221 32%
Regional & Agribusiness 82 79 71 15%
Local Business Banking 133 126 122 9%
Private Bank 74 67 63 17%
Equities and Margin Lending 120 113 128 (6%)
Other 3 12 13 (77%)
703 662 618 14% Total banking income Corporate Financial Services 549 535 492 12%
Regional & Agribusiness 215 211 200 8%
Local Business Banking 393 381 363 8%
Private Bank 128 123 118 8%
Equities and Margin Lending 206 204 220 (6%)
Other 48 59 46 4%
1,539 1,513 1,439 7% Operating expenses (682) (653) (667) 2% Impairment expense (126) (135) (132) (5%)Expense to income 44.3% 43.2% 46.4% (5%)Cash net profit after tax 532 507 453 17%

75
Business and Private Banking
* Represents revenue earned from products sold through direct channels
Jun 11
$m
Jun 11 vs
Jun 10
Corporate Financial Services 1,084 13%
Regional and Agribusiness 426 8%
Local Business Banking 774 9%
Private Bank 251 5%
Equities and Margin Lending 410 (12%)
Other * 107 (5%)
Total banking income 3,052 6%
Operating expenses (1,335) 3%
Operating performance 1,717 8%
Impairment expense (261) (20%)
Tax (417) 15%
Cash net profit after tax 1,039 16%
Solid performance in business
banking segments
Cash net profit after tax 16%
reflecting:
► Solid volume growth in lending
and deposits
► Lower equities trading volume
due to subdued market
volumes
► Targeted investment in frontline
staff and technology, with a
disciplined approach to
expense management
► Improving impairment expense

76
New Zealand – 6 month periods
NZ$M Jun 11 Dec 10 Jun 10
Jun 11 vs
Jun 10
(6 months)
Net interest income ASB 569 538 468 22%
Other (12) 2 (5) Large
Total NII 557 540 463 20%
Other banking income ASB 189 178 135 40%
Other (17) (13) (16) 6%
Total OBI 172 165 119 45%
Total banking income ASB 758 716 603 26%
Other (29) (11) (21) 38%
Total Banking Income 729 705 582 25%
Funds Management Income 26 26 26 -
Insurance Income 141 135 160 (12%)
Total operating income 896 866 768 17%
Operating expenses (472) (447) (428) 10%
Profit before impairment expense 424 419 340 25%
Impairment Expense (36) (36) 2 Large
Expense to income 52.7% 51.6% 55.7% (5%)
Underlying profit after tax 293 293 272 8%
Investment experience 2 - 3 (33%)
Cash net profit after tax 295 293 275 7%

77
New Zealand
Jun 11
NZD $m
Jun 11 vs
Jun 10
ASB 1,528 17%
Sovereign 257 2%
Other (23) 18%
Total operating income 1,762 15%
Operating expenses (919) 11%
Operating performance 843 20%
Impairment expense (72) (42%)
Tax and minority interests (185) 54%
Underlying profit after tax 586 27%
Investment experience 2 Large
Cash net profit after tax 588 28%
ASB NZD Cash NPAT 42%:
► Improved lending margins, with
floating rate home loans up from 37%
of all home loans in Jun-10 to 59% in
Jun-11
► Lower impairment expense due to
improving asset quality
Sovereign NZD cash NPAT17%:
► One-off deferred tax revaluation
credit in FY10
► Positive policy valuation adjustments
in FY10
Christchurch earthquake support
packages provided for both banking and
insurance customers

78
WM – 6 month periods
Jun 11 Dec 10 Jun 10Jun 11 vs
Jun 10(6 months)
Net operating income CFSGAM 378 378 333 14%
Colonial First State 347 342 333 4%
CommInsure 283 352 322 (12%)
Other (1) - (2) 50%
St Andrew's Insurance - - 15 Large1,007 1,072 1,001 1%
Operating expenses CFSGAM (201) (190) (188) 7%
Colonial First State (259) (230) (213) 22%
CommInsure (140) (136) (136) 3%
Other (61) (63) (65) (6%)
St Andrew's Insurance - - (7) Large(661) (619) (609) 9%
Underlying profit after tax CFSGAM 133 142 115 16%
Colonial First State 62 79 86 (28%)
CommInsure 101 153 134 (25%)
Other (44) (45) (44) -
St Andrew's Insurance - - 6 Large252 329 297 (15%)
Cash net profit after tax CFSGAM 126 155 129 (2%)
Colonial First State 66 77 85 (22%)
CommInsure 134 171 159 (16%)
Other (43) (44) (43) -
St Andrew's Insurance - - 9 Large283 359 339 (17%)

79
Wealth Management
Jun 11
$m
Jun 11 vs
Jun 10*
CFSGAM 756 14%
Colonial First State 689 6%
CommInsure 635 (5%)
Other (1) 67%
Net operating income 2,079 5%
Operating expenses (1,280) 7%
Tax (218) 6%
Underlying profit after tax 581-
Investment experience 61 (50%)
Cash net profit after tax 642 (9%)
* Comparatives excluding the St Andrew‟s insurance business which was sold
effective 1 July 2010
CFSGAM:
► FUM 3% to $149bn
► Strong investment performance -
83% of funds outperforming over 5
years
Colonial First State:
► Retail FUA 6% to $78bn
► Largest Platform
CommInsure:
► Life inforce premiums 9%
► General Insurance inforce premiums
7%
Total expenses 7%
Investment Experience down due to
lower annuity mark to market gains

80
CFS Global Asset Management
1 FUM figures exclude the Group‟s interests in the China Cinda JV
North America
$1.6bn FUM
5 People
Globally: $149bn FUM1, 901 people
Middle East
$6.7bn FUM
UK & Europe
$21.8bn FUM
188 People
Japan
$3.5bn FUM
5 people
Asia ex Japan
$17.2bn FUM
114 People
Australia & New Zealand
$97.8bn FUM
589 People
34% FUM raised from offshore clients, 41% people located offshore, 54% revenue generated offshore

81
Bankwest integration
By
December
2008
By
June
2009
By
FY12
Post
FY12
Acquisition announced Oct 08
Governance structure established
Due diligence commenced,
Regulatory approvals obtained
New CEO, CFO and CRO appointed
Formal acquisition date 19 Dec 08
Common ATM and branch access
Multi-brand strategy implemented
Revised growth plan established
Integration of St Andrew‟s
Final acquisition accounting in FY09 results
Systems alignment
Consolidation of operations/processes
Pursue targeted cost synergy opportunities
Focus on leveraging CBA scale advantage
Pursue incremental synergy opportunities
Timetable
East Coast
Store Rollout
(cessation)
Restructuring
Property &
Procurement
Operating
efficiencies, otherIT
IT
Restructuring
$18m
Property
$41m
Operations /
other
$26m
Annual expense synergies
$240m pa
Total integration costs
$246m
$93m
$94m
$48m
$88m
$14m
$60m
1
1. Total integration expenses since acquisition
2. Annualised run-rate
2

82
Bankwest – 6 month periods
Jun 11 Dec 10Jun 10
cash earnings
Jun 11 vs
Jun 10
(6 months)
Net interest income 741 679 679 9%
Other banking income 102 118 112 (9%)
Total banking income 843 797 791 7%
Operating expenses (441) (428) (437) 1%
Impairment expense (60) (49) (441) (86%)
Net profit before tax 342 320 (87) Large
Corporate tax expense (103) (96) 27 Large
Cash net profit after tax 239 224 (60) Large

83
Bankwest
Jun 11
$m
Jun 11 vs
Jun 10
Net interest income 1,420 6%
Other banking income 220 (6%)
Total banking income 1,640 5%
Operating expenses (869) (1%)
Operating performance 771 12%
Impairment expense (109) (86%)
Tax (199) Large
Cash net profit after tax 463 Large
Income 5%:
► Above system Home Loan growth
► Higher Deposit margins
► Managing down higher risk exposures
in business lending
Disciplined cost management –
expenses down every year since
acquisition
Impairment expense:
► Improving credit quality
► Run-off of troublesome and impaired
business lending loan book
► Non-recurrence of property related
impairments that impacted the prior
year

84
Products per Customer
Source: Roy Morgan Research
Refer note slide at back of this presentation for source information
6 months to June 2011
1.381.19 1.23
1.11 1.20
0.570.71 0.64 0.59
0.56
0.20 0.260.21
0.230.30
0.32 0.300.25
0.240.11
Insurance
Personal Lending
Home loan
Credit Cards
Managed funds
Superannuation
Deposit and Transaction accounts
2.64 2.632.54
2.44
2.25
Average Product Composition between Commonwealth Bank,
the 4 Major Banking Groups and Bankwest
Peer 3 Peer 1 BankwestCBA Peer 2

85
Jun 11 Dec 10 Jun 10
CBA BWA Combined CBA + BWA CBA + BWA
Home loans 22.0% 3.7% 25.7% 25.9% 26.1%
Credit cards 2 19.9% 2.8% 22.6% 22.7% 22.5%
Personal lending 14.0% 0.9% 14.9% 14.6% 14.6%
Household deposits 27.0% 2.9% 30.0% 30.5% 31.3%
Retail deposits 23.2% 3.7% 26.9% 26.7% 27.4%
Business lending – APRA 13.3% 4.8% 18.1% 18.6% 19.5%
Business lending – RBA 13.9% 3.1% 17.0% 17.2% 17.4%
Business deposits – APRA 17.3% 3.9% 21.2% 21.3% 22.9%
Equities trading – Total 5.9% n/a 5.9% 5.7% 6.3%
Equities trading – Online non advisory 63.3% n/a 63.3% 62.6% 62.3%
Australian retail funds – administrator view 15.0% n/a 15.0% 15.0% 14.6%
FirstChoice platform 11.3% n/a 11.3% 11.2% 10.9%
Australia life insurance (total risk) 12.4% n/a 12.4% 12.5% 12.6%
Australia life insurance (individual risk) 13.3% n/a 13.3% 13.3% 13.3%
NZ Lending for housing 22.2% n/a 22.2% 22.4% 22.8%
NZ Retail deposits 21.4% n/a 21.4% 21.2% 21.6%
NZ Lending to business 9.1% n/a 9.1% 9.2% 9.5%
NZ Retail FUM 14.4% n/a 14.4% 14.5% 17.9%
NZ Annual inforce premiums 29.9% n/a 29.9% 30.3% 31.0%
Market shares
1 Excludes St Andrew‟s insurance business
2 As at 31 May 2011
3 As at 31 March 2011
1
3
3
3
3
86
Index
Strategy 57
Business Performance 63
Risk and Credit Quality 86
Capital, Funding & Liquidity 104
Economic Indicators 114
Housing 129

87
Regulatory Exposure Mix
Regulatory Exposure Mix 1
CBA Peer 1 Peer 2 Peer 3
Residential Mortgages 57% 42% 41% 58%
Corporate, SME & Spec Lending 26% 35% 41% 32%
Bank 6% 7% 10% 3%
Sovereign 7% 7% 5% 3%
Qualifying Revolving 3% 4% 2% 3%
Other Retail 1% 5% 1% 1%
Total Advanced 2 100% 100% 100% 100%
1. Source: Pillar 3 disclosures for CBA as at June 2011 and Peers as at March 2011.
2. Includes Specialised Lending exposures. Excludes Standardised, Other Assets and Securitisation
(representing 15% of CBA, 6% of Peer 1, 17 % of Peer 2 and 5% of Peer 3). Exposure mix is re-baselined
to total 100% for comparison.

88
Loan Impairment Expense
1519
32
85
6155
28 24
Jun 07 Dec 07 Jun 08 Dec 08 Jun 09 Dec 09 Jun 10 Stat
Dec 10 June 11
40
22
20
13
18 20
37
2823
15
Jun 07 Dec 07 Jun 08 Dec 08 Jun 09 Dec 09 Jun 10 Dec 10 Jun 11
Margin LendingCBA Group1
1 Includes ASB and Bankwest from December 08. December 08 includes Bankwest on a pro forma basis. Basis points as a percentage of average Gross Loans and Acceptances.
2 Represents Retail Banking Services, ASB Retail and Bankwest Retail from December 08.3 Represents Institutional Banking and Markets, Business and Private Banking, ASB Business and
Bankwest Business from December 08.
bpts
Consumer bpts
pro forma
Review of Bankwest pre acquisition business book
4
28
20 25 37
96 98 90
47
Jun 07 Dec 07 Jun 08 Dec 08 Jun 09 Dec 09 Jun 10 Dec 10 Jun 11
39
bpts
Corporate3
pro forma
pro forma
Stat
2
54
185
19
Group
Flood /earthquake related overlay
Group
Six months annualised
(basis points)

89
4735
17 20 21
9
7
-7
6
-1
5
13
18 22
2828
221,121
881
428 518 530
207
189
-177
155
-32
113
313
441 4960
692722
722
558
6 months ($m)6 months annualised (basis points)*
OverlayBase
61
Bankwest
1,4411,383
55
* Basis points as a percentage of average Gross Loans and Acceptances.
Jun 09 Jun 10
cash earnings
Dec 09 Jun 09 Jun 10
cash earnings
Dec 09
Loan Impairment Expense
Dec 10 Dec 10 Jun 11 Jun 11

90
Arrears
0.6%
0.8%
1.0%
1.2%
1.4%
1.6%
Jun Jul Aug Sep Oct Nov Dec Jan Feb Mar Apr May Jun
06/07 07/08 08/09 09/10 10/11
90+ Days %
Personal loans
0.8%
1.0%
1.2%
1.4%
1.6%
1.8%
Jun Jul Aug Sep Oct Nov Dec Jan Feb Mar Apr May Jun
06/07 07/08 08/09 09/10 10/11
* CBA domestic (excluding Bankwest).
90+ Days %
90+ Days %
90+ Days %
ASB - consumer arrears
0.0%
0.5%
1.0%
1.5%
2.0%
Mar 10 Jun 10 Sep 10 Dec 10 Mar 11 Jun 11
Home Loans Credit Cards Personal Loans
Credit cardsHome Loans * *
*
0.0%
0.5%
1.0%
1.5%
2.0%
Jun 09 Sep 09 Dec 09 Mar 10 Jun 10 Sep 10 Dec 10 Mar 11 Jun 11
NSW QLD VIC WA Portfolio
ACT NT TAS SA

91
RBS home loan book quality very sound
Portfolio average LVR of 44%
Average LVR of 54% on new loans taken out over the past 12 months
69% of customers paying in advance of requirements, by an average 7 payments
Maximum LVR of 95% for new and existing best risk customers
Mortgage insurance or low deposit premium required for loans above 80% LVR
LMI insurance covers entire loan balance
Serviceability tests include interest rate buffer of 150 bpts above prevailing SVR
First Home Buyer arrears similar to overall portfolio arrears
Limited “Low doc” lending (3% of total book) with tighter lending criteria eg LMI above 60% LVR
Historical home loan losses have always remained low
Even under aggressive “stress test” scenarios, likely losses very manageable
All statements relate to the RBS home loan book.

92
Modest uptick in home loan arrears
Home Loan Arrears Dynamic Delinquency
► Modest uptick in arrears driven by weather events and flow-through of FY08, FY09 vintage loans.
► Qld accounts for a disproportionate share of increased arrears.
► Overall arrears rates remain modest at ~1.0% (90 days+).
90+ Days %
0.0%
0.5%
1.0%
1.5%
2.0%
2.5%
3.0%
Dec-07 Dec-08 Dec-09 Dec-10
3 Months-on-Book 6 Months-on-Book 12 Months-on-Book
30+ Days %
1
1. Dynamic Delinquency: Tracks the arrears performance of accounts booked by month of approval at 3,
6 and 12 months post funding.
Month of origination
0.0%
0.5%
1.0%
1.5%
2.0%
Jun 09 Sep 09 Dec 09 Mar 10 Jun 10 Sep 10 Dec 10 Mar 11 Jun 11
NSW QLD VIC WA Portfolio
ACT NT TAS SA

93
Home Loan Arrears
All graphs are CBA-domestic excluding Bankwest
0%
1%
Feb 08 Aug 08 Feb 09 Aug 09 Feb 10 Aug 10 Feb 11
90+ days arrears
0%
1%
Dec 07 Jun 08 Dec 08 Jun 09 Dec 09 Jun 10 Dec 10
30 days+ arrears(3 months on book)
LMI vs non-LMI
First Home Buyers
0%
1%
2%
Feb 08 Aug 08 Feb 09 Aug 09 Feb 10 Aug 10 Feb 11
90+ days arrears
Jun 11
FHB Portfolio FHBPortfolio (non FHB)
„Not Insured‟ LMI Low deposit premium1
1. Low Deposit Premium (LDP): Rather than taking out LMI policies for all loans with an LVR>80%,
we charge the customer a premium similar to LMI, but take on the risk and use the premium to offset the
higher economic capital charge, targeted at low risk customers.
1.4%
1.6%
1.8%
2.0%
2.2%
Dec 10 Jan 11 Feb 11 Mar 11 Apr 11 May 11 Jun 11
30+ (Portfolio) 30+ (Portfolio excl. Natural Disasters)
9 bpts
3 bpts
Impact of Natural Disasters
30+ days arrears
First Home Buyers

94
Home Loan losses remain very low
0.0%
0.5%
1.0%
1.5%
2.0%
2.5%
1983
1984
1985
1986
1987
1988
1989
1990
1991
1992
1993
1994
1995
1996
1997
1998
1999
2000
2001
2002
2003
2004
2005
2006
2007
2008
2009
2010
2011
CBA Home Loans Group
$ Losses/Average Gross Loans
CBA Home Loans represents Australian Home Loans and includes Bankwest from 2009.
Group includes all losses for the Group (CBA/Bankwest/ASB).
Losses includes write-offs from collective and individual provisions, less recoveries.

95
Even “high stress” losses would be modest
Excludes Bankwest and ASB.
► Even under high stress test scenarios, portfolio losses
would be modest ($576m).
► Potential losses are mitigated by portfolio quality, including
low LVRs (portfolio average 44%) and customers paying
in advance (69%) by an average 7 periods.
► Loans above 80% subject to either mortgage insurance
or low deposit premium.
Example excludes potential losses on insured loan
balances (~$1.232bn) – these losses would be borne by
the insurer.
Expected loss $m PD stress factor
Property value x1 x2 x4 x6
No decrease 14 17 24 29
10% decrease 35 48 69 86
20% decrease 87 126 194 249
30% decrease 185 281 444 576
566 576
4424 19
59
Previous
Result
(data as at
Jun 2010)
Closed
Accounts
Market
Valuations
Existing
Accounts
New
Accounts
Current
Result
(data as at
Dec 2010)
$m
Expected Loss outcomes Six-month Movement
Portfolio LVR
69.3%
17.5%
6.6% 6.6%
69.3%
17.6%
7.0% 6.1%
0%-60% 60.01%-80% 80.01%-90% 91%+
Jun-10 Jun-11
Proportion of Accounts
Portfolio average LVR of 44%
based on current loan values

96
Genworth Financial
APRA Regulated
Highly rated: AA- by S&P and A1 by Moody's
Strong Capital Position:
Solvency Ratio significantly above regulatory minimum
Regular stress testing against "extreme" stress scenarios
High quality liquid investments
Ring fenced from US Parent
Regular CBA review

97
Portfolio Jun 11
Total Balances - Spot ($bn) 336
Total Accounts (m) 1.4
Fundings ($bn) 52
Fixed Rate (%) 13
Variable Rate (%) 87
Owner-Occupied (%) 57
Investment (%) 33
Line of Credit (%) 10
Proprietary (%) 63
Broker (%) 37
Avg Loan Size ($‟000) 218
Annual Run-Off (%) 17%
CBA Home Loan Portfolio Profile
Quality Jun 11
Total Balances – Average ($bn) 330
Actual Losses ($m) 67
Loss Rate (%) 0.02%
LVR – Portfolio Avg (%) 44%
LVR – New Fundings (%) 54%
Customers in Advance (%) 69%
Payments in advance (#) 7
Low Doc % of Book (%) 3%
FHB - % of new fundings 10%
FHB - % of balances 15%
LMI - % of Book 26%
Serviceability buffer 1.50%
2
2
2
1
All figures relate to the RBS home loan portfolio except where noted
1. Numbers are for the Group (including BW and ASB). Include securitised loans.
2. 12 months to June 2011
3. Actual losses includes write-offs from collective provisions and individual provisions, net of any recoveries.
1
2
1, 3
1

98
Sector Exposures
Dec 10
1 Total exposures = balance for uncommitted facilities; greater of limit or balance for committed facilities.
Includes settlement risk, ASB and Bankwest.
Dec 10 Jun 11
Consumer 54.9% 53.1%
Agriculture 2.3% 2.2%
Mining 0.8% 0.8%
Manufacturing 2.1% 2.0%
Energy 1.1% 1.0%
Construction 1.0% 1.0%
Retail & Wholesale 2.5% 2.4%
Transport 1.4% 1.4%
Banks 10.8% 11.6%
Finance – other 3.9% 3.6%
Business Services 1.0% 0.9%
Property 6.7% 6.3%
Sovereign 4.9% 7.3%
Health & Community 0.8% 0.8%
Culture & Recreation 0.8% 0.7%
Other 5.0% 4.9%
Total 100% 100%
Including ASB and Bankwest Including ASB and Bankwest
Australia 80.0%
New Zealand 8.3%
Europe 6.0%
Other International 5.7%
Australia 80.6%
New Zealand 8.8%
Europe 5.2%
Other International 5.4%
Jun 11
1

99
Sector Exposures
* Includes ASB and Bankwest
Sector Exposures* – Jun 11
$bnAAA to
AA-
A+ to
A-
BBB+
to
BBB-
Other Total
Banks 49.1 30.6 3.1 0.4 83.2
Finance Other 7.8 8.6 3.4 5.2 25.0
Property 0.3 4.3 8.1 34.0 46.7
Sovereign 50.2 1.3 0.3 0.3 52.1
Manufacturing 0.2 2.2 5.8 5.9 14.1
Retail/Wholesale Trade 0.0 0.9 4.9 12.1 17.9
Agriculture 0.0 0.2 2.1 14.1 16.4
Energy 0.5 1.3 4.4 1.4 7.6
Transport 0.0 1.7 4.4 4.0 10.1
Mining 0.5 1.2 2.5 2.0 6.2
All other (ex consumer) 1.9 3.4 11.8 35.7 52.8
Total 110.5 55.7 50.8 115.1 332.1
Top 20 Commercial Exposures – Jun 112
Note 1
Note 2
1 Gross exposure before collateralisation = balance for uncommitted facilities; greater of limit or balance for committed
facilities and excludes settlement exposures.
2 Excluding finance and government . CBA grades in S&P Equivalents. Includes ASB. Excludes Bankwest.
Notes: The gradings reflect the rating of the ultimate risk.
Within these aggregated exposures is the following:
1. $155m rated D, $104m B, $43m B secured by fixed & floating charge.
2. $101m rated CC, $250m D secured by fixed & floating charge.
1

100
Commercial Property Market
0%
5%
10%
15%
20%
25%
30%
35%
40%
Sydney Melbourne Brisbane Perth Adelaide
1991 Recession Current Previous
Source : Jones Lang LaSalle Research
Market
Peak
1990s
Previous(1st Half
FY11)
Current(2nd Half
FY11)
Sydney 22.4% 7.8% 8.0%
Perth 31.8% 7.1% 5.4%
Melbourne 25.8% 6.3% 6.0%
Brisbane 14.3% 8.3% 6.8%
Adelaide 19.8% 7.3% 6.9%
% of Total Stock
CBD Vacancy RatesCBD Office Supply Pipeline*
CBA Commercial Property
46%
20%14% 11%
5% 4%
NSW VIC QLD WA SA Other
Source : Jones Lang LaSalle Research
Includes Bankwest
Exposure by State
Jun 11
* The development pipeline includes all projects currently under construction. Melbourne, for example, is only
developments in 2010 (there is nothing beyond the calendar year at present), while Perth and Brisbane
include projects through 2012.
(1st Half
FY11)
(2nd Half
FY11)

101
Risk Weighted Assets – June 11 Half
Credit RWA Movement Composition of Movement
RWA Movement
TotalTier 1 ratio
impact (bpt)
Credit Risk 1% (8)
Traded Market Risk (18)% 3
Operational Risk 10% (7)
IRRBB (43)% 25
Total (1)% 13
On Balance
Sheet
Off Balance
SheetTotal
% Change - Consumer Retail 1% (7)% 0%
% Change - Non-retail (1)% 5% 1%
CRFs1 FX/
Volume Quality
Reg
Change2 Total
(1)% 2% (1)% 0% 0%
(3)% 3% (1)% 2% 1%
Tier 1 impact – Retail (bpts) (1) 2 1
Tier 1 impact – Non-Retail (bpts) 1 (5) (4)
Tier 1 impact – Other3 (bpts) (4) (1) (5)
Total Tier 1 impact (bpts) (4) (4) (8)
4 (5) 2 0 1
10 (11) 4 (7) (4)
0 (2) (3) 0 (5)
14 (18) 3 (7) (8)
1 Credit Risk Factors. Includes revised CRFs for CBA and ASB risk-rated portfolios as well as refreshed CRFs for CBA Retail including a change in
methodology to determine Exposure at Default for Retail credit cards.
2 Regulatory Change. Implementation of RBNZ requirements for the ASB Farm Lending portfolio.
3 Other includes credit RWAs for Basel standardised asset classes including Bankwest assets, margin lending, equities
and other assets as well as securitisation exposures.
■ Credit RWAs increased by $2b primarily as a result of:
Growth in commercial portfolio and lower risk retail exposures;
Re-rating of a Spanish RMBS securitisation exposure by Moody‟s
from A to BB+;
Change in regulatory treatment driven by RBNZ requirements for
the New Zealand Farm Lending portfolio;
Partially offset by improvements in retail and commercial credit
quality and new credit risk factors.
■ IRRBB RWA reduced by $7.3b during the half year as a result of
treasury risk management activities and changes in loan and deposit
repricing terms.

102
Regulatory Expected Loss
1. Eligible provisions exclude Bankwest portfolio which operates under Basel II standardised methodology.
2. Includes transfer from Collective provision to Individually assessed provisions in accordance with APS 220
requirements (Jun 11: $108m Dec 10: $96m June 10: $136m).
Jun 10 Dec 10 Jun 11
$m $m $m
CBA (ex Bankwest) Regulatory Expected Loss (EL) – before tax 4,332 4,293 4,324
Eligible Provision 1
Collective provision 2 2,036 2,029 1,994
Individually assessed provisions 2 1,172 1,343 1,255
Other provisions 25 25 21
Subtotal 3,233 3,397 3,270
less tax effect impact (618) (616) (604)
General Reserve for Credit Losses adjustment (after tax) 90 84 91
Other (33) (68) (67)
Total Eligible Provision 2,672 2,797 2,690
Regulatory EL in excess of Eligible Provision 1,660 1,496 1,634
Tier One deduction – 50% 830 748 817
Tier Two deduction – 50% 830 748 817
Total Capital Deduction 1,660 1,496 1,634

103
Interest
Rate Risk
Capital Assigned to Interest Rate Risk in
Banking Book - APS117
Embedded Gain
or Loss
Repricing and
Yield Curve Risk
Basis Risk
Optionality Risk
$716m
$1,328m
$822m
$1,363m
$776m
Embedded Gain
or Loss
Repricing and
Yield Curve Risk
Basis Risk
Optionality Risk
Jun 09 Dec 09 Jun 10 Dec 10 Jun 11
26 bpts 33 bpts 62 bpts54 bpts 36 bpts

104
Index
Strategy 57
Business Performance 63
Risk and Credit Quality 86
Capital, Funding & Liquidity 104
Economic Indicators 114
Housing 129

105
NSFR - APRA observation and review NSFR - Effective
LCR 2011 - 2015 observation LCR – effective
Regulatory Change
Final proposals & QIS (Dec 10)
Liq
uid
ity
Fu
nd
ing
Ca
pit
al
Liquidity Coverage Ratio (LCR)
Definition of liquid assets widened to include “Level 2” assets and standards for jurisdictions with insufficient government bonds
RBA “committed secured liquidity facility” for a fee
Clarity required on use (extent and mechanics) of RBA facility
Net Stable Funding Ratio (NSFR)
Assets >1yr maturity to be funded with “stable” liabilities >1yr term
Quantum of “stable funding” for mortgages reduced (100% to 65%)
Less onerous run-off assumptions for some deposits
Measurement to be finalised
CBA Position
Favourable impact from revised mortgage
treatment (vs original proposals)
More, and longer term funding
undertaken since GFC
Regulatory minimums expected to double
CBA carrying significant liquid assets
Liquids portfolio already in transition
7.0% min. Common Equity inclusive of Capital Conservation buffer (2.5%)
8.5% minimum Tier 1 inclusive of Capital Conservation buffer (2.5%)
Countercyclical buffer: 0-2.5% of RWA
Leverage Ratio – set at min. of Tier 1 Capital to Total Exposures of 3%
Proposed “Global Systemically Important Financial Institutions” (G-SIFI)
additional capital requirement
Strong organic capital generation
Seeking international harmonisation of
capital ratios
Leverage Ratio less onerous than
originally expected
CBA “domestically” significant though not
expected to be G-SIFI
2011 2012 2013 2014 2015 2016 2017 2018
LCR, NSFR
and capital -
APRA draft
standards Minimum capital levels phased in through to 2019
LCR, NSFR
and capital -
APRA final
standards –
Dec 2012
Tim
eta
ble

106
European
comparison
The Group‟s Tier 1 Capital Ratio compares favourably to
international peers
Basel II Tier 1 Capital
Hybrids
13.1% 16.1%
10.2%11.9%
10.9%11.1%
11.0% 10.8%9.6%
10.2% 10.1%9.3% 9.2% 9.3% 9.1% 9.0%
18.2% 18.1%
14.0% 13.9% 13.7% 13.5% 13.5%12.2% 11.9% 11.8% 11.6%
11.3%10.4% 10.2% 9.9% 9.8%
0%
2%
4%
6%
8%
10%
12%
14%
16%
18%
CR
ED
IT
SU
ISS
E
UB
S
DE
UT
SC
HE
B
AN
K
ST
AN
DA
RD
C
HA
RT
ER
ED
CB
A
RB
S
BA
RC
LA
YS
HS
BC
H
LD
GS
PLC
BN
P
PA
RIB
AS
INT
ES
A
SA
NP
AO
LO
LLO
YD
S
SO
CG
EN
BA
NC
O
SA
NT
AN
DE
R
NO
RD
EA
UN
ICR
ED
IT
BB
VA
E
Top 15 European banks by market capitalisation as at 4 July 2011
Source: latest publicly disclosed company reports and other market updates.
1. Reflects Tier 1 Capital less hybrid Tier 1 instruments
Europe
Average
Tier 1 : 12.7%
Europe
Average
Core Tier 11:
10.7%
Common Tier 11
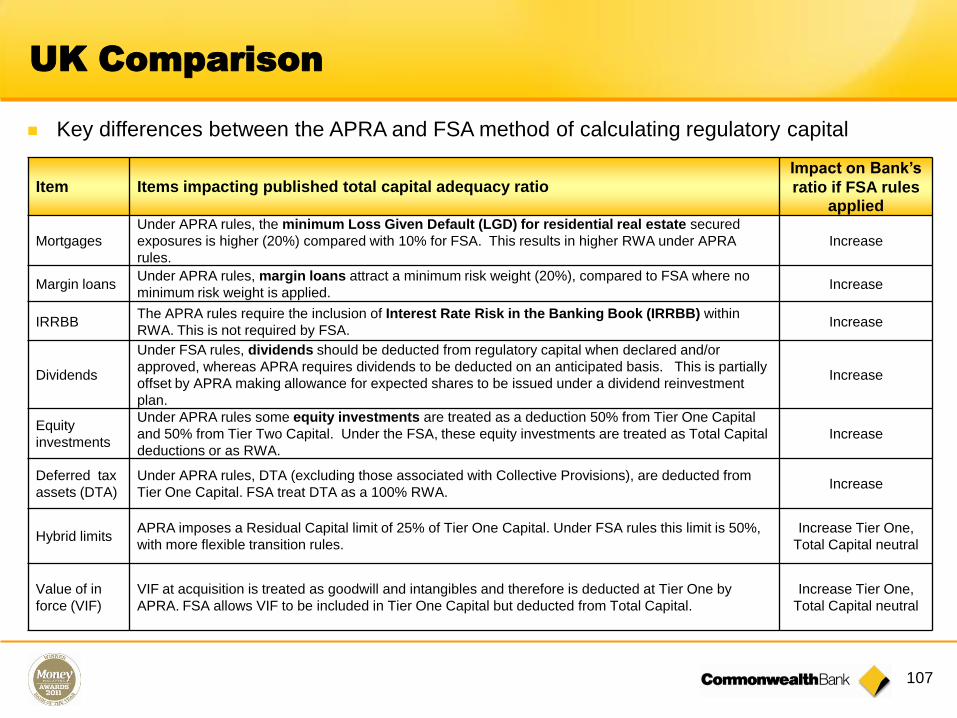
107
Key differences between the APRA and FSA method of calculating regulatory capital
Item Items impacting published total capital adequacy ratioImpact on Bank’s
ratio if FSA rules applied
Mortgages
Under APRA rules, the minimum Loss Given Default (LGD) for residential real estate secured
exposures is higher (20%) compared with 10% for FSA. This results in higher RWA under APRA
rules.
Increase
Margin loansUnder APRA rules, margin loans attract a minimum risk weight (20%), compared to FSA where no
minimum risk weight is applied.Increase
IRRBBThe APRA rules require the inclusion of Interest Rate Risk in the Banking Book (IRRBB) within
RWA. This is not required by FSA.Increase
Dividends
Under FSA rules, dividends should be deducted from regulatory capital when declared and/or
approved, whereas APRA requires dividends to be deducted on an anticipated basis. This is partially
offset by APRA making allowance for expected shares to be issued under a dividend reinvestment
plan.
Increase
Equity
investments
Under APRA rules some equity investments are treated as a deduction 50% from Tier One Capital
and 50% from Tier Two Capital. Under the FSA, these equity investments are treated as Total Capital
deductions or as RWA.
Increase
Deferred tax
assets (DTA)
Under APRA rules, DTA (excluding those associated with Collective Provisions), are deducted from
Tier One Capital. FSA treat DTA as a 100% RWA.Increase
Hybrid limitsAPRA imposes a Residual Capital limit of 25% of Tier One Capital. Under FSA rules this limit is 50%,
with more flexible transition rules.
Increase Tier One,
Total Capital neutral
Value of in
force (VIF)
VIF at acquisition is treated as goodwill and intangibles and therefore is deducted at Tier One by
APRA. FSA allows VIF to be included in Tier One Capital but deducted from Total Capital.
Increase Tier One,
Total Capital neutral
UK Comparison

108
UK Comparison
The following table estimates the impact on CBA Group capital, as at June 2011, of the
differences between the APRA Basel II guidelines and those of the UK regulator, Financial
Services Authority (FSA)
1. Represents Fundamental Tier One capital net of Tier One deductions
2. Based on APRA 20% loss given default (LGD) floor compared to FSA 10% and CBA‟s downturn LGD loss experience.
For Standardised portfolio, based on APRA matrix compared to FSA standard
3. VIF at acquisition is treated as goodwill and intangibles and therefore is deducted at Tier One by APRA. FSA allows VIF
to be included in Tier One Capital but deducted from Total Capital
Common
Equity
Capital1
Tier One
Capital
Total
Capital
June 11 Actual 7.7% 10.0% 11.7%
RWA treatment – mortgages 2, margin loans 1.2% 1.6% 1.7%
IRRBB risk weighted assets 0.3% 0.4% 0.4%
Future dividends (net of DRP) 0.8% 0.8% 0.8%
Tax impact in EL > EP calculation 0.1% 0.1% 0.2%
Equity Investments 0.3% 0.3% 0.2%
Value of in force (VIF) deductions 3 0.5% 0.5% 0.0%
Total Adjustments 3.2% 3.7% 3.3%
June 11 Actual – Normalised 10.9% 13.7% 15.0%

109
Funding
5%
41%
17%
5%
13%
4%
4%7%
4% Structured MTN
Vanilla MTN
Commercial Paper
Debt Capital
CDs
Securitisation
Bank Acceptance
FI Deposits
Other
44%
6%10%
26%
5%5%
1% 3%Australia
Other Asia
Europe
United States
Japan
United Kindom
Hong Kong
Misc
Note: AUD, USD & EURO Public benchmark deals are fully allocated to their
respective currency locations
Wholesale Funding by Product
Wholesale Funding by Region
61%19%
4%
13%2% 1%
Customer Deposits
ST Wholesale Funding
LT Wholesale maturing <12 months
LT Wholesale maturing >=12 months
RMBS
Hybrids
61% Deposit Funded
Indicative 5 year benchmark pricing
CBA Group Treasury estimates – indicative pricing for new issuance v BBSW
100
120
140
160
180
200
220
May 10 Jun 10 Jul 10 Aug 10 Sep 10 Oct 10 Nov 10 Dec 10 Jan 11 Feb 11 Mar 11 Apr 11 May 11 Jun 11
BBSW(bps)
USD 5yrs EUR 5yrs GBP 5yrs AUD 5yrs

110
Funded Assets
$bnJun
10
Jun
11
Transactions 83 89
Savings 79 82
Investments 157 176
Other 5 2
Total Retail 324 349
Wholesale
funding235 220
Total Funding 559 569
Equity 34 37
Total Funded
Assets593 606
Retail % of
Total Funding58% 61%
593 617 606
349
26 4 (8) 2 (11)
105
115
37
Funded
Assets
(Jun 10)
Deposits ST
Wholesale
LT
Wholesale
Equity Funded
Assets
(Jun 11)
IFRS &
FX on
Debt Issues
Total
Funded
Assets
(Jun 11)
Funding
Source
Equity
Long term
wholesale
Retail
Short term
wholesale
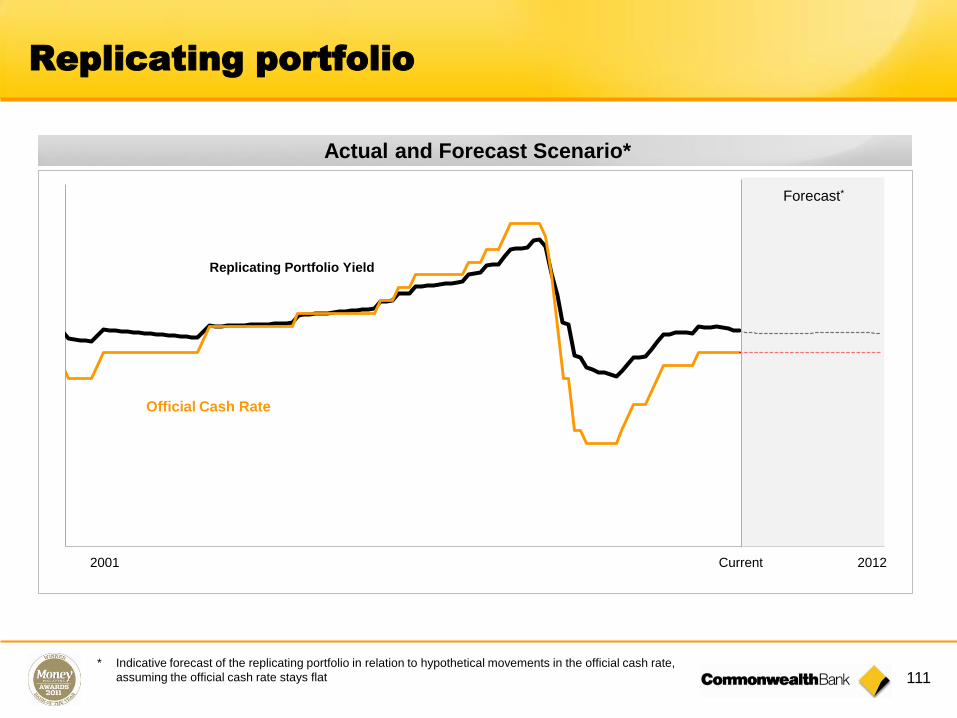
111
Replicating portfolio
1%
2%
3%
4%
5%
6%
7%
8%
Replicating Portfolio Yield
Official Cash Rate
Actual and Forecast Scenario*
2001 Current 2012
Forecast*
* Indicative forecast of the replicating portfolio in relation to hypothetical movements in the official cash rate,
assuming the official cash rate stays flat

112
UK and US balance sheet comparison
United Kingdom
4% 5%
14% 9%
12% 20%
45%
12%
19%
48%
6% 6%
Other Assets
Other Fair
Value assets
Other Lending
Home Loans
Trading Securities
Cash Capital
Deposits
Long Term
Short Term
Other Liabilities
Trading Liabilities
Assets Liab + Equity
USA
12%4%
13%
6%
17%
16%
36%
14%
15%
50%
7% 10%
Other Assets
Other Lending
Home Loans
Trading Securities
Cash Capital
Deposits
Long Term
Short Term
Other Liabilities
Trading Liabilities
Assets Liab + Equity
Based on analysis of Citigroup, JP Morgan, Bank of America and Wells Fargo
as at 31 March 2011. Average of four banks
Based on analysis of Lloyds, RBS, HSBC and Barclays, as at 30 June 2011
Average of four banks
Balance sheets do not include derivative assets and liabilities
Other Fair
Value assets
Based on statutory balance sheet

113
Australian Banks – safe assets, secure funding
Other Assets
Other Lending
Home Loans
Trading Securities
Cash Capital
Deposits
Long Term
Short Term
Other Liabilities
Commonwealth Bank
Trading Liabilities
CBA balance sheet as at 30 June 2011
Balance sheet does not include derivative assets and liabilities
Based on statutory balance sheet
Assets Liab + Equity
Other Fair
Value assets
5% 1%
4%6%
7%16%
28% 13%
53%
58%
3% 6%
Assets – CBA’s assets are safer because:
53% of balance sheet is home loans, which are stable/long
term
Trading securities and other fair value assets comprise just
11% of CBA balance sheet compared to 26% and 30% for UK
and US banks
CBA‟s balance sheet is less volatile due to a lower proportion
of fair value assets
Funding – a more secure profile because:
Highest deposit base (58% including 24% of stable household
deposits)
Reliance on wholesale funding similar to UK and US banks,
although a longer profile than UK banks, which gives CBA a
buffer against constrained liquidity in the wholesale markets.
Balance sheet comparisons
Assets*
Amortised cost Fair Value
CBA 81% 19%
UK 58% 42%
US 40% 60%
* Includes grossed up derivatives.

114
Index
Strategy 57
Business Performance 63
Risk and Credit Quality 86
Capital, Funding & Liquidity 104
Economic Indicators 114
Housing 129

115
As at June
2008 2009 2010 2011 2012 (f) 2013 (f)
Credit Growth % – Total 11.7 3.1 3.2 2.7 3-5 5-7
Credit Growth % – Housing 9.5 6.5 8.0 6.0 4-6 5-7
Credit Growth % – Business 16.9 0.5 -3.9 -2.4 2-4 6-8
Credit Growth % – Other Personal 3.4 -7.0 3.1 0.3 0-2 5-7
GDP % 3.8 1.4 2.3 1.7 4.1 4.1
CPI % 3.4 3.1 2.3 3.1 2.9 3.1
Unemployment rate % 4.2 4.9 5.5 5.1 4.9 4.7
Cash Rate % 7¼ 3 4½ 4¾ 5¼ 5¾
CBA Economists Forecasts
Credit Growth = 12 months to June Qtr
GDP, Unemployment & CPI = Year average
Cash Rate = June qtr
CBA Economists summary of key indicatorsEconomic
Summary

116
Credit Drivers
Asian exposure more important than US
/ European weakness.
Commodity-income-capex-export
drivers underpin positive medium-term
backdrop and higher rates.
Balance sheets are in good shape.
AUD and low confidence levels
weighing on the non-resources
economy.
Global uncertainty and fear driving
financial market volatility.
Bottom line: credit growth to remain
subdued and to lag usual economic
drivers.
-10
0
10
20
30
-10
0
10
20
30
Sep-80 Sep-86 Sep-92 Sep-98 Sep-04 Sep-10
CREDIT & SPENDING (annual % change)
% %
Credit
Domesticspending
CBA(f)

117
Housing market characterised by excess demand and some resilience in sentiment.
Housing likely to be the fastest growing credit component.
100
150
200
100
150
200
Sep-90 Sep-94 Sep-98 Sep-02 Sep-06 Sep-10
HOUSING DEMAND & SUPPLY
Demand
Supply(rolling 4-qtr
sum)
'000'000
60
100
140
60
100
140
Jul-06 Jul-07 Jul-08 Jul-09 Jul-10
TIME TO BUY A DWELLING
Source: Melbourne Institute
Index Index
Housing Credit

118
Strong income growth, high savings and low confidence suggest restrained growth in
other personal credit.
60
95
130
165
200
-16
-8
0
8
16
Mar-90 Mar-95 Mar-00 Mar-05 Mar-10
%pa
Index
GDI(lhs)
Consumerconfidence*
(rhs)
* Source: WBC/Melbourne Institute
SENTIMENT & INCOME
-10
0
10
20-6
2
10
18
Mar-90 Mar-95 Mar-00 Mar-05 Mar-10
Otherpersonal
credit
(rhs)
Savingsratio
(inverse, lhs)
% %paPERSONAL CREDIT & SAVINGS
Other Personal Credit

119
Deleveraging by large corporates offsetting underlying credit growth from SMEs.
Capex strong but mining dominance, high retained earnings and alternative financing
options to weigh on credit growth.
-30
-11
8
26
45
-8
0
8
16
24
Sep-88 Sep-93 Sep-98 Sep-03 Sep-08 Sep-13
BUSINESS CREDIT(annual % change)% %
Businesscredit
(lhs)
CBA (f)
Businessinvestment
(rhs)
Reintermediationspike
Business Credit

120
Growth outperformance Stronger labour market
Australia in Perspective
90
95
100
105
Mar-08 Mar-09 Mar-10 Mar-11
Index
Japan
US
Australia
Europe
UK
NZ
Lehman
collapse
0
4
8
12
Jan-05 Jan-07 Jan-09 Jan-11
%
Euro
zone
Australia
Japan
UK
US
Source: CEIC
UNEMPLOYMENT RATEREAL GDP
(Sep'08= 100)

121
Sovereign debt concerns rise Risk of structural step down in growth rates
But global economy runs above trend… …and Asian outperformance expected to continue
Global Backdrop
0
2
4
6
0
2
4
6
<30% 30-60% 60-90% >90%
%pa%pa
Central government debt (% of GDP)
Source: Reinhart & Rogoff
GDP GROWTH & DEBT LEVELS(1790-2009)
Advanced economies
(median)
-2
0
2
4
6
8
-2
0
2
4
6
8
1950 1960 1970 1980 1990 2000 2010
WORLD GROWTH(annual % change) %%
Source: IMF
Long-runaverage
Globalrecessions
-1.0 -0.5 0.0 0.5 1.0 1.5
World
Advanced economies
Euro area
United States
Asian NICs
Developing Asia
China
India
Middle East
Lat America & Carrib
WORLD GROWTH IN 2011-2012(% deviation from normal*)
*1998-07 average
Source: IMF
-10
0
10
20
30
-10
0
10
20
30
2000 2002 2004 2006 2008 2010 2012
%%
GrossIssuance
Source: IMF
FINANCING NEEDS(advanced economies, % of GDP)
Debtrollover
Budgetdeficit

122
Base Level of Growth “Locked In”
A rising terms of trade is still boosting incomes The capex boom rolls on
Exports are responding Nominal economy supports capex & labour hiring
0
50
100
150
0
50
100
150
Sep-84 Sep-89 Sep-94 Sep-99 Sep-04 Sep-09
$bn $bnTHE CAPEX PIPELINE
(value of work yet to be done)
50
75
100
125
50
75
100
125
1984 1989 1994 1999 2004 2009
THE TERMS OF TRADEIndex Index
10
20
30
40
50
10
20
30
40
50
Mar-91 Mar-95 Mar-99 Mar-03 Mar-07 Mar-11
$bn $bn
1990s average growth rate: 5.8%pa
RESOURCE EXPORT VOLUMES
Post 2007 average growth rate: 7.1%pa
-7
0
7
14
21
-7
0
7
14
21
1984/85 1992/93 2000/01 2008/09
%%
NominalGDP
Companyprofits
THE NOMINAL ECONOMY(annual % change)
CBA(f)
Governmentrevenue

123
Corporate balance sheets are under-geared and risk appetite has improved
Attractiveness of bank finance has improved
-30
0
30
60
-30
0
30
60
Sep 09 Mar 10 Sep 10 Mar 11 Sep 11
%%
Bank
Equity
Source: Deloittes CFO Survey
SOURCES OF FINANCE(net % saying attractive)
Corporatedebt
0
30
60
90
0
30
60
90
Sep 09 Mar 10 Sep 10 Mar 11 Sep 11
%%
Over-geared
Under-geared
Source: Deloittes CFO Survey
VIEWS ON GEARING(% of responents)
Optimallygeared
-40
-20
0
20
40
-40
-20
0
20
40
Sep 09 Mar 10 Sep 10 Mar 11 Sep 11
%%
A good time to add risk to
the balance
sheet?
Source: Deloittes CFO Survey
ATTITUDE TO RISK(net % saying yes)
Aim to increase
gearing over
next year?
Overdone Deleveraging

124
Value of advanced mining projects rose
through the GFC and have since lifted further
Some AUD174bn worth of mining projects are
at an advanced stage
Mainly mining
Mining Multipliers
Output
Multiplier
(gross value
added)
Employment
Multiplier
(full-time
equivalent)
Coal, oil & gas $1.26 9
Iron ore $1.28 11
Non-ferrous metals $1.25 13
Services to mining $1.40 17
0
50
100
150
200
0
50
100
150
200
1995 1998 2001 2004 2007 2010
$bn $bn
Source: ABARE
ADVANCED MINING PROJECTS
The Capex Boom

125
Asian Reliance
■ The emerging Asia story reflects a domestic dynamic so some protection against weakness in
North Atlantic economies.
60
80
100
120
140
60
80
100
120
140
Jan-08 Jan-09 Jan-10 Jan-11
INDUSTRIAL PRODUCTION(Jan'08=100)Index Index
Emerging Asia
US
Eurozone
Japan
Index Jan. 2008 = 100Source: BEPA
70
85
100
115
130
70
85
100
115
130
Jan-08 Nov-08 Sep-09 Jul-10 May-11
WORLD IMPORTS(Jan'08=100)Index Index
Advanced economies
EmergingAsia
Source: BEPA

126
Households worry about their finances
Consumer Caution
Supportive labour market backdrop “Sentiment” to respond to “income”
Income growth is strong but confidence is low
0
3
6
9
12
-1
0
1
2
3
Sep-90 Sep-94 Sep-98 Sep-02 Sep-06 Sep-10
THE LABOUR MARKET % %
Unemploymentrate
(rhs)
Employment(qtly % ch)
(lhs)
-40
-20
0
20
40
-40
-20
0
20
40
Apr 09 Oct 09 Apr 10 Oct 10 Apr 11 Oct 11
%%
Better in six months time
Better than six
months
ago
Source: CBA Viewpoint
PERSONAL CIRCUMSTANCES(net % of respondents)
60
95
130
165
200
-16
-8
0
8
16
Mar-90 Mar-95 Mar-00 Mar-05 Mar-10
%pa
Index
Disposableincome
(lhs)
Consumerconfidence*
(rhs)
* Source: WBC/Melbourne Institute
SENTIMENT & INCOME
-20
-10
0
10
20
0.0
3.5
7.0
10.5
14.0
Mar-99 Mar-02 Mar-05 Mar-08 Mar-11
% %
Income(adv 2
qtrs, lhs)
Expected family finances next year*
(rhs)
* Source: WBC/Melbourne Institute
PERCEPTIONS VS REALITY(annual % change)

127
-10.0
-5.0
0.0
5.0
10.0
15.0
20.0
25.0
2001 2006 2011
Housing Business Total
Consumer Caution
Credit Growth Household Savings Ratio
Source: RBA
-5
0
5
10
15
20
-5
0
5
10
15
20
Sep-72 Sep-80 Sep-88 Sep-96 Sep-04
SAVING RATIO% %
Source: ABS

128
NZ Growth better than expected at start
of 2011
Strong earnings from key export
commodities but some drags as well:
– earthquake reconstruction delayed
until late 2011/ early 2012;
– household caution lingering;
– Government austerity over the
coming years.
Policy response:
– RBNZ expected to remove the 50bpt
“insurance cut” soon, conditional on
global risks receding;
– further hikes conditional on NZD.
New Zealand
NZ GDP GROWTH
-3
-1
1
3
5
7
M ar-89 M ar-93 M ar-97 M ar-01 M ar-05 M ar-09 M ar-13
-3
-1
1
3
5
7
Source: Stats NZ, ASB
%
Per quarter
Annual average % ( f )
129
Index
Strategy 57
Business Performance 63
Risk and Credit Quality 86
Capital, Funding & Liquidity 104
Economic Indicators 114
Housing 129

130
Australia well placed relative to typical housing
market concerns
Typical concerns Current position in Australia
Unsustainable asset prices Prices reflect the balance of supply and demand
Australia‟s population continues to grow
Supply-side restraints - limited new land releases, low construction
Low residential vacancy rates
Real house prices currently undergoing a modest correction
Speculative investment artificially
inflates asset prices
Investment lending has remained steady at ~30%
Strong volume growth driven by
relaxed lending standards
Already stringent standards tightened through GFC
Minimal “low doc” lending
Mortgage insurance for higher LVR loans
Full recourse lending
Housing affordability issues Ratio of house prices to income comparable to other countries,
once measurement and geographic issues are taken into account
Higher interest rates placing stress
on home loan servicing capabilities
A high proportion of borrowers ahead of required repayment levels
Interest rate buffers built into loan serviceability tests at application
CBA home loan losses remain very low
Domestic economic shock –
trigger for price correction
Australian economy well placed
Close to full employment

131
Mvt (%)
3 Years
to
Jun 11
12 mths
to
Jun 11
Jun
Qtr
Sydney 15% (0.7%) 0.4%
Melbourne 21% (2.0%) (0.1%)
Brisbane 2% (3.6%) (0.3%)
Adelaide 8% (2.1%) (0.8%)
Perth 5% (4.1%) (1.0%)
Average 13% (1.9%) (0.1%)
House prices undergoing a modest correction
Australian House Prices - ABS*
* Source: ABS
CBA Established House Prices
0
200
400
600
800
Jun-01 Jun-03 Jun-05 Jun-07 Jun-09 Jun-11
Brisbane Perth Sydney
Melbourne Adelaide Hobart
$'000
Source: CBA Economics

132
House Prices & the Cycle
Nominal prices can fall – but typically not by very much.
Most adjustment is to real prices and relative prices. So during the adjustment phase house prices
lag behind consumer prices and incomes. And performance between market segments varies.
The adjustment process
95
120
145
170
95
120
145
170
Jan-05 Jan-07 Jan-09 Jan-11
Index Index
Top 20% of suburbs
HOUSE PRICES(Sep'04 = 100)
Middle 60% of suburbs
Bottom 20%of suburbs
Source: Rismark
94
97
100
94
97
100
-2 -1 0 1 2 3 4 5 6
Index
Mar'08
Source: ABS/CBA
ESTABLISHED HOUSE PRICES(peak=100)
Qtrs from peak
Index
Current
Mar'95
Jun'90

133
GDP Growth
But housing demand remains above supplyPopulation growth has slowed
Stronger labour market
Source : ABS, IMF, Consensus Economics, CBA Economics. Dwelling starts relates to physical construction activity
(all new housing)
Strong economic fundamentals minimize the
downside risk to Australian house prices
100
150
200
100
150
200
Sep-90 Sep-94 Sep-98 Sep-02 Sep-06 Sep-10
HOUSING DEMAND & SUPPLY
Demand
Supply(rolling 4-qtr
sum)
'000'000
10 Yr
Avg
Forecast
2011-12
Asia (ex Japan) 8.0 7.5
Australia 3.1 3.4
US 1.9 2.8
Japan 0.7 1.2
UK 1.7 1.8
Euro Zone 1.4 1.80
4
8
12
0
4
8
12
Jan-05 Jan-07 Jan-09 Jan-11
% %
Eurozone
Australia
Japan
UK
UNEMPLOYMENT RATE
UnitedStates
Source: CEIC
0
100
200
300
400
500
1981 1985 1989 1993 1997 2001 2005 2009
Natural Increase
0
150
300
450
0
150
300
450
1990/91 1995/96 2000/01 2005/06 2010/11
POPULATION DRIVERS'000 '000
Netmigration
Naturalincrease
H2 '10(annual
rate)
Demand represents demand for new dwellings implied by population growth

134
United States
Unemployment ~5% ~10%
No-Recourse Lending No Yes
Variable vs Fixed 87%/13% 15%/85%
Adjustable Rate Loans Minimal Widespread
Sub-Prime (% of mkt) Minimal ~36%
Securitisation % Minimal ~55%
Account Ownership Retained by bank Extensively on-sold
Arrears/Delinquencies ~1-2% ~20%
Australian Housing Market vs US
CBA/Australia
1
1. At peak in 2006. Source UBS
2. Source: Office of the Comptroller of the Currency. Data as at March 2011
2

135
Note
1 Retail MFI Customer Satisfaction –Roy Morgan Research. Australian Population 14+, % “Very Satisfied” or “Fairly
Satisfied” with relationship with that main financial institution. 6 month rolling average.
2 Products per Customer -Roy Morgan Research. Australian Population 14+ , Banking and Finance products per Banking
and Finance customer at financial institution. 6 month moving average.
3 DBM Business Financial Services Monitor, measured micro business with turnover up to $1 million, small business with
turnover of $1 million up to $5 million, medium business with turnover of $5 million up to $50 million and large business
with turnover of over $50 million, 6 month rolling average.
4 FirstChoice -Wealth Insights Platform Service Level Survey compared with bank peer platforms as ranked by financial
advisors who give a 7-10 out of 10.
Sources for Customer Satisfaction results outlined in this pack

Commonwealth Bank of Australia ACN 123 123 124
Results PresentationFor the half year ended 31 December 2009
10 February 2010
Results PresentationFOR THE FULL YEAR ENDED 30 JUNE 2011
DETERMINED TO BE BETTER THAN WE‟VE EVER BEEN.
Ralph Norris
Chief Executive Officer
David Craig
Chief Financial Officer
10 AUGUST 2011 | COMMONWEALTH BANK OF AUSTRALIA | ACN 123 123 124