Embed Size (px)
Citation preview
EN
ER
GIS
E
EV
OL
VE
UN
DE
RS
TA
ND
Results presentation Full-year 201714 February 2018

Unless otherwise indicated, the condensed consolidated interim financial statements and the financial and operating data or other information included herein relate to Coca-Cola
HBC AG and its subsidiaries (“Coca-Cola HBC” or the “Company” or “we” or the “Group”).
This document contains forward-looking statements that involve risks and uncertainties. These statements may generally, but not always, be identified by the use of words such as
“believe”, “outlook”, “guidance”, “intend”, “expect”, “anticipate”, “plan”, “target” and similar expressions to identify forward-looking statements. All statements other than
statements of historical facts, including, among others, statements regarding our future financial position and results, our outlook for 2018 and future years, business strategy and
the effects of the global economic slowdown, the impact of the sovereign debt crisis, currency volatility, our recent acquisitions, and restructuring initiatives on our business and
financial condition, our future dealings with The Coca-Cola Company, budgets, projected levels of consumption and production, projected raw material and other costs, estimates of
capital expenditure, free cash flow, effective tax rates and plans and objectives of management for future operations, are forward-looking statements. By their nature, forward-
looking statements involve risk and uncertainty because they reflect our current expectations and assumptions as to future events and circumstances that may not prove accurate.
Our actual results and events could differ materially from those anticipated in the forward-looking statements for many reasons, including the risks described in the 2016 Integrated
Annual Report for Coca-Cola HBC AG and its subsidiaries.
Although we believe that, as of the date of this document, the expectations reflected in the forward-looking statements are reasonable, we cannot assure you that our future
results, level of activity, performance or achievements will meet these expectations. Moreover, neither we, nor our directors, employees, advisors nor any other person assumes
responsibility for the accuracy and completeness of the forward-looking statements. After the date of the condensed consolidated interim financial statements included in this
document, unless we are required by law or the rules of the UK Financial Conduct Authority to update these forward-looking statements, we will not necessarily update any of these
forward-looking statements to conform them either to actual results or to changes in our expectations.
Forward-looking statements
Results presentation | Full-year results | February 2018 2
Exceptional year for Coca-Cola HBC
Results presentation | Full-year results | February 2018 3
Full-year highlights• FX-neutral net sales revenue up 5.9%,
achieved through a good balance of volume and FX-neutral revenue per case growth
• Strong FX-neutral revenue per case, up 3.6%
• Volume up by 2.2%, with positive performance in all segments
• Comparable EBIT margin up by 120bps to 9.5%
• Comparable EPS of €1.23, up 26.9%
• Free cash flow at €426m for the year, with higher capital expenditure
• Dividend per share of €0.54, up 23%

EN
ER
GIS
E
EV
OL
VE
UN
DE
RS
TA
ND
Financial reviewMichalis Imellos | Chief Financial Officer
Accelerating growth
Results presentation | Full-year results | February 2018 5
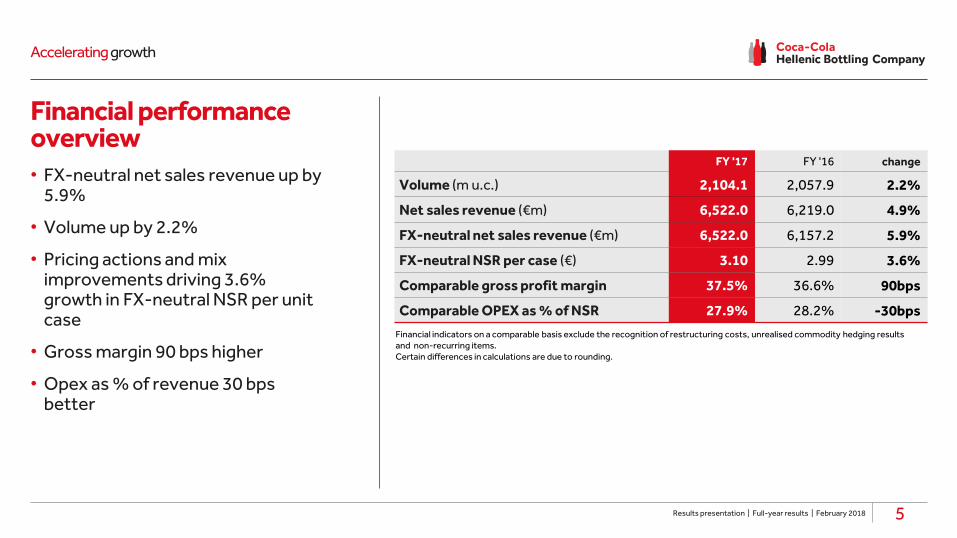
Financial performance overview• FX-neutral net sales revenue up by
5.9%
• Volume up by 2.2%
• Pricing actions and mix improvements driving 3.6% growth in FX-neutral NSR per unit case
• Gross margin 90 bps higher
• Opex as % of revenue 30 bps better
FY '17 FY '16 change
Volume (m u.c.) 2,104.1 2,057.9 2.2%
Net sales revenue (€m) 6,522.0 6,219.0 4.9%
FX-neutral net sales revenue (€m) 6,522.0 6,157.2 5.9%
FX-neutral NSR per case (€) 3.10 2.99 3.6%
Comparable gross profit margin 37.5% 36.6% 90bps
Comparable OPEX as % of NSR 27.9% 28.2% -30bps
Financial indicators on a comparable basis exclude the recognition of restructuring costs, unrealised commodity hedging results and non-recurring items.Certain differences in calculations are due to rounding.
Accelerating growth
Results presentation | Full-year results | February 2018 6
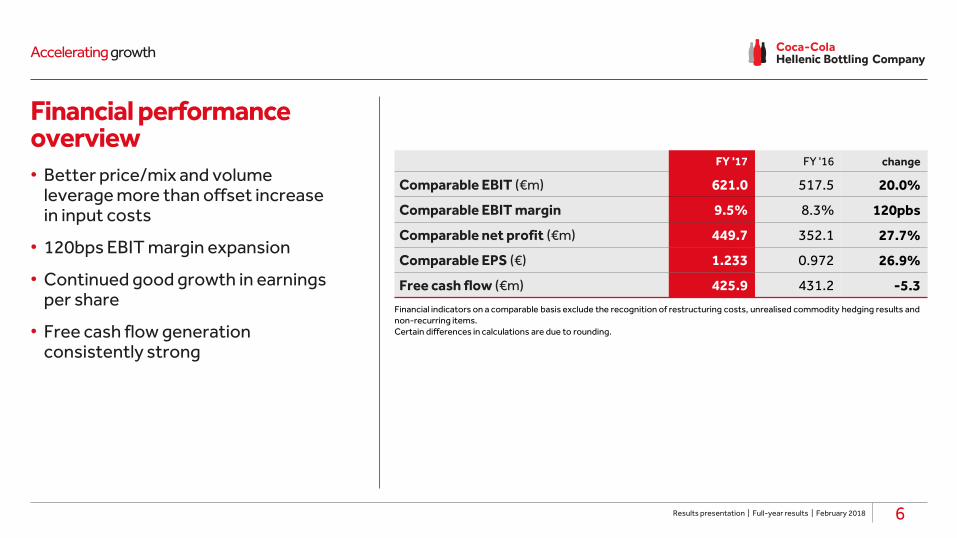
Financial performance overview• Better price/mix and volume
leverage more than offset increase in input costs
• 120bps EBIT margin expansion
• Continued good growth in earnings per share
• Free cash flow generation consistently strong
FY '17 FY '16 change
Comparable EBIT (€m) 621.0 517.5 20.0%
Comparable EBIT margin 9.5% 8.3% 120pbs
Comparable net profit (€m) 449.7 352.1 27.7%
Comparable EPS (€) 1.233 0.972 26.9%
Free cash flow (€m) 425.9 431.2 -5.3
Financial indicators on a comparable basis exclude the recognition of restructuring costs, unrealised commodity hedging results and non-recurring items.Certain differences in calculations are due to rounding.
Delivering fasterrevenue growth
Results presentation | Full-year results | February 2018 7
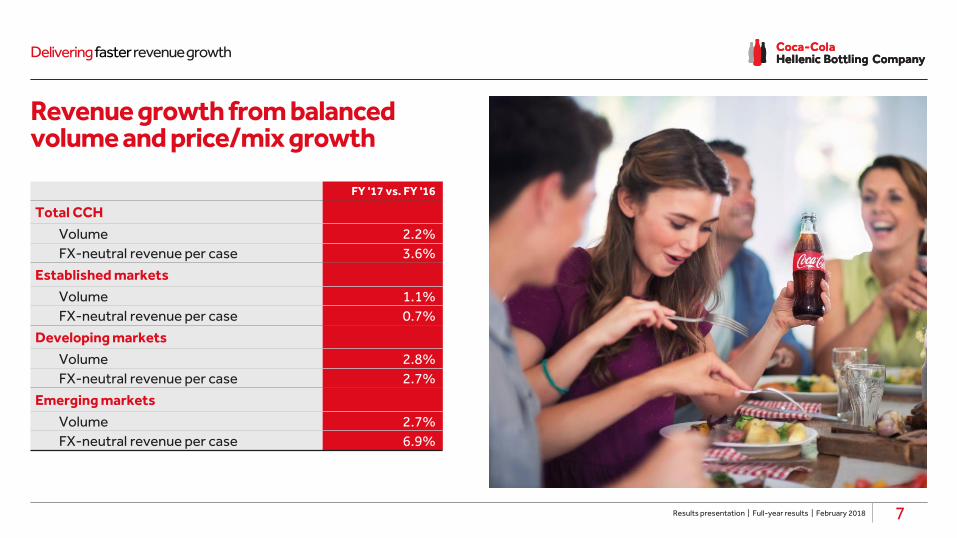
Revenue growth from balancedvolume and price/mix growth
FY '17 vs. FY '16
Total CCH
Volume 2.2%
FX-neutral revenue per case 3.6%
Established markets
Volume 1.1%
FX-neutral revenue per case 0.7%
Developing markets
Volume 2.8%
FX-neutral revenue per case 2.7%
Emerging markets
Volume 2.7%
FX-neutral revenue per case 6.9%
Careful management of input costs
Results presentation | Full-year results | February 2018 8
Input costs slightly better than expected • Input cost guidance was revised during
the year to the low end of mid single digits
• Input cost per case up 3.1% on an FX-neutral basis
• Contracts ensured favourable sugar costs
• PET resin prices increased, reflecting higher oil prices, offset by well-timed pre-buys
Lean platform driving profit growth
Results presentation | Full-year results | February 2018 9
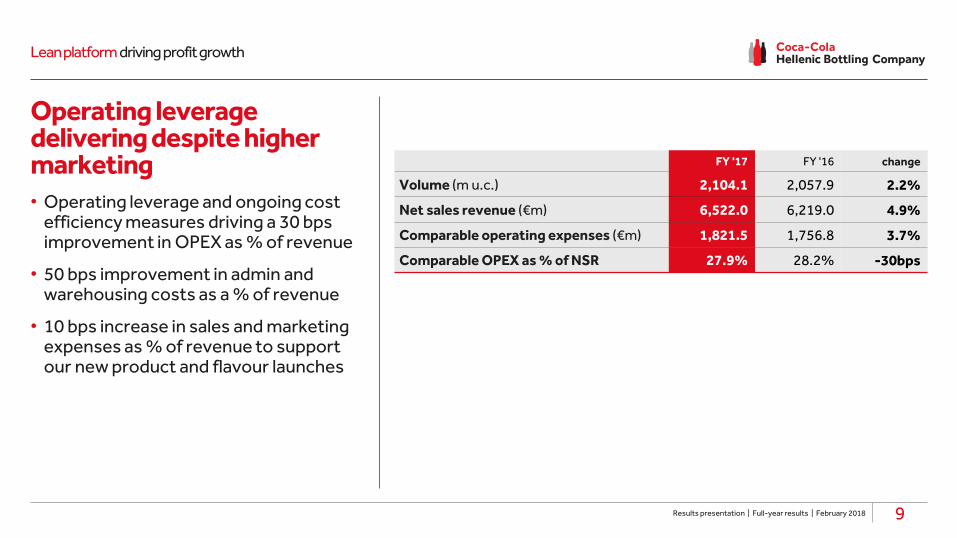
Operating leverage delivering despite higher marketing• Operating leverage and ongoing cost
efficiency measures driving a 30 bps improvement in OPEX as % of revenue
• 50 bps improvement in admin and warehousing costs as a % of revenue
• 10 bps increase in sales and marketing expenses as % of revenue to support our new product and flavour launches
FY '17 FY '16 change
Volume (m u.c.) 2,104.1 2,057.9 2.2%
Net sales revenue (€m) 6,522.0 6,219.0 4.9%
Comparable operating expenses (€m) 1,821.5 1,756.8 3.7%
Comparable OPEX as % of NSR 27.9% 28.2% -30bps

Profit and margin growth
Emerging markets delivering profitability
Results presentation | Full-year results | February 2018 10
Comparable EBIT(€m)
Comparable EBIT margin
Financial indicators on a comparable basis exclude the recognition of restructuring costs, unrealised commodity hedging results and non-recurring items. Certain differences in calculations are due to rounding.
Emerging
Developing
Established
Total CCH
+8
-5
+100
+103
FY '17 FY '16
250.4 242.3
92.3 97.1
278.3 178.1
621.0 517.5
FY '17 change
10.3% 20bps
7.9% -100bps
9.6% 300bps
9.5% 120bps
Comparable EBIT(change €m)
Maintaining a lean platform
Results presentation | Full-year results | February 2018
Restructuring plans
FY 2017 €29m of pre-tax restructuring costs in the period
Restructuring efforts focused mostly on the Established and Emerging markets
FY 2018Going forward we expect:• pre-tax restructuring charges totalling €11m for 2018• total annualised benefits from 2018 initiatives of c.€8m
• savings in 2018 from 2017 and 2018 initiatives of c.€7m
11
Operational profitability generating cash
Results presentation | Full-year results | February 2018 12
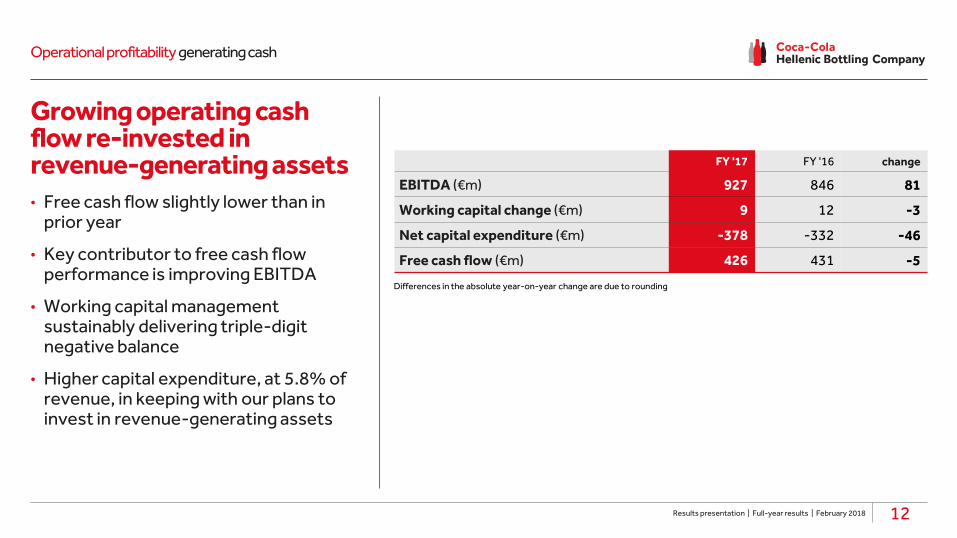
Growing operating cash flow re-invested in revenue-generating assets• Free cash flow slightly lower than in
prior year
• Key contributor to free cash flow performance is improving EBITDA
• Working capital management sustainably delivering triple-digit negative balance
• Higher capital expenditure, at 5.8% of revenue, in keeping with our plans to invest in revenue-generating assets
FY '17 FY '16 change
EBITDA (€m) 927 846 81
Working capital change (€m) 9 12 -3
Net capital expenditure (€m) -378 -332 -46
Free cash flow (€m) 426 431 -5
Differences in the absolute year-on-year change are due to rounding
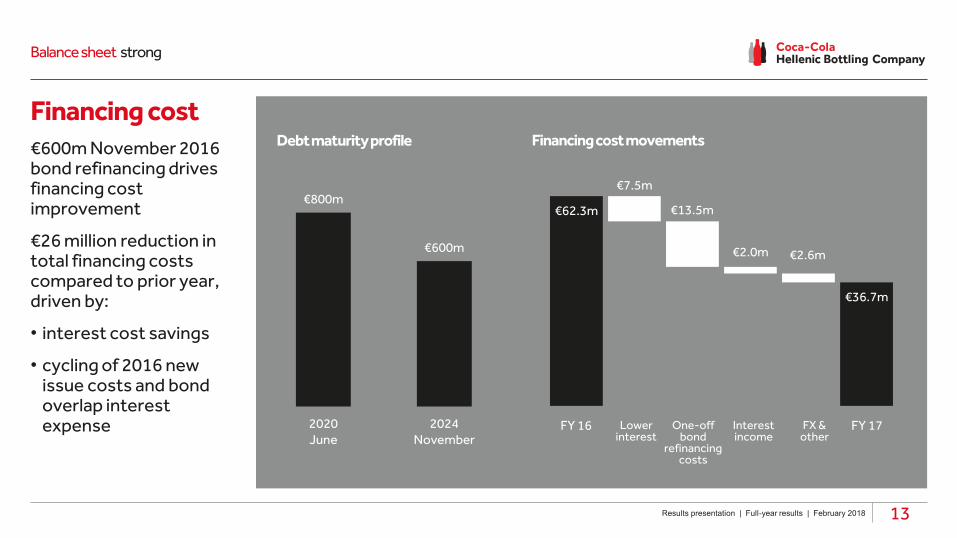
Financing cost€600m November 2016 bond refinancing drives financing cost improvement
€26 million reduction in total financing costs compared to prior year, driven by:
• interest cost savings
• cycling of 2016 new issue costs and bond overlap interest expense
Balance sheet strong
Results presentation | Full-year results | February 2018 13
€800m
€600m
2020June
2024November
Debt maturity profile
€62.3m
€36.7m
€7.5m
€13.5m
€2.0m €2.6m
Financing cost movements
FY 16 FY 17Lower interest
One-offbond
refinancing costs
Interest income
FX & other
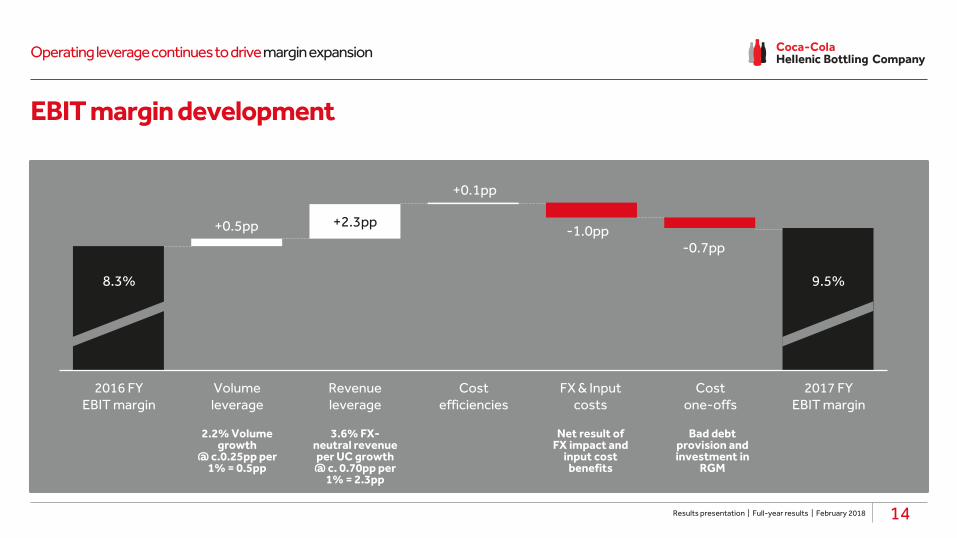
EBIT margin development
Operating leverage continues to drive margin expansion
2017 FYEBIT margin
FX & Input costs
Cost efficiencies
Revenue leverage
Volume leverage
2016 FY EBIT margin
2.2% Volume growth
@ c.0.25pp per 1% = 0.5pp
3.6% FX-neutral revenue per UC growth @ c. 0.70pp per
1% = 2.3pp
Net result of FX impact and
input cost benefits
Results presentation | Full-year results | February 2018 14
Cost one-offs
Bad debt provision and investment in
RGM
8.3%
+0.5pp
9.5%
+0.1pp
+2.3pp-1.0pp
-0.7pp

EN
ER
GIS
E
EV
OL
VE
UN
DE
RS
TA
ND
Operational reviewand strategyZoran Bogdanovic | Chief Executive Officer
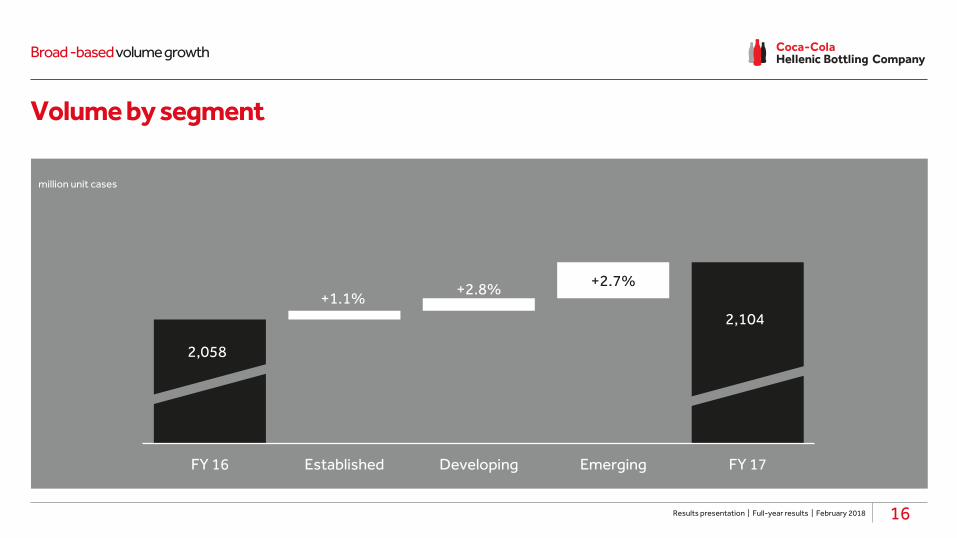
Volume by segment
Broad -based volume growth
Results presentation | Full-year results | February 2018 16
2,058
2,104
+1.1%+2.8%
+2.7%
FY 16 Established Developing Emerging FY 17
million unit cases
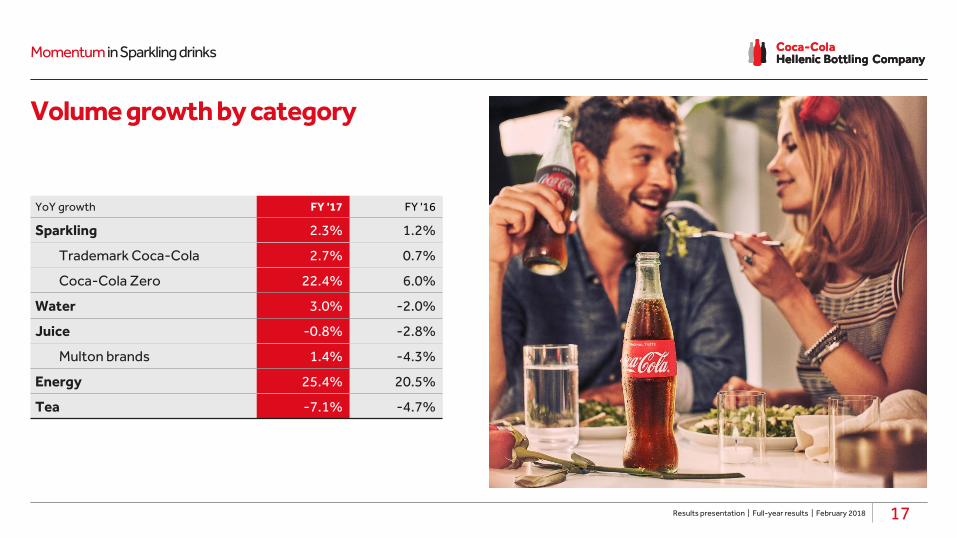
Momentum in Sparkling drinks
Results presentation | Full-year results | February 2018
Volume growth by category
17
YoY growth FY '17 FY '16
Sparkling 2.3% 1.2%
Trademark Coca-Cola 2.7% 0.7%
Coca-Cola Zero 22.4% 6.0%
Water 3.0% -2.0%
Juice -0.8% -2.8%
Multon brands 1.4% -4.3%
Energy 25.4% 20.5%
Tea -7.1% -4.7%

Established markets
Focusing on innovation and value
All figures refer to half-year 2017, unless otherwise stated
-1%Trademark Coca-Cola
+14%Coca-Cola
Zero
+5%Water
+1.1%Volume
+0.7%Currency-neutral net sales revenue
per case
Results presentation | Full-year results | February 2018
Switzerland
Good growth in Water and Coca-Cola Zero
Decline driven by Coca-Cola Regular and RTD Tea
18
Italy
Stable volumes excluding the impact of Water de-listing
Water growing despite the delisting of low value brands
Sparkling decline –good growth from Coke Zero
Greece
Good volume performance driven by Water, Sparkling and Energy
Launch of Coca-Cola with Stevia and zero calories in March

Developing markets
A much stronger second half
All figures refer to half-year 2017, unless otherwise stated
+4%Trademark Coca-Cola
+28%Coca-Cola
Zero
-2%Water
+2.8%Volume
+2.7%Currency-neutral net sales revenue
per case
Results presentation | Full-year results | February 2018 19
Hungary
Remains a strong market
All categories grew, helped by innovation and good weather
Poland
Volume growth accelerated through the year
Growth in Sparkling and Energy
Declines in Water and Juice
Czech Republic
Volume up 6%
All categories grew except for Water
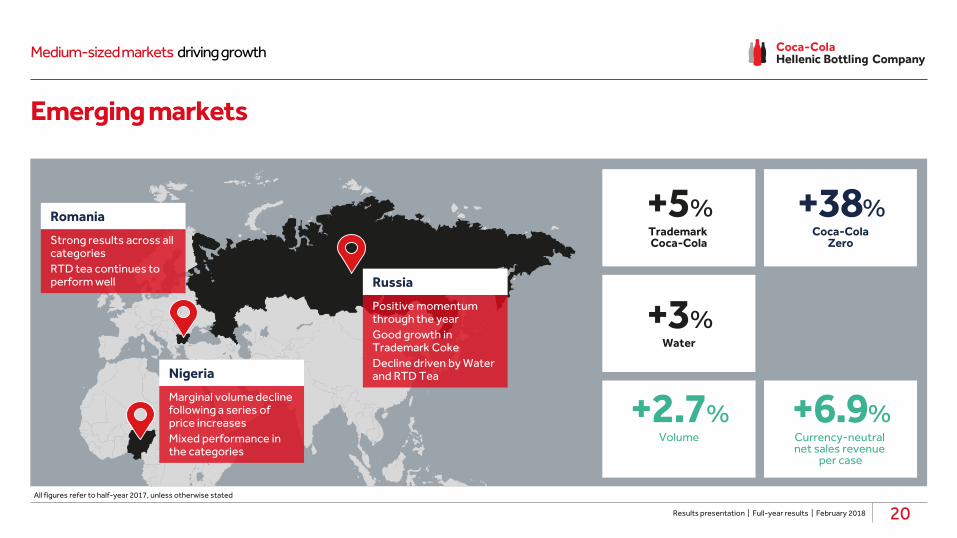
Emerging markets
Medium-sized markets driving growth
Results presentation | Full-year results | February 2018 20All figures refer to half-year 2017, unless otherwise stated
+5%Trademark Coca-Cola
+38%Coca-Cola
Zero
+3%Water
+2.7%Volume
+6.9%Currency-neutral net sales revenue
per case
Nigeria
Marginal volume decline following a series of price increases
Mixed performance in the categories
Russia
Positive momentum through the year
Good growth in Trademark Coke
Decline driven by Water and RTD Tea
Romania
Strong results across all categories
RTD tea continues to perform well
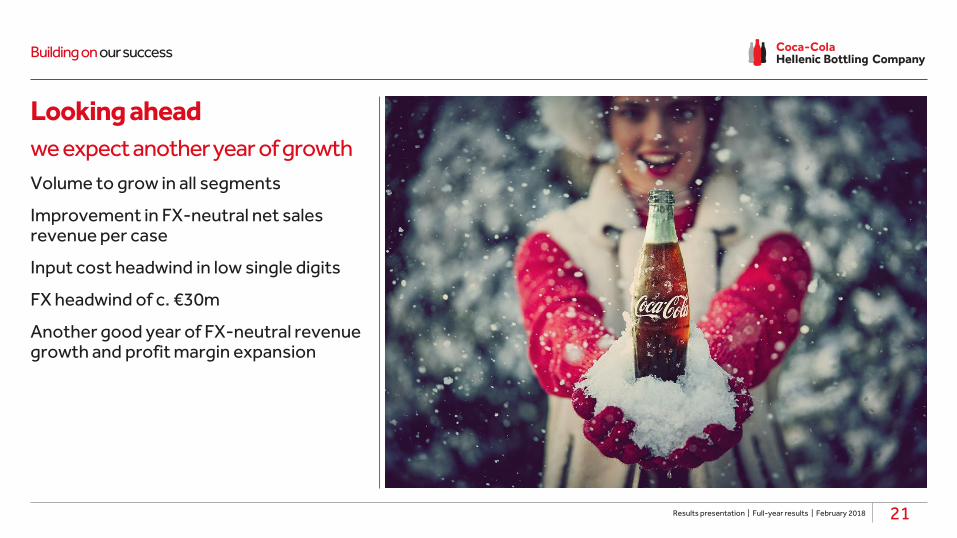
Building on our success
Results presentation | Full-year results | February 2018 21
Looking ahead
we expect another year of growth
Volume to grow in all segments
Improvement in FX-neutral net sales revenue per case
Input cost headwind in low single digits
FX headwind of c. €30m
Another good year of FX-neutral revenue growth and profit margin expansion

EN
ER
GIS
E
EV
OL
VE
UN
DE
RS
TA
ND
Q&A
For further information on Coca-Cola Hellenic please visit our website at: www.coca-colahellenic.com
Or contact our investor relations team [email protected]+30.210.6183 100
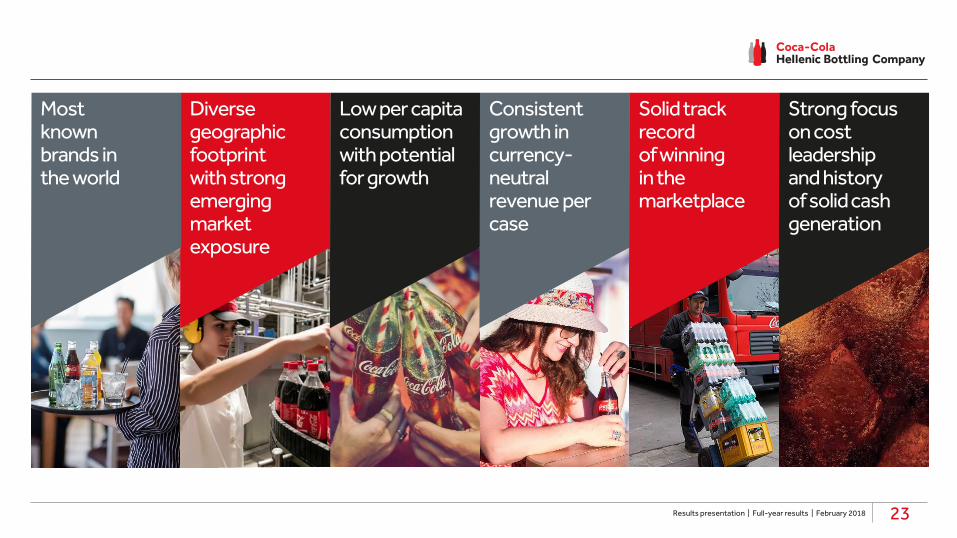
Diverse geographic footprint with strong emerging market exposure
Results presentation | Full-year results | February 2018 23
Low per capita consumption with potential for growth
Consistent growth in currency-neutral revenue per case
Solid track record of winningin the marketplace
Strong focus on cost leadership and history of solid cash generation
Most known brands in the world