Embed Size (px)
Citation preview

RESULTS PRESENTATION
FOR THE YEAR ENDED 30 NOVEMBER 2017
2
AGENDA
Overview
The Hudaco business model
Operating segments and acquisitions update
Financial review
Outlook
3
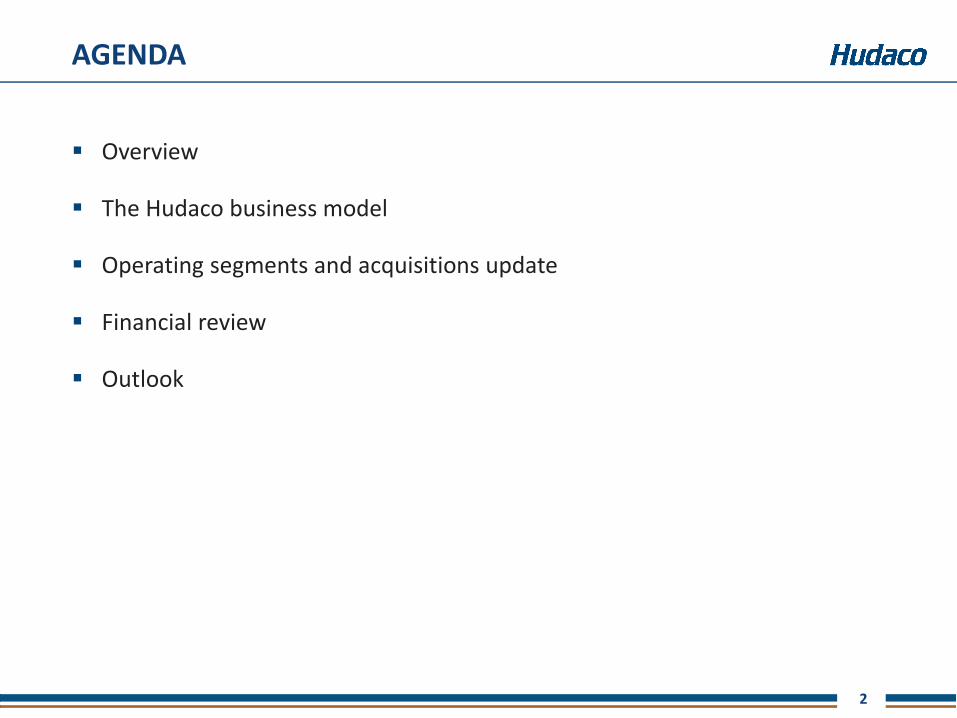
OVERVIEW
Low business confidence (cabinet reshuffle, downgrades, state capture, corruption and unworkable new mining charter)
Difficult economy - pleasing results
Proven track record with acquisitions - manage them well
Powder for more acquisitions
Cash generation matches profit
ROE well in excess of cost of capital
Working capital have been well managed considering the volatility of the Rand
Corporate structure straight forward
Board changes - April 2018
• Stephen Connelly - Chairman
• Daisy Naidoo - Lead Independent Non-Executive
4
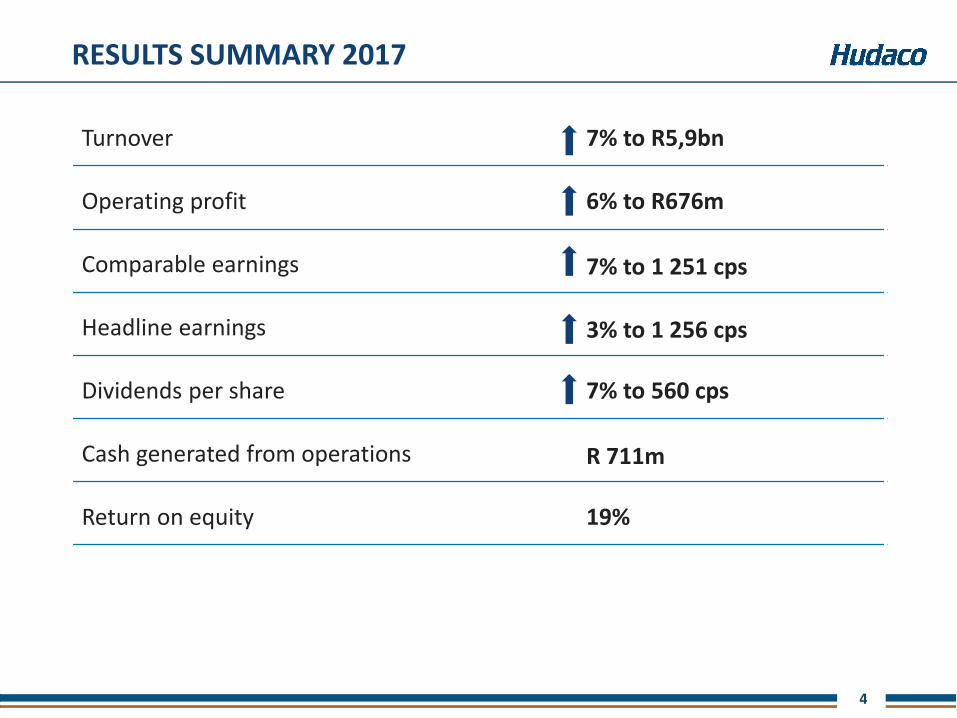
RESULTS SUMMARY 2017
Turnover 7% to R5,9bn
Operating profit 6% to R676m
Comparable earnings 7% to 1 251 cps
Headline earnings 3% to 1 256 cps
Dividends per share 7% to 560 cps
Cash generated from operations R 711m
Return on equity 19%
5
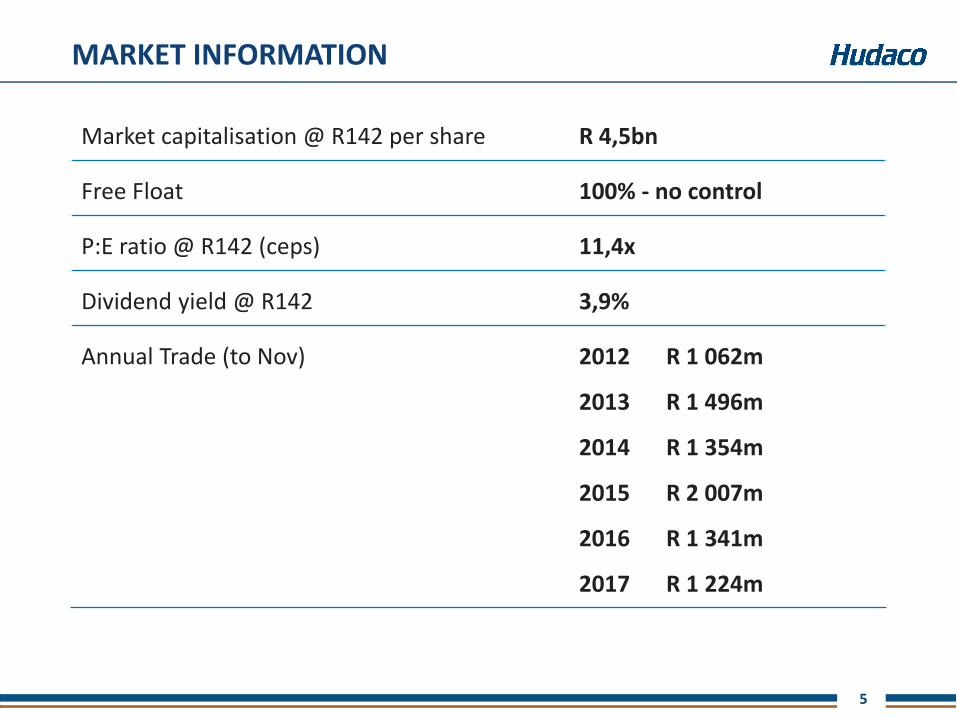
MARKET INFORMATION
Market capitalisation @ R142 per share R 4,5bn
Free Float 100% - no control
P:E ratio @ R142 (ceps) 11,4x
Dividend yield @ R142 3,9%
Annual Trade (to Nov) 2012
2013
2014
2015
2016
2017
R 1 062m
R 1 496m
R 1 354m
R 2 007m
R 1 341m
R 1 224m
6
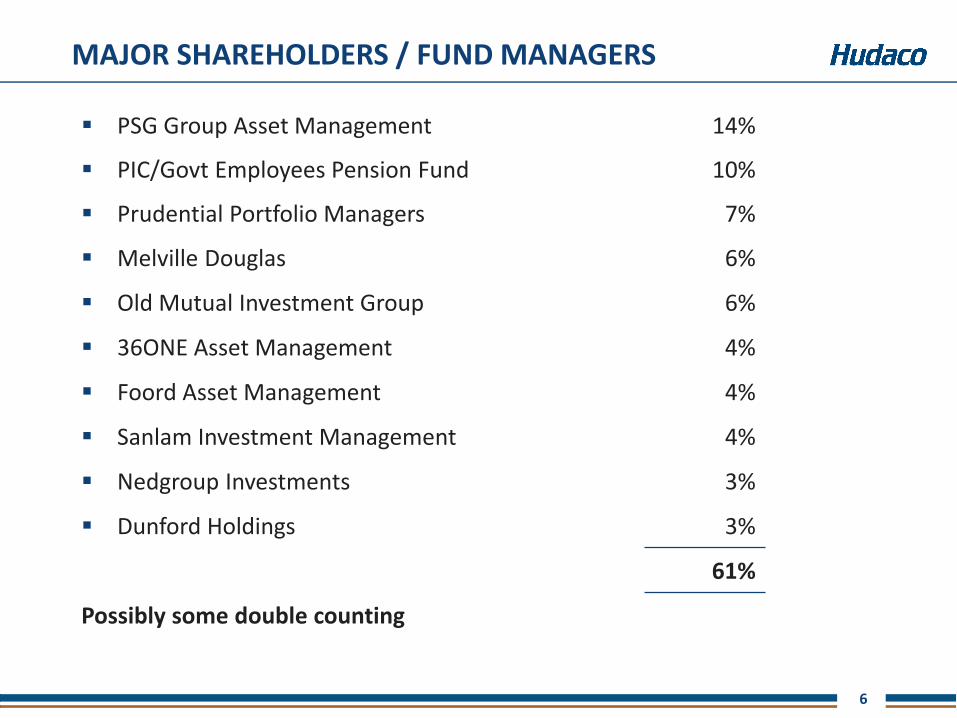
MAJOR SHAREHOLDERS / FUND MANAGERS
PSG Group Asset Management 14%
PIC/Govt Employees Pension Fund 10%
Prudential Portfolio Managers 7%
Melville Douglas 6%
Old Mutual Investment Group 6%
36ONE Asset Management 4%
Foord Asset Management 4%
Sanlam Investment Management 4%
Nedgroup Investments 3%
Dunford Holdings 3%
61%
Possibly some double counting

7
THE HUDACO BUSINESS MODEL
8
THE HUDACO BUSINESS MODEL
Hudaco’s main business is the importation and distribution of high-quality branded automotive, industrial and electrical consumable products
The concept of “value added distribution” is core to our business model
Agency agreements generally restrict our activities to Africa south of the equator
Hudaco is heavily dependent on two important factors
• South Africa’s GDP growth rate (economy in recession for the part of the year)
• Rand exchange rate (very volatile throughout the year)
9
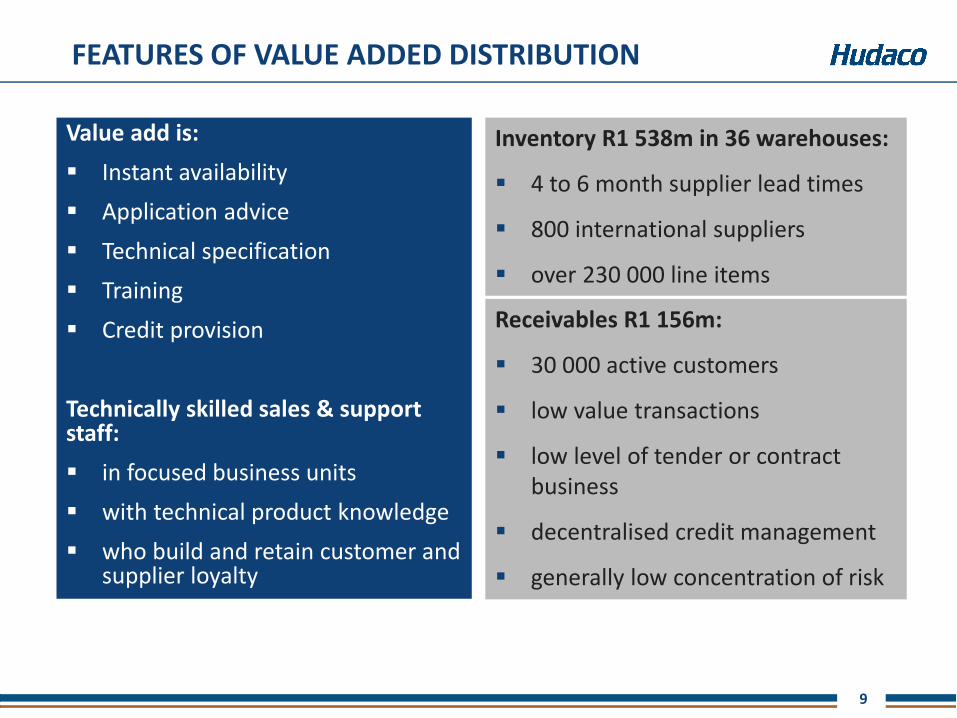
FEATURES OF VALUE ADDED DISTRIBUTION
Value add is:
Instant availability
Application advice
Technical specification
Training
Credit provision
Technically skilled sales & support staff:
in focused business units
with technical product knowledge
who build and retain customer and supplier loyalty
Inventory R1 538m in 36 warehouses:
4 to 6 month supplier lead times
800 international suppliers
over 230 000 line items
Receivables R1 156m:
30 000 active customers
low value transactions
low level of tender or contract business
decentralised credit management
generally low concentration of risk
10
OPERATING SEGMENTS AND ACQUISITIONS UPDATE
11
OPERATING SEGMENTS
Consumer-related products segment distributes products driven by
consumer spending and generally sold to installers
Engineering consumables segment imports and distributes branded
engineering consumables generally used in the repair and maintenance of
machines
12
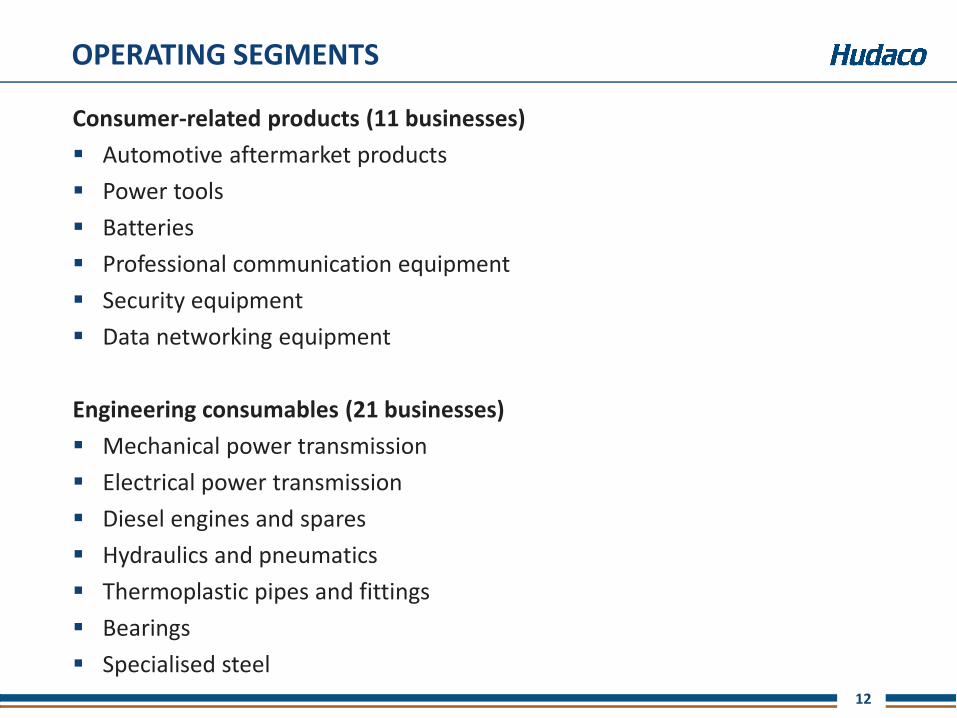
OPERATING SEGMENTS
Consumer-related products (11 businesses)
Automotive aftermarket products
Power tools
Batteries
Professional communication equipment
Security equipment
Data networking equipment
Engineering consumables (21 businesses)
Mechanical power transmission
Electrical power transmission
Diesel engines and spares
Hydraulics and pneumatics
Thermoplastic pipes and fittings
Bearings
Specialised steel
13
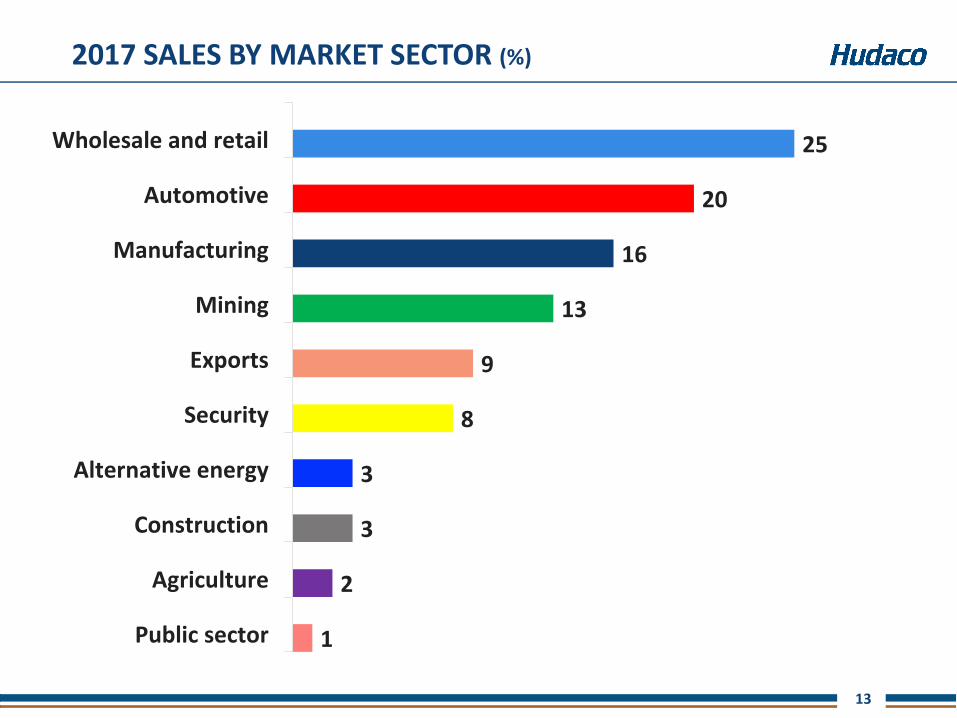
2017 SALES BY MARKET SECTOR (%)
1
2
3
3
8
9
13
16
20
25
Public sector
Agriculture
Construction
Alternative energy
Security
Exports
Mining
Manufacturing
Automotive
Wholesale and retail
14
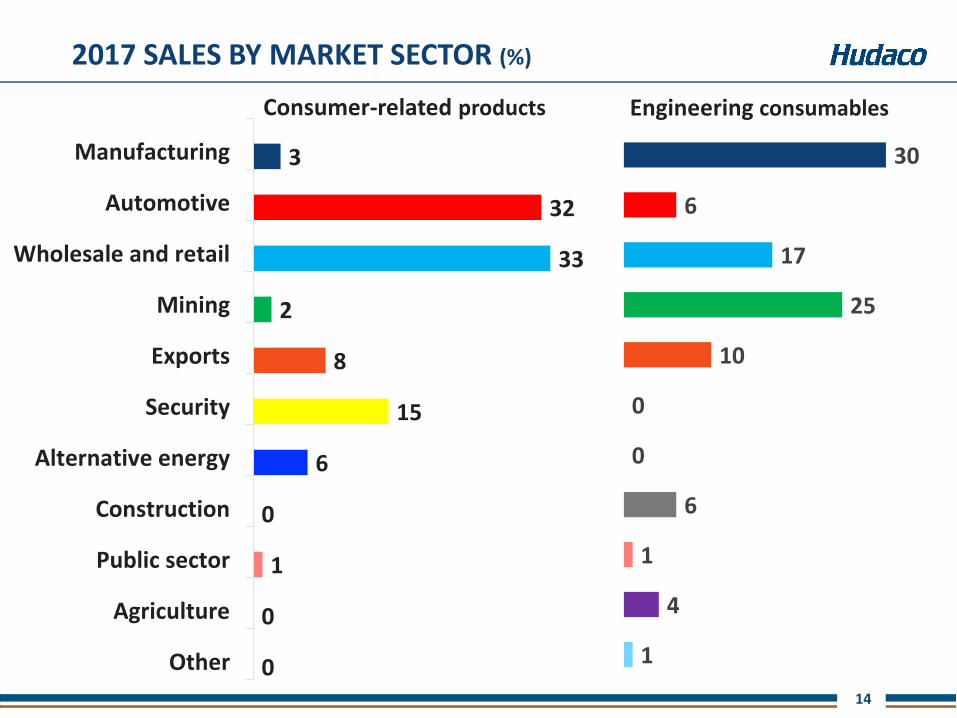
2017 SALES BY MARKET SECTOR (%)
0
0
1
0
6
15
8
2
33
32
3
Other
Agriculture
Public sector
Construction
Alternative energy
Security
Exports
Mining
Wholesale and retail
Automotive
Manufacturing
Consumer-related products
1
4
1
6
0
0
10
25
17
6
30
Engineering consumables
15
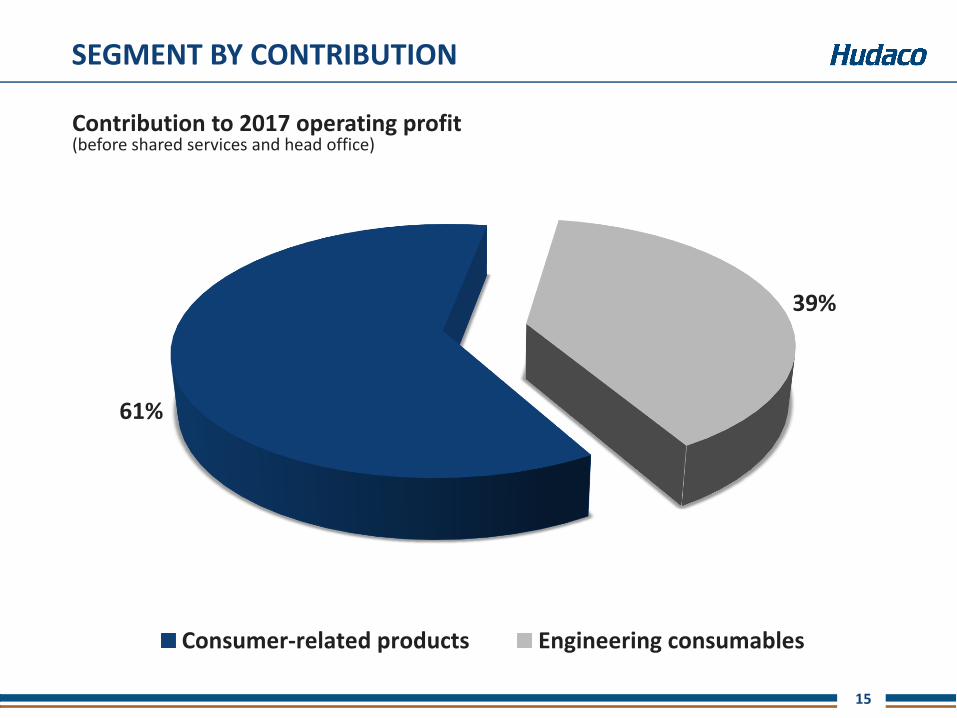
Contribution to 2017 operating profit (before shared services and head office)
61%
39%
Consumer-related products Engineering consumables
SEGMENT BY CONTRIBUTION
16
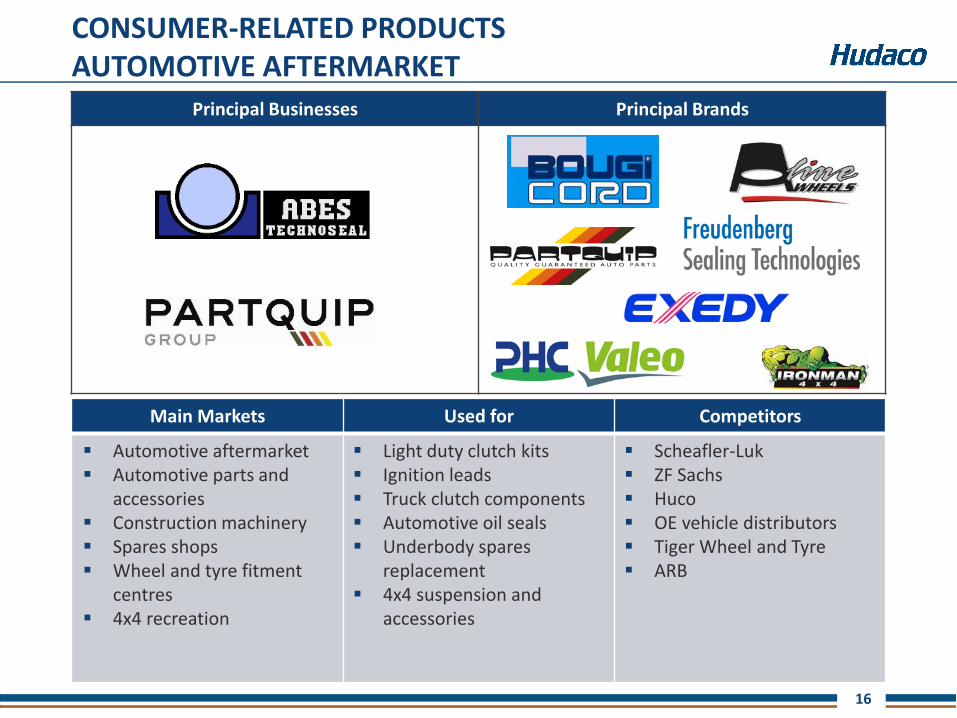
Principal Businesses Principal Brands
CONSUMER-RELATED PRODUCTSAUTOMOTIVE AFTERMARKET
Main Markets Used for Competitors
Automotive aftermarket Automotive parts and
accessories Construction machinery Spares shops Wheel and tyre fitment
centres 4x4 recreation
Light duty clutch kits Ignition leads Truck clutch components Automotive oil seals Underbody spares
replacement 4x4 suspension and
accessories
Scheafler-Luk ZF Sachs Huco OE vehicle distributors Tiger Wheel and Tyre ARB
17
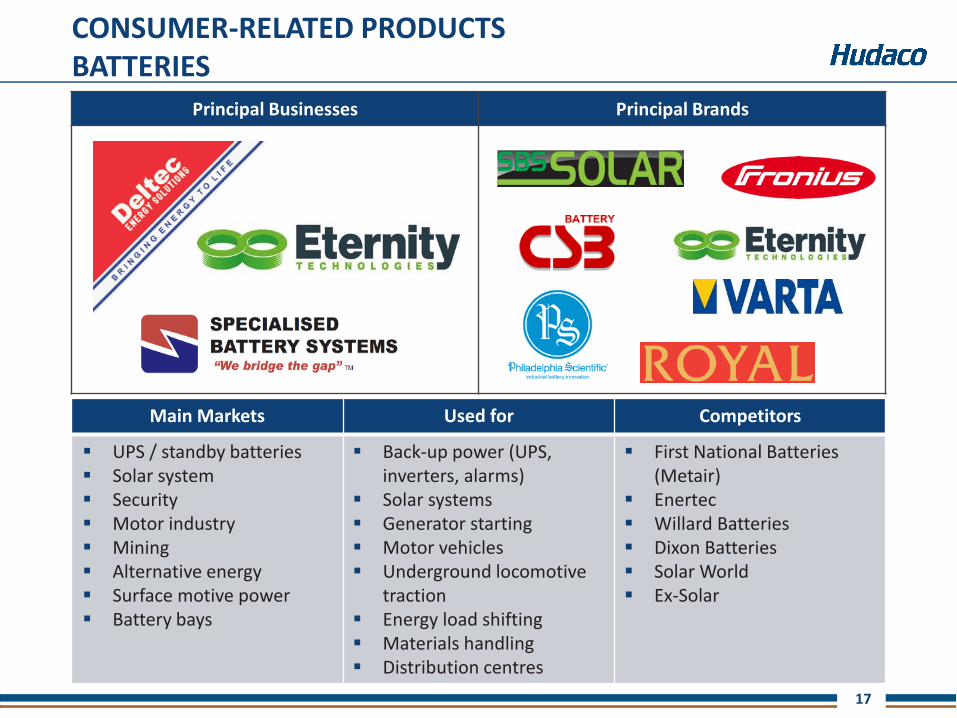
Principal Businesses Principal Brands
CONSUMER-RELATED PRODUCTSBATTERIES
Main Markets Used for Competitors
UPS / standby batteries Solar system Security Motor industry Mining Alternative energy Surface motive power Battery bays
Back-up power (UPS, inverters, alarms)
Solar systems Generator starting Motor vehicles Underground locomotive
traction Energy load shifting Materials handling Distribution centres
First National Batteries (Metair)
Enertec Willard Batteries Dixon Batteries Solar World Ex-Solar
18
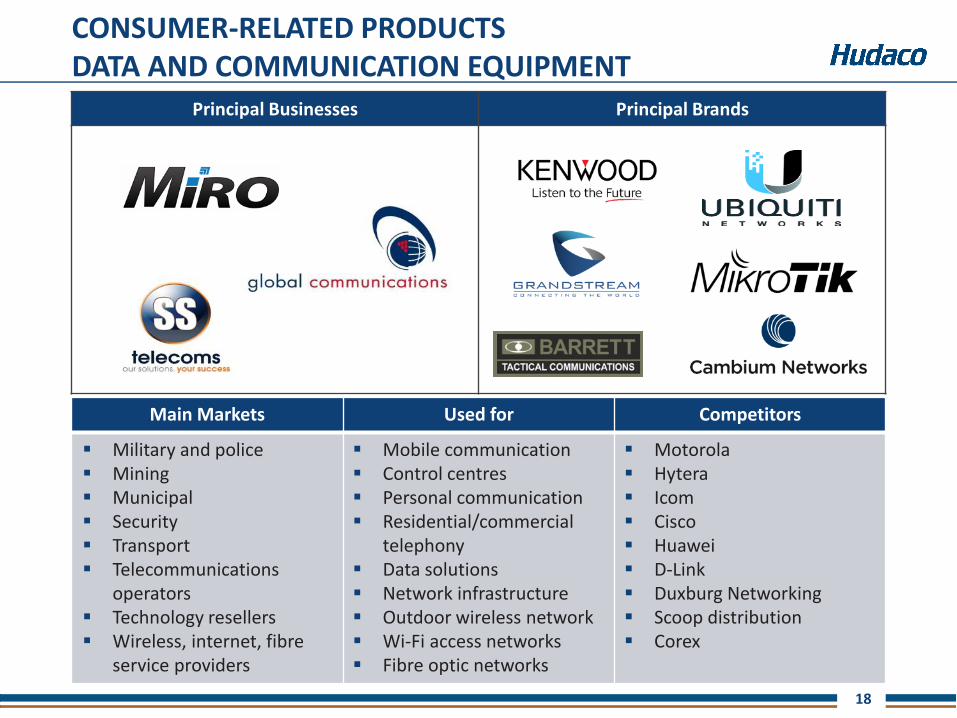
Principal Businesses Principal Brands
CONSUMER-RELATED PRODUCTSDATA AND COMMUNICATION EQUIPMENT
Main Markets Used for Competitors
Military and police Mining Municipal Security Transport Telecommunications
operators Technology resellers Wireless, internet, fibre
service providers
Mobile communication Control centres Personal communication Residential/commercial
telephony Data solutions Network infrastructure Outdoor wireless network Wi-Fi access networks Fibre optic networks
Motorola Hytera Icom Cisco Huawei D-Link Duxburg Networking Scoop distribution Corex
19
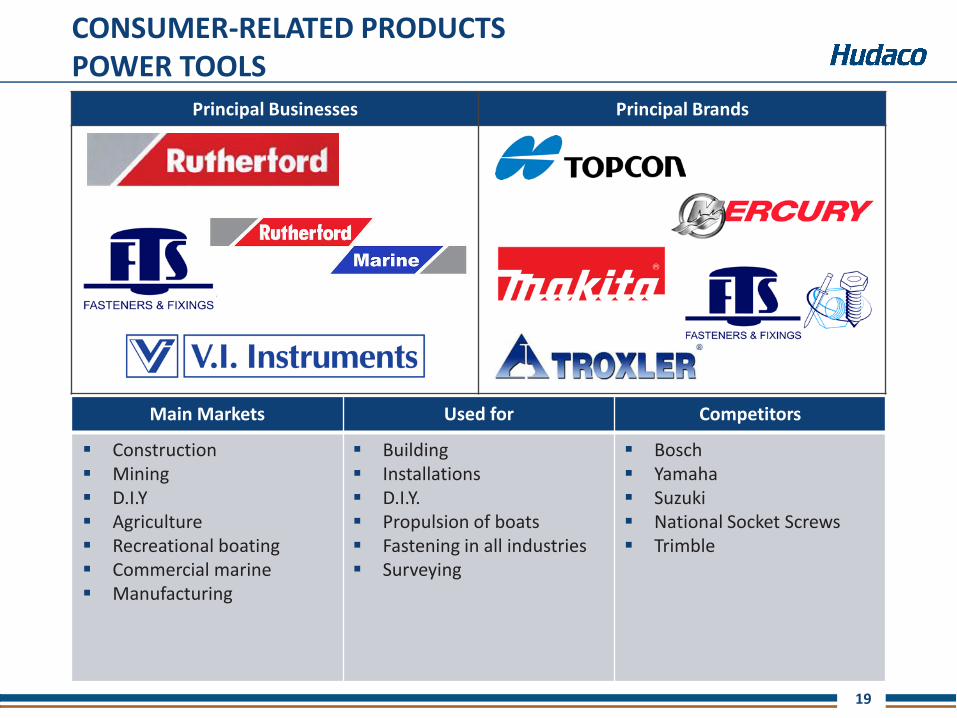
Principal Businesses Principal Brands
CONSUMER-RELATED PRODUCTSPOWER TOOLS
Main Markets Used for Competitors
Construction Mining D.I.Y Agriculture Recreational boating Commercial marine Manufacturing
Building Installations D.I.Y. Propulsion of boats Fastening in all industries Surveying
Bosch Yamaha Suzuki National Socket Screws Trimble
20
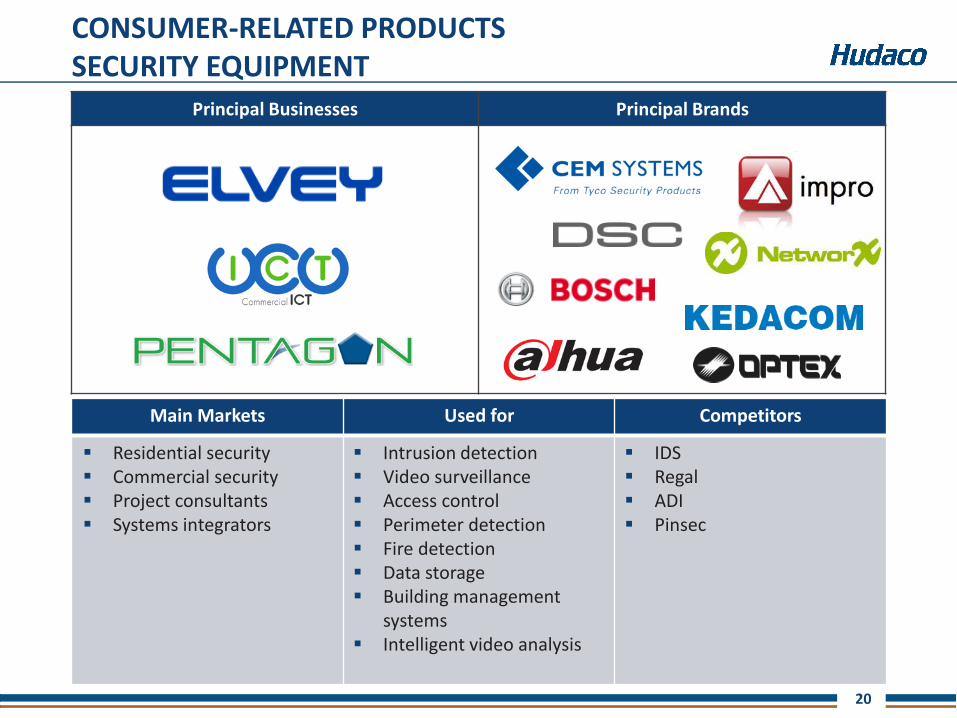
Principal Businesses Principal Brands
CONSUMER-RELATED PRODUCTSSECURITY EQUIPMENT
Main Markets Used for Competitors
Residential security Commercial security Project consultants Systems integrators
Intrusion detection Video surveillance Access control Perimeter detection Fire detection Data storage Building management
systems Intelligent video analysis
IDS Regal ADI Pinsec
21
Principal Businesses Principal Brands
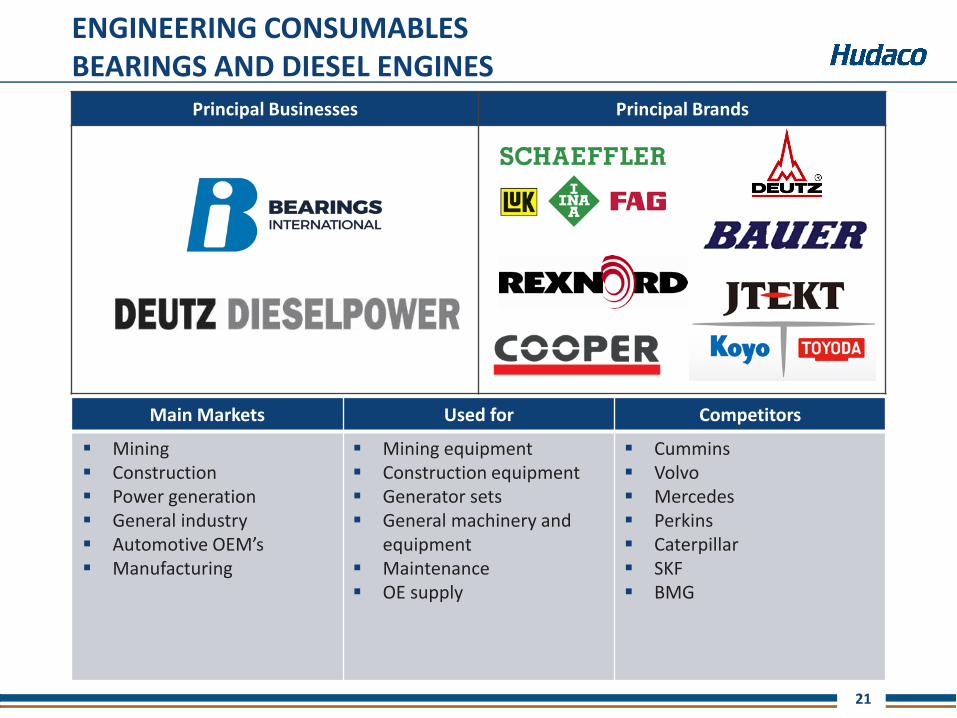
ENGINEERING CONSUMABLESBEARINGS AND DIESEL ENGINES
Main Markets Used for Competitors
Mining Construction Power generation General industry Automotive OEM’s Manufacturing
Mining equipment Construction equipment Generator sets General machinery and
equipment Maintenance OE supply
Cummins Volvo Mercedes Perkins Caterpillar SKF BMG
22
Principal Businesses Principal Brands
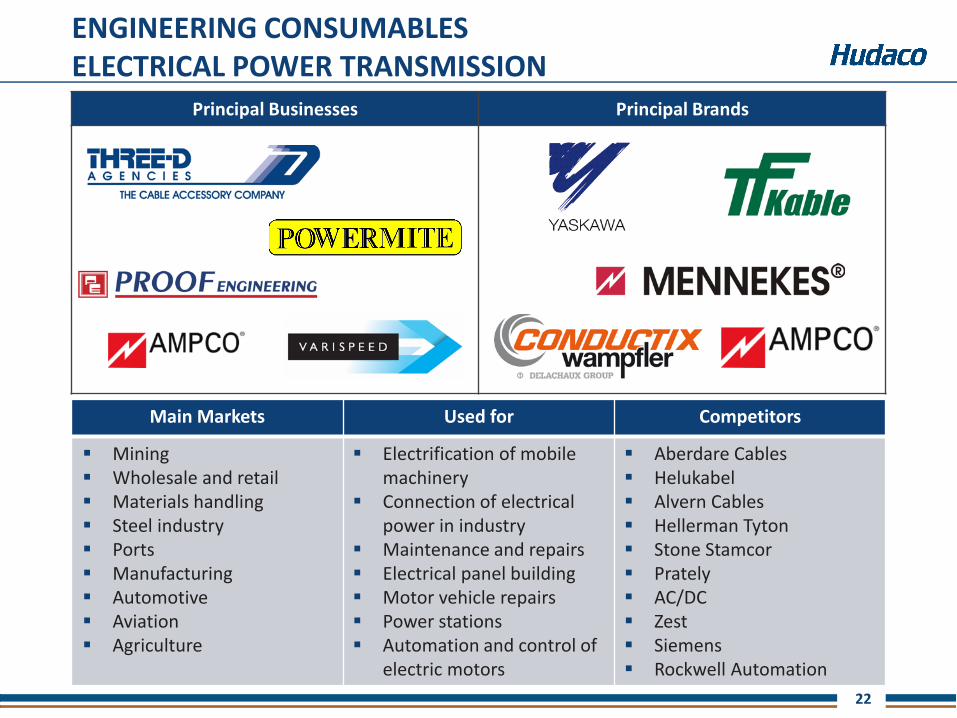
ENGINEERING CONSUMABLESELECTRICAL POWER TRANSMISSION
Main Markets Used for Competitors
Mining Wholesale and retail Materials handling Steel industry Ports Manufacturing Automotive Aviation Agriculture
Electrification of mobile machinery
Connection of electrical power in industry
Maintenance and repairs Electrical panel building Motor vehicle repairs Power stations Automation and control of
electric motors
Aberdare Cables Helukabel Alvern Cables Hellerman Tyton Stone Stamcor Prately AC/DC Zest Siemens Rockwell Automation
23
Principal Businesses Principal Brands
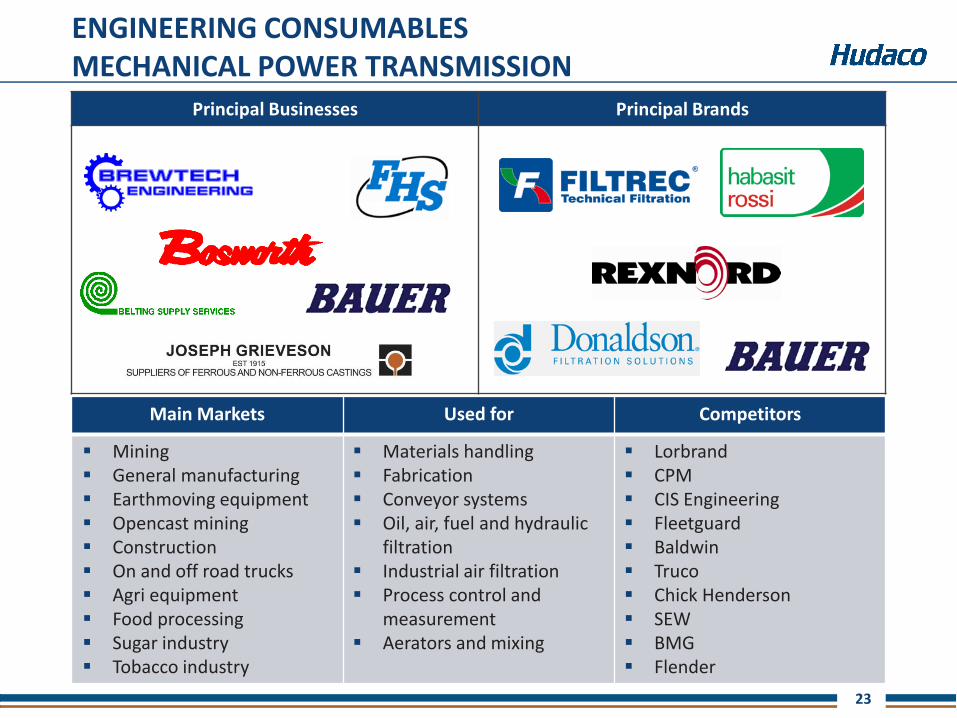
ENGINEERING CONSUMABLESMECHANICAL POWER TRANSMISSION
Main Markets Used for Competitors
Mining General manufacturing Earthmoving equipment Opencast mining Construction On and off road trucks Agri equipment Food processing Sugar industry Tobacco industry
Materials handling Fabrication Conveyor systems Oil, air, fuel and hydraulic
filtration Industrial air filtration Process control and
measurement Aerators and mixing
Lorbrand CPM CIS Engineering Fleetguard Baldwin Truco Chick Henderson SEW BMG Flender
24
Principal Businesses Principal Brands
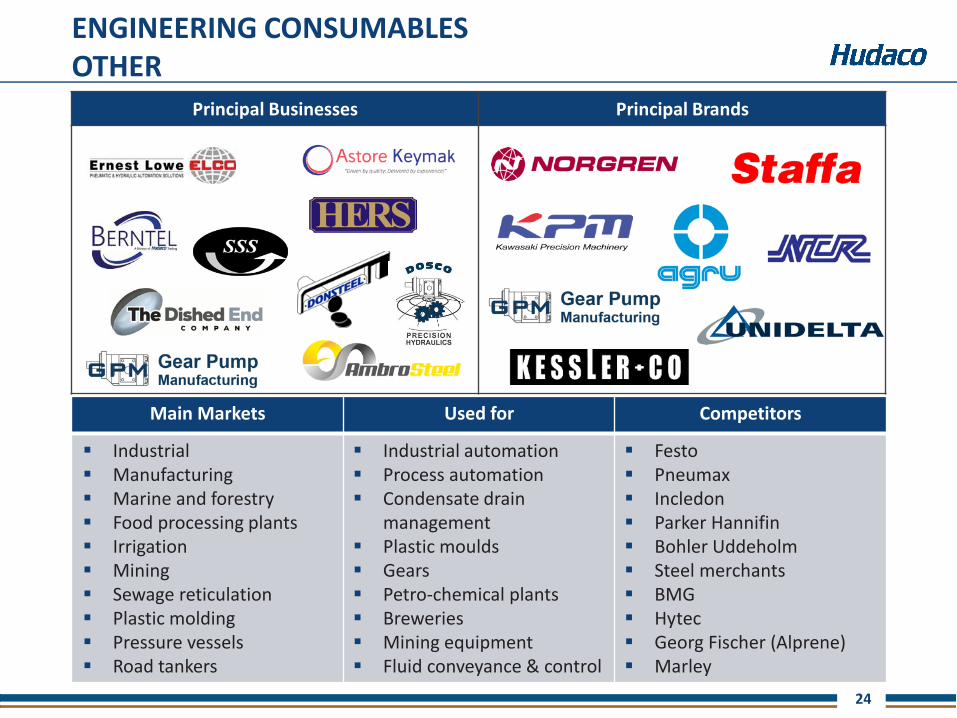
ENGINEERING CONSUMABLESOTHER
Main Markets Used for Competitors
Industrial Manufacturing Marine and forestry Food processing plants Irrigation Mining Sewage reticulation Plastic molding Pressure vessels Road tankers
Industrial automation Process automation Condensate drain
management Plastic moulds Gears Petro-chemical plants Breweries Mining equipment Fluid conveyance & control
Festo Pneumax Incledon Parker Hannifin Bohler Uddeholm Steel merchants BMG Hytec Georg Fischer (Alprene) Marley
25
Many businesses across many sectors
Many products in many industries
Diversification reduces risk
Decentralised focused management - specialists
Control and accountability
Key performance drivers
DECENTRALISED STRUCTURE
26
Successful bolt-ons and acquisitions in stronger economic sectors are continuing to diversify our revenue base
2016
HERS
All-Trade
MiRO
Brewtech Engineering
2017
The Dished End Company
Eternity Technologies
Gear Pump Distributors – UK
SS Telecoms
Commercial ICT
ACQUISITIONS
27
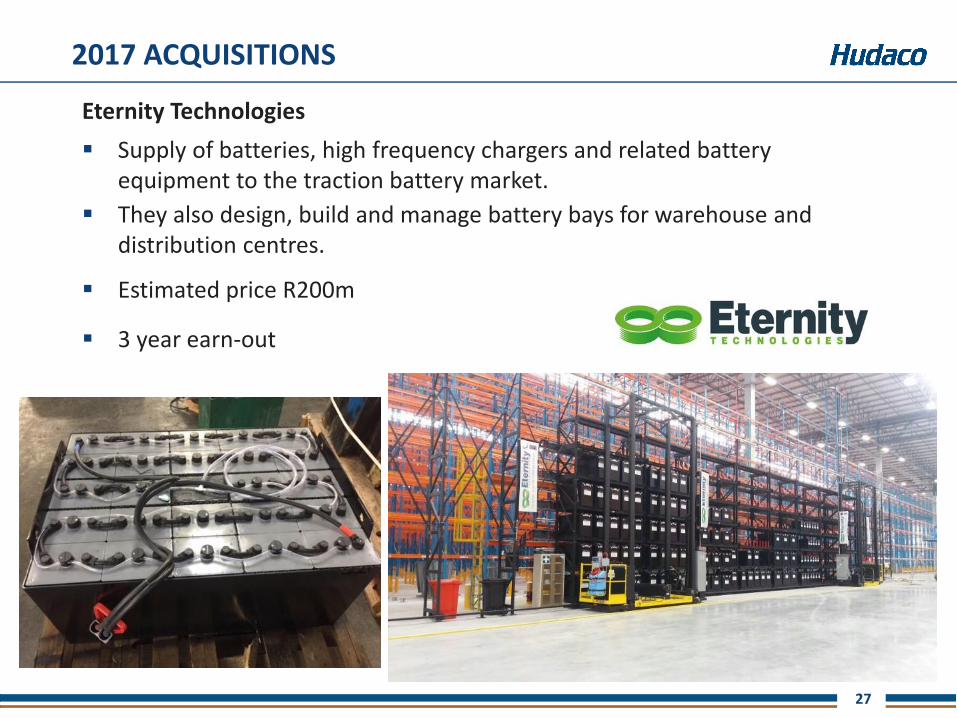
Eternity Technologies
Supply of batteries, high frequency chargers and related battery equipment to the traction battery market.
They also design, build and manage battery bays for warehouse and distribution centres.
Estimated price R200m
3 year earn-out
2017 ACQUISITIONS
28
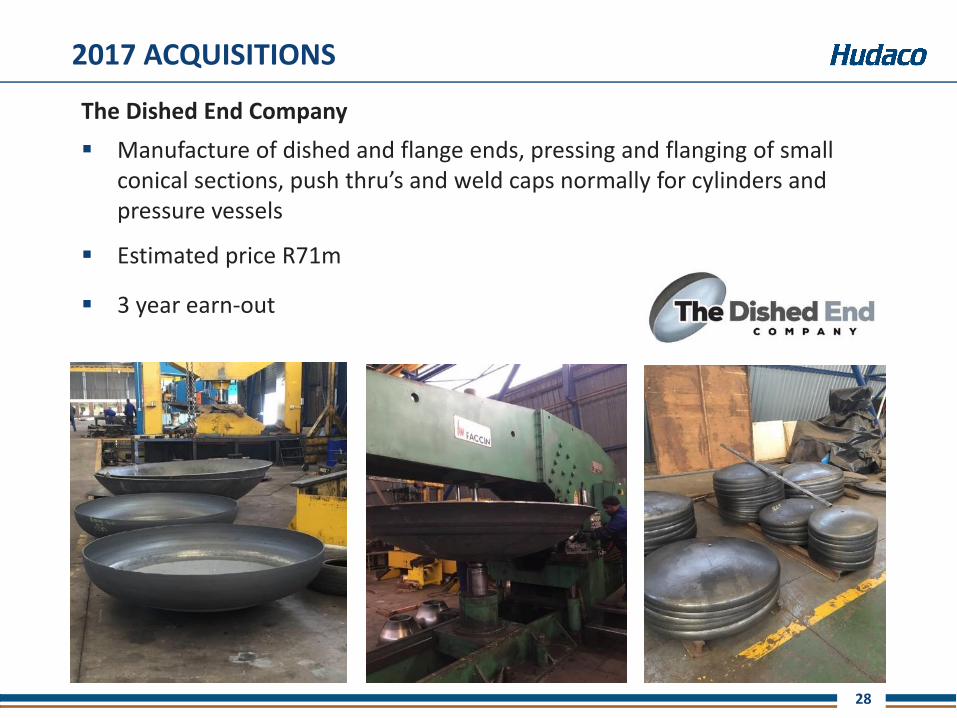
The Dished End Company
Manufacture of dished and flange ends, pressing and flanging of small conical sections, push thru’s and weld caps normally for cylinders and pressure vessels
Estimated price R71m
3 year earn-out
2017 ACQUISITIONS
29
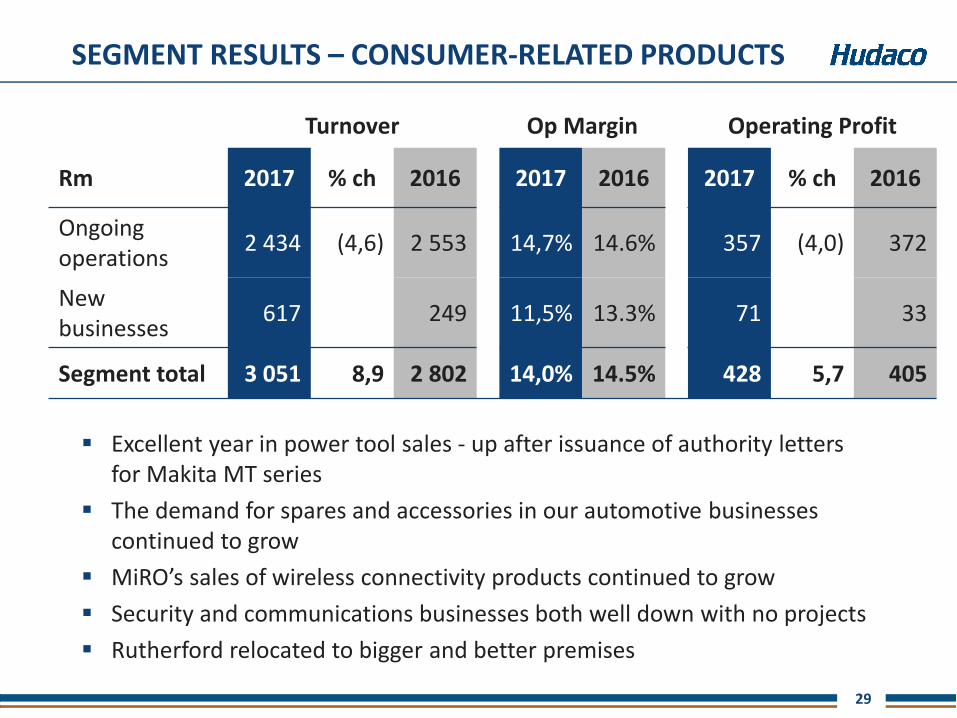
SEGMENT RESULTS – CONSUMER-RELATED PRODUCTS
Turnover Op Margin Operating Profit
Rm 2017 % ch 2016 2017 2016 2017 % ch 2016
Ongoing operations
2 434 (4,6) 2 553 14,7% 14.6% 357 (4,0) 372
New businesses
617 249 11,5% 13.3% 71 33
Segment total 3 051 8,9 2 802 14,0% 14.5% 428 5,7 405
Excellent year in power tool sales - up after issuance of authority letters for Makita MT series
The demand for spares and accessories in our automotive businesses continued to grow
MiRO’s sales of wireless connectivity products continued to grow
Security and communications businesses both well down with no projects
Rutherford relocated to bigger and better premises
30
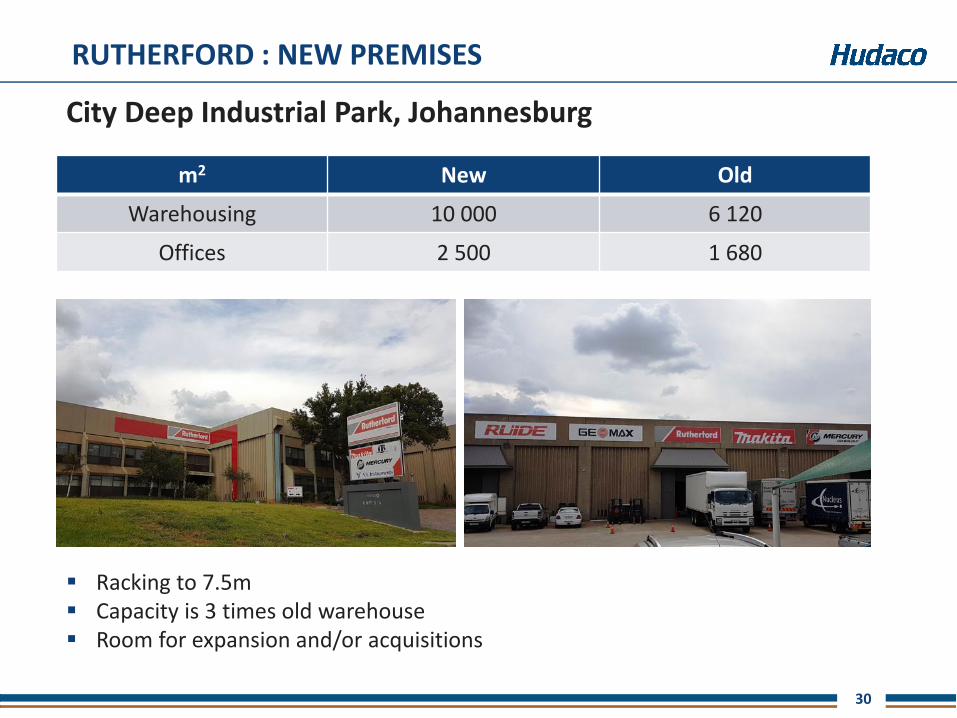
RUTHERFORD : NEW PREMISES
City Deep Industrial Park, Johannesburg
m2 New Old
Warehousing 10 000 6 120
Offices 2 500 1 680
Racking to 7.5m Capacity is 3 times old warehouse Room for expansion and/or acquisitions
31
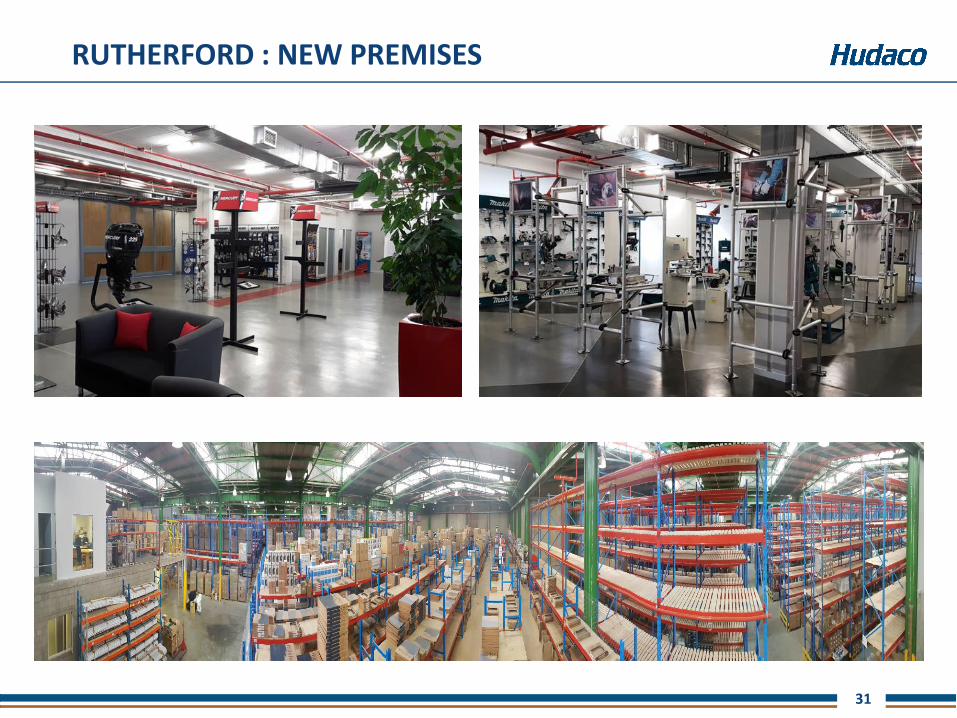
RUTHERFORD : NEW PREMISES
32
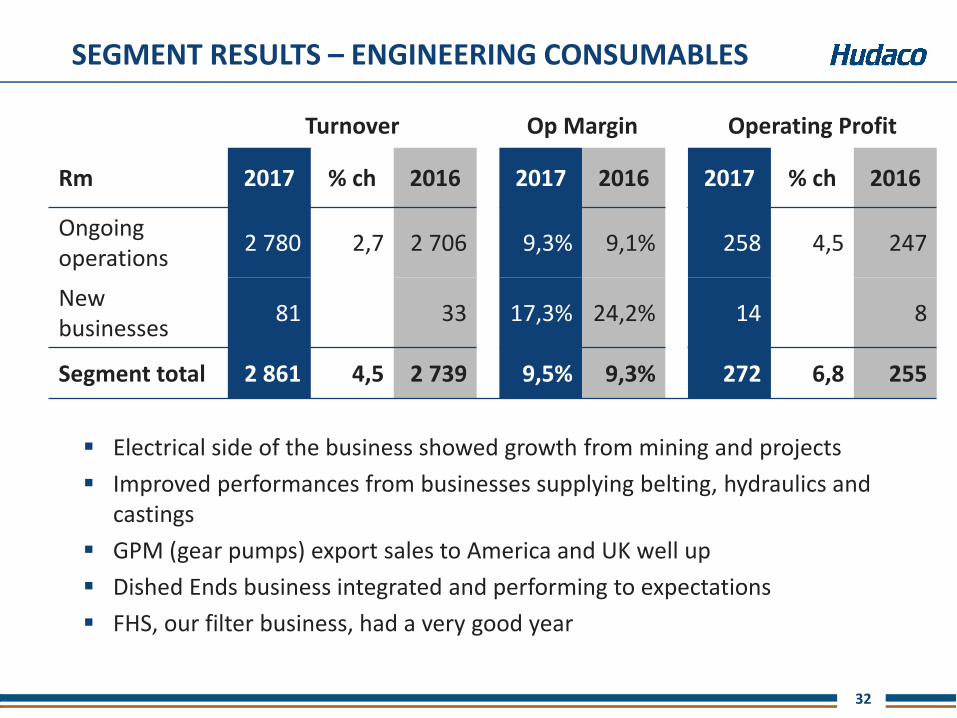
SEGMENT RESULTS – ENGINEERING CONSUMABLES
Turnover Op Margin Operating Profit
Rm 2017 % ch 2016 2017 2016 2017 % ch 2016
Ongoing operations
2 780 2,7 2 706 9,3% 9,1% 258 4,5 247
New businesses
81 33 17,3% 24,2% 14 8
Segment total 2 861 4,5 2 739 9,5% 9,3% 272 6,8 255
Electrical side of the business showed growth from mining and projects
Improved performances from businesses supplying belting, hydraulics and castings
GPM (gear pumps) export sales to America and UK well up
Dished Ends business integrated and performing to expectations
FHS, our filter business, had a very good year
33
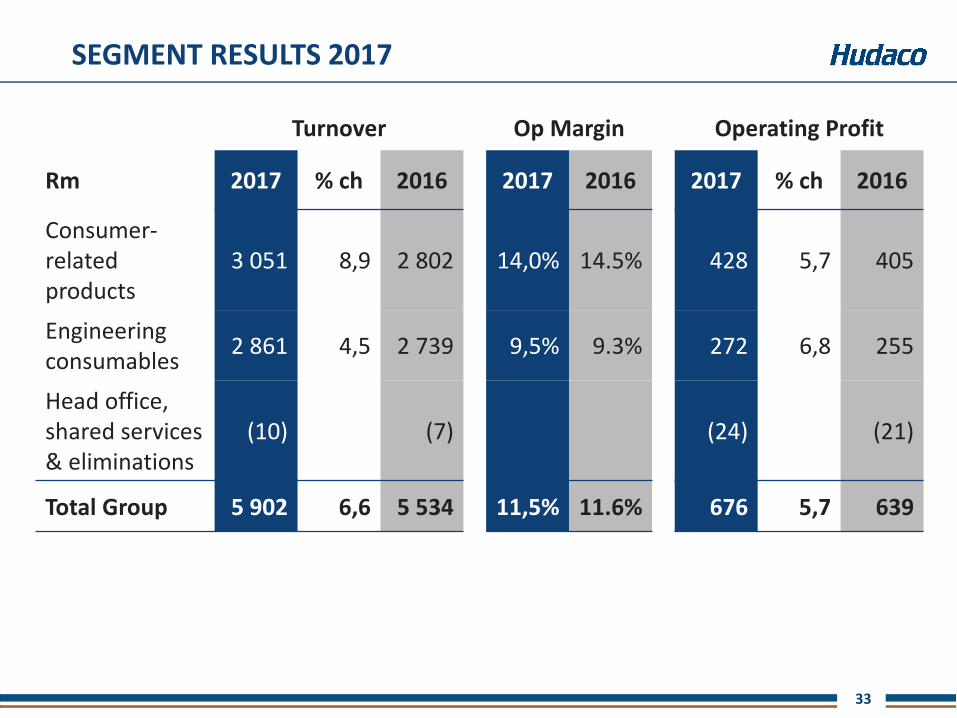
SEGMENT RESULTS 2017
Turnover Op Margin Operating Profit
Rm 2017 % ch 2016 2017 2016 2017 % ch 2016
Consumer-related products
3 051 8,9 2 802 14,0% 14.5% 428 5,7 405
Engineering consumables
2 861 4,5 2 739 9,5% 9.3% 272 6,8 255
Head office, shared services & eliminations
(10) (7) (24) (21)
Total Group 5 902 6,6 5 534 11,5% 11.6% 676 5,7 639
34
FINANCIAL REVIEW
35
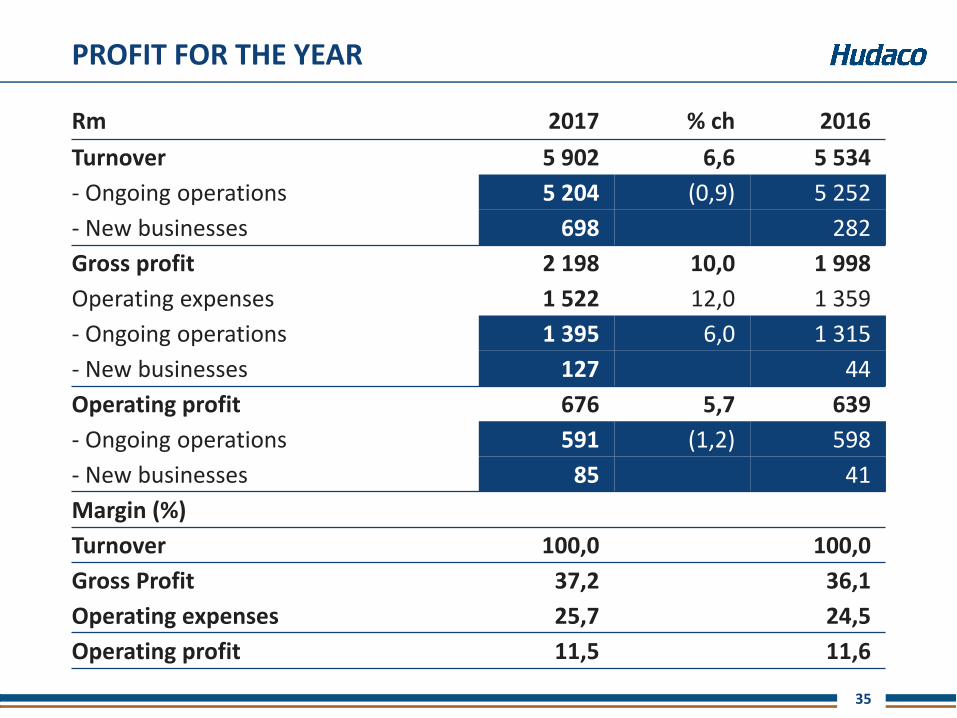
PROFIT FOR THE YEAR
Rm 2017 % ch 2016
Turnover 5 902 6,6 5 534
- Ongoing operations 5 204 (0,9) 5 252
- New businesses 698 282
Gross profit 2 198 10,0 1 998
Operating expenses 1 522 12,0 1 359
- Ongoing operations 1 395 6,0 1 315
- New businesses 127 44
Operating profit 676 5,7 639
- Ongoing operations 591 (1,2) 598
- New businesses 85 41
Margin (%)
Turnover 100,0 100,0
Gross Profit 37,2 36,1
Operating expenses 25,7 24,5
Operating profit 11,5 11,6
36
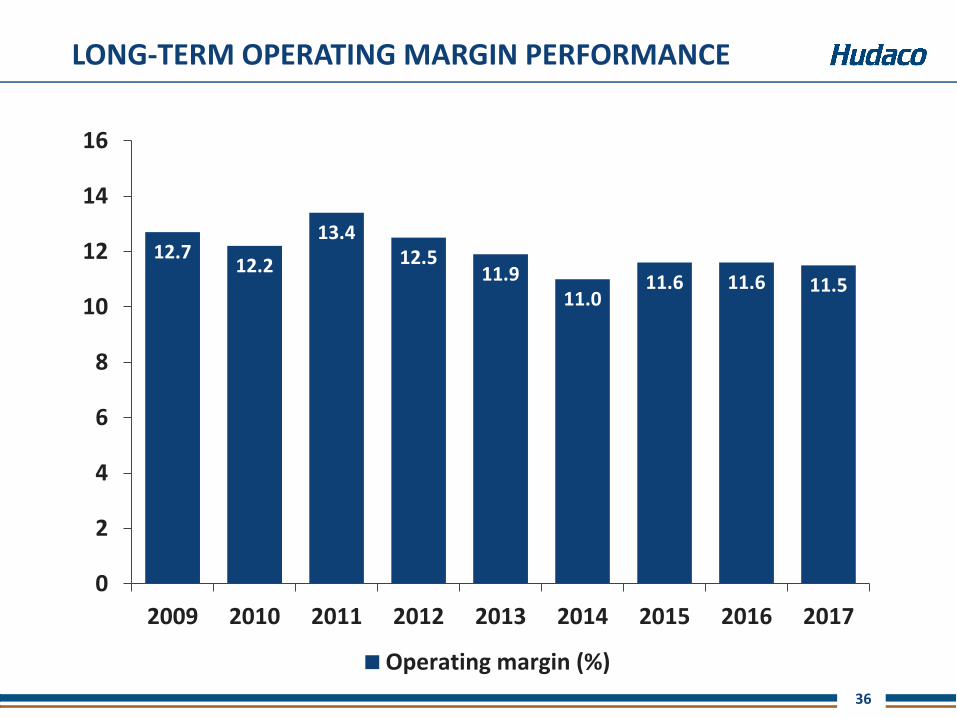
LONG-TERM OPERATING MARGIN PERFORMANCE
12.712.2
13.412.5
11.911.0
11.6 11.6 11.5
0
2
4
6
8
10
12
14
16
2009 2010 2011 2012 2013 2014 2015 2016 2017
Operating margin (%)
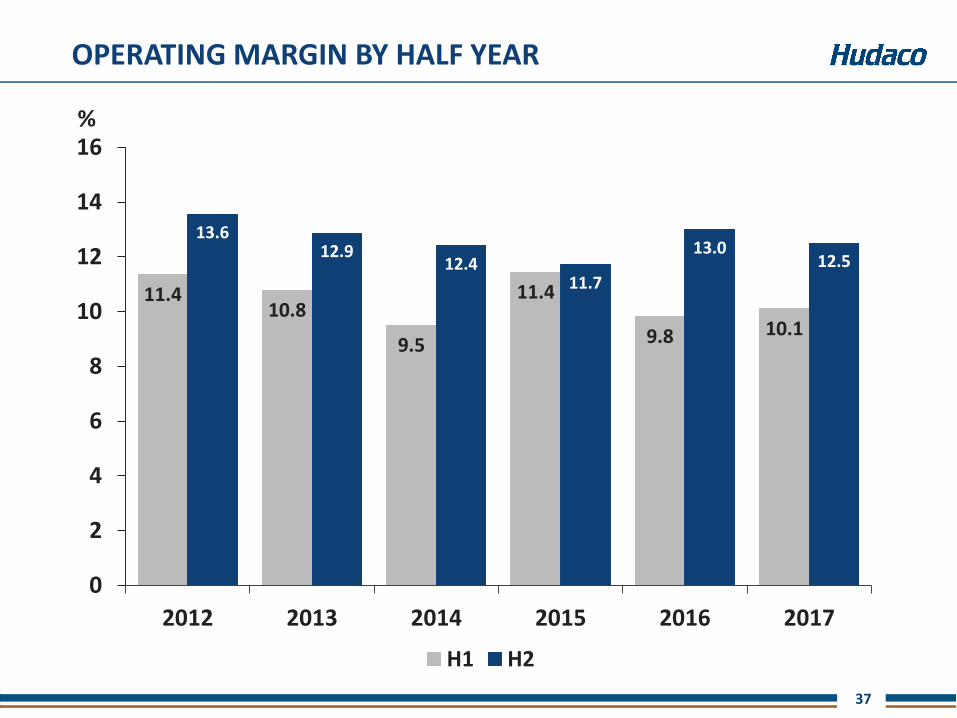
37
OPERATING MARGIN BY HALF YEAR
11.410.8
9.5
11.4
9.8 10.1
13.612.9
12.411.7
13.012.5
0
2
4
6
8
10
12
14
16
2012 2013 2014 2015 2016 2017
H1 H2
%
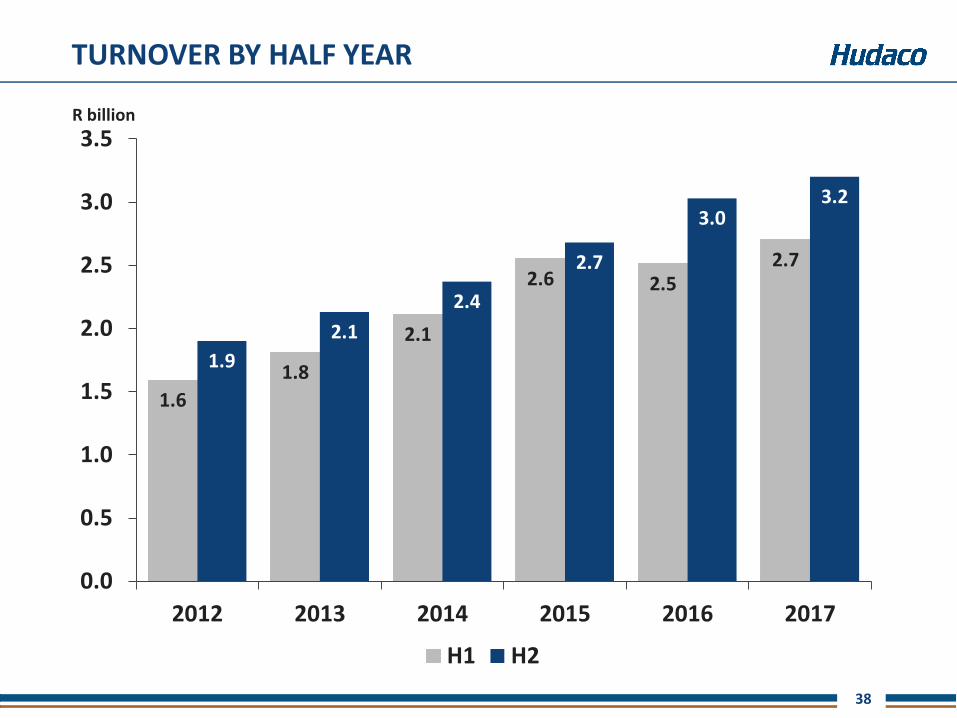
38
TURNOVER BY HALF YEAR
1.6
1.8
2.1
2.6 2.52.7
1.9
2.1
2.4
2.7
3.03.2
0.0
0.5
1.0
1.5
2.0
2.5
3.0
3.5
2012 2013 2014 2015 2016 2017
H1 H2
R billion
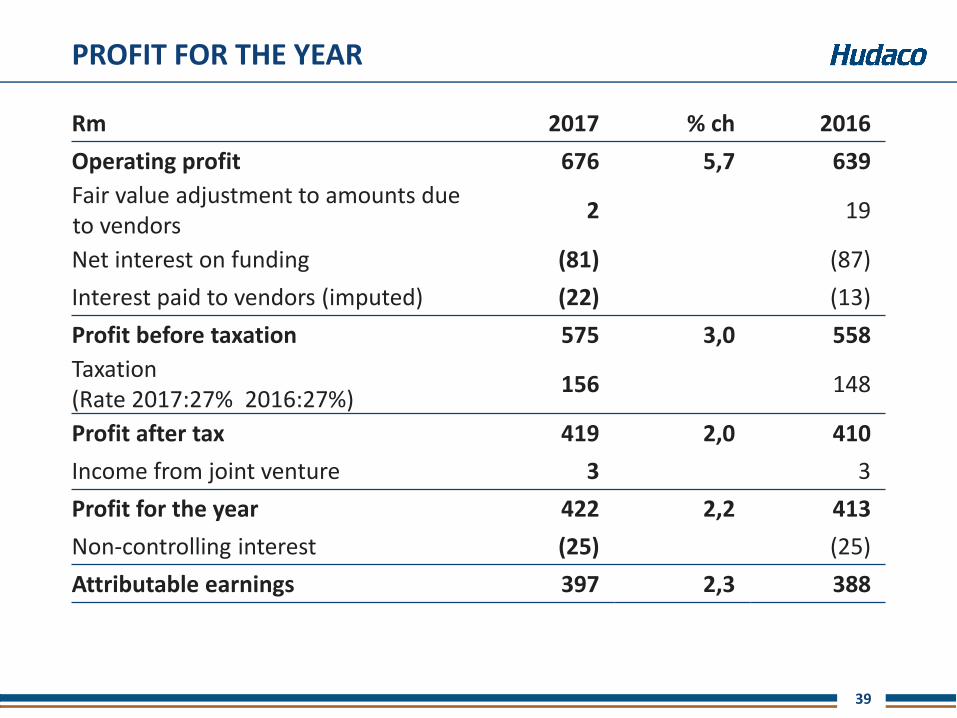
39
PROFIT FOR THE YEAR
Rm 2017 % ch 2016
Operating profit 676 5,7 639
Fair value adjustment to amounts due to vendors
2 19
Net interest on funding (81) (87)
Interest paid to vendors (imputed) (22) (13)
Profit before taxation 575 3,0 558
Taxation(Rate 2017:27% 2016:27%)
156 148
Profit after tax 419 2,0 410
Income from joint venture 3 3
Profit for the year 422 2,2 413
Non-controlling interest (25) (25)
Attributable earnings 397 2,3 388
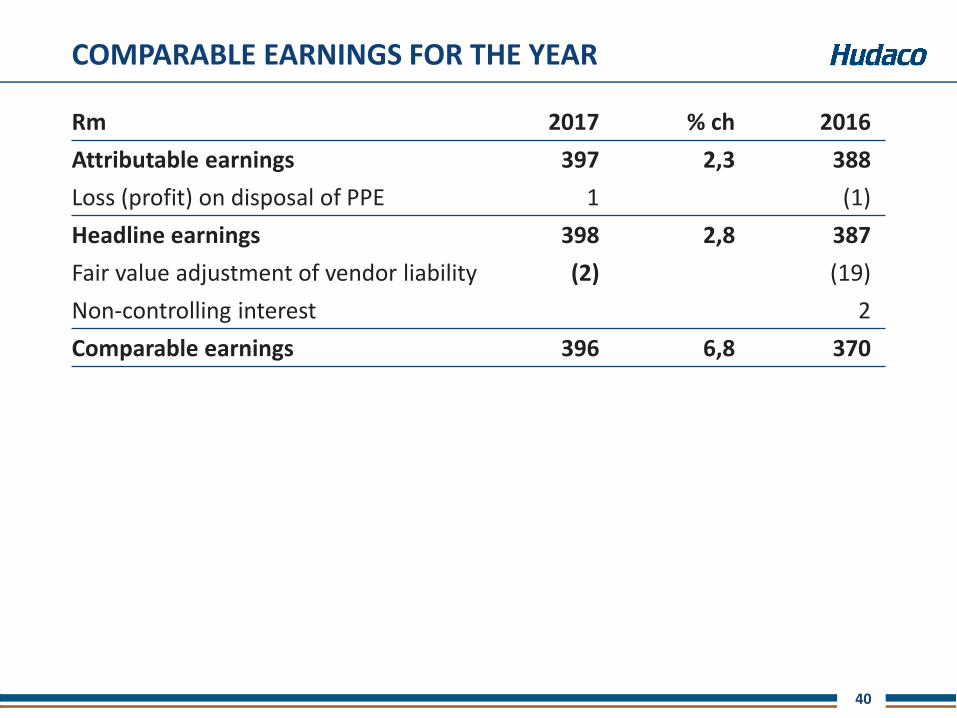
40
COMPARABLE EARNINGS FOR THE YEAR
Rm 2017 % ch 2016
Attributable earnings 397 2,3 388
Loss (profit) on disposal of PPE 1 (1)
Headline earnings 398 2,8 387
Fair value adjustment of vendor liability (2) (19)
Non-controlling interest 2
Comparable earnings 396 6,8 370
41
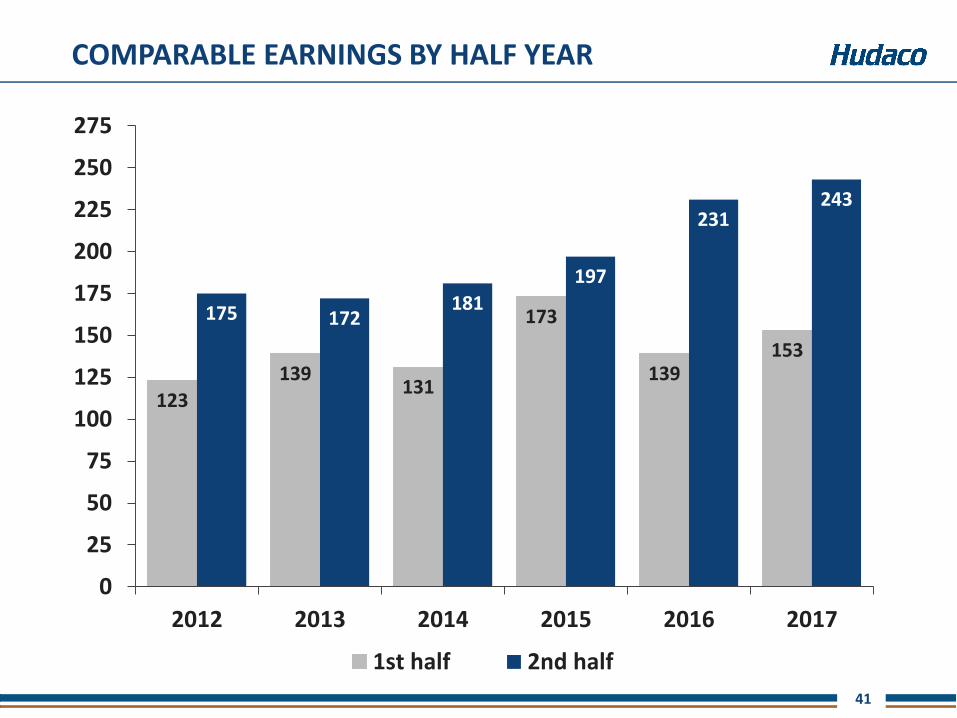
COMPARABLE EARNINGS BY HALF YEAR
123
139131
173
139153
175 172181
197
231243
0
25
50
75
100
125
150
175
200
225
250
275
2012 2013 2014 2015 2016 2017
1st half 2nd half
42
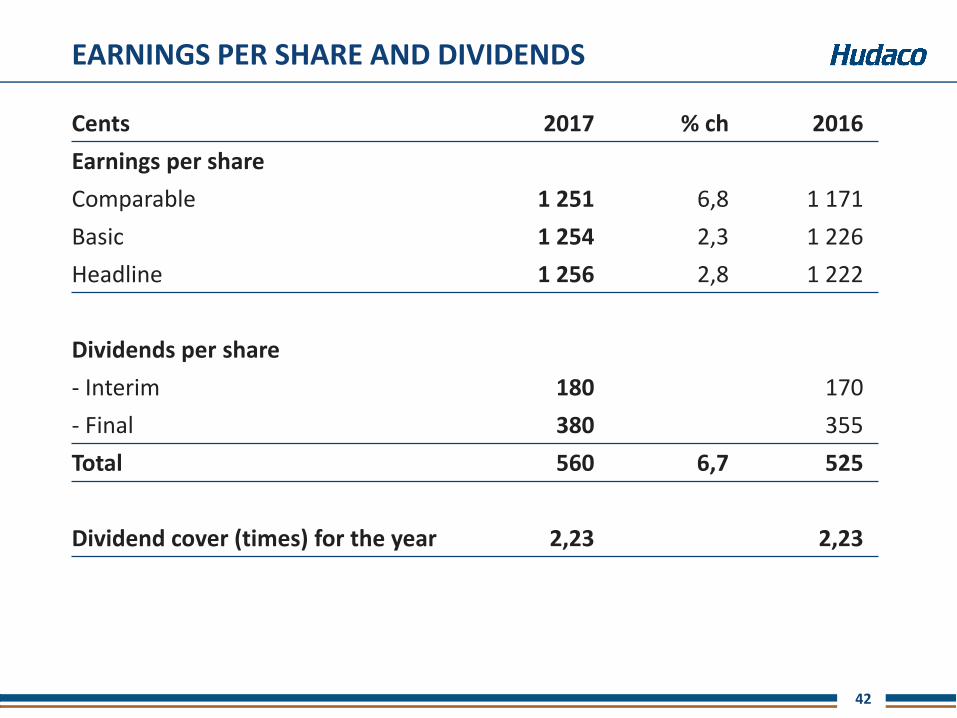
EARNINGS PER SHARE AND DIVIDENDS
Cents 2017 % ch 2016
Earnings per share
Comparable 1 251 6,8 1 171
Basic 1 254 2,3 1 226
Headline 1 256 2,8 1 222
Dividends per share
- Interim 180 170
- Final 380 355
Total 560 6,7 525
Dividend cover (times) for the year 2,23 2,23
43
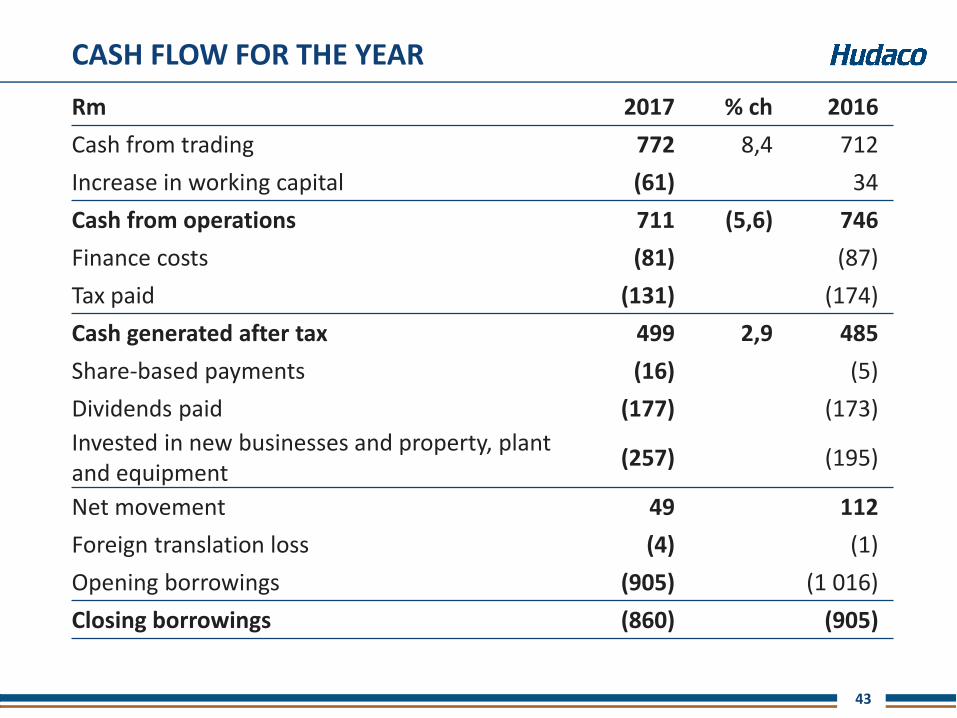
Rm 2017 % ch 2016
Cash from trading 772 8,4 712
Increase in working capital (61) 34
Cash from operations 711 (5,6) 746
Finance costs (81) (87)
Tax paid (131) (174)
Cash generated after tax 499 2,9 485
Share-based payments (16) (5)
Dividends paid (177) (173)
Invested in new businesses and property, plant and equipment
(257) (195)
Net movement 49 112
Foreign translation loss (4) (1)
Opening borrowings (905) (1 016)
Closing borrowings (860) (905)
CASH FLOW FOR THE YEAR
44
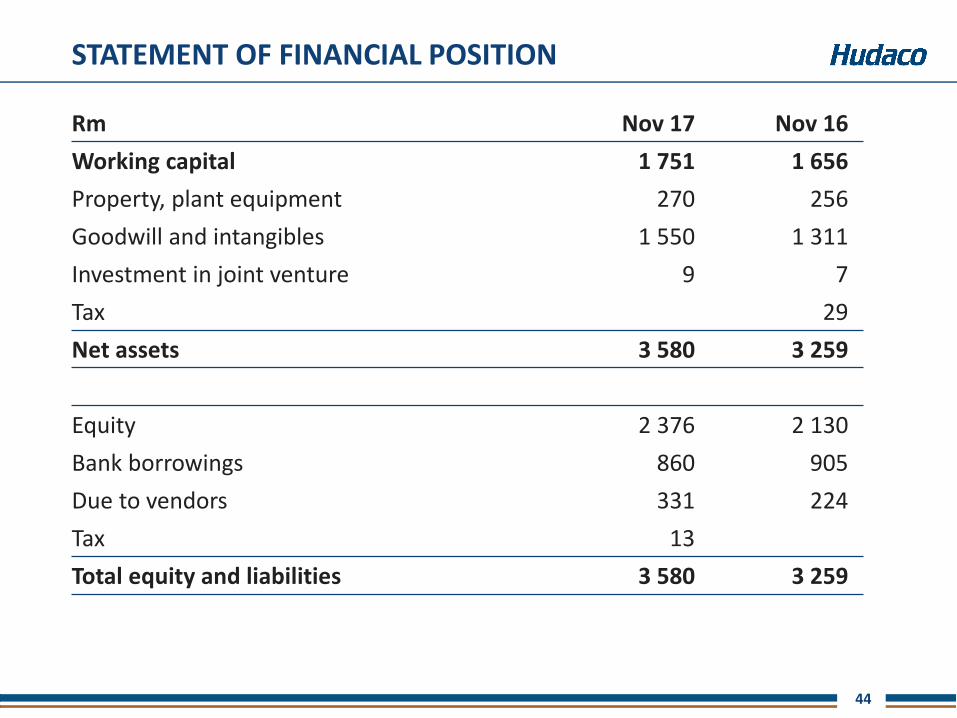
STATEMENT OF FINANCIAL POSITION
Rm Nov 17 Nov 16
Working capital 1 751 1 656
Property, plant equipment 270 256
Goodwill and intangibles 1 550 1 311
Investment in joint venture 9 7
Tax 29
Net assets 3 580 3 259
Equity 2 376 2 130
Bank borrowings 860 905
Due to vendors 331 224
Tax 13
Total equity and liabilities 3 580 3 259
45
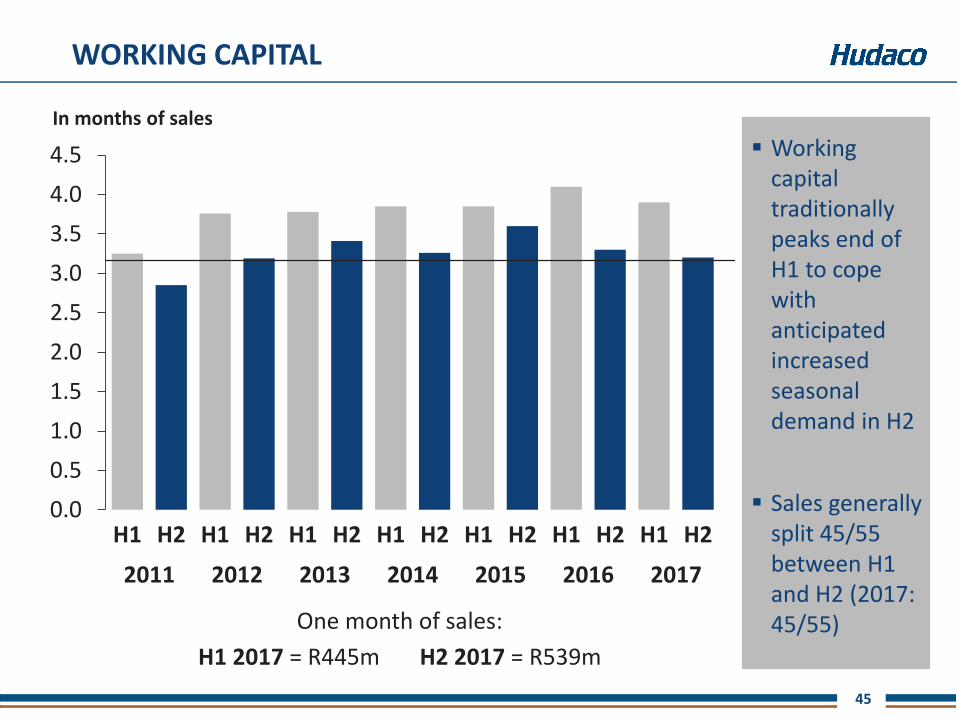
WORKING CAPITAL
Working capital traditionally peaks end of H1 to cope with anticipated increased seasonal demand in H2
Sales generally split 45/55 between H1 and H2 (2017: 45/55)
0.0
0.5
1.0
1.5
2.0
2.5
3.0
3.5
4.0
4.5
H1 H2 H1 H2 H1 H2 H1 H2 H1 H2 H1 H2 H1 H2
2011 2012 2013 2014 2015 2016 2017
In months of sales
One month of sales:
H1 2017 = R445m H2 2017 = R539m
46
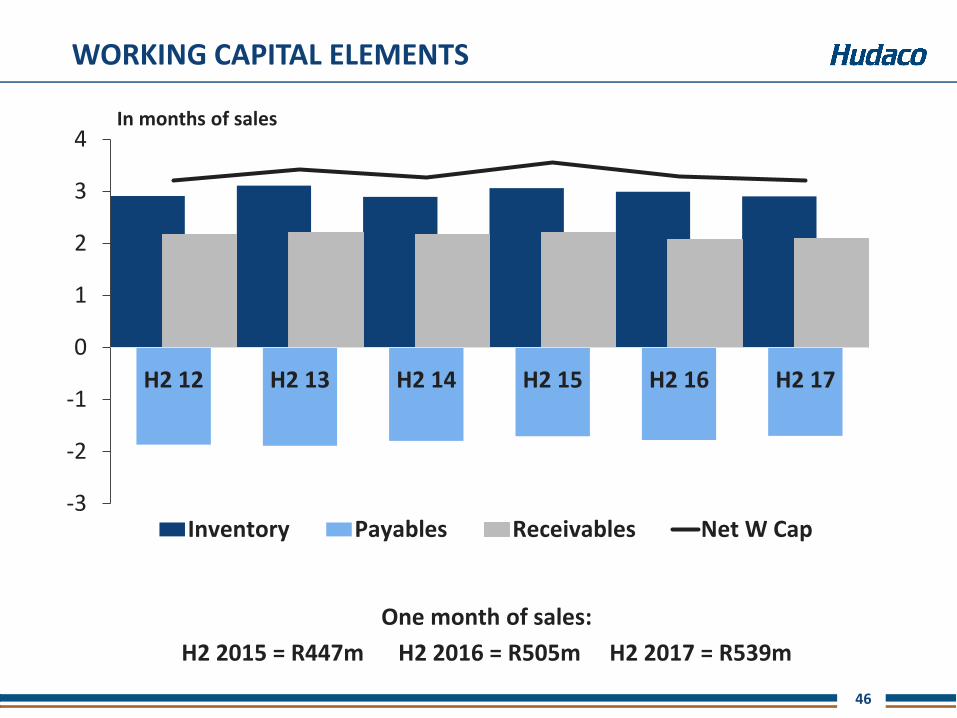
WORKING CAPITAL ELEMENTS
In months of sales
-3
-2
-1
0
1
2
3
4
H2 12 H2 13 H2 14 H2 15 H2 16 H2 17
Inventory Payables Receivables Net W Cap
One month of sales:
H2 2015 = R447m H2 2016 = R505m H2 2017 = R539m
47
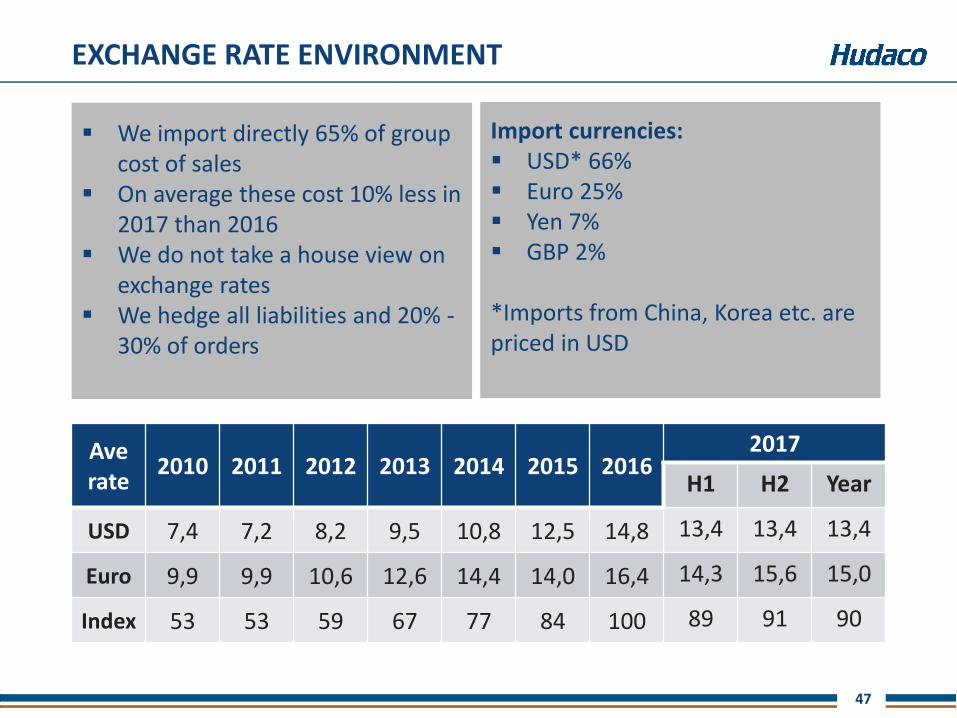
EXCHANGE RATE ENVIRONMENT
We import directly 65% of group cost of sales
On average these cost 10% less in 2017 than 2016
We do not take a house view on exchange rates
We hedge all liabilities and 20% -30% of orders
Ave rate
2010 2011 2012 2013 2014 2015 20162017
H1 H2 Year
USD 7,4 7,2 8,2 9,5 10,8 12,5 14,8 13,4 13,4 13,4
Euro 9,9 9,9 10,6 12,6 14,4 14,0 16,4 14,3 15,6 15,0
Index 53 53 59 67 77 84 100 89 91 90
Import currencies: USD* 66% Euro 25% Yen 7% GBP 2%
*Imports from China, Korea etc. are priced in USD
48
SUMMARY
Existing businesses generate strong cash flows
We continue to invest successfully in new businesses
Using surplus cash to repay borrowings
Exchange rate impacts working capital requirements
Bank facilities are available
Capacity remains for acquisitions
Hudaco is resilient in tough times
Existing businesses are poised to benefit from any economic revival
49
OUTLOOK
50
OUTLOOK - REMINDERS
Hudaco sales are predominantly driven by GDP activity
Any GDFI adds capacity for future GDP activity
Rand exchange rate has a big impact on pricing and profitability
Hudaco is a decentralised group that is made up of 32 separate businesses
There are 21 businesses in our engineering consumables
There are 11 businesses in our consumer-related products
51
OUTLOOK 2018
Factors that should impact positively on 2018:
The year has started off in a much more positive vein with consumer and
business confidence increasing
There are signs of improvement in certain sectors in which we operate
Mining and manufacturing are benefiting from strengthening commodity
prices
Our businesses are sized optimally for current market conditions and are
well placed to benefit immediately from any improvement in the economy
The strengthening Rand:
should allow us to release cash from inventories
we will have to manage our pricing carefully and the benefit of increased economic activity should outweigh pressure on prices
52
Graham Dunford
Chief executive
Tel +27 11 657 5004
Clifford Amoils
Financial director
Tel +27 11 657 5002
www.hudaco.co.za
CONTACT DETAILS
53
The preceding presentation contains forward looking statements about the
Hudaco Group’s operations and financial position. They are prepared in good
faith and are based on Hudaco’s best estimates and information at the time
of preparing the presentation. They are nonetheless subject to significant
uncertainties and contingencies many of which are understandably beyond
Hudaco’s control. Unanticipated events will occur and actual future events
may differ materially from current expectations for many reasons including
new business opportunities, as well as many other internal and external
factors. Any of these factors may materially affect Hudaco's future business
activities and financial results. None of the forward looking statements has
been reported on by Hudaco’s auditors.
DISCLAIMER


![GT48 Integrators Manual_P1C[1]](https://img.pdfslide.net/doc/110x75/577d358c1a28ab3a6b90c114/gt48-integrators-manualp1c1.jpg)