Embed Size (px)
Citation preview
Earnings Release 3Q14
0
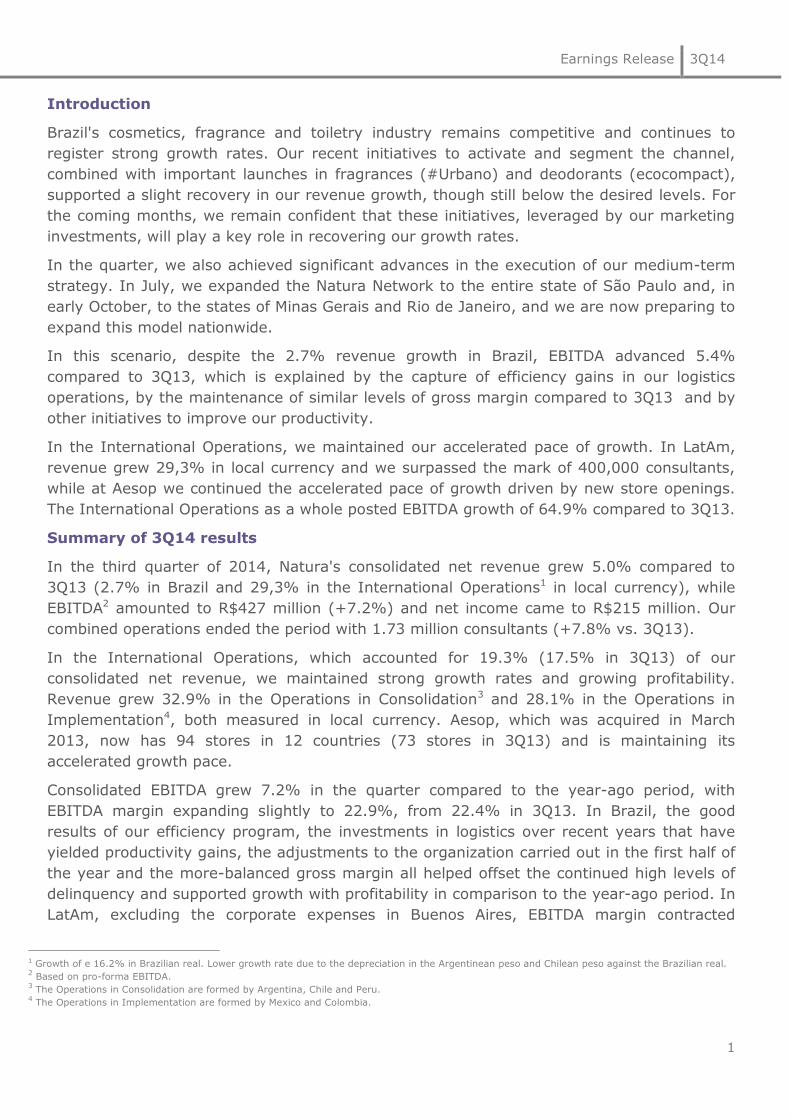
São Paulo, October 22, 2014 – Natura
Cosméticos S.A. (BM&FBOVESPA: NATU3)
announces today its results for the third
quarter of 2014 (3Q14). Except where
stated otherwise, the financial and
operating information in this release is
presented on a consolidated basis, in
accordance with International Financial
Reporting Standards (IFRS).
3Q14
Results
Earnings Release 3Q14
1
Introduction
Brazil's cosmetics, fragrance and toiletry industry remains competitive and continues to
register strong growth rates. Our recent initiatives to activate and segment the channel,
combined with important launches in fragrances (#Urbano) and deodorants (ecocompact),
supported a slight recovery in our revenue growth, though still below the desired levels. For
the coming months, we remain confident that these initiatives, leveraged by our marketing
investments, will play a key role in recovering our growth rates.
In the quarter, we also achieved significant advances in the execution of our medium-term
strategy. In July, we expanded the Natura Network to the entire state of São Paulo and, in
early October, to the states of Minas Gerais and Rio de Janeiro, and we are now preparing to
expand this model nationwide.
In this scenario, despite the 2.7% revenue growth in Brazil, EBITDA advanced 5.4%
compared to 3Q13, which is explained by the capture of efficiency gains in our logistics
operations, by the maintenance of similar levels of gross margin compared to 3Q13 and by
other initiatives to improve our productivity.
In the International Operations, we maintained our accelerated pace of growth. In LatAm,
revenue grew 29,3% in local currency and we surpassed the mark of 400,000 consultants,
while at Aesop we continued the accelerated pace of growth driven by new store openings.
The International Operations as a whole posted EBITDA growth of 64.9% compared to 3Q13.
Summary of 3Q14 results
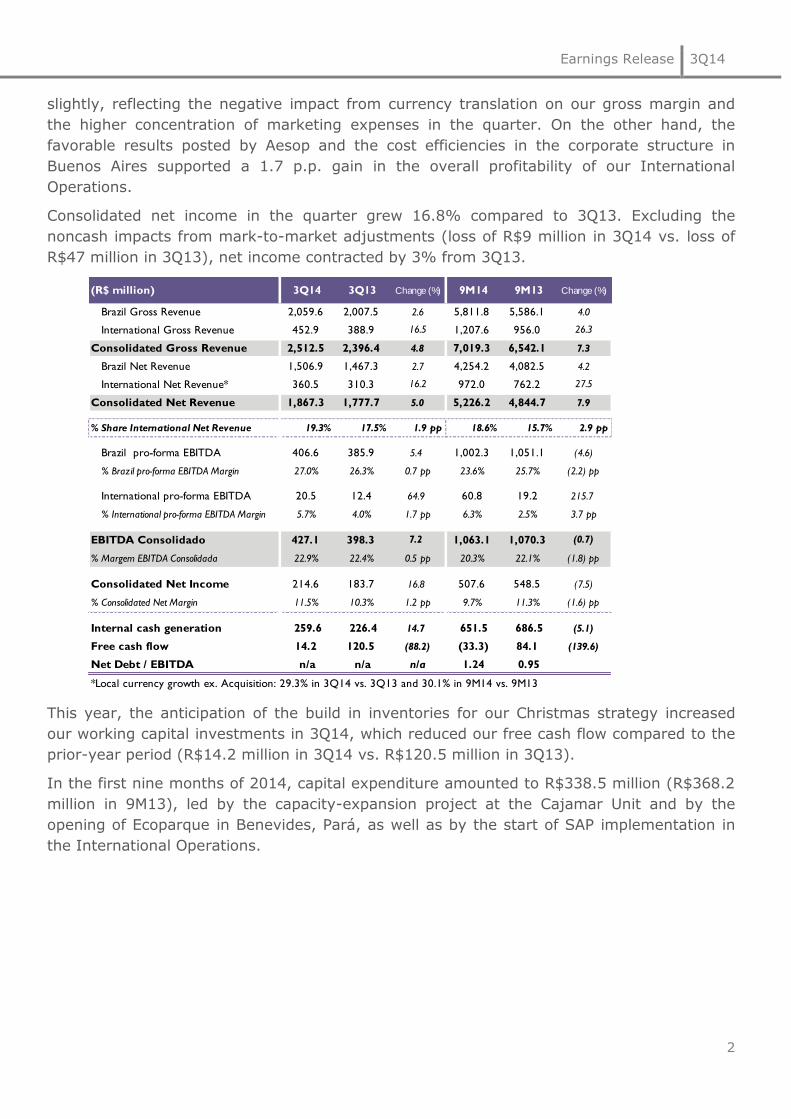
In the third quarter of 2014, Natura's consolidated net revenue grew 5.0% compared to
3Q13 (2.7% in Brazil and 29,3% in the International Operations1 in local currency), while
EBITDA2 amounted to R$427 million (+7.2%) and net income came to R$215 million. Our
combined operations ended the period with 1.73 million consultants (+7.8% vs. 3Q13).
In the International Operations, which accounted for 19.3% (17.5% in 3Q13) of our
consolidated net revenue, we maintained strong growth rates and growing profitability.
Revenue grew 32.9% in the Operations in Consolidation3 and 28.1% in the Operations in
Implementation4, both measured in local currency. Aesop, which was acquired in March
2013, now has 94 stores in 12 countries (73 stores in 3Q13) and is maintaining its
accelerated growth pace.
Consolidated EBITDA grew 7.2% in the quarter compared to the year-ago period, with
EBITDA margin expanding slightly to 22.9%, from 22.4% in 3Q13. In Brazil, the good
results of our efficiency program, the investments in logistics over recent years that have
yielded productivity gains, the adjustments to the organization carried out in the first half of
the year and the more-balanced gross margin all helped offset the continued high levels of
delinquency and supported growth with profitability in comparison to the year-ago period. In
LatAm, excluding the corporate expenses in Buenos Aires, EBITDA margin contracted
1 Growth of e 16.2% in Brazilian real. Lower growth rate due to the depreciation in the Argentinean peso and Chilean peso against the Brazilian real. 2 Based on pro-forma EBITDA.
3 The Operations in Consolidation are formed by Argentina, Chile and Peru.
4 The Operations in Implementation are formed by Mexico and Colombia.
Earnings Release 3Q14
2
slightly, reflecting the negative impact from currency translation on our gross margin and
the higher concentration of marketing expenses in the quarter. On the other hand, the
favorable results posted by Aesop and the cost efficiencies in the corporate structure in
Buenos Aires supported a 1.7 p.p. gain in the overall profitability of our International
Operations.
Consolidated net income in the quarter grew 16.8% compared to 3Q13. Excluding the
noncash impacts from mark-to-market adjustments (loss of R$9 million in 3Q14 vs. loss of
R$47 million in 3Q13), net income contracted by 3% from 3Q13.
This year, the anticipation of the build in inventories for our Christmas strategy increased
our working capital investments in 3Q14, which reduced our free cash flow compared to the
prior-year period (R$14.2 million in 3Q14 vs. R$120.5 million in 3Q13).
In the first nine months of 2014, capital expenditure amounted to R$338.5 million (R$368.2
million in 9M13), led by the capacity-expansion project at the Cajamar Unit and by the
opening of Ecoparque in Benevides, Pará, as well as by the start of SAP implementation in
the International Operations.
(R$ million) 3Q14 3Q13 Change (%) 9M14 9M13 Change (%)
Brazil Gross Revenue 2,059.6 2,007.5 2.6 5,811.8 5,586.1 4.0
International Gross Revenue 452.9 388.9 16.5 1,207.6 956.0 26.3
Consolidated Gross Revenue 2,512.5 2,396.4 4.8 7,019.3 6,542.1 7.3
Brazil Net Revenue 1,506.9 1,467.3 2.7 4,254.2 4,082.5 4.2
International Net Revenue* 360.5 310.3 16.2 972.0 762.2 27.5
Consolidated Net Revenue 1,867.3 1,777.7 5.0 5,226.2 4,844.7 7.9
% Share International Net Revenue 19.3% 17.5% 1.9 pp 18.6% 15.7% 2.9 pp
Brazil pro-forma EBITDA 406.6 385.9 5.4 1,002.3 1,051.1 (4.6)
% Brazil pro-forma EBITDA Margin 27.0% 26.3% 0.7 pp 23.6% 25.7% (2.2) pp
International pro-forma EBITDA 20.5 12.4 64.9 60.8 19.2 215.7
% International pro-forma EBITDA Margin 5.7% 4.0% 1.7 pp 6.3% 2.5% 3.7 pp
EBITDA Consolidado 427.1 398.3 7.2 1,063.1 1,070.3 (0.7)
% Margem EBITDA Consolidada 22.9% 22.4% 0.5 pp 20.3% 22.1% (1.8) pp
Consolidated Net Income 214.6 183.7 16.8 507.6 548.5 (7.5)
% Consolidated Net Margin 11.5% 10.3% 1.2 pp 9.7% 11.3% (1.6) pp
Internal cash generation 259.6 226.4 14.7 651.5 686.5 (5.1)
Free cash flow 14.2 120.5 (88.2) (33.3) 84.1 (139.6)
Net Debt / EBITDA n/a n/a n/a 1.24 0.95
*Local currency growth ex. Acquisition: 29.3% in 3Q14 vs. 3Q13 and 30.1% in 9M14 vs. 9M13
Earnings Release 3Q14
3
1. cosmetics, fragrance and toiletries
industry
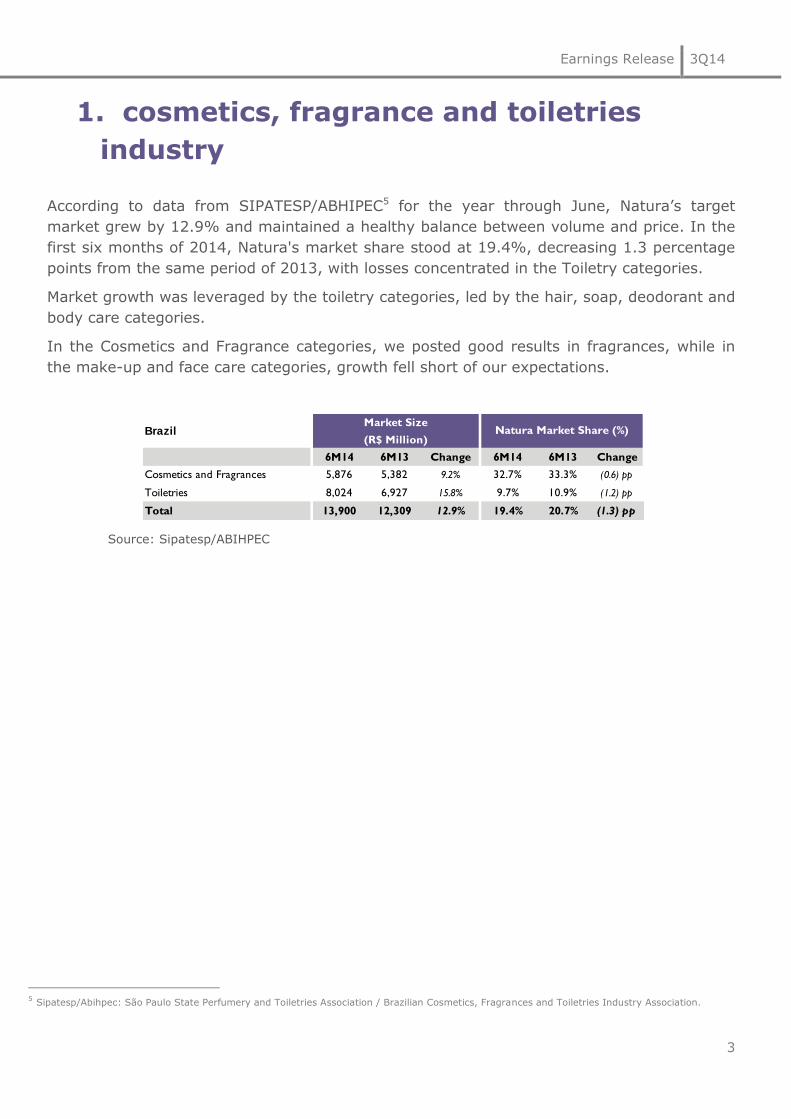
According to data from SIPATESP/ABHIPEC5 for the year through June, Natura’s target
market grew by 12.9% and maintained a healthy balance between volume and price. In the
first six months of 2014, Natura's market share stood at 19.4%, decreasing 1.3 percentage
points from the same period of 2013, with losses concentrated in the Toiletry categories.
Market growth was leveraged by the toiletry categories, led by the hair, soap, deodorant and
body care categories.
In the Cosmetics and Fragrance categories, we posted good results in fragrances, while in
the make-up and face care categories, growth fell short of our expectations.
Source: Sipatesp/ABIHPEC
5 Sipatesp/Abihpec: São Paulo State Perfumery and Toiletries Association / Brazilian Cosmetics, Fragrances and Toiletries Industry Association.
6M14 6M13 Change 6M14 6M13 Change
Cosmetics and Fragrances 5,876 5,382 9.2% 32.7% 33.3% (0.6) pp
Toiletries 8,024 6,927 15.8% 9.7% 10.9% (1.2) pp
Total 13,900 12,309 12.9% 19.4% 20.7% (1.3) pp
BrazilMarket Size
(R$ Million)Natura Market Share (%)

Earnings Release 3Q14
4
2. social and environmental highlights
We became a component of the Dow Jones Sustainability Index 2014 (DJSI), a benchmark
for investors who base their investment decisions on social and environmental aspects as
well.
Every year, the world´s largest companies are invited to join the index and, grouped by
industry and region, complete a questionnaire that is later analyzed by the team of analysts
at DJSI. Only companies evaluated in the top 10% based on their economic, social and
environmental practices and governance are included in the index.
This not only is an important recognition, but also reaffirms our positioning among investors
who seek to support the development of more sustainable businesses and comes to serve as
a relevant source of information for improving our practices.
Over the past few months, we launched two new products that reinforce our commitment to
sustainability. We introduced fragrance refills in the Ekos line, which are made using 100%
recycled PET and reduce carbon emissions by 72%, making Natura the first major Brazilian
brand to develop and launch 100% recycled post-consumer PET refills in the fragrance
category.
Meanwhile ecocompact, which was launched in September, promises to revolutionize the
concept of aerosol deodorant. With a new formula and valve, the product brings an
innovative technology that allows for reducing packaging size by half (compared to regular
packaging) without sacrificing efficiency. The result was a significant reduction in the amount
of aluminum and propellant gas required, which reduces absolute CO2 emissions by 48%
compared to regular aerosol deodorant packaging (90g to 105g).
The following table presents the cumulative social and environmental results of 3Q14:
Earnings Release 3Q14
5
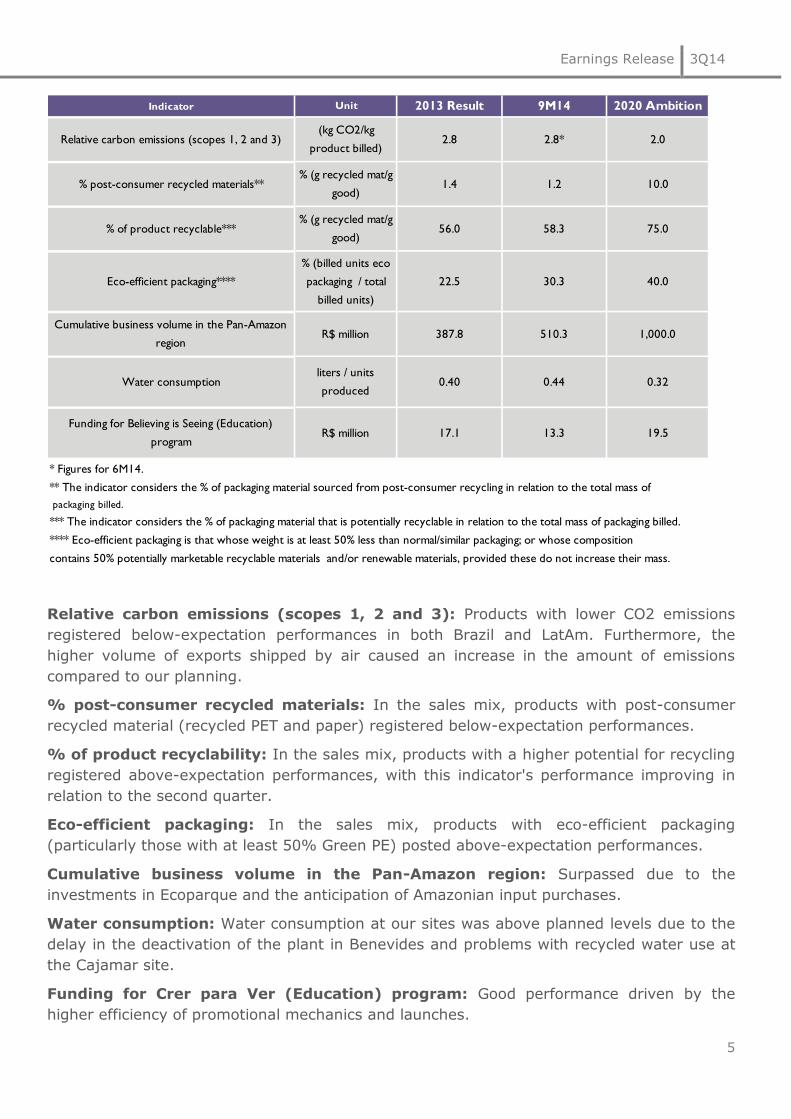
Relative carbon emissions (scopes 1, 2 and 3): Products with lower CO2 emissions
registered below-expectation performances in both Brazil and LatAm. Furthermore, the
higher volume of exports shipped by air caused an increase in the amount of emissions
compared to our planning.
% post-consumer recycled materials: In the sales mix, products with post-consumer
recycled material (recycled PET and paper) registered below-expectation performances.
% of product recyclability: In the sales mix, products with a higher potential for recycling
registered above-expectation performances, with this indicator's performance improving in
relation to the second quarter.
Eco-efficient packaging: In the sales mix, products with eco-efficient packaging
(particularly those with at least 50% Green PE) posted above-expectation performances.
Cumulative business volume in the Pan-Amazon region: Surpassed due to the
investments in Ecoparque and the anticipation of Amazonian input purchases.
Water consumption: Water consumption at our sites was above planned levels due to the
delay in the deactivation of the plant in Benevides and problems with recycled water use at
the Cajamar site.
Funding for Crer para Ver (Education) program: Good performance driven by the
higher efficiency of promotional mechanics and launches.
Indicator
* Figures for 6M14.
** The indicator considers the % of packaging material sourced from post-consumer recycling in relation to the total mass of
packaging billed.
*** The indicator considers the % of packaging material that is potentially recyclable in relation to the total mass of packaging billed.
**** Eco-efficient packaging is that whose weight is at least 50% less than normal/similar packaging; or whose composition
contains 50% potentially marketable recyclable materials and/or renewable materials, provided these do not increase their mass.
Funding for Believing is Seeing (Education)
programR$ million 17.1 13.3
510.3 1,000.0
Water consumptionliters / units
produced0.40 0.44 0.32
19.5
Eco-efficient packaging****
% (billed units eco
packaging / total
billed units)
Cumulative business volume in the Pan-Amazon
regionR$ million 387.8
Unit
Relative carbon emissions (scopes 1, 2 and 3)(kg CO2/kg
product billed)
% post-consumer recycled materials**% (g recycled mat/g
good)
% of product recyclable***% (g recycled mat/g
good)
2013 Result
2.8
1.4
56.0
22.5
9M14
2.8*
1.2
58.3
30.3
2020 Ambition
2.0
10.0
75.0
40.0

Earnings Release 3Q14
6
3. economic performance678
9
6 In the pro-forma results, the profit margin obtained on exports from Brazil to the International Operations was subtracted from the COGS of the
respective operations in order to show the actual impact of these subsidiaries on the company’s consolidated results. Accordingly, the pro-forma
income statement for the Brazilian operations considers only the sales made in the domestic market. 7 Consolidated figures include the Brazil Operations, the Operations in Consolidation, the Operations in Implementation and other International
Investments and consider the impact from acquisitions. 8 Position at the end of Cycle 13 in Brazil and France and of Cycle 12 in the Operations in Consolidation and Implementation. 9 Administrative R&D, IT and Project expenses include Management Compensation, the details of which are available in Note 28.2 to the Financial
Statements.
Quarter Pro-Forma Pro-Forma
(R$ million) Consolidated7
Brazil Consolidation Implementation Novos Negócios
3Q14 3Q13 Change% 3Q14 3Q13 Change% 3Q14 3Q13 Change% 3Q14 3Q13 Change%
Total Consultants - end of period ('000)8 1,728.8 1,604.1 7.8 1,314.2 1,257.7 4.5 259.9 215.9 20.4 153.1 128.7 18.9
Total Consultants - average of period ('000) 1,712.3 1,596.7 7.2 1,303.4 1,256.4 3.7 254.8 212.6 19.8 152.6 125.9 21.2
Units sold – items for resale 130.6 146.4 (10.8) 107.6 126.2 (14.8) 15.0 13.7 9.5 7.2 6.3 14.0
Gross Revenue 2,512.5 2,396.4 4.8 2,059.6 2,007.5 2.6 262.7 248.7 5.6 122.2 96.8 26.3
Net Revenue 1,867.3 1,777.7 5.0 1,506.9 1,467.3 2.7 193.3 184.2 4.9 105.1 83.2 26.3
Gross Profit 1,323.0 1,257.5 5.2 1,066.2 1,033.1 3.2 132.7 131.7 0.7 71.5 56.8 25.9
Selling, Marketing and Logistics Expenses (664.8) (620.0) 7.2 (508.9) (484.1) 5.1 (85.0) (81.0) 4.9 (60.9) (46.6) 30.8
Administrative, R&D, IT and Projects Expenses9 (284.3) (289.1) (1.7) (196.6) (208.7) (5.8) (12.9) (12.2) 5.9 (9.7) (9.1) 6.9
Other Operating Income / (Expenses), net 1.5 (3.1) n/a 1.4 (2.9) n/a (0.1) 0.7 n/a 0.4 (0.1) n/a
Financial Income / (Expenses), net (63.7) (85.0) n/a (61.9) (83.7) n/a 2.9 (1.6) n/a (3.1) (0.3) n/a
Income Tax and Social Contribution (98.2) (77.2) 27.2 (81.5) (70.4) 15.9 (10.6) (5.7) n/a (2.3) (0.8) 191.2
Noncontrolling 1.1 0.6 67.5 0.0 0.0 0.0 0.0 0.0 0.0 0.0 0.0 0.0
Net Income 214.6 183.7 16.8 218.7 183.4 19.3 27.0 31.9 (15.4) (4.2) (0.1) n/d
EBITDA* 427.1 398.3 7.2 406.6 385.9 5.4 36.6 40.5 (9.6) 2.2 2.1 5.5
Gross Margin 70.9% 70.7% 0.1 pp 70.8% 70.4% 0.4 pp 68.6% 71.5% (2.9) pp 68.0% 68.2% (0.2) pp
Selling, Marketing and Logistics Expenses/Net Revenue 35.6% 34.9% 0.7 pp 33.8% 33.0% 0.8 pp 44.0% 44.0% (0.0) pp 58.0% 56.0% 2.0 pp
Administrative, R&D, IT and Projects Expenses/Net Revenue 15.2% 16.3% (1.0) pp 13.0% 14.2% (1.2) pp 6.7% 6.6% 0.1 pp 9.3% 11.0% (1.7) pp
Net Margin 11.5% 10.3% 1.2 pp 14.5% 12.5% 2.0 pp 13.9% 17.3% (3.4) pp (4.0)% (0.1)% (3.9) pp
EBITDA Margin 22.9% 22.4% 0.5 pp 27.0% 26.3% 0.7 pp 18.9% 22.0% (3.1) pp 2.1% 2.5% (0.4) pp
(*) EBITDA = Income from operations before financial effects + depreciation & amortization.
Year to date Pro-Forma Pro-Forma
(R$ million) Consolidated7
Brazil Consolidation Implementation Novos Negócios
9M14 9M13 Change% 9M14 9M13 Change% 9M14 9M13 Change% 9M14 9M13 Change%
Total Consultants - end of period ('000)8 1,728.8 1,604.1 7.8 1,314.2 1,257.7 4.5 259.9 215.9 20.4 153.1 128.7 18.9
Total Consultants - average of period ('000) 1,682.4 1,575.8 6.8 1,290.3 1,256.3 2.7 241.9 200.9 20.4 148.6 116.5 27.5
Units sold – items for resale 390.6 386.3 1.1 329.3 335.8 (1.9) 38.9 33.9 14.8 19.7 16.0 23.3
Gross Revenue 7,019.3 6,542.1 7.3 5,811.8 5,586.1 4.0 680.5 615.0 10.6 344.3 247.3 39.2
Net Revenue 5,226.2 4,844.7 7.9 4,254.2 4,082.5 4.2 504.9 457.6 10.3 296.3 212.5 39.5
Gross Profit 3,647.9 3,417.0 6.8 2,937.9 2,868.7 2.4 357.4 327.6 9.1 206.8 145.6 42.1
Selling, Marketing and Logistics Expenses (1,927.8) (1,740.5) 10.8 (1,497.0) (1,398.9) 7.0 (235.5) (204.3) 15.3 (165.9) (117.4) 41.3
Administrative, R&D, IT and Projects Expenses9 (818.5) (762.9) 7.3 (575.0) (565.1) 1.8 (34.2) (33.1) 3.5 (29.2) (24.6) 18.9
Other Operating Income / (Expenses), net 17.1 14.4 18.6 11.3 14.6 (22.4) (1.2) 0.5 n/a 0.8 0.4 n/a
Financial Income / (Expenses), net (176.7) (134.2) n/a (172.8) (129.0) n/a 3.1 (5.3) n/a (3.5) (0.7) n/a
Income Tax and Social Contribution (233.7) (245.3) (4.7) (204.4) (228.9) (10.7) (19.6) (14.4) 35.9 (3.1) (1.2) 157.4
Noncontrolling (0.6) (0.0) 1,687.9 0.0 0.0 0.0 0.0 0.0 0.0 0.0 0.0 0.0
Net Income 507.6 548.5 (7.5) 499.9 561.4 (11.0) 69.9 70.9 (1.4) 5.9 2.1 n/a
EBITDA* 1,063.1 1,070.3 (0.7) 1,002.3 1,051.1 (4.6) 91.1 94.3 (3.3) 15.6 6.7 131.5
Gross Margin 69.8% 70.5% (0.7) pp 69.1% 70.3% (1.2) pp 70.8% 71.6% (0.8) pp 69.8% 68.5% 1.3 pp
Selling, Marketing and Logistics Expenses/Net Revenue 36.9% 35.9% 1.0 pp 35.2% 34.3% 0.9 pp 46.6% 44.6% 2.0 pp 56.0% 55.3% 0.7 pp
Administrative, R&D, IT and Projects Expenses/Net Revenue 15.7% 15.8% (0.1) pp 13.5% 13.8% (0.3) pp 6.8% 7.2% (0.4) pp 9.9% 11.6% (1.7) pp
Net Margin 9.7% 11.3% (1.6) pp 11.8% 13.8% (2.0) pp 13.9% 15.5% (1.6) pp 2.0% 1.0% n/a
EBITDA Margin 20.3% 22.1% (1.8) pp 23.6% 25.7% (2.2) pp 18.0% 20.6% (2.6) pp 5.3% 3.2% n/a
(*) EBITDA = Income from operations before financial effects + depreciation & amortization.
Earnings Release 3Q14
7
3.1. net revenue
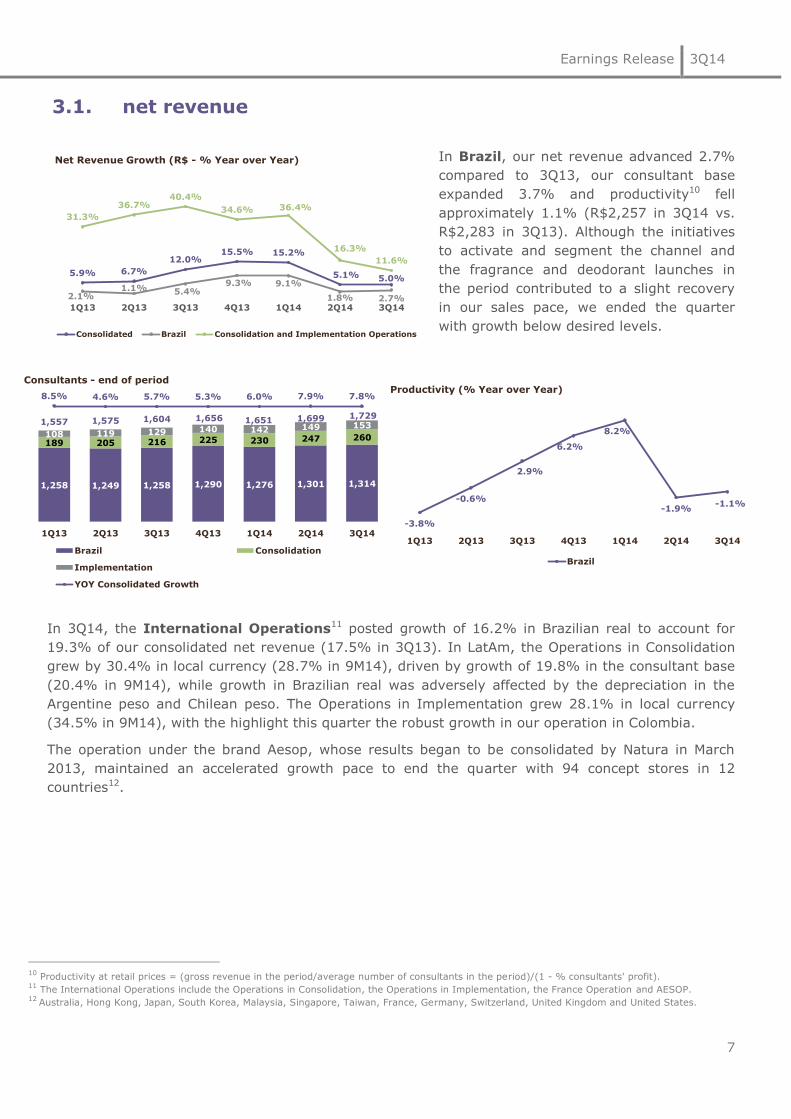
In Brazil, our net revenue advanced 2.7%
compared to 3Q13, our consultant base
expanded 3.7% and productivity10 fell
approximately 1.1% (R$2,257 in 3Q14 vs.
R$2,283 in 3Q13). Although the initiatives
to activate and segment the channel and
the fragrance and deodorant launches in
the period contributed to a slight recovery
in our sales pace, we ended the quarter
with growth below desired levels.
In 3Q14, the International Operations11 posted growth of 16.2% in Brazilian real to account for
19.3% of our consolidated net revenue (17.5% in 3Q13). In LatAm, the Operations in Consolidation
grew by 30.4% in local currency (28.7% in 9M14), driven by growth of 19.8% in the consultant base
(20.4% in 9M14), while growth in Brazilian real was adversely affected by the depreciation in the
Argentine peso and Chilean peso. The Operations in Implementation grew 28.1% in local currency
(34.5% in 9M14), with the highlight this quarter the robust growth in our operation in Colombia.
The operation under the brand Aesop, whose results began to be consolidated by Natura in March
2013, maintained an accelerated growth pace to end the quarter with 94 concept stores in 12
countries12.
10
Productivity at retail prices = (gross revenue in the period/average number of consultants in the period)/(1 - % consultants' profit). 11
The International Operations include the Operations in Consolidation, the Operations in Implementation, the France Operation and AESOP. 12 Australia, Hong Kong, Japan, South Korea, Malaysia, Singapore, Taiwan, France, Germany, Switzerland, United Kingdom and United States.
5.9% 6.7%
12.0%15.5% 15.2%
5.1% 5.0%
2.1%1.1% 5.4%
9.3% 9.1%
1.8% 2.7%
31.3%
36.7%40.4%
34.6% 36.4%
16.3%
11.6%
1Q13 2Q13 3Q13 4Q13 1Q14 2Q14 3Q14
Net Revenue Growth (R$ - % Year over Year)
Consolidated Brazil Consolidation and Implementation Operations
1,258 1,249 1,258 1,290 1,276 1,301 1,314
189 205 216 225 230 247 260108 119 129 140 142 149 1531,557 1,575 1,604 1,656 1,651 1,699 1,729
8.5% 4.6% 5.7% 5.3% 6.0% 7.9% 7.8%
1Q13 2Q13 3Q13 4Q13 1Q14 2Q14 3Q14
Consultants - end of period
Brazil Consolidation
Implementation
YOY Consolidated Growth
-3.8%
-0.6%
2.9%
6.2%
8.2%
-1.9%-1.1%
1Q13 2Q13 3Q13 4Q13 1Q14 2Q14 3Q14
Productivity (% Year over Year)
Brazil

Earnings Release 3Q14
8
3.2. innovation & products
In the 12 months to September, the
innovation index13 stood at 65.9%,
compared to 63.8% in the prior-year
period, and was within the target range
(between 60% and 70%).
This improvement in the index is explained
by the recent fragrance launches (Essencial,
Kaiak Extremo, Kriska, #Urbano) and by
the maturation of the SOU line that was
launched in the latter half of last year.
3.3. gross margin
In 3Q14, consolidated gross margin remained stable compared to the year-ago period. In Brazil, the
price increases implemented in July, the improvement in manufacturing costs and the stability in
promotional efforts supported gross margin expansion both sequentially and compared to the year-
ago period. Meanwhile, in the International Operations, gross margin was adversely affected by the
appreciation in the Brazilian real against a basket of LatAm currencies.
The following table presents the main components of COGS:
3.4. operating expenses
In Brazil, the slight relative increase (% of
net revenue) in selling, marketing and
logistics expenses was due to the
combination of the improvement in capacity
utilization in our logistics operations,
especially at the new distribution center in
São Paulo, with the continued high levels of
delinquency. We continue to strengthen our
13
Innovation Index: share in the last 12 months of the sale of products launched in the last 24 months.
65.0% 65.3% 63.8% 63.4% 62.4% 61.0%65.9%
1Q13 2Q13 3Q13 4Q13 1Q14 2Q14 3Q14
Innovation (%NV)
3Q14 3Q13 9M14 9M13
79.9 76.6 80.2 79.7
9.6 9.0 9.8 9.6
3.0 4.6 2.8 3.3
7.5 9.8 7.2 7.4
Total 100.0 100.0 100.0 100.0
*Raw materials, packaging materials and finished products.
RM / PM / FP*
Labor
Depreciation
Other
70.1%
70.6% 70.7%
68.5%
70.0%
68.5%
70.9%70.1%
70.3% 70.4%
67.5% 69.1% 67.3%
70.8%
69.6%
71.5% 70.5% 70.9% 71.6% 71.7%
68.4%
1Q13 2Q13 3Q13 4Q13 1Q14 2Q14 3Q14
Gross Margin (%NR)
Consolidated Brazil Consolidation and Implementation Operations
33.0% 34.3%
47.7% 48.0%
33.8% 35.2%
48.9% 50.1%
Quarter Year to Date Quarter Year to Date
Selling, Marketing and Logistics Expenses (%NR)
2013 2014
BrazilConsolidation and
Implementation Operations

Earnings Release 3Q14
9
credit approval and collections processes and criteria. The nominal increase of 5.1% reaffirms the
deceleration trend in these expenses, reflecting our program to capture efficiency gains that has
achieved significant advances over the past few quarters. In the International Operations, the relative
increase (% of net revenue) in these expenses was due to the high concentration of marketing
investments in the quarter and the inflationary pressures on costs at our Operation in Argentina.
Administrative, R&D, IT and project
expenses in Brazil decreased in both
relative (% of net revenue) and nominal
terms compared to 3Q13, as a result of the
continued capture of efficiency gains and
the adjustments made to the organization
in the first half of the year. In the
International Operations, the relative (% of
net revenue) reduction was due to the
higher dilution of fixed costs.
3.5. other operating income and expenses
In 3Q14, consolidated other operating income amounted to R$1.5 million, compared to the operating
expense of R$3.1 million in 3Q13 (income of R$17.0 million in 9M14 vs. income of R$14.4 million in
9M13).
3.6. other international investments
Other international investments, which are related to the operation in France, the international
corporate structure based in Buenos Aires and the AESOP operation, recorded operating losses
(EBITDA) of R$18.3 million in 3Q14 (loss of R$30.2 million in 3Q13) and R$45.9 million in 9M14 (loss
of R$81.8 million in 9M13). The lower operating loss is explained by the improvement in results at
Aesop14 and the depreciation in the Argentine peso against the Brazilian real, which had a positive
impact on corporate expenses in Buenos Aires when translated into local currency.
3.7. EBITDA
In 3Q14, consolidated EBITDA amounted to R$427.1 million, with EBITDA margin of 22.9% (22.4% in
3Q13). In the first nine months of the year, consolidated EBITDA amounted to R$1,063.1 million, with
EBITDA margin of 20.3% (22.1% in 9M13). In Brazil, the advances in both EBITDA and EBITDA
margin (% of net revenue) were driven by the continued capture of efficiency gains, the lower
relevance of factors that compromised gross margin in 6M14 (currency translation, promotional
efforts and production capacity utilization) and the higher capacity utilization in our logistics
operations. In the International Operations, EBITDA grew 64.9% compared to 3Q13 while EBITDA
margin expanded 1.7 p.p. (5.7% in 3Q14 vs. 4.0% in 3Q13). The increased efficiency in our corporate
expenses in Buenos Aires and the positive performance at Aesop offset the negative currency-
translation impact on gross margin and the shift across quarters in the distribution of marketing
14
In 1Q13, we recorded only the result for March 2013, since the acquisition was concluded on February 28, 2013. In addition, in the same quarter,
we also incurred acquisition costs that had an adverse impact on the result of “Other international investments.”
14.2%13.8%
8.0% 8.6%
13.0% 13.5%
7.6% 7.9%
Quarter Year to Date Quarter Year to Date
Administrative, R&D, IT and Projects Expenses (%NR)
2013 2014
BrazilConsolidation and
Implementation Operations

Earnings Release 3Q14
10
expenses in relation to last year.
EBITDA (R$ million) Figures include the operating result and transaction costs associated with AESOP.
In the first six months of 2014, as planned, we reviewed the useful lives of the items recorded in
property, plant and equipment and intangible assets. Based on this review, in 2Q14, we revised the
estimated useful lifespan of certain assets to align them with best market practices. The application of
these revised rates affects exclusively accounting profit, in other words, it has no impact on
distributable profit and consequently on dividends. This adjustment mainly impacted assets related to
information technology.
For more information on the new annual depreciation rates based on the revised useful lifespans, see
the charts in Note 14 to the Consolidated Financial Statements for 2Q14.
Pro-forma EBITDA by operational bloc (R$ million) Figures include the operating result and transaction costs associated with AESOP.
3.8. net income
In 3Q14, consolidated net income grew 16.8%
from 3Q14, with net margin of 11.5% (10.3%
in 3Q13). In addition to the 7.2% increase in
EBITDA from the year-ago period, net income
growth is also explained by the noncash gain
from the mark-to-market adjustments of
derivatives pegged to foreign-denominated
debt. Excluding the effects from mark-to-
market adjustments (loss of R$9 million in
3Q14 vs. loss of R$47 million in 3Q13), net
income decreased by approximately 3% from 3Q13.
3Q14 3Q13 Change % 9M14 9M13 Change %
Net Revenue 1,867.3 1,777.7 5.0 5,226.2 4,844.7 7.9
(-) Cost of Sales and Expenses 1,491.9 1,432.4 4.2 4,307.6 3,916.7 10.0
EBIT 375.4 345.3 8.7 918.6 928.0 (1.0)
(+) Depreciation/Amortization 51.6 53.1 (2.7) 144.4 142.3 1.5
EBITDA 427.1 398.3 7.2 1,063.1 1,070.3 (0.7)
3Q14 3Q13 Change % 9M14 9M13 Change %
Brazil 406.6 385.9 5.4 1,002.3 1,051.1 (4.6)
Argentina, Chile and Peru 36.6 40.5 (9.6) 91.1 94.3 (3.3)
Mexico and Colombia 2.2 2.1 n/a 15.6 6.7 n/a
Other Investments (18.3) (30.2) n/a (46.0) (81.8) n/a
EBITDA 427.1 398.3 7.2 1,063.1 1,070.3 (0.7)
9.2%
14.0%
10.3%
13.6%
7.5%
9.8%
11.5%
1Q13 2Q13 3Q13 4Q13 1Q14 2Q14 3Q14
Net Margin (%NR)
Earnings Release 3Q14
11
3.9. cash flow15
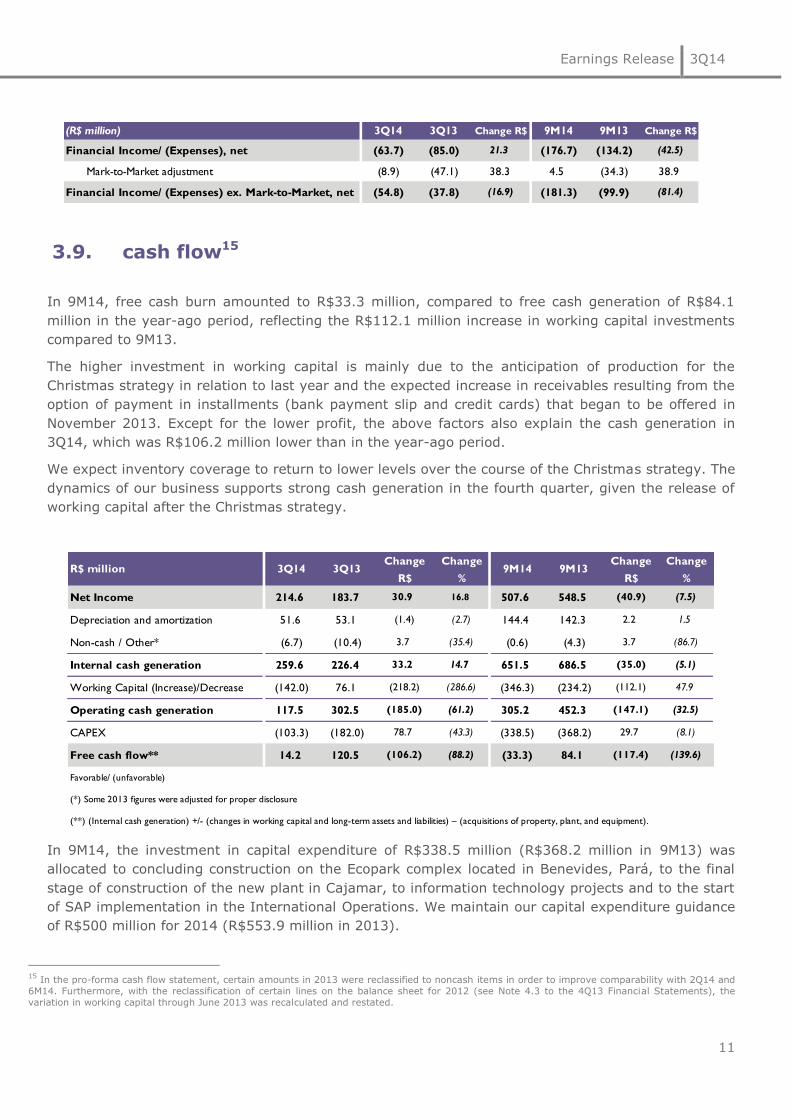
In 9M14, free cash burn amounted to R$33.3 million, compared to free cash generation of R$84.1
million in the year-ago period, reflecting the R$112.1 million increase in working capital investments
compared to 9M13.
The higher investment in working capital is mainly due to the anticipation of production for the
Christmas strategy in relation to last year and the expected increase in receivables resulting from the
option of payment in installments (bank payment slip and credit cards) that began to be offered in
November 2013. Except for the lower profit, the above factors also explain the cash generation in
3Q14, which was R$106.2 million lower than in the year-ago period.
We expect inventory coverage to return to lower levels over the course of the Christmas strategy. The
dynamics of our business supports strong cash generation in the fourth quarter, given the release of
working capital after the Christmas strategy.
In 9M14, the investment in capital expenditure of R$338.5 million (R$368.2 million in 9M13) was
allocated to concluding construction on the Ecopark complex located in Benevides, Pará, to the final
stage of construction of the new plant in Cajamar, to information technology projects and to the start
of SAP implementation in the International Operations. We maintain our capital expenditure guidance
of R$500 million for 2014 (R$553.9 million in 2013).
15
In the pro-forma cash flow statement, certain amounts in 2013 were reclassified to noncash items in order to improve comparability with 2Q14 and
6M14. Furthermore, with the reclassification of certain lines on the balance sheet for 2012 (see Note 4.3 to the 4Q13 Financial Statements), the
variation in working capital through June 2013 was recalculated and restated.
(R$ million) 3Q14 3Q13 Change R$ 9M14 9M13 Change R$
Financial Income/ (Expenses), net (63.7) (85.0) 21.3 (176.7) (134.2) (42.5)
Mark-to-Market adjustment (8.9) (47.1) 38.3 4.5 (34.3) 38.9
Financial Income/ (Expenses) ex. Mark-to-Market, net (54.8) (37.8) (16.9) (181.3) (99.9) (81.4)
R$ million 3Q14 3Q13Change
R$
Change
%9M14 9M13
Change
R$
Change
%
Net Income 214.6 183.7 30.9 16.8 507.6 548.5 (40.9) (7.5)
Depreciation and amortization 51.6 53.1 (1.4) (2.7) 144.4 142.3 2.2 1.5
Non-cash / Other* (6.7) (10.4) 3.7 (35.4) (0.6) (4.3) 3.7 (86.7)
Internal cash generation 259.6 226.4 33.2 14.7 651.5 686.5 (35.0) (5.1)
Working Capital (Increase)/Decrease (142.0) 76.1 (218.2) (286.6) (346.3) (234.2) (112.1) 47.9
Operating cash generation 117.5 302.5 (185.0) (61.2) 305.2 452.3 (147.1) (32.5)
CAPEX (103.3) (182.0) 78.7 (43.3) (338.5) (368.2) 29.7 (8.1)
Free cash flow** 14.2 120.5 (106.2) (88.2) (33.3) 84.1 (117.4) (139.6)
Favorable/ (unfavorable)
(**) (Internal cash generation) +/- (changes in working capital and long-term assets and liabilities) – (acquisitions of property, plant, and equipment).
(*) Some 2013 figures were adjusted for proper disclosure

Earnings Release 3Q14
12
3.10. indebtedness
Our current leverage level (net debt/EBITDA ratio of 1.24x) mainly reflects the investments in capital
expenditure and the higher working capital needs in the period.
Debt (R$ million) Sep/14 Share (%) Sep/13 Share (%)Change
(%)
Short-Term 918.6 29.4 877.1 38.2 4.7
Long-Term 2,651.7 84.8 1,731.9 75.5 53.1
Derivatives (189.7) (6.1) (120.1) (5.2) 58.0
Finance Leases / Others (253.3) (8.1) (195.5) (8.5) 29.6
Total Debt 3,127.3 100.0 2,293.4 100.0 36.4
(-) Cash, cash equivalents and short-term investment 1,137.0 842.1 35.0
(=) Net Debt - Net Cash 1,990.2 1,451.2 37.1
Net Debt / Ebitda 1.24 0.95
Total Debt / Ebitda 1.95 1.50

Earnings Release 3Q14
13
4. stock performance
In 9M14, the price of Natura stock (NATU3) declined by 6.5% from December 31, 2013, while the
Bovespa Index fell by 5.3%. Average daily trading volume in 9M14 was R$50.0 million, compared to
R$66.6 million in the prior-year period.
Our average ranking in the Bovespa Liquidity Index in the period was 37th.
The following chart shows the performance of Natura stock since its IPO:
+593.4%
0
200
400
600
800
1000
1200
1400
Base 100 = 05/26/2004
Bovespa Index
NATU3
NATU3: +87.3%
Ibov: +38.9%+38.0%
+27.7%
+51.2%
+32.9%-41.4%
+43.7%
+18.0%
- 41.2%+101.9%
+82.6%
NATU3
26/05/2004
R$ 5.33
2004 2005 2006 2007 2008 2009 2010
NATU3
30/09/2014
R$ 36.98
+183.8%
Follow On
31/07/2009
R$ 21.38
2011
-20.4%
-18.1%
2012
+69.0%
+7.3%
2013+36.7%
+1.1%-26.6%
-15.5%
All prices expressed in ex dividend terms.
2014
+6.5%
-5.3%

Earnings Release 3Q14
14
conference call
& webcast
PORTUGUESE: Friday, October 24, 2014
10:00 a.m. (Brasília time)
ENGLISH: Friday, October 24, 2014
12:00 p.m. (Brasília time)
From Brazil: +55 11 3193 1001 /+55 11 2820 4001
From the USA: Toll free +1 888 700 0802
From other countries: +1 786 924 6977
Code: Natura
Live webcast:
www.natura.net/investidor
investor
relations
Tel: (55 11) 4571-7786
Fabio Cefaly, [email protected]
Tatiana Carvalho, [email protected]
Francisco Petroni, [email protected]
Julia Villas Bôas, [email protected]

Earnings Release 3Q14
15
balance
sheets as of September 2014 and December 2013 (in millions of Brazilian real - R$)
ASSETS Sep/14 Dec/13 LIABILITIES AND SHAREHOLDERS' EQUITY Sep/14 Dec/13
CURRENT ASSETS CURRENT LIABILITIES
Cash and cash equivalents 889.7 1,016.3 Borrowings and financing 918.6 693.1
Short-term investments 247.4 293.0 Trade and other payables 733.2 706.6
Trade receivables 803.0 807.0 Payroll, profit sharing and related taxes 233.3 177.6
Inventories 1,074.0 799.5 Taxes payable 636.1 659.3
Recoverable taxes 247.3 181.1 Other payables 71.3 90.2
Derivatives 189.7 153.6 Total current liabilities 2,592.4 2,326.8
Other receivables 256.6 262.4
Total current assets 3,707.6 3,512.9
NONCURRENT ASSETS NONCURRENT LIABILITIES
Long-term assets: Borrowings and financing 2,651.7 2,200.8
Recoverable taxes 187.0 175.1 Taxes payable 243.1 215.6
Deferred income tax and social contribution 194.4 193.8 Provision for tax, civil and labor risks 75.7 73.8
Escrow deposits 457.2 412.4 Provision for acquisition of non-controlling interest 145.1 141.6
Other noncurrent assets 62.4 37.2 Others provisions 127.8 121.4
Property, plant and equipment 1,601.7 1,439.7 Total noncurrent liabilities 3,243.5 2,753.2
Intangible assets 562.4 477.3
Total noncurrent assets 3,065.0 2,735.4 SHAREHOLDERS' EQUITY
Capital 427.1 427.1
Capital reserves 141.7 150.4
Earnings reserves 412.2 162.6
Treasury shares (38.3) (84.0)
Proposed additional dividend 0.0 496.4
Other comprehensive losses (31.5) (6.9)
Total equity attributable to owners of the Company 911.2 1,145.6
Non- controlling interests 25.5 22.6
Total equity 936.7 1,168.3
TOTAL ASSETS 6,772.6 6,248.3 TOTAL LIABILITIES AND SHAREHOLDERS' EQUITY 6,772.6 6,248.3
Earnings Release 3Q14
16
statements
of income for the periods of three and nine months ended September
30, 2014 and 2013
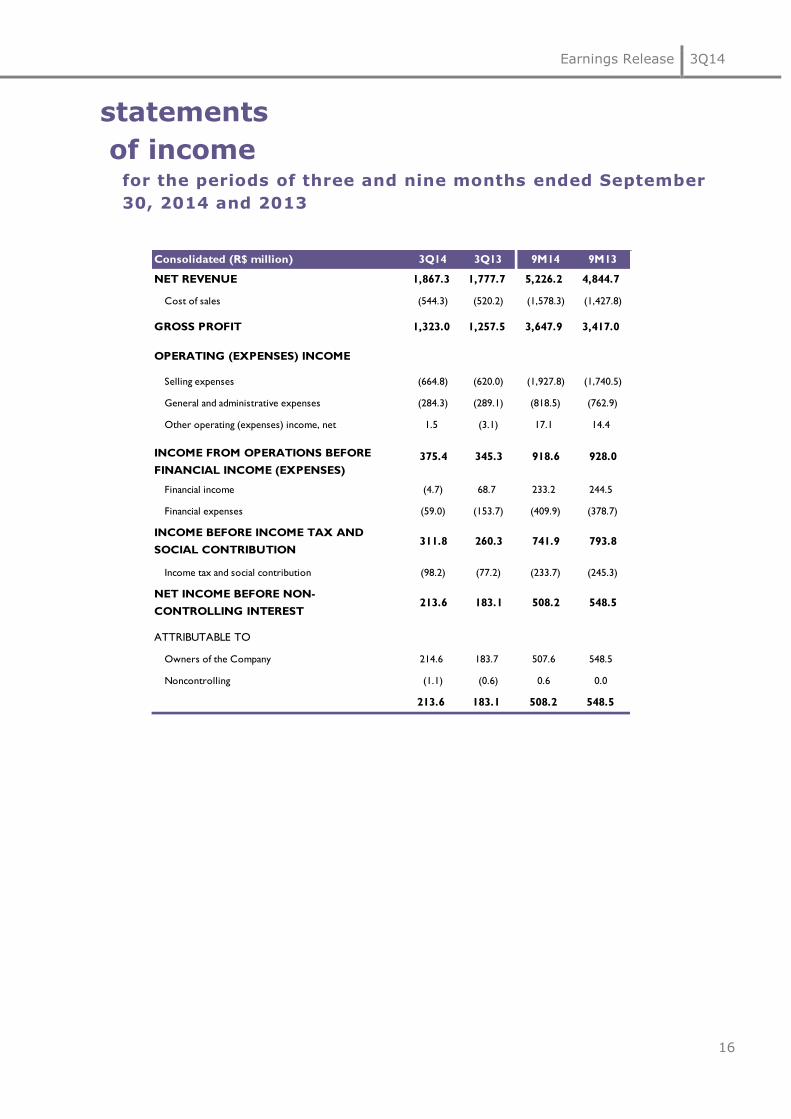
Consolidated (R$ million) 3Q14 3Q13 9M14 9M13
NET REVENUE 1,867.3 1,777.7 5,226.2 4,844.7
Cost of sales (544.3) (520.2) (1,578.3) (1,427.8)
GROSS PROFIT 1,323.0 1,257.5 3,647.9 3,417.0
OPERATING (EXPENSES) INCOME
Selling expenses (664.8) (620.0) (1,927.8) (1,740.5)
General and administrative expenses (284.3) (289.1) (818.5) (762.9)
Other operating (expenses) income, net 1.5 (3.1) 17.1 14.4
Financial income (4.7) 68.7 233.2 244.5
Financial expenses (59.0) (153.7) (409.9) (378.7)
Income tax and social contribution (98.2) (77.2) (233.7) (245.3)
Owners of the Company 214.6 183.7 507.6 548.5
Noncontrolling (1.1) (0.6) 0.6 0.0
213.6 183.1 508.2 548.5
918.6 928.0INCOME FROM OPERATIONS BEFORE
FINANCIAL INCOME (EXPENSES)
508.2 548.5
741.9 793.8
ATTRIBUTABLE TO
375.4 345.3
NET INCOME BEFORE NON-
CONTROLLING INTEREST213.6 183.1
311.8 260.3INCOME BEFORE INCOME TAX AND
SOCIAL CONTRIBUTION

Earnings Release 3Q14
17
statements
of cash flow for the periods ended September 30, 2014 and 2013
Consolidated (R$ million) 9M14 9M13
CASH FLOW FROM OPERATING ACTIVITIES
Net income 507.6 548.5
Depreciation and amortization 144.4 142.2
Provision (reversal ) for losses on swap and forward transactions 53.8 (39.3)
Provision (reversal) for tax, civil and labor contingencies 7.7 13.9
Interest and inflation adjustment of escrow deposits (24.1) (13.0)
Income tax and social contribution 233.7 245.3
(Gain) loss on sale on property, plant and equipment and intangible assets 20.0 5.4
Interest and exchange rate changes on borrowings and financing and other liabilities 69.5 237.4
Exchange rate changes on other assets and other liabilities (23.7) 0.9
Expenses with stock options plans 5.6 9.1
Provision for discount on assignment of ICMS credits 0.0 (3.5)
Allowance for doubtful accounts 13.4 8.9
Allowance for inventory losses (17.4) 35.9
Net income attributable to non-controlling shareholders 0.6 0.0
Provision for healthcare plan and carbon credits 5.6 (0.6)
Recognition of untimely used tax credits (13.5) (6.8)
Provision for acquisition of non-controlling interest 3.5 0.0
Hedge of Cash flow (2.1) 0.0
Non-controlling interest in the equity of subsidiaries 2.3 0.0
987.1 1,184.5
(INCREASE) DECREASE IN ASSETS
Trade receivables (9.4) (62.7)
Inventories (257.1) (210.4)
Recoverable taxes (64.6) (72.9)
Other receivables (19.5) (17.7)
Subtotal (350.6) (363.8)
INCREASE (DECREASE) IN LIABILITIES
Domestic and foreign suppliers 27.7 36.5
Payroll, profit sharing and related taxes, net 55.6 5.7
Taxes payable 15.9 (32.2)
Other payables (19.4) 20.7
Provision for tax, civil and labor contingencies (5.8) (4.6)
Subtotal 74.1 26.1
CASH GENERATED BY OPERATING ACTIVITIES 710.7 846.8
Adjustments to reconcile net income to net cash provided by operating
activities:

Earnings Release 3Q14
18
OTHER CASH FLOWS FROM OPERATING ACTIVITIES
Payments of income tax and social contribution (246.1) (182.5)
Withdrawal (payment) of escrow deposits (20.7) (36.0)
Payments of derivatives (89.8) 2.1
Payment of interest on borrowings and financing (109.0) (121.8)
NET CASH GENERATED BY OPERATING ACTIVITIES 245.0 508.7
CASH FLOW FROM INVESTING ACTIVITIES
Acquisition of property, plant and equipment and intangible assets (338.5) (368.4)
Proceeds from sale of property, plant and equipment and intangible assets 0.0 21.2
Short-term investments 3,472.4 (3,363.9)
Redemption of short-term investments (3,426.7) 3,659.4
Noncontrolling interest 0.0 (114.3)
NET CASH USED IN INVESTING ACTIVITIES (292.8) (166.0)
CASH FLOW FROM INVESTING ACTIVITIES
Repayments of borrowings and financing - principal (565.4) (692.9)
Proceeds from borrowings and financing 1,209.6 727.6
Sale of treasury shares due to exercise of stock options 33.5 32.9
Payment of dividends and interest on capital of the prior year (756.5) (491.3)
Anticipation of dividends and interest on capital of the year/period 0.0 (364.8)
Repurchase of treasury shares 0.0 (60.2)
NET CASH GENERATED (USED) IN FINANCING ACTIVITIES (78.8) (848.8)
Gains (losses) arising on translating foreign currency cash and cash equivalents 0.0 0.8
INCREASE (DECREASE) IN CASH AND CASH EQUIVALENTS (126.6) (505.3)
Cash and cash equivalents at the beginning of the year/period 1,016.3 1,144.4
Cash and cash equivalents at the end of the year/period 889.7 639.0
DECREASE IN CASH AND CASH EQUIVALENTS (126.6) (505.4)
Additional Statements of Cash Flows Information:
Bank overdrafts - unused 117.9 117.9
Non-cash items
Capitalization of financial leasing 73.0 171.8
Reserve for acquisition of non controlling interest 0.0 83.2

Earnings Release 3Q14
19
glossary
_CDI: the overnight rate for interbank deposits.
_Natura Consultants (CN): self-employed resellers who do not have a formal labor relationship with Natura.
_Natura Consultant Advisors (CNO): self-employed resellers who do not have a formal labor relationship with Natura and
support the Relationship Managers in their activities.
_Supplier Communities: the communities of people involved in small–scale farming and extraction activities in a variety of
locations in Brazil, especially in the Amazon Region, who extract the inputs used in our products from the social and
biodiversity. We form production chains with these communities that are based on fair prices, the sharing of benefits gained
from access to the genetic heritage and associated traditional knowledge and support for local sustainable development
projects. This business model has proven effective in generating social, economic and environmental value for Natura and for
the communities.
_GHG: Greenhouse gases.
_Innovation Index: Share in the last 12 months of the sale of products launched in the last 24 months.
_Natura Institute: is a nonprofit organization created in 2010 to strengthen and expand our Private Social Investment
initiatives. The institute has enabled us to leverage our efforts and investments in actions that contribute to the quality of
public education.
_Target Market: refers to the market share data published by SIPATESP/ABIHPEC. Considers only the segments in which
Natura operates. Excludes diapers, oral hygiene products, hair dyes, nail polish, feminine hygiene products as well as other
products.
_Operations in Consolidation: Grouping of operations: Argentina, Chile and Peru
_Operations in Implementation: Grouping of operations: Colombia and Mexico
_Profit Sharing: the share of profit allocated to employees under the profit-sharing program.
_Natura Crer Para Ver Program: special line of non-cosmetic products whose profits are transferred to the Natura Institute,
in Brazil, and invested by Natura in social initiatives in the other countries where we operate. Our consultants promote these
sales to benefit society and do not obtain any gains.
_Sustainable Relations Network: sales model adopted in Mexico that features eight stages in a consultant’s development:
Natura Consultant, Entrepreneurial Natura Consultant, Natura Developer 1 and 2, Natura Transformer 1 and 2, Natura Inspirer
and Natura Associate. To rise up through the various stages, consultants must fulfill certain criteria based on sales volume,
attracting new consultants and (unlike the models adopted in other countries) personal development and social and
environmental relationships in the community.
_Benefit Sharing: in accordance with Natura’s Policy for the Sustainable Use of Biodiversity and Associated Traditional
Knowledge, benefits are shared whenever we perceive various forms of value in the access gained. Therefore, one of the
practices that define the way in which these resources are divided is to associate payments with the number of raw materials
produced from each plant as well as the commercial success of the products in which these raw materials are used.
_Sipatesp/Abihpec: São Paulo State Perfumery and Toiletries Association / Brazilian Cosmetics, Fragrances and Toiletries
Industry Association.
restated figures
_Pro-forma Income Statement for 3Q13 and 9M13: includes three reclassifications in Brazil and, consequently, in the Consolidated figures, for improved comparison with 2Q14. These adjustments do not impact the figures for EBITDA and Net Income previously reported. These reclassifications between lines are as follows: (1) the reclassification to “Cost of Goods Sold” of the expenses with the provision for employee profit sharing, which were allocated to “Administrative, R&D, IT and Project Expenses;” (2) the reclassification of a portion of “Selling, Marketing and Logistics Expenses” to “Administrative, R&D, IT and Project Expenses to better reflect our new organization aligned with the strategic plan; and (3) “Administrative R&D, IT and Project expenses” consolidating the former line of “Management compensation”, the details of which are available in Note 28.2 to the Financial Statements. These same adjustments will be made in subsequent quarters for amounts referring to 2013.
_Composition of Costs in 3Q13 and 9M13: Restatement of amounts to reflect adjustment (1) described above.
_Non-cash items: restated figures for 3Q13 and 9M13 for improved comparison with 2014 criteria.
_Working Capital in 3Q13 and 9M13: With the reclassification of certain lines on the balance sheet for 2012 (see Note 4.3 to the 4Q13 Financial Statements), the variation in working capital in 3Q13 and 9M13 was recalculated and restated.

Earnings Release 3Q14
20
EBITDA is not a measure under BR GAAP and does not represent cash flow for the periods presented.
EBITDA should not be considered an alternative to net income as an indicator of operating
performance or an alternative to cash flow as an indicator of liquidity. EBITDA does not have a
standardized meaning and the definition of EBITDA used by Natura may not be comparable with that
used by other companies. Although EBITDA does not provide under BR GAAP a measure of cash flow,
Management has adopted its use to measure the Company’s operating performance. Natura also
believes that certain investors and financial analysts use EBITDA as an indicator of performance of its
operations and/or its cash flow.
This report contains forward-looking statements. These forward-looking statements are not historical
fact, but rather reflect the wishes and expectations of Natura’s management. Words such as
"anticipate", "wish", "expect", "foresee", "intend", "plan", "predict", "project", "desire" and similar
terms identify statements that necessarily involve known and unknown risks. Known risks include
uncertainties that are not limited to the impact of price and product competitiveness, the acceptance
of products by the market, the transitions of the Company’s products and those of its competitors,
regulatory approval, currency fluctuations, supply and production difficulties and changes in product
sales, among other risks. This report also contains certain pro forma data, which are prepared by the
Company exclusively for informational and reference purposes and as such are unaudited. This report
is updated up to the present date and Natura does not undertake to update it in the event of new
information and/or future events.
Comentário de Desempenho 3T14
0
São Paulo, 22 de outubro de 2014 – A
Natura Cosméticos S.A. (BM&FBOVESPA:
NATU3) anuncia hoje os resultados do
terceiro trimestre de 2014 (3T14). As
informações financeiras e operacionais a
seguir, exceto onde indicado o contrário,
são apresentadas em base consolidada,
de acordo com as normas internacionais
de relatório financeiro IFRS.
RESULTADOS
3T14

Comentário de Desempenho 3T14
1
Introdução
O mercado brasileiro de Higiene Pessoal, Perfumaria e Cosméticos continua competitivo e
com patamares elevados de crescimento. Nossas recentes iniciativas de ativação e
segmentação do canal, juntamente com lançamentos importantes em perfumaria (#Urbano)
e desodorantes (ecocompacto), permitiram uma leve recuperação de nosso crescimento de
receita, mas ainda abaixo dos níveis desejados. Para os próximos meses, seguimos
confiantes que essas iniciativas, alavancadas pelos investimentos em marketing, serão
relevantes para a recuperação de nossas taxas de crescimento.
No trimestre, tivemos também avanços importantes na execução de nossa estratégia de
médio prazo. Em julho, expandimos a Rede Natura para todo o Estado de São Paulo e no
inicio de outubro para os Estados de Minas Gerais e Rio de Janeiro, e estamos agora nos
preparando para a expansão nacional desse modelo.
Nesse contexto, apesar de a receita no Brasil ter crescido 2,7%, o EBITDA cresceu 5,4%
frente ao 3T13, fruto dos ganhos de eficiência em nossa logística, do equilíbrio da margem
bruta e outras iniciativas de produtividade.
Já nas Operações Internacionais, mantivemos o ritmo acelerado de crescimento. Na Latam,
a receita cresceu 29,3% em moeda local e ultrapassamos a marca de 400 mil consultoras,
enquanto que na Aesop, mantivemos o crescimento acelerado através da abertura de lojas.
No conjunto das Operações Internacionais o EBITDA aumentou 64,9% frente ao 3T13.
Resumo dos resultados do 3T14
No terceiro trimestre de 2014, a receita líquida consolidada da Natura cresceu 5,0% frente
ao 3T13 (2,7% no Brasil e 29,3% em moeda local nas Operações Internacionais1), o
EBITDA2 totalizou R$ 427 milhões (+7,2% vs. 3T13) e o lucro líquido totalizou R$ 215
milhões. No conjunto de nossas operações, encerramos o trimestre com 1,73 milhão de
consultoras (+7,8% vs. 3T13).
Nas Operações Internacionais, que representaram 19,3% (17,5% no 3T13) da receita
consolidada, mantivemos ritmo acelerado de crescimento e expansão da lucratividade. A
receita das Operações em Consolidação3 cresceu 32,9% e das Operações em Implantação4
28,1%, ambas em moeda local. A Aesop, adquirida em março de 2013, conta hoje com 94
lojas em 12 países (73 lojas no 3T13) e mantém um patamar de crescimento acelerado.
O EBITDA consolidado do trimestre cresceu 7,2% em relação ao mesmo período do ano
anterior, com leve expansão de margem, 22,9% no 3T14 frente a 22,4% no 3T13. No Brasil,
os bons resultados do nosso programa de eficiência, os investimentos dos últimos anos em
logística que passam a trazer produtividade, os ajustes na organização realizados no 1S14 e
o equilíbrio da margem bruta compensaram a continuidade de patamares mais altos de
inadimplência, permitindo a expansão da lucratividade frente ao mesmo período do ano
anterior. Adicionalmente, na Latam, desconsiderando as despesas corporativas em Buenos
Aires, tivemos uma leve retração de margem EBITDA, fruto do impacto negativo do câmbio
1 Crescimento de 16,2% em Reais. Menor nível de crescimento deve-se à desvalorização do Peso Argentino e Peso Chileno frente ao Real 2 Considera EBITDA pró-forma.
3 O grupo das Operações em Consolidação contempla Argetina, Chile e Peru.
4 O grupo das Operações em Implantação contempla México e Colômbia.
Comentário de Desempenho 3T14
2
na margem bruta e faseamento das despesas de marketing. Por outro lado, os resultados
favoráveis da Aesop e maior eficiência de custos da estrutura corporativa em Buenos Aires
permitiram um aumento de 1,7pp da lucratividade total das Operações Internacionais.
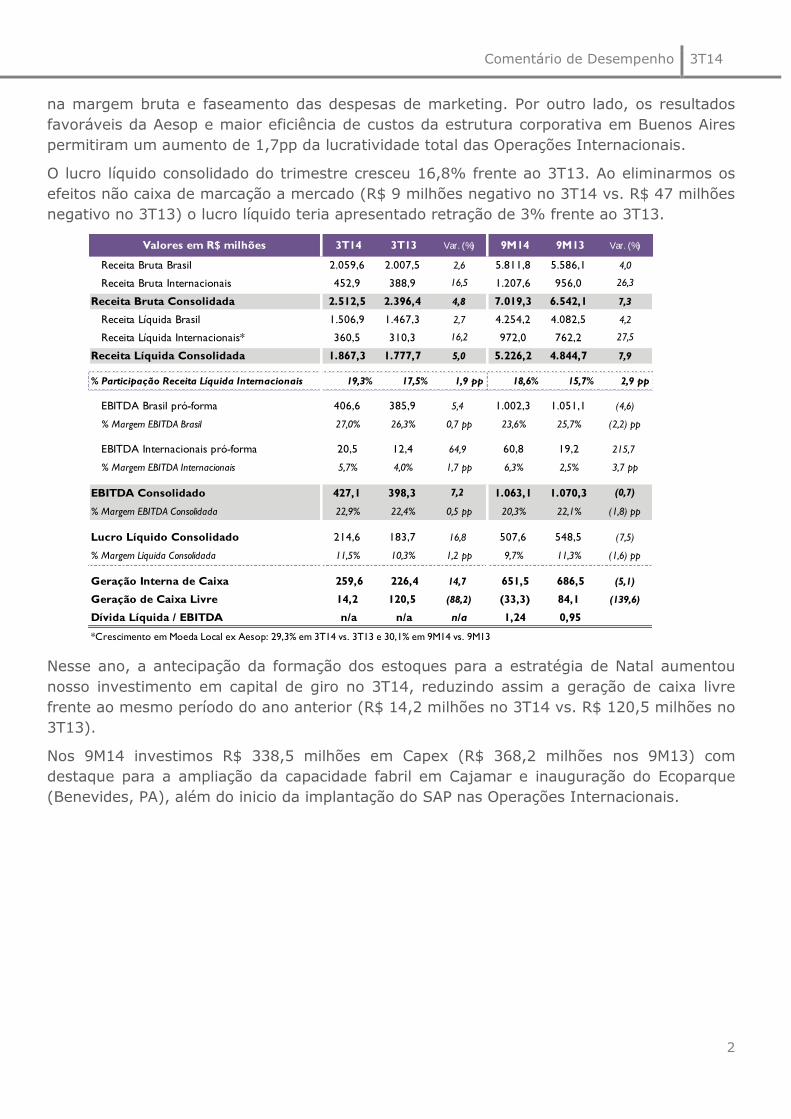
O lucro líquido consolidado do trimestre cresceu 16,8% frente ao 3T13. Ao eliminarmos os
efeitos não caixa de marcação a mercado (R$ 9 milhões negativo no 3T14 vs. R$ 47 milhões
negativo no 3T13) o lucro líquido teria apresentado retração de 3% frente ao 3T13.
Nesse ano, a antecipação da formação dos estoques para a estratégia de Natal aumentou
nosso investimento em capital de giro no 3T14, reduzindo assim a geração de caixa livre
frente ao mesmo período do ano anterior (R$ 14,2 milhões no 3T14 vs. R$ 120,5 milhões no
3T13).
Nos 9M14 investimos R$ 338,5 milhões em Capex (R$ 368,2 milhões nos 9M13) com
destaque para a ampliação da capacidade fabril em Cajamar e inauguração do Ecoparque
(Benevides, PA), além do inicio da implantação do SAP nas Operações Internacionais.
Valores em R$ milhões 3T14 3T13 Var. (%) 9M14 9M13 Var. (%)
Receita Bruta Brasil 2.059,6 2.007,5 2,6 5.811,8 5.586,1 4,0
Receita Bruta Internacionais 452,9 388,9 16,5 1.207,6 956,0 26,3
Receita Bruta Consolidada 2.512,5 2.396,4 4,8 7.019,3 6.542,1 7,3
Receita Líquida Brasil 1.506,9 1.467,3 2,7 4.254,2 4.082,5 4,2
Receita Líquida Internacionais* 360,5 310,3 16,2 972,0 762,2 27,5
Receita Líquida Consolidada 1.867,3 1.777,7 5,0 5.226,2 4.844,7 7,9
% Participação Receita Líquida Internacionais 19,3% 17,5% 1,9 pp 18,6% 15,7% 2,9 pp
EBITDA Brasil pró-forma 406,6 385,9 5,4 1.002,3 1.051,1 (4,6)
% Margem EBITDA Brasil 27,0% 26,3% 0,7 pp 23,6% 25,7% (2,2) pp
EBITDA Internacionais pró-forma 20,5 12,4 64,9 60,8 19,2 215,7
% Margem EBITDA Internacionais 5,7% 4,0% 1,7 pp 6,3% 2,5% 3,7 pp
EBITDA Consolidado 427,1 398,3 7,2 1.063,1 1.070,3 (0,7)
% Margem EBITDA Consolidada 22,9% 22,4% 0,5 pp 20,3% 22,1% (1,8) pp
Lucro Líquido Consolidado 214,6 183,7 16,8 507,6 548,5 (7,5)
% Margem Líquida Consolidada 11,5% 10,3% 1,2 pp 9,7% 11,3% (1,6) pp
Geração Interna de Caixa 259,6 226,4 14,7 651,5 686,5 (5,1)
Geração de Caixa Livre 14,2 120,5 (88,2) (33,3) 84,1 (139,6)
Dívida Líquida / EBITDA n/a n/a n/a 1,24 0,95
*Crescimento em Moeda Local ex Aesop: 29,3% em 3T14 vs. 3T13 e 30,1% em 9M14 vs. 9M13

Comentário de Desempenho 3T14
3
1. mercado de higiene pessoal, perfumaria
e cosméticos (HPPC)
Segundo os dados da SIPATESP/ABHIPEC5 disponíveis para o acumulado até junho de 2014,
o mercado alvo da Natura cresceu 12,9%, com um bom equilíbrio entre crescimento de
volume e preço. Nos primeiros seis meses de 2014, o market share da Natura foi de 19,4%,
apresentando uma queda de 1,3 ponto percentual frente ao mesmo período de 2013,
principalmente nas categorias de Higiene Pessoal.
O crescimento do mercado foi alavancado pelas categorias de higiene pessoal, com destaque
para as categorias de cabelos, sabonetes, desodorantes e corpo.
Nas categorias de Cosméticos e Fragrâncias tivemos bons resultados em perfumaria ao
passo que nas categorias de maquiagem e rosto o crescimento está aquém de nossas
expectativas.
Fonte: Sipatesp/ABIHPEC
5 Sipatesp/Abihpec:Sindicato da Indústria de Perfumarias de Artigos de Toucador no Estado de São Paulo / Associação Brasileira da Indústria de
Higiene Pessoal, Perfumaria e Cosméticos.
6M14 6M13 Var. 6M14 6M13 Var.
Cosméticos e Fragrâncias 5.876 5.382 9,2% 32,7% 33,3% (0,6) pp
Higiene Pessoal 8.024 6.927 15,8% 9,7% 10,9% (1,2) pp
Total 13.900 12.309 12,9% 19,4% 20,7% (1,3) pp
BrasilMercado Alvo
(R$ Milhões)
Market Share Natura
(%)

Comentário de Desempenho 3T14
4
2. destaques socioambientais
Passamos a compor o Índice Dow Jones de Sustentabilidade 2014 (DJSI), referência para
investidores que também pautam suas decisões em questões socioambientais.
Anualmente, as empresas com maior valor de mercado são convidadas a ingressar no índice
e, agrupadas em setores e regiões, respondem um extenso questionário que posteriormente
é analisado pelo time de analistas do DJSI. Apenas as 10% com melhor avaliação, pelas
suas práticas e governança nos parâmetros econômico, social e ambiental, passam a
compor o índice.
Além de ser um importante reconhecimento, reforça nosso posicionamento com investidores
que buscam apoiar o desenvolvimento de negócios mais sustentáveis e se torna uma fonte
relevante de informações para evoluirmos nossas práticas.
Nos últimos meses, tivemos dois lançamentos de produtos que reforçam nosso compromisso
com a sustentabilidade. Apresentamos os refis de perfumaria na linha Ekos, que são
produzidos com PET 100% reciclado e reduzem em 72% a emissão de carbono, fazendo da
Natura a primeira grande marca brasileira a desenvolver e lançar refis em embalagem PET
100% reciclado pós-consumo na categoria perfumaria.
O ecocompacto, lançado em setembro, revoluciona o conceito de desodorante aerossol. O
produto traz, em sua fórmula e válvula, tecnologia inovadora que permitiu reduzir o
tamanho de sua embalagem pela metade (quando comparado com embalagens comuns),
sem perder eficiência. O resultado foi uma diminuição significativa da quantidade de
alumínio e gás propelente necessários, o que minimizou em 48% a emissão de CO2 absoluta
em relação às emissões de desodorantes aerossóis de embalagem comum (90 e 105 g).
Abaixo apresentamos os resultados socioambientais acumulados do 3T14:
Comentário de Desempenho 3T14
5
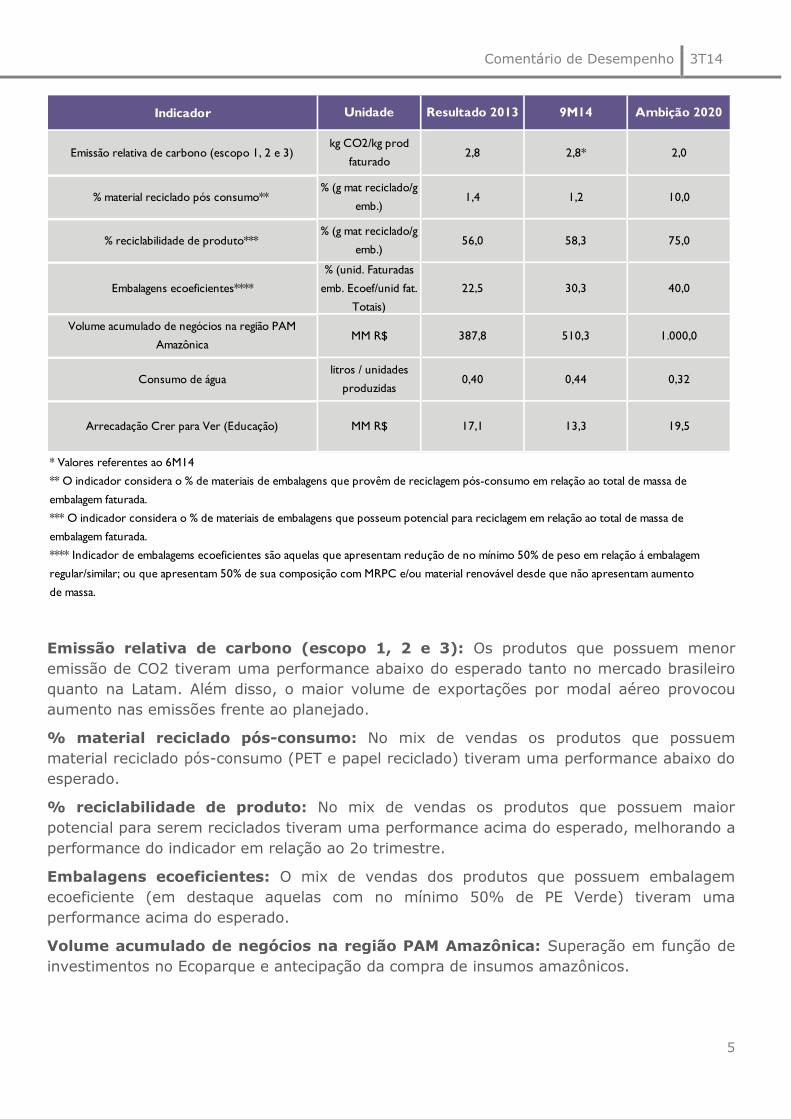
Emissão relativa de carbono (escopo 1, 2 e 3): Os produtos que possuem menor
emissão de CO2 tiveram uma performance abaixo do esperado tanto no mercado brasileiro
quanto na Latam. Além disso, o maior volume de exportações por modal aéreo provocou
aumento nas emissões frente ao planejado.
% material reciclado pós-consumo: No mix de vendas os produtos que possuem
material reciclado pós-consumo (PET e papel reciclado) tiveram uma performance abaixo do
esperado.
% reciclabilidade de produto: No mix de vendas os produtos que possuem maior
potencial para serem reciclados tiveram uma performance acima do esperado, melhorando a
performance do indicador em relação ao 2o trimestre.
Embalagens ecoeficientes: O mix de vendas dos produtos que possuem embalagem
ecoeficiente (em destaque aquelas com no mínimo 50% de PE Verde) tiveram uma
performance acima do esperado.
Volume acumulado de negócios na região PAM Amazônica: Superação em função de
investimentos no Ecoparque e antecipação da compra de insumos amazônicos.
Indicador
* Valores referentes ao 6M14
** O indicador considera o % de materiais de embalagens que provêm de reciclagem pós-consumo em relação ao total de massa de
embalagem faturada.
*** O indicador considera o % de materiais de embalagens que posseum potencial para reciclagem em relação ao total de massa de
embalagem faturada.
**** Indicador de embalagems ecoeficientes são aquelas que apresentam redução de no mínimo 50% de peso em relação á embalagem
regular/similar; ou que apresentam 50% de sua composição com MRPC e/ou material renovável desde que não apresentam aumento
de massa.
0,32
19,5
2,0
10,0
75,0
40,0
1.000,0
Unidade
kg CO2/kg prod
faturado
% (unid. Faturadas
emb. Ecoef/unid fat.
Totais)
MM R$
22,5
387,8
0,44
13,3
Resultado 2013
2,8
1,4
56,0
0,40
17,1
9M14 Ambição 2020
Volume acumulado de negócios na região PAM
Amazônica
Embalagens ecoeficientes****
2,8*
1,2
58,3
30,3
510,3
% (g mat reciclado/g
emb.)
% (g mat reciclado/g
emb.)
Arrecadação Crer para Ver (Educação) MM R$
litros / unidades
produzidas
Emissão relativa de carbono (escopo 1, 2 e 3)
% material reciclado pós consumo**
% reciclabilidade de produto***
Consumo de água

Comentário de Desempenho 3T14
6
Consumo de água: Consumo de água nos sites acima do planejado, devido ao atraso na
desativação da fábrica em Benevides e problemas na utilização de água de reuso no site de
Cajamar.
Arrecadação Crer para Ver (Educação): Boa performance impulsionada por mecânicas
promocionais e lançamentos mais eficientes.
Comentário de Desempenho 3T14
7
3. desempenho econômico-financeiro678
9
6 Nos resultados pró-formas, a margem de lucro alcançada nas exportações do Brasil para as Operações Internacionais foi subtraída do CPV das
respectivas operações, demonstrando o real impacto dessas subsidiárias no resultado consolidado da empresa. Desta forma, a Demonstração de
Resultados pró-forma Brasil apresenta somente o resultado das vendas realizadas no mercado interno. 7 Consolidado inclui Brasil, Operações em Consolidação, Operações em Implantação e outros Investimentos Internacionais, incluindo impacto de
aquisições. 8 Posição ao final do Ciclo 13 no Brasi e França e Ciclo 12 nas Operações em Consolidação e em Implantação. 9 Despesas Administrativas, P&D, TI e Projetos contempla a Remuneração dos Administradores, cujos detalhes estão disponíveis na nota explicativa
número 28.2 das Demonstrações de Resultados Financeiros.
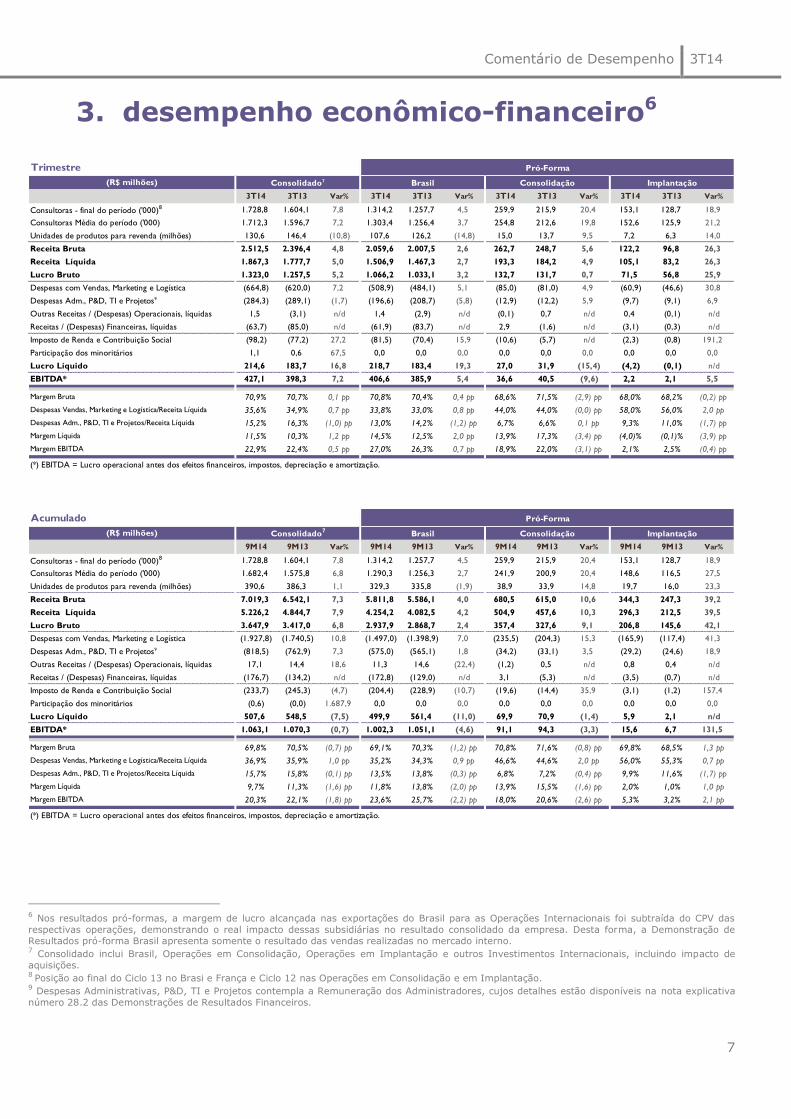
Trimestre Pró-Forma Pró-Forma
(R$ milhões) Consolidado7 Brasil Consolidação Implantação Novos Negócios
3T14 3T13 Var% 3T14 3T13 Var% 3T14 3T13 Var% 3T14 3T13 Var%
Consultoras - final do período ('000)8 1.728,8 1.604,1 7,8 1.314,2 1.257,7 4,5 259,9 215,9 20,4 153,1 128,7 18,9
Consultoras Média do período ('000) 1.712,3 1.596,7 7,2 1.303,4 1.256,4 3,7 254,8 212,6 19,8 152,6 125,9 21,2
Unidades de produtos para revenda (milhões) 130,6 146,4 (10,8) 107,6 126,2 (14,8) 15,0 13,7 9,5 7,2 6,3 14,0
Receita Bruta 2.512,5 2.396,4 4,8 2.059,6 2.007,5 2,6 262,7 248,7 5,6 122,2 96,8 26,3
Receita Líquida 1.867,3 1.777,7 5,0 1.506,9 1.467,3 2,7 193,3 184,2 4,9 105,1 83,2 26,3
Lucro Bruto 1.323,0 1.257,5 5,2 1.066,2 1.033,1 3,2 132,7 131,7 0,7 71,5 56,8 25,9
Despesas com Vendas, Marketing e Logística (664,8) (620,0) 7,2 (508,9) (484,1) 5,1 (85,0) (81,0) 4,9 (60,9) (46,6) 30,8
Despesas Adm., P&D, TI e Projetos9 (284,3) (289,1) (1,7) (196,6) (208,7) (5,8) (12,9) (12,2) 5,9 (9,7) (9,1) 6,9
Outras Receitas / (Despesas) Operacionais, líquidas 1,5 (3,1) n/d 1,4 (2,9) n/d (0,1) 0,7 n/d 0,4 (0,1) n/d
Receitas / (Despesas) Financeiras, líquidas (63,7) (85,0) n/d (61,9) (83,7) n/d 2,9 (1,6) n/d (3,1) (0,3) n/d
Imposto de Renda e Contribuição Social (98,2) (77,2) 27,2 (81,5) (70,4) 15,9 (10,6) (5,7) n/d (2,3) (0,8) 191,2
Participação dos minoritários 1,1 0,6 67,5 0,0 0,0 0,0 0,0 0,0 0,0 0,0 0,0 0,0
Lucro Líquido 214,6 183,7 16,8 218,7 183,4 19,3 27,0 31,9 (15,4) (4,2) (0,1) n/d
EBITDA* 427,1 398,3 7,2 406,6 385,9 5,4 36,6 40,5 (9,6) 2,2 2,1 5,5
Margem Bruta 70,9% 70,7% 0,1 pp 70,8% 70,4% 0,4 pp 68,6% 71,5% (2,9) pp 68,0% 68,2% (0,2) pp
Despesas Vendas, Marketing e Logística/Receita Líquida 35,6% 34,9% 0,7 pp 33,8% 33,0% 0,8 pp 44,0% 44,0% (0,0) pp 58,0% 56,0% 2,0 pp
Despesas Adm., P&D, TI e Projetos/Receita Líquida 15,2% 16,3% (1,0) pp 13,0% 14,2% (1,2) pp 6,7% 6,6% 0,1 pp 9,3% 11,0% (1,7) pp
Margem Líquida 11,5% 10,3% 1,2 pp 14,5% 12,5% 2,0 pp 13,9% 17,3% (3,4) pp (4,0)% (0,1)% (3,9) pp
Margem EBITDA 22,9% 22,4% 0,5 pp 27,0% 26,3% 0,7 pp 18,9% 22,0% (3,1) pp 2,1% 2,5% (0,4) pp
(*) EBITDA = Lucro operacional antes dos efeitos financeiros, impostos, depreciação e amortização.
Acumulado Pró-Forma Pró-Forma
(R$ milhões) Consolidado7
Brasil Consolidação Implantação Novos Negócios
9M14 9M13 Var% 9M14 9M13 Var% 9M14 9M13 Var% 9M14 9M13 Var%
Consultoras - final do período ('000)8 1.728,8 1.604,1 7,8 1.314,2 1.257,7 4,5 259,9 215,9 20,4 153,1 128,7 18,9
Consultoras Média do período ('000) 1.682,4 1.575,8 6,8 1.290,3 1.256,3 2,7 241,9 200,9 20,4 148,6 116,5 27,5
Unidades de produtos para revenda (milhões) 390,6 386,3 1,1 329,3 335,8 (1,9) 38,9 33,9 14,8 19,7 16,0 23,3
Receita Bruta 7.019,3 6.542,1 7,3 5.811,8 5.586,1 4,0 680,5 615,0 10,6 344,3 247,3 39,2
Receita Líquida 5.226,2 4.844,7 7,9 4.254,2 4.082,5 4,2 504,9 457,6 10,3 296,3 212,5 39,5
Lucro Bruto 3.647,9 3.417,0 6,8 2.937,9 2.868,7 2,4 357,4 327,6 9,1 206,8 145,6 42,1
Despesas com Vendas, Marketing e Logística (1.927,8) (1.740,5) 10,8 (1.497,0) (1.398,9) 7,0 (235,5) (204,3) 15,3 (165,9) (117,4) 41,3
Despesas Adm., P&D, TI e Projetos9 (818,5) (762,9) 7,3 (575,0) (565,1) 1,8 (34,2) (33,1) 3,5 (29,2) (24,6) 18,9
Outras Receitas / (Despesas) Operacionais, líquidas 17,1 14,4 18,6 11,3 14,6 (22,4) (1,2) 0,5 n/d 0,8 0,4 n/d
Receitas / (Despesas) Financeiras, líquidas (176,7) (134,2) n/d (172,8) (129,0) n/d 3,1 (5,3) n/d (3,5) (0,7) n/d
Imposto de Renda e Contribuição Social (233,7) (245,3) (4,7) (204,4) (228,9) (10,7) (19,6) (14,4) 35,9 (3,1) (1,2) 157,4
Participação dos minoritários (0,6) (0,0) 1.687,9 0,0 0,0 0,0 0,0 0,0 0,0 0,0 0,0 0,0
Lucro Líquido 507,6 548,5 (7,5) 499,9 561,4 (11,0) 69,9 70,9 (1,4) 5,9 2,1 n/d
EBITDA* 1.063,1 1.070,3 (0,7) 1.002,3 1.051,1 (4,6) 91,1 94,3 (3,3) 15,6 6,7 131,5
Margem Bruta 69,8% 70,5% (0,7) pp 69,1% 70,3% (1,2) pp 70,8% 71,6% (0,8) pp 69,8% 68,5% 1,3 pp
Despesas Vendas, Marketing e Logística/Receita Líquida 36,9% 35,9% 1,0 pp 35,2% 34,3% 0,9 pp 46,6% 44,6% 2,0 pp 56,0% 55,3% 0,7 pp
Despesas Adm., P&D, TI e Projetos/Receita Líquida 15,7% 15,8% (0,1) pp 13,5% 13,8% (0,3) pp 6,8% 7,2% (0,4) pp 9,9% 11,6% (1,7) pp
Margem Líquida 9,7% 11,3% (1,6) pp 11,8% 13,8% (2,0) pp 13,9% 15,5% (1,6) pp 2,0% 1,0% 1,0 pp
Margem EBITDA 20,3% 22,1% (1,8) pp 23,6% 25,7% (2,2) pp 18,0% 20,6% (2,6) pp 5,3% 3,2% 2,1 pp
(*) EBITDA = Lucro operacional antes dos efeitos financeiros, impostos, depreciação e amortização.

Comentário de Desempenho 3T14
8
3.1. receita líquida
No Brasil, nossa receita líquida cresceu
2,7% frente ao 3T13, a base de consultoras
cresceu 3,7% e a produtividade10 retraiu
aproximadamente 1,1% (R$ 2.257 no 3T14
versus 2.283 no 3T13). Embora as
iniciativas de ativação e segmentação do
canal e os lançamentos em perfumaria e
desodorantes tenham contribuído para uma
leve recuperação do ritmo das vendas,
encerramos o trimestre com ritmo de
crescimento abaixo do desejado.
No 3T14, as Operações Internacionais11 cresceram 16,2% em Reais, representando 19,3% da
receita líquida consolidada (17,5% no 3T13). Na Latam, as Operações em Consolidação cresceram
30,4% em moeda local (28,7% no acumulado), fruto do crescimento de 19,8% do número de
consultoras (20,4% no acumulado), enquanto que o crescimento em Reais foi negativamente
impactado pela desvalorização do Peso Argentino e do Peso Chileno. As Operações em Implantação
cresceram 28,1% em moeda local (34,5% no acumulado), com destaque nesse trimestre para o
vigoroso crescimento de nossa operação na Colômbia.
A operação sob a marca Aesop, consolidada nos resultados da Natura desde março de 2013, manteve
um crescimento acelerado, encerrando o trimestre com 94 lojas conceito em 12 países12.
10
Produtividade a preços de varejo = (receita bruta do período/número de consultoras média do período)/(1- %lucro da consultora) 11
Operações Internacionais inclui Operações em Consolidação, Operações em Implantação, França e Aesop. 12 Austrália, Hong Kong, Japão, Koreia do Sul, Malásia, Cingapura, Taiwan, França, Alemanha, Suíça, Reino Unido e Estados Unidos.
5,9% 6,7%12,0%
15,5% 15,2%
5,1% 5,0%
2,1% 1,1%5,4%
9,3% 9,1%
1,8% 2,7%
31,3%36,7%
40,4%
34,6%
36,4%
16,3%
11,6%
1T13 2T13 3T13 4T13 1T14 2T14 3T14
Crescimento Receita Líquida (R$ - % vs ano anterior)
Consolidado Brasil Operações em Consolidação e Implantação
-3,8%
-0,6%
2,9%
6,2%8,2%
-1,9%
-1,1%
1T13 2T13 3T13 4T13 1T14 2T14 3T14
Produtividade (% vs ano anterior)
Brasil
1.258 1.249 1.258 1.290 1.276 1.301 1.314
189 205 216 225 230 247 260108 119 129 140 142 149 1531.557 1.575 1.604 1.656 1.651 1.699 1.729
8,5% 4,6% 5,7% 5,3% 6,0% 7,9% 7,8%
1T13 2T13 3T13 4T13 1T14 2T14 3T14
Consultoras - posição final do período
Brasil em Consolidação
em Implantação
Cresc. Consolidado YOY

Comentário de Desempenho 3T14
9
3.2. inovação & produtos
O índice de inovação13, com base nos
últimos 12 meses findos em setembro de
2014, foi de 65,9% frente a 63,8% do
mesmo período do ano anterior, dentro do
patamar esperado (entre 60% e 70%).
A evolução positiva do índice é fruto dos
recentes lançamentos em perfumaria
(Essencial, Kaiak Extremo, Kriska,
#Urbano) e da maturidade da linha SOU, lançada no 2S13.
3.3. margem bruta
No 3T14, mantivemos o mesmo nível de margem bruta consolidada em comparação com o mesmo
período do ano anterior. No Brasil, o aumento de preços aplicado a partir de julho/2014, a melhora do
custo de conversão das fábricas e a estabilidade do esforço promocional permitiram o aumento da
margem bruta frente ao mesmo período do ano anterior e também em relação ao 2T14. Já nas
Operações Internacionais, a apreciação do Real frente a cesta de moedas da Latam impactou
negativamente a margem bruta dessas operações.
O quadro abaixo exibe o custo aberto em seus principais componentes:
3.4. despesas operacionais
No Brasil, o leve aumento relativo (%RL)
das despesas com vendas, marketing e
logística no trimestre foi resultado da
combinação de uma melhor utilização da
capacidade logística, especialmente no
novo centro de distribuição em São Paulo,
com a continuidade de patamares altos de
inadimplência. Seguimos reforçando nossos
processos e critérios de concessão de
13
Índice de Inovação: participação nos últimos 12 meses da venda dos produtos lançados nos últimos 24 meses.
65,0% 65,3% 63,8% 63,4% 62,4% 61,0%
65,9%
1T13 2T13 3T13 4T13 1T14 2T14 3T14
Inovação (%RL)
3T14 3T13 9M14 9M13
79,9 76,6 80,2 79,7
9,6 9,0 9,8 9,6
3,0 4,6 2,8 3,3
7,5 9,8 7,2 7,4
Total 100,0 100,0 100,0 100,0
*Matéria - Prima, Material de Embalagem e Produto Acabado
MP / ME / PA*
Mão de Obra
Depreciação
Outros
70,1%70,6% 70,7%
68,5%
70,0%
68,5%
70,9%70,1%
70,3%
70,4%67,5% 69,1% 67,3%
70,8%
69,6%
71,5%
70,5%
70,9% 71,6% 71,7%
68,4%
1T13 2T13 3T13 4T13 1T14 2T14 3T14
Margem Bruta (%RL)
Consolidado Brasil Operações em Consolidação e Implantação
33,0% 34,3%
47,7% 48,0%
33,8% 35,2%
48,9% 50,1%
Trimestre Acumulado Trimestre Acumulado
Despesas com Vendas, Marketing e Logística (%RL)
2013 2014
BrasilOperações em Consolidação e
Implantação
Comentário de Desempenho 3T14
10
crédito e cobrança. Em termos nominais, o crescimento de 5,1%, reafirma a tendência de
desaceleração do crescimento dessas despesas, resultado do nosso programa de eficiência que ao
longo dos últimos trimestres tem mostrado evoluções significativas. Nas Operações Internacionais, o
aumento relativo (%RL) dessas despesas deve-se a uma concentração dos investimentos em
marketing no trimestre e à pressão inflacionária nos custos de nossa Operação na Argentina.
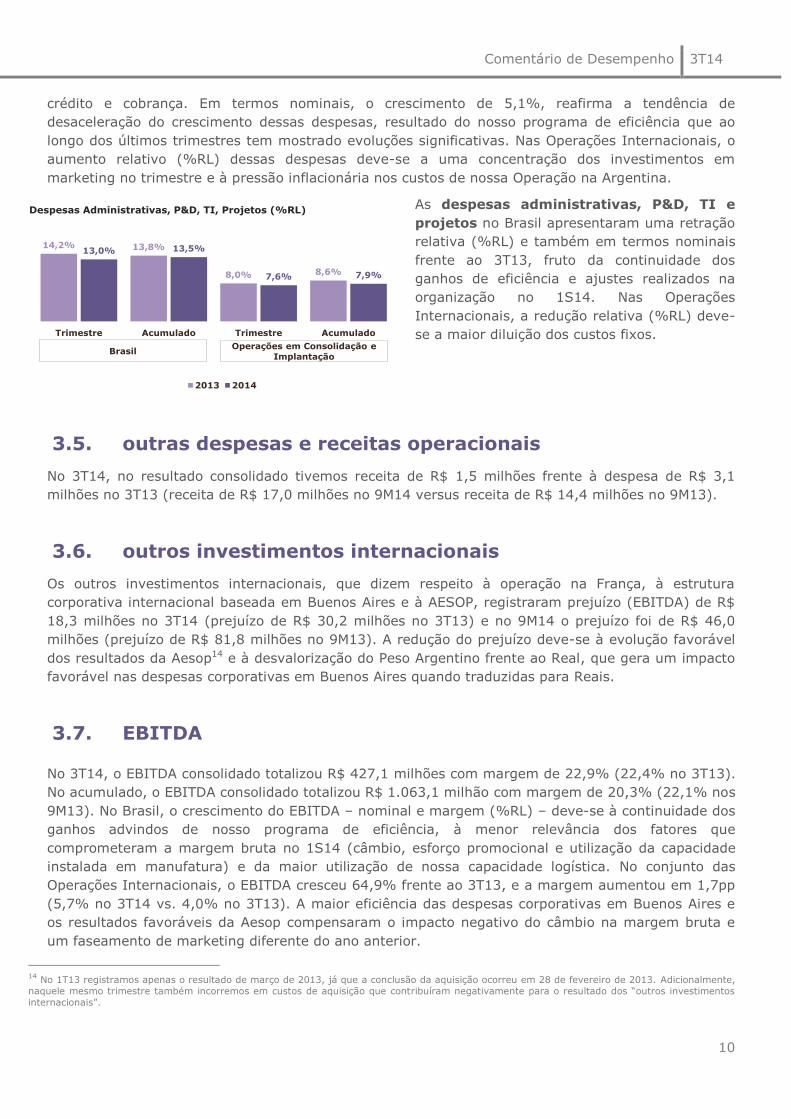
As despesas administrativas, P&D, TI e
projetos no Brasil apresentaram uma retração
relativa (%RL) e também em termos nominais
frente ao 3T13, fruto da continuidade dos
ganhos de eficiência e ajustes realizados na
organização no 1S14. Nas Operações
Internacionais, a redução relativa (%RL) deve-
se a maior diluição dos custos fixos.
3.5. outras despesas e receitas operacionais
No 3T14, no resultado consolidado tivemos receita de R$ 1,5 milhões frente à despesa de R$ 3,1
milhões no 3T13 (receita de R$ 17,0 milhões no 9M14 versus receita de R$ 14,4 milhões no 9M13).
3.6. outros investimentos internacionais
Os outros investimentos internacionais, que dizem respeito à operação na França, à estrutura
corporativa internacional baseada em Buenos Aires e à AESOP, registraram prejuízo (EBITDA) de R$
18,3 milhões no 3T14 (prejuízo de R$ 30,2 milhões no 3T13) e no 9M14 o prejuízo foi de R$ 46,0
milhões (prejuízo de R$ 81,8 milhões no 9M13). A redução do prejuízo deve-se à evolução favorável
dos resultados da Aesop14 e à desvalorização do Peso Argentino frente ao Real, que gera um impacto
favorável nas despesas corporativas em Buenos Aires quando traduzidas para Reais.
3.7. EBITDA
No 3T14, o EBITDA consolidado totalizou R$ 427,1 milhões com margem de 22,9% (22,4% no 3T13).
No acumulado, o EBITDA consolidado totalizou R$ 1.063,1 milhão com margem de 20,3% (22,1% nos
9M13). No Brasil, o crescimento do EBITDA – nominal e margem (%RL) – deve-se à continuidade dos
ganhos advindos de nosso programa de eficiência, à menor relevância dos fatores que
comprometeram a margem bruta no 1S14 (câmbio, esforço promocional e utilização da capacidade
instalada em manufatura) e da maior utilização de nossa capacidade logística. No conjunto das
Operações Internacionais, o EBITDA cresceu 64,9% frente ao 3T13, e a margem aumentou em 1,7pp
(5,7% no 3T14 vs. 4,0% no 3T13). A maior eficiência das despesas corporativas em Buenos Aires e
os resultados favoráveis da Aesop compensaram o impacto negativo do câmbio na margem bruta e
um faseamento de marketing diferente do ano anterior.
14
No 1T13 registramos apenas o resultado de março de 2013, já que a conclusão da aquisição ocorreu em 28 de fevereiro de 2013. Adicionalmente,
naquele mesmo trimestre também incorremos em custos de aquisição que contribuíram negativamente para o resultado dos “outros investimentos
internacionais”.
14,2% 13,8%
8,0% 8,6%
13,0% 13,5%
7,6% 7,9%
Trimestre Acumulado Trimestre Acumulado
Despesas Administrativas, P&D, TI, Projetos (%RL)
2013 2014
BrasilOperações em Consolidação e
Implantação
Comentário de Desempenho 3T14
11
EBITDA (R$ milhões) Dados contemplam operação e custo de transação da AESOP
Durante o primeiro semestre de 2014, como planejado, revisamos a vida útil contábil dos itens
registrados no imobilizado e intangível da Companhia. A partir desta revisão, modificamos no 2T14 a
estimativa da vida útil de alguns bens em linha com as melhores práticas do mercado. A aplicação
dessas taxas revisadas tem efeito exclusivo no lucro contábil, ou seja, sem afetar o lucro distribuível e
consequentemente os dividendos. Este ajuste impactou principalmente os ativos relacionados à
tecnologia da informação.
Para mais informações sobre as novas taxas anuais de depreciação com base na vida útil revisada
consulte os quadros apresentados na nota explicativa número 14 das Demonstrações Financeiras
Consolidadas do 2T14.
EBITDA pró-forma por bloco de operações (R$ milhões) Dados contemplam operação e custo de transação da AESOP
3.8. lucro líquido
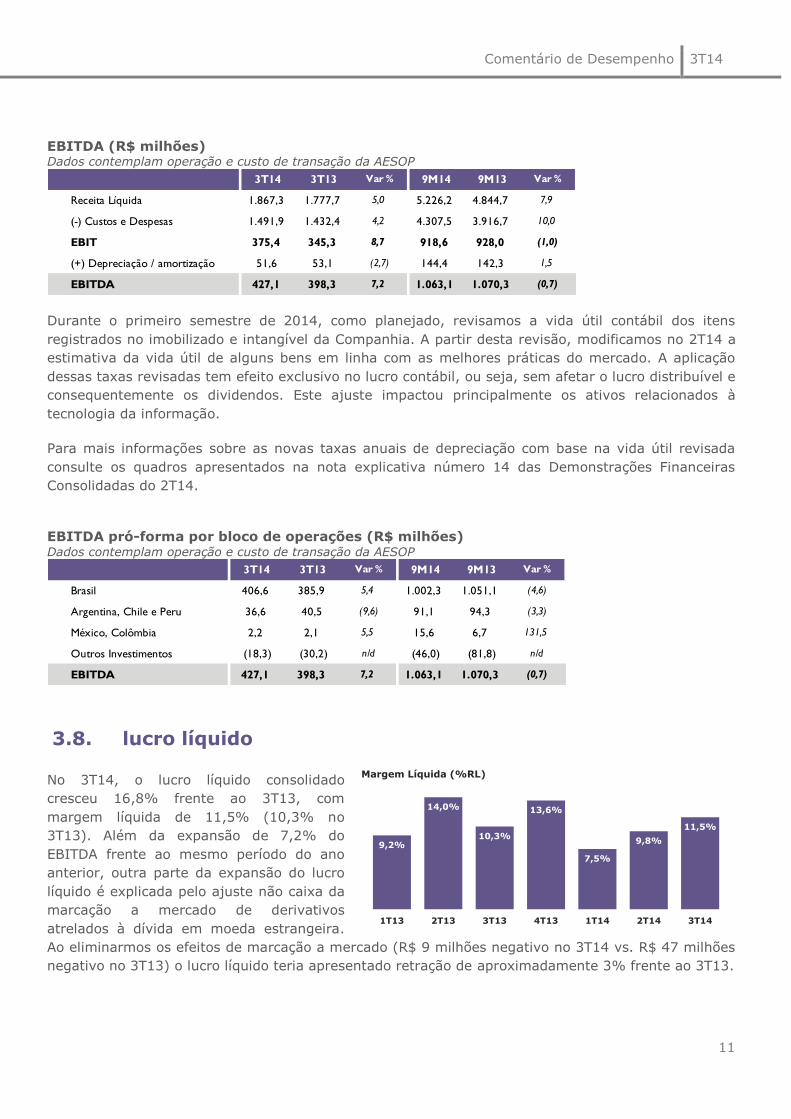
No 3T14, o lucro líquido consolidado
cresceu 16,8% frente ao 3T13, com
margem líquida de 11,5% (10,3% no
3T13). Além da expansão de 7,2% do
EBITDA frente ao mesmo período do ano
anterior, outra parte da expansão do lucro
líquido é explicada pelo ajuste não caixa da
marcação a mercado de derivativos
atrelados à dívida em moeda estrangeira.
Ao eliminarmos os efeitos de marcação a mercado (R$ 9 milhões negativo no 3T14 vs. R$ 47 milhões
negativo no 3T13) o lucro líquido teria apresentado retração de aproximadamente 3% frente ao 3T13.
3T14 3T13 Var % 9M14 9M13 Var %
Receita Líquida 1.867,3 1.777,7 5,0 5.226,2 4.844,7 7,9
(-) Custos e Despesas 1.491,9 1.432,4 4,2 4.307,5 3.916,7 10,0
EBIT 375,4 345,3 8,7 918,6 928,0 (1,0)
(+) Depreciação / amortização 51,6 53,1 (2,7) 144,4 142,3 1,5
EBITDA 427,1 398,3 7,2 1.063,1 1.070,3 (0,7)
3T14 3T13 Var % 9M14 9M13 Var %
Brasil 406,6 385,9 5,4 1.002,3 1.051,1 (4,6)
Argentina, Chile e Peru 36,6 40,5 (9,6) 91,1 94,3 (3,3)
México, Colômbia 2,2 2,1 5,5 15,6 6,7 131,5
Outros Investimentos (18,3) (30,2) n/d (46,0) (81,8) n/d
EBITDA 427,1 398,3 7,2 1.063,1 1.070,3 (0,7)
9,2%
14,0%
10,3%
13,6%
7,5%
9,8%
11,5%
1T13 2T13 3T13 4T13 1T14 2T14 3T14
Margem Líquida (%RL)

Comentário de Desempenho 3T14
12
3.9. fluxo de caixa15
Nos 9M14 tivemos um consumo de caixa livre de R$ 33,3 milhões frente a uma geração de R$ 84,1
milhões no mesmo período do ano anterior, resultado do maior investimento em capital de giro, que
superou em R$ 112,1 milhões o valor investido nos 9M13.
O maior investimento em capital de giro deve-se sobretudo à antecipação da produção para a
estratégia de Natal em comparação com o ano anterior, e ao esperado aumento dos recebíveis,
decorrente da opção de pagamento parcelado (boleto e cartão) disponível desde novembro de 2013.
Exceto pela retração do lucro, os fatores anteriores também explicam a geração de caixa no 3T14 que
foi R$ 106,2 milhões inferior ao mesmo período do ano anterior.
Esperamos que a cobertura de estoques retorne a patamares inferiores ao longo da estratégia de
Natal. A dinâmica do nosso negócio leva a uma geração relevante de caixa no quarto trimestre uma
vez que liberamos capital de giro após a estratégia de Natal.
Nos 9M14, os R$ 338,5 milhões investidos em capex (R$ 368,2 milhões no 9M13) foram destinados à
conclusão do Ecoparque (Benevides, PA), ao estagio final da nova fábrica em Cajamar, aos
investimentos em tecnologia da informação e ao inicio da implantação do SAP nas operações
Internacionais. Mantemos a projeção de R$ 500 milhões para 2014 (R$ 553,9 milhões em 2013).
15
No fluxo de caixa pró-forma alguns valores de 2013 foram reclassificados para itens não caixa para uma melhor comparação com 2T14 e 1S14.
Além disso, com a reclassificação de alguns saldos do balanço de 2012 (conforme notas explicativas número 4.3 das Demonstrações Financeiras de
4T13) a variação de capital de giro até jun/13 foi recalculada e reapresentada.
Valores em R$ milhões 3T14 3T13 Var. R$ 9M14 9M13 Var. R$
Receitas / (Despesas) Financeiras, líquidas (63,7) (85,0) 21,3 (176,7) (134,2) (42,5)
Ajuste de Marcação ao Mercado (8,9) (47,1) 38,3 4,5 (34,3) 38,9
Receitas / (Despesas) Financeiras ex. Marcação a
Mercado, líquidas (54,8) (37,8) (16,9) (181,3) (99,9) (81,4)
R$ milhões 3T14 3T13 Var. R$ Var. % 9M14 9M13 Var. R$ Var. %
Lucro líquido do período 214,6 183,7 30,9 16,8 507,6 548,5 (40,9) (7,5)
Depreciações e amortizações 51,6 53,1 (1,4) (2,7) 144,4 142,3 2,2 1,5
Itens não caixa / Outros* (6,7) (10,4) 3,7 (35,4) (0,6) (4,3) 3,7 (86,7)
Geração interna de caixa 259,6 226,4 33,2 14,7 651,5 686,5 (35,0) (5,1)
(Aumento) / Redução do Capital de Giro (142,0) 76,1 (218,2) (286,6) (346,3) (234,2) (112,1) 47,9
Geração operacional de caixa 117,5 302,5 (185,0) (61,2) 305,2 452,3 (147,1) (32,5)
Adições do imobilizado e intangível (103,3) (182,0) 78,7 (43,3) (338,5) (368,2) 29,7 (8,1)
Geração de caixa livre** 14,2 120,5 (106,2) (88,2) (33,3) 84,1 (117,4) (139,6)
Favorável / (desfavorável)
(*) Para efeito de melhor divulgação e comparação, alguns saldos de 2013 foram reclassificados
(**) (Geração interna de caixa) +/- (variações no capital de giro e realizável a longo prazo) - (aquisições de ativo imobilizado).

Comentário de Desempenho 3T14
13
3.10. endividamento
A alavancagem atual (1,24 dívida líquida / EBITDA) reflete principalmente os investimentos em
CAPEX e a maior necessidade de capital de giro.
4. desempenho NATU3
No 9M14, as ações da Natura tiveram uma desvalorização de 6,5% frente a 31 de dezembro de 2013,
enquanto o Ibovespa desvalorizou-se 5,3%. O volume médio diário negociado no 9M14 foi de R$ 50,0
milhões frente a R$ 66,6 milhões no mesmo período do ano anterior.
No mesmo período, nossa posição média no Índice de Negociabilidade da BOVESPA foi 37º.
O gráfico abaixo demonstra o desempenho das ações Natura desde o seu lançamento (IPO):
Endividamento R$ Mil set/14 Part (%) set/13 Part (%) Var. (%)
Curto Prazo 918,6 29,4 877,1 38,2 4,7
Longo Prazo 2.651,7 84,8 1.731,9 75,5 53,1
Instrumentos financeiros derivativos (189,7) (6,1) (120,1) (5,2) 58,0
Arrendamentos Mercantis - Financeiros / Outros (253,3) (8,1) (195,5) (8,5) 29,6
Total da Dívida 3.127,3 100,0 2.293,4 100,0 36,4
(-) Caixa e Aplicações Financeiras 1.137,0 842,1 35,0
(=) Endividamento Líquido - Caixa Líquido 1.990,2 1.451,2 37,1
Dívida Líquida / Ebitda 1,24 0,95
Total Dívida / Ebitda 1,95 1,50

Comentário de Desempenho 3T14
14
0
200
400
600
800
1000
1200
1400
Base 100 = 26/05/2004
Bovespa Index
NATU3
NATU3: +87,3%
Ibov: +38,9%
+38,0%
+27,7%
+51,2%+32,9%
-41,4%
+43,7%
+18,0%
- 41,2%+101,9%
+82,6%
NATU3
26/05/2004
R$ 5,33
2004 2005 2006 2007 2008 2009 2010
NATU3
30/09/2014
R$ 36,98
+183,8%
Follow On
31/07/2009
R$ 21,38
2011
-20,4%
-18,1%
2013+36,7%
+1,1%-26,6%
-15,5%
Todos os preços apresentados ex-
dividendos.
+593,4%
2012
+69,0%
+7,3%
2014
+6,5%
-5,3%

Comentário de Desempenho 3T14
15
teleconferência
& webcast
PORTUGUÊS: Sexta-feira, 24 de outubro de 2014
10h00 – horário de Brasília
INGLÊS: Sexta-feira, 24 de outubro de 2014
12h00 – horário de Brasília
Participantes do Brasil: +55 11 3193 1001 /+55 11 2820 4001
Participantes dos EUA: Toll Free + 1 888 700 0802
Participantes de outros países: +1 786 924 6977
Senha para os participantes: Natura
Transmissão ao vivo pela internet:
www.natura.net/investidor
relações
com investidores
Telefone: (11) 4571-7786
Fabio Cefaly, [email protected]
Tatiana Carvalho, [email protected]
Francisco Petroni, [email protected]
Julia Villas Bôas, [email protected].

Comentário de Desempenho 3T14
16
balanços
patrimoniais em setembro de 2014 e dezembro de 2013 (em milhões de reais - R$)
ATIVO set-14 dez-13 PASSIVO E PATRIMÕNIO LÍQUIDO set-14 dez-13
CIRCULANTE CIRCULANTE
Caixa e equivalentes de caixa 889,7 1.016,3 Empréstimos e financiamentos 918,6 693,1
Títulos e valores mobiliários 247,4 293,0 Fornecedores e outras contas a pagar 733,2 706,6
Contas a receber de clientes 803,0 807,0 Salários, participações nos resultados e encargos sociais 233,3 177,6
Estoques 1.074,0 799,5 Obrigações tributárias 636,1 659,3
Impostos a recuperar 247,3 181,1 Outras obrigações 71,3 90,2
Instrumentos financeiros derivativos 189,7 153,6 Total do passivo circulante 2.592,4 2.326,8
Outros ativos circulantes 256,6 262,4
Total do ativo circulante 3.707,6 3.512,9
NÃO CIRCULANTE NÃO CIRCULANTE
Realizável a longo prazo: Empréstimos e financiamentos 2.651,7 2.200,8
Impostos a recuperar 187,0 175,1 Obrigações tributárias 243,1 215,6
Imposto de renda e contribuição social diferidos 194,4 193,8 Provisão para riscos tributários, cíveis e trabalhistas 75,7 73,8
Depósitos judiciais 457,2 412,4 Provisão para aquisição de participação de não controladores 145,1 141,6
Outros ativos não circulantes 62,4 37,2 Outras provisões 127,8 121,4
Imobilizado 1.601,7 1.439,7 Total do passivo não circulante 3.243,5 2.753,2
Intangível 562,4 477,3
Total do ativo não circulante 3.065,0 2.735,4 PATRIMÔNIO LÍQUIDO
Capital social 427,1 427,1
Reservas de capital 141,7 150,4
Reservas de lucros 412,2 162,6
Ações em tesouraria (38,3) (84,0)
Dividendo adicional proposto 0,0 496,4
Outros resultados abrangentes (31,5) (6,9)
Total do patrimônio líquido - acionistas controladores 911,2 1.145,6
Participação dos acionistas não controladores no patrimônio 25,5 22,6
líquido das controladas
Total do patrimônio líquido 936,7 1.168,3
TOTAL DO ATIVO 6.772,6 6.248,3 TOTAL DO PASSIVO E PATRIMÔNIO LÍQUIDO 6.772,6 6.248,3

Comentário de Desempenho 3T14
17
demonstrações
dos resultados para os períodos de três e nove meses findos em 30 de
setembro de 2014 e de 2013
Consolidado (R$ milhões) 3T14 3T13 9M14 9M13
RECEITA LÍQUIDA 1.867,3 1.777,7 5.226,2 4.844,7
Custo dos produtos vendidos (544,3) (520,2) (1.578,3) (1.427,8)
LUCRO BRUTO 1.323,0 1.257,5 3.647,9 3.417,0
(DESPESAS) RECEITAS OPERACIONAIS
Despesas com Vendas, Marketing e Logística (664,8) (620,0) (1.927,8) (1.740,5)
Despesas Administrativas, P&D, TI e Projetos (284,3) (289,1) (818,5) (762,9)
Outras receitas (despesas) operacionais, líquidas 1,5 (3,1) 17,1 14,4
Receitas financeiras (4,7) 68,7 233,2 244,5
Despesas financeiras (59,0) (153,7) (409,9) (378,7)
Imposto de renda e contribuição social (98,2) (77,2) (233,7) (245,3)
ATRIBUÍVEL A
Acionistas da Sociedade 214,6 183,7 507,6 548,5
Não controladores (1,1) (0,6) 0,6 0,0
213,6 183,1 508,2 548,5
508,2 548,5
928,0
793,8LUCRO ANTES DO IMPOSTO DE RENDA E DA
CONTRIBUIÇÃO SOCIAL260,3311,8
LUCRO OPERACIONAL ANTES DO RESULTADO
FINANCEIRO
375,4 345,3 918,6
741,9
LUCRO LÍQUIDO ANTES DA PARTICIPAÇÃO
DE NÃO CONTROLADORES213,6 183,1

Comentário de Desempenho 3T14
18
demonstrações
dos fluxos de caixa para os períodos findos em 30 de setembro de 2014 e de 2013
Consolidado (R$ milhões) 9M14 9M13
FLUXO DE CAIXA DAS ATIVIDADES OPERACIONAIS
Lucro líquido do período 507,6 548,5
Depreciações e amortizações 144,4 142,2
Provisão (Reversão) decorrente dos contratos de operações com derivativos "swap" e "forward" 53,8 (39,3)
Provisões (Reversão) para riscos tributários, cíveis e trabalhistas 7,7 13,9
Atualização monetária de depósitos judiciais (24,1) (13,0)
Imposto de renda e contribuição social 233,7 245,3
Resultado na venda e baixa de ativo imobilizado e intangível 20,0 5,4
Reversão deságio na alienação de créditos de ICMS 0,0 (3,5)
Juros e variação cambial sobre empréstimos e financiamentos 69,5 237,4
Variação cambial sobre outros ativos e passivos (23,7) 0,9
Despesas com planos de outorga de opções de compra de ações 5,6 9,1
Hedge de fluxo de caixa (2,1) 0,0
Provisão (Reversão) para créditos de liquidação duvidosa 13,4 8,9
Provisão (Reversão) para perdas nos estoques (17,4) 35,9
Lucro líquido do período atribuível a não controladores 0,6 0,0
Provisão com plano de assistência médica e créditos carbono 5,6 (0,6)
Reconhecimento de crédito tributário extemporâneo (13,5) (6,8)
Provisão para aquisição de participação de não controladores 3,5 0,0
Participação dos acionistas não controladores no patrimônio líquido das controladas 2,3 0,0
987,1 1.184,4
(AUMENTO) REDUÇÃO DOS ATIVOS
Contas a receber de clientes (9,4) (62,7)
Estoques (257,1) (210,4)
Impostos a recuperar (64,6) (72,9)
Outros ativos (19,5) (17,7)
Subtotal (350,6) (363,8)
AUMENTO (REDUÇÃO) DOS PASSIVOS
Fornecedores nacionais e estrangeiros 27,7 36,5
Salários, participações nos resultados e encargos sociais, líquidos 55,6 5,7
Obrigações tributárias 15,9 (32,2)
Outros passivos (19,4) 20,7
Provisão para riscos tributários, cíveis e trabalhistas (5,8) (4,6)
Subtotal 74,1 26,1
CAIXA GERADO PELAS ATIVIDADES OPERACIONAIS 710,6 846,7
Ajustes para reconciliar o lucro líquido do exercício com o caixa líquido gerado pelas atividades
operacionais:
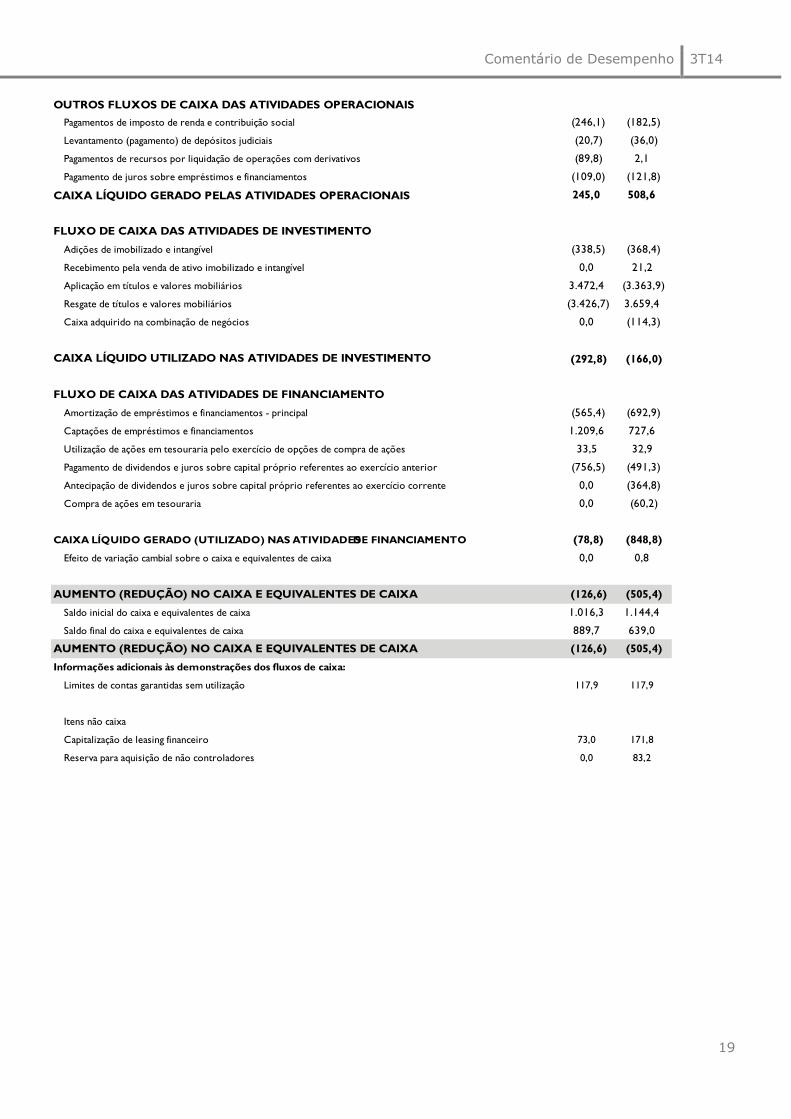
Comentário de Desempenho 3T14
19
OUTROS FLUXOS DE CAIXA DAS ATIVIDADES OPERACIONAIS
Pagamentos de imposto de renda e contribuição social (246,1) (182,5)
Levantamento (pagamento) de depósitos judiciais (20,7) (36,0)
Pagamentos de recursos por liquidação de operações com derivativos (89,8) 2,1
Pagamento de juros sobre empréstimos e financiamentos (109,0) (121,8)
CAIXA LÍQUIDO GERADO PELAS ATIVIDADES OPERACIONAIS 245,0 508,6
FLUXO DE CAIXA DAS ATIVIDADES DE INVESTIMENTO
Adições de imobilizado e intangível (338,5) (368,4)
Recebimento pela venda de ativo imobilizado e intangível 0,0 21,2
Aplicação em títulos e valores mobiliários 3.472,4 (3.363,9)
Resgate de títulos e valores mobiliários (3.426,7) 3.659,4
Caixa adquirido na combinação de negócios 0,0 (114,3)
CAIXA LÍQUIDO UTILIZADO NAS ATIVIDADES DE INVESTIMENTO (292,8) (166,0)
FLUXO DE CAIXA DAS ATIVIDADES DE FINANCIAMENTO
Amortização de empréstimos e financiamentos - principal (565,4) (692,9)
Captações de empréstimos e financiamentos 1.209,6 727,6
Utilização de ações em tesouraria pelo exercício de opções de compra de ações 33,5 32,9
Pagamento de dividendos e juros sobre capital próprio referentes ao exercício anterior (756,5) (491,3)
Antecipação de dividendos e juros sobre capital próprio referentes ao exercício corrente 0,0 (364,8)
Compra de ações em tesouraria 0,0 (60,2)
CAIXA LÍQUIDO GERADO (UTILIZADO) NAS ATIVIDADES DE FINANCIAMENTO (78,8) (848,8)
Efeito de variação cambial sobre o caixa e equivalentes de caixa 0,0 0,8
AUMENTO (REDUÇÃO) NO CAIXA E EQUIVALENTES DE CAIXA (126,6) (505,4)
Saldo inicial do caixa e equivalentes de caixa 1.016,3 1.144,4
Saldo final do caixa e equivalentes de caixa 889,7 639,0
AUMENTO (REDUÇÃO) NO CAIXA E EQUIVALENTES DE CAIXA (126,6) (505,4)
Informações adicionais às demonstrações dos fluxos de caixa:
Limites de contas garantidas sem utilização 117,9 117,9
Itens não caixa
Capitalização de leasing financeiro 73,0 171,8
Reserva para aquisição de não controladores 0,0 83,2
Comentário de Desempenho 3T14
20
glossário
_CDI: Certificado de depósito interbancário.
_CN: Revendedoras autônomas, que não têm relação de emprego com a Natura, também chamadas Consultoras Natura.
_CNO: Revendedoras autônomas, que não têm relação de emprego conosco, e apoiam as Gerentes de Relacionamento em
suas atividades, também chamadas de Consultoras Natura Orientadoras.
_Comunidades Fornecedoras: Comunidades de agricultores familiares e extrativistas de diversas localidades do Brasil –
majoritariamente da Região Amazônica que extraem de forma sustentável insumos da sociobiodiversidade utilizados em nossos
produtos. Estabelecemos com essas comunidades cadeias produtivas que se pautam pelo preço justo, repartição de benefícios
pelo acesso ao patrimônio genético e aos conhecimentos tradicionais associados e apoio a projetos de desenvolvimento
sustentável local. Esse modelo de negócio tem se mostrado efetivo na geração de valor social, econômico e ambiental para a
Natura e para as comunidades.
_GEE: Gases de Efeito Estufa.
_Índice de Inovação: Participação nos últimos 12 meses da venda dos produtos lançados nos últimos 24 meses.
_Instituto Natura: é uma organização sem fins lucrativos criada em 2010 para fortalecer e ampliar nossas iniciativas de
Investimento Social Privado. Sua criação nos permitiu potencializar os esforços e investimentos em ações que contribuam para
a melhoria da qualidade do ensino público.
_Mercado Alvo: Referente aos dados de mercado alvo da SIPATESP/Abihpec. Considera somente os segmentos nos quais a
Natura opera. Exclui fraldas, itens de higiene oral, tintura para cabelo, esmaltes, absorventes dentre outros.
_Operações em Consolidação: Agrupamento das operações: Argentina, Chile e Peru.
_Operações em Implantação: Agrupamento das Operações: Colômbia e México.
_PLR: Participação nos Lucros e Resultados.
_Programa Natura Crer Para Ver: Linha especial de produtos não cosméticos, cujo lucro é revertido para o Instituto Natura,
no Brasil, e investido pela Natura em ações sociais nos demais países onde operamos. Nossas consultoras e consultores se
engajam nas vendas em prol de seu benefício social, sem obter ganhos.
_Rede de Relações Sustentáveis: Modelo Comercial adotado no México que contempla oito etapas de avanço da consultora:
Consultora Natura, Consultora Natura Empreendedora, Formadora Natura 1 e 2, Transformadora Natura 1 e 2, Inspiradora
Natura e Associada Natura. Para ascender na atividade, é preciso atender a critérios de volume de vendas, atração de novas
consultoras e – como diferencial dos demais modelos existentes no país – desenvolvimento pessoal e de relações
socioambientais na comunidade.
_Repartição de Benefícios: Com base na Política Natura de Uso Sustentável da Biodiversidade e do Conhecimento
Tradicional Associado, é utilizada a premissa de repartir benefícios sempre que percebermos diferentes formas de valor nos
acessos que realizamos. Sendo assim, uma das práticas que definem a forma como esses recursos serão divididos é associar
pagamentos ao número de matérias-primas produzidas a partir de cada planta e ao sucesso comercial dos produtos para os
quais essas matérias-primas servem de insumo.
_Sipatesp/Abihpec: Sindicato da Indústria de Perfumarias de Artigos de Toucador do Estado de São Paulo / Associação
Brasileira da Indústria de Higiene Pessoal, Perfumaria e Cosméticos.
reapresentações
_Demonstrativo de Resultados pró-forma do 3T13 e 9M13 contempla três reclassificações no Brasil, e consequentemente no Consolidado, para uma melhor comparação com o 2T14. Estes ajustes não impactam os valores de EBITDA e Lucro Líquido anteriormente divulgados. Estas reclassificações entre linhas são: (1) reclassificação para o “Custo de Mercadoria Vendida” das despesas de provisão de participação nos lucros de colaboradores que estavam alocadas em “despesas administrativas, P&D, TI e projetos”; (2) reclassificação de parte das “despesas com vendas, marketing e logística” para “despesas administrativas, P&D, TI e projetos” para melhor refletir a nossa nova organização alinhada ao plano estratégico; e (3) “Despesas Administrativas, P&D, TI e Projetos” consolidando a antiga linha de “Remuneração dos Administradores”, cujos detalhes estão disponíveis na nota explicativa número 28.2 das Demonstrações de Resultados Financeiros. Nos próximos trimestres, esses mesmos ajustes serão feitos nos valores de 2013.
_Composição do Custo 3T13 e 9M13: Reapresentação dos valores para refletir o ajuste (1) descrito acima.
_Itens não caixa: reapresentação dos valores do 3T13 e 9M13 para melhor comparação com os critérios de 2014.
_Capital de Giro 3T13 e 9M13: Com a reclassificação de alguns saldos do balanço de 2012 (conforme notas explicativas número 4.3 das Demonstrações Financeiras de 4T13), a variação do capital de giro do 3T13 e 9M13 foi recalculada e reapresentada.

Comentário de Desempenho 3T14
21
O EBITDA não é uma medida utilizada nas práticas contábeis adotadas no Brasil, não representando o
fluxo de caixa para os períodos apresentados. Também não deve ser considerado como uma
alternativa ao lucro líquido na qualidade de indicador do desempenho operacional ou uma alternativa
ao fluxo de caixa na qualidade de indicador de liquidez. O EBITDA não tem um significado
padronizado e sua definição na Sociedade, eventualmente, pode não ser comparável ao LAJIDA ou
EBITDA definido por outras companhias. Ainda que o EBITDA não forneça, de acordo com as práticas
contábeis adotadas no Brasil, uma medida do fluxo de caixa, a Administração o utiliza para mensurar
o desempenho operacional da Sociedade. Adicionalmente, entendemos que determinados investidores
e analistas financeiros utilizam o EBITDA como indicador do desempenho operacional de uma
companhia e/ou de seu fluxo de caixa.
Este relatório contém informações futuras. Tais informações não são apenas fatos históricos, mas
refletem os desejos e as expectativas da direção da Natura. As palavras “antecipa”, “deseja”,
“espera”, “prevê”, “pretende”, “planeja”, “prediz”, “projeta”, “almeja” e similares, pretendem
identificar afirmações que, necessariamente, envolvem riscos conhecidos e desconhecidos. Riscos
conhecidos incluem incertezas, que não são limitadas ao impacto da competitividade dos preços e
produtos, aceitação dos produtos no mercado, transições de produto da Companhia e seus
competidores, aprovação regulamentar, moeda, flutuação da moeda, dificuldades de fornecimento e
produção e mudanças na venda de produtos, dentre outros riscos. Este relatório também contém
algumas informações “pró-forma”, elaboradas pela Companhia a título exclusivo de informação e
referência, portanto, são grandezas não auditadas. Este relatório está atualizado até a presente data
e a Natura não se obriga a atualizá-lo mediante novas informações e/ou acontecimentos futuros.