Embed Size (px)
Citation preview
-"ar.,,,rr^-4PRINF"'""1111F'llirrnir."'
th
R
-eau
1
0 0 RESUMESED 010 771
SP 000 075.TEACHER EDUCATION GRADUATES OF 1954--THEIR CAREERS TEN YEMSAFTER GRADUATION.BY- IMPELLITTERI, JOSEPH T.
CITY UNIV. OF. NEW YORK,DIV. OF TEACHER EDUCATIONPUB DATE , MAY 85
EDRS PRICE MF-$0.09 HC-$1.64 41P.
DESCRIPTORS- *TEACHER RECRUITMENT, *TEACHER SHORTAGE,*TEACHERS,'*RETENTION STUDIES, NEW YORK CITY
TO IDENTIFY FACTORS RELATED TO PERSISTENCE; IN TEACHING,THE FOURTH OF A SERIES OF LONGITUDINAL QUESTIONNAIRE 'STUDIESOF CUNY GRADUATES COMPARED 169 MEN AND WOMEN WHOCONTINUED TOTEACH TO (1). 117 WHO TAUGHT; LEFT, AND RETURNEE), AND 338WHO TAUGHT, THEN LEFT THE PROFESSION. GREATER PERSISTENCE INTEACHING WAS FOUND AMONG MEN RATHER THAN"WOMEN, OLDER RATHERTHAN YOUNGER PERSONS, UNMARRIED RATHER THAN MARRIED- WOMEN,SECONDARY SCHOOL RITHER THAN ELEMENTARY SCHOOL TEACHERS,THOSE MORE SATISFIED WITH THEIR TEACHING. EXPERIENCES, ANDAMONG WOMEN WHOSE HUSBANDS EARN LESS THAN $10,000 A YEAR.(PP) \
r
F.
SP coo oU.S. DEPARTMENT OF HEALTH. EDUCATION tk WELFARE
OFFICE OF EDUCATION
THIS DOCUMENT HAS BEEN REPRODUCED EXACTLY AS RECEIVED FROM THE
PERSON OR ORGANIZATION ORIGINATING IT. POINTS OF VIEW OR OPINIONS
STATED DO NOT NECESSARILY REPRESENT OFFICIAL OFFICE OF EDUCATION
POSITION OR POLICY.
TIMMER EDUCATION GRADUATES GIP 1954:
'THOR CAMS TEN rAES ATTER GRADUATION
DMSE
EDjCATION
tor
bY
Joseph T. lapellItierl,
OF NEW YOR <
Nay .1965'
OFFICE. OF R-ESEARCH AND EVALUATION
'
, '
Teacher tion Graduaies of 1954;Their Ceireers Ten. Years After Graduation
by
Joseph T /mpellitteri
Office of Research and Valuation:
Division of Teacher EducationThe City University off' New York
535 East 80 Street New York, New York 10021-
Table of Contents
List of Talg.ed. .- 41 . . . estf''',>11
List of Figures: .. 04 . . . .", - ... , .., . iv
Forewopd,.: . . . . . . . . .. . . .!. 0 . .r , . .
i. I f
Chapter I Introduction . . . ., 0410 't` Chapter, /I r *The COnduct of Thee Study.: . . . . ... .... .. 3
Chapts III - Results ol Career-Histories of Respondents. . .,-4 7
Chapter IV - Dfscussion and Conclusion . . . . . . . . 29ci .
References . %.* . . . . . . . . . . . . .. . . . . . . , 33.
f
vriT."71P7'
,List of Tables,
.Camparsons of the 840 Current Respondents with the 1,323Respondents to the 1957 Survey, by Sex and College Attended...
Compezison of the "Longitudinal" Respondents with theRespondents to the 1957 Q-aestionnaire-on the Basis of Levelof Undergraduate Training and "Persistence" Category as of 1957...,
,Career, Ristories of the 1964'Respond,its from Septeml?er 1958to the ftesent .
. .. .Teaching Statue of Respondents at the Time of the 1956 Follow-Up, the 1959 FolloW-Up, and the 1964 Suivey........6* 10
Teaching Lever of the 1964 Respondents Entployed-als TeachersDuring.Fach Semester from September 1958-September 1964
Location of Teiicliing Positions of Reepotidents Who Are NowTeaching in 1964 as Compered with the 1959 and 1957 Surveys
Teachei' Persistence as Related to the Sex of the Respondents.. 000 15ft
Number of Years of Teaching Experience of the 659 'Respondents
- Teacher Persistence as rielated to the Age of the Respondents atthe Time of the 1964 Survey ........
10 Persistence of Males as Related to Their Present Marital. andFamily Status.... I . OOOOOO ;* O 000.11,0,10
.1 ,
Persisience of Witten as Related to Their Present Marital .andropily. Status OOO O S A 20
12 - Persistence of Females as Related to Their Sptiuses PresentAnnual income O OOO 0 ***** f040014000000.00 ************* APO *** 0 **** .000
, , .13 r Teacher Persistente. as Related to the Grade Level of Teacher
Education Preparation.. .0.. ** . ****** 011.41000,00000.00000.000 * 11,4/ **
Teacher Peisistence of Respondents Related to Their'Satisfactionwith Teachinge...4,. ****** 146.....
y_15 - The Aiture Teaching Plans of the Present Teachers as Related toSex',*** . * ,:* * *****
16 -Future Teaching Plans of Teaching Respondents al Related to TheirSatisfaction with Teaching.. .0 * - *** .00001000 ** 0 ** 00 ********* 0000,00
17 Teaching Plaits of Non-Teachers'-as Related to the Sex of the Non-Teachers******* avettioff****
38 - Comparison of Non-Teachers 1957 Intentions- to Return to TeachingWith Their Actual Employment in n614 . p **** « * **
List of Figures
The Percentage of Respondents Included in the Teacher"and "Romemakerl Categories from September 1954 to ThePresent ,,aoseireo:ive011 4 40'' 411,' 04100**0010
t
The Percent of teaching Respondents Employed at TheElementary Level, the Junior High Level, and the SeniorHigh level During Each Semester frau September 1p8 toThe .. . . .
The Number of Years of-teaching Experience of theRespondents in Terais of Cumulative Perceftts of Malesand Females .. ............t
TOREW 01,13)
This report is the latest in a series of studies of the teachingcareers of the students who were graduated in 1953-54 frost the teachereducation prOgrams of the 'Senior Collegis of The City University ofNew York. Earlier reports in the series were. planned and carried outb* Harold- B. Mitzel and William-Rabinowitz. The study reported herewas planned by William. Rabinowitz and Joseph T. Impellitteri.Dr. Impellitteri was in charge pf tir data co.Uection and statisticalanatis is, and is the author of this report.
A number of staff members In the Office of Research andItcallation have contributed to the ..stUdy in various ways. Spcialthasks are due to Jtrbarti Heller for editorial assistance, anti toGenaro Iambic', for checking the statisticaLtables.
r
Albert. J. Harris, DirectorOffice of Research and Evaluation
'71111/47.0'r.FT. '111111rWW"r7.711- 0400r; WW1!. AP8110411i
CHAPint
INTRODUCTION
The inadequate -supply of fully-qualified teachers has been one of
ihe major concerns of educatiOn in the United States since ,the conclusion
of World War II. The National Education Association's) sixteenth Onual:
survey on "Teacher Supply and Demand in'Ildblic Schools, 190,",Atimated.
that only 117,000 of the 235,000 teachers needed by September 1963to
fill vacancies and relieve overcrowded classrooms would be available.
In their 1964 survey.repoit,rtile,NEA, estimated that 130,000 new teachers
would enter the profession to fill an estimated 248,000 vacanciesin the
public schools (3).
Although there has been an increase in the supply of new teachers
graduated and entering the profession - from 1963 to 1964 = this has been
more than offset by the increasing demandldue in part to: (a) the steady
growth in public school enrollmees; (b) the number of teachers leaving
4
.
the profession; and (c) the number of trained people who never enter
teaching. The NBA reports that each year, ,only seventy-five percent of, .
the qualified new teachers actually ever enter teaching (3) -The
New York City public school stem shares with other school systems in
the countrya common need for a staff of fully- qualified teachers who are
likely to give long years of service. ,Each year since 1955 approximately
2,000 new teachers have been graduated from the fOur New York City
municipal colleges: Brooklyn, City, Hunter and Queens. Although an in-
creasing precentage.of these qualified teachers have accepted,teaching.
positions in the New York 3.ty public school system (1), the demand for
new teachers exceeds the supply.
Ten years ago, the Office of Research and EValuation of the Division
of; eacher Education undertook 'a longitudinal study of a group of teacher-
education students at the municipal, colleges. This group of about 1800
undergraduate education students was composed of both'men,and women who
were enrolled in student-teaching courses during the academic year
- 1 -
4.
77.7771777 ,grwaF:79F711,77,='-"tr'
1953-54. The prisent survey Is the fourth in the series (1955, 1957,1959 and 9.964) of follow ups that, make up the longitillinalstudy.
The original plipose of the study, was to Anvestig's.te the relation
ship between%persistence in teaching as a career and certain liypotbesi
personality and attitudinal variables (4): The Jpnuary 1957 (4) and the
1959%(5) follow-up studies suggested instead-that caiver,,deciSions were
largely based on situational and environmental circumstances. For "I-. .
exivaple, the most important factors in `determining teaching persistence. /
"among women were marriage and citildren (5).
This preient report devotes special 'attention to the voten in theoriginal (1954) group who have taught, left teaching to raise one ormore children, and who/ have subsequently returned to teaching. A cm-parison.of this group with those of the 1954 women who have taught, left
teaching to raise a, fqmily, and havenot returned to' teaching; could be
of value in identifying factorsitelated to non-persistence, other than
those situational factors already identified in the previous surveys.
V0
1-
T.OF.COEDUCT .01? THE STUDYJ
The subjects, of this fourth survey represent a ;elected sample of
the total population of Approximately. 1,806 stUdent-teachers of the
class of 1953=54; complete,initial test protocols and biographical datawere available for 1,628 of them. Both the first (1955) and the second
pllowsup\survey(1966-57).-questionnaiies were sent. to these 1,628subjects. To the first survey, 91 percent or 1,476eubjects responded.
There were 1,323 responies, an 81 percent retuin, to the second follow-
up study. in 195657 (4).
The next follow-up 'ias initiated in 1959. Since it was already
knowlithat mailing'addresses lifers obsolete fct 106 pei40as, 'thb numberof : questionnaires mailed in 1959 was 1,522. The nuiubei of responses.was 1,1444- 70 percent of. the original number of 1,628 'and 75 percent ofthe 1,522.
In aanuary1964 a slightly:revised questionnaire was mailed to the1,522 subilects for'whom addresses. had been available in 1959. To en-courage replies frOm non-respondents, tyo additional. letiers
1of reminder
-and copies of the questionnaire were mailed duript February.. Of thea 1.sp22* questionnaires mailed,- only 1,122 were actually delivered*. Everyeffort was made to secure addresses for the other four 'hundred isubjecte,,,but (pertly because of the Post" Office policy of not forwarding mail formore than three years after change of residence) they were never located. .
Of the 1,1221 stibjects who received the 1964 follow-up queetionnaire, 75perient or 840 subjects replied.
Summarizing, the returns received in each of the surveys were asfollows:
4
1.The greatest number of returns was received during Februark 1964. Al'sthough additional returns continued to come in during the month that fol-lowed, Sarah 23 was chosen as-the cut-off datelor acceptance of replies.
-3
-37771-7-'-'-"'"1111Pg's",77-1"w7,17., -
;4: 410
!.
first follow-up (1955)... ..
second folloykip (1956-57).
third folloW-up (1959): .
fourth (present) follow-up (1964).
Representetivenesa RespondentsBefore thy. results of the present investigation can be meaningfully
1,476 replies (91% of 1,628)
1,323 replies (81% of 1,628)
141441 replies ( 70% of -1,628i
75% of 1,522 delivered)
840 replies (52% of 1,628175% of 1,122 delivered)
fol
interpreted, the representativOness of these 840 respondents--52 percent.
of the original population-needs to be estimated. Were these respondentsrepresentative of tie original group 'tested in 1954-54, or,did theydiffer in some important .way frith' that larger group?
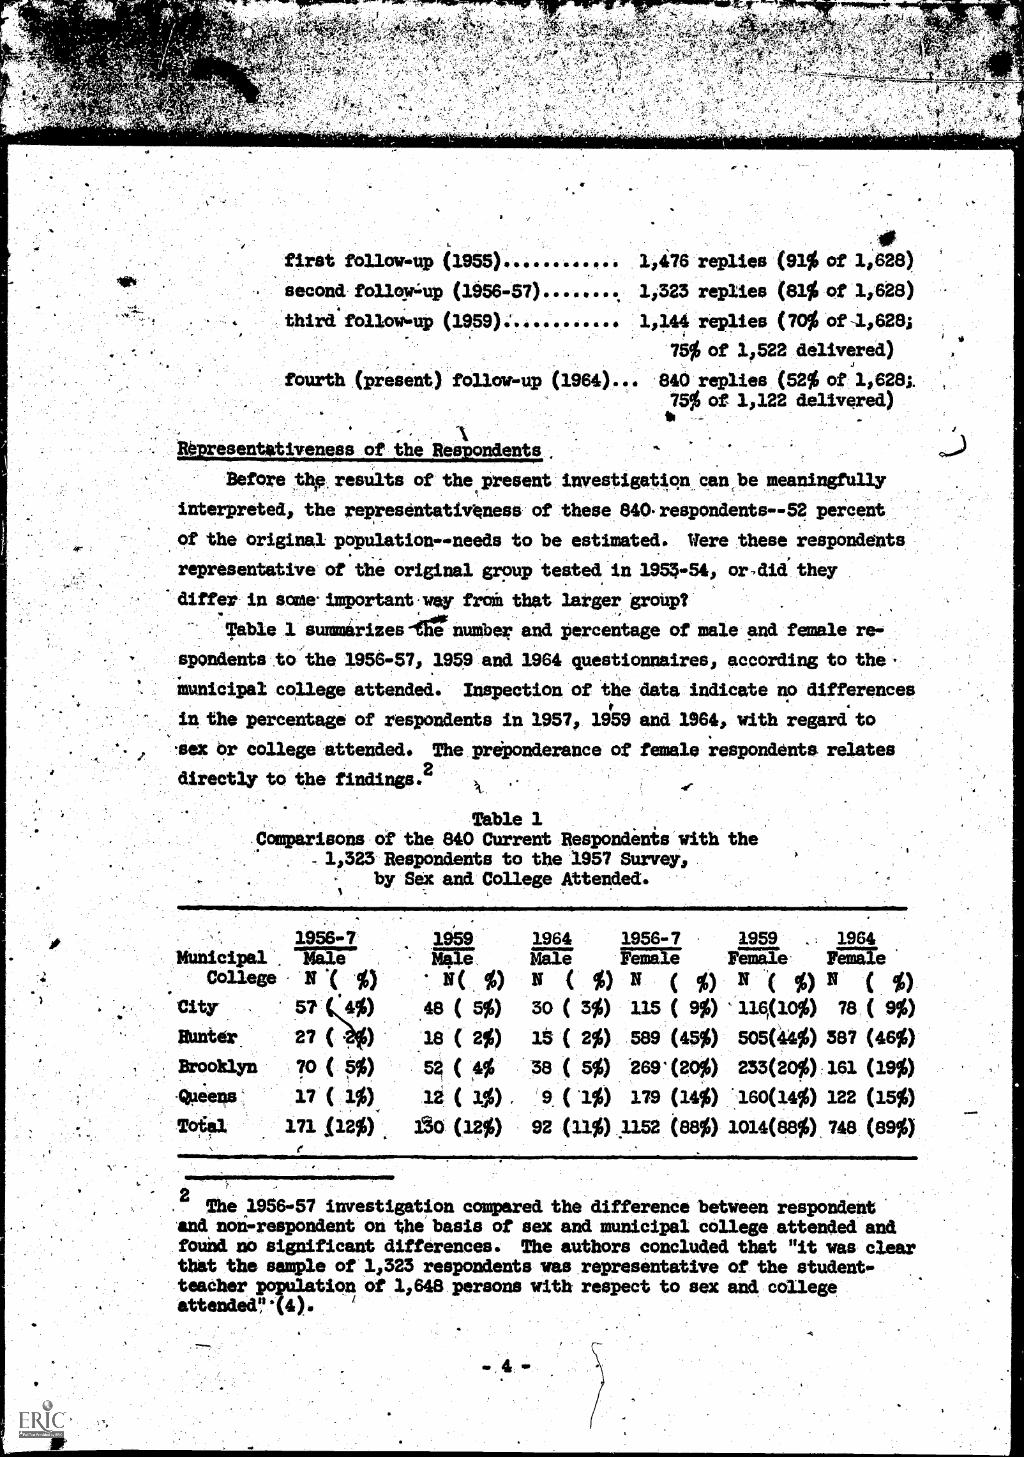
Table 1 'stummiriZes-ite° number and percentage of male and female re-spondents ,to the 1956-57, 1959 and 1964 questionnaires, according to the
municipal college attended. Inspection of the data indicate no differences
in the percentage of respondents in 1957, 1959 and 1964, with regard to
-sex or college attended. The preponderance of female respondents relatesdirectly to the findings.2
1964
k..
Table 1Comparisons of the 840 Current Respondents with the
1,323 Respondents to the '1957 Survey,by Sex and College Attended.
1956-7 1959Municipal Male Meele
College N %) N(City 5? (4%) 48 ( 5%)Hunter 27 ( ) 18 ( 2%)Birooklyn 5%) 52 (4%-Queens 17 ( 1%) 1 ( 1%)Total 171 1120 350 (12%)
Male
N %)
30 ( 3%)
15 ( 2%)
-38 ( 5%)
9 ( '1%)
92 (11%)
1956-7Female
N ( 1)115 ( 9%)
589 (45%)
269'(20%)
179 (14)1152 (88%)
1959FemaleN %)
3.16,(10%)
505(44%)
235(20%)
160(14%)
1014(88 %)
1964FieN %)78 ( 9%)
387 (46%)
161 (19%)
122 (15%)
748 (89%)
.
2The 1956-57 investigation compared the difference between respondent
and non-respondent on the basis of sex and municipal college attended andfound no significant differences. The authors concluded that "it was clearthat the sample of 1,323 respondents was representative of the student.-teacher population of 1,648 persons with respect to sex and collegeattended?*(4).
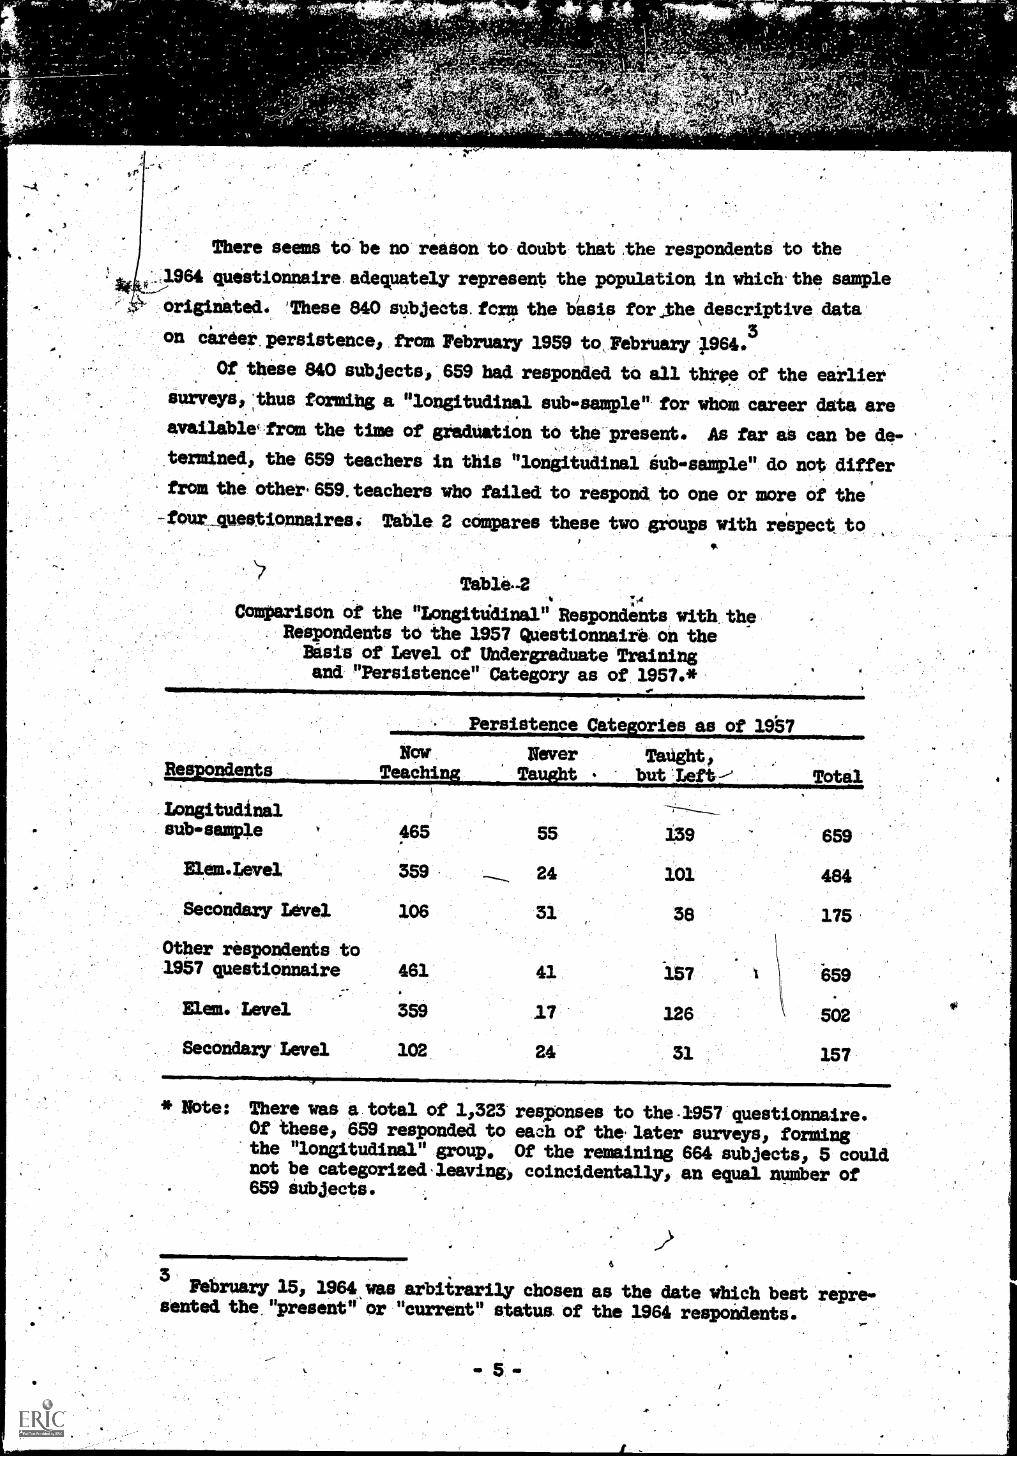
There seems to be no reason to-doubt that the respondents to the
:1984 questionnaire. adequately represent the population in which the sample
originated. 'These 840 subjects. form the basis for,thedescriptive data
on career. persistence, from February 1959 to,February 1.9843
Of these 840 subjects,,859 had responed to all three of the earlier
surveys, ,thus formihg a "longitudinal sub- sample" for whom career data are
availtOlw.from the time of gradUation to the-present* As far as can be de-
termined, the 659 teachers in this "longitudinal sub- sample" do not differ
from the Otheri859.teachers who failed to respond to one or more of the
fOur,questionnairesi Table 2 cOmpares these two groups with respect to
Tab14-2
Comparison of the "Longittidinal" Respondents with, theRespondents to the 1957 Questionnaire on the
Basis of Level of Undergraduate Trainingand "Persistence" Category as of 1957.*
Persistence Categories as of 195?
Now Never TaUght,ndents Teachi.: Ta :.t but'Left- Total
,Longitudinalsub-sample 465 55 139 659
Flem.Level 359: 24 101 484
Secondary Level 106 31 38 175
Other respondents to1957 questionnaire 461 41 157 659
.
\Elem. Level 359 .17 126 502
Secondary Level 102 24 31
* Note: There was a total of 1,323 responses to the1957 questionnaire.Of these, 659 responded to each of the later surveys, formingthe "longitudinal" group. Of the remaining 664 subjects, 5 couldnot be categorized leaving coincidentally, an equal number of859 Subjects.
February 15, 1964 was arbitrarily chosen as the date which best repre-sented the "present" or "current" status of the 1964 respondents.
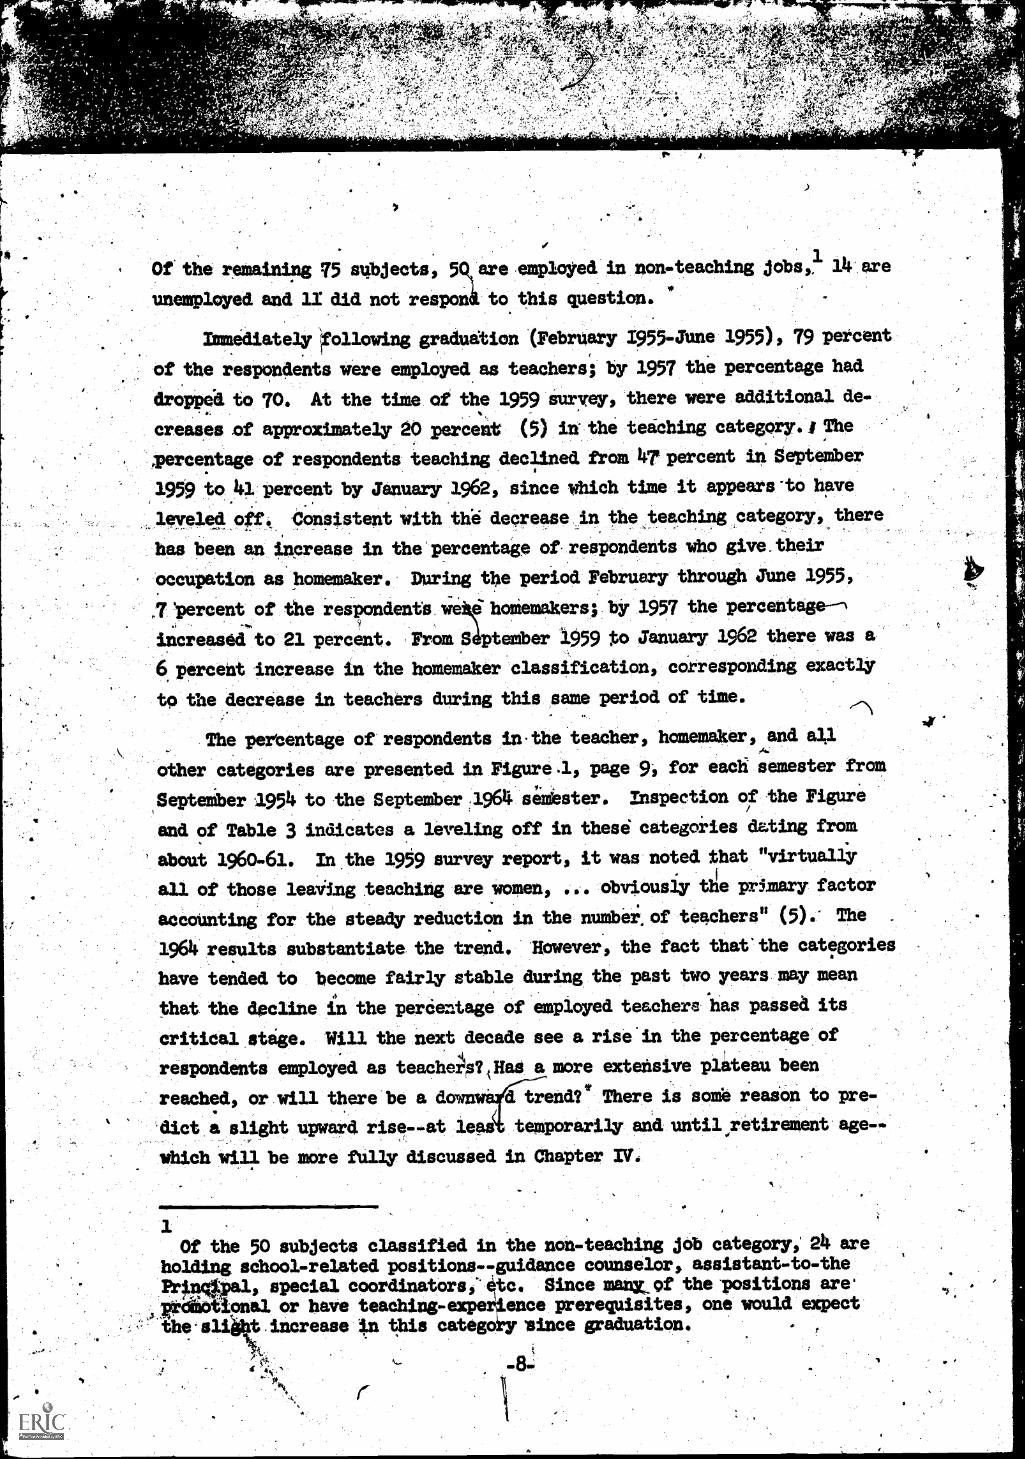
level of undergraduate training and career persiStence status as of4 A
January-31, 1957. Inspection of the table reveals that the two groups
of respondents do not differ in these respects. Although these data
describethe representativeness of the retipondents, the question,
beyond the scope of this study, or whether the 1953 -54 class of
student= teachers is itself representattve of student teachers graduated
Fran the municipal colleges in earlier and later ;years is.unanswered.
Persistence is the length of ime following graduation a teacher-educatiOn student spends in teat ng. Some leave teaching, some leaveand subsequently return. Since st of these decisions are note ir-revocable, persiitence or non". rsistence is largely a functidn of thetime at which the information ii obtained (4).
CHAPTER III
REVILES.
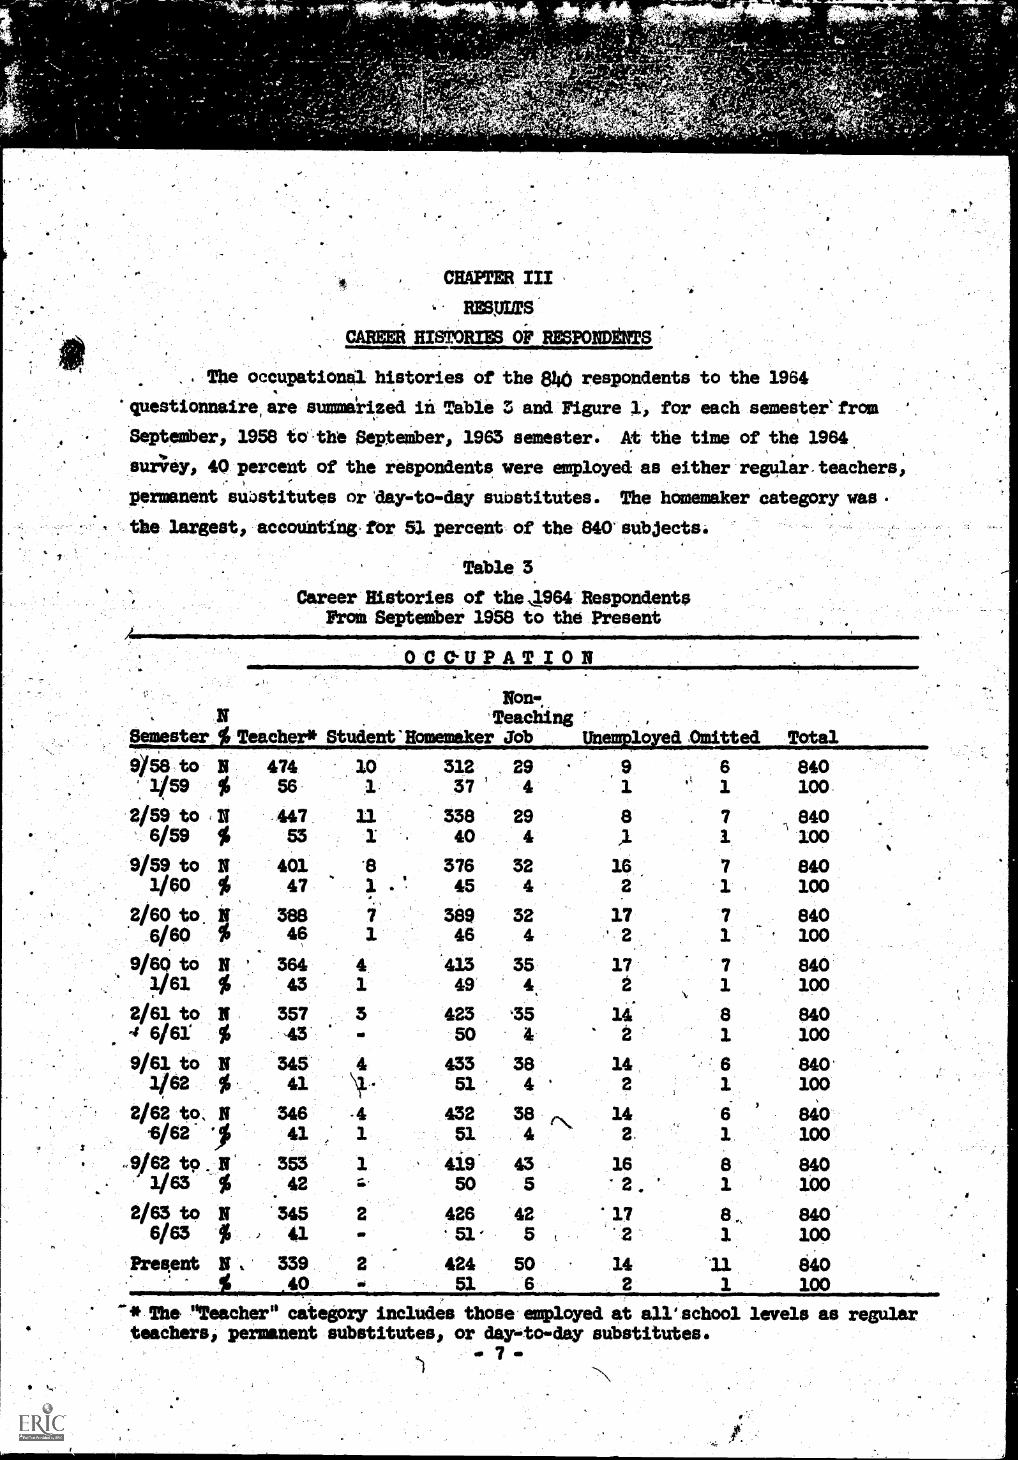
CAREER HISTORIES OF RESPONDENTS:
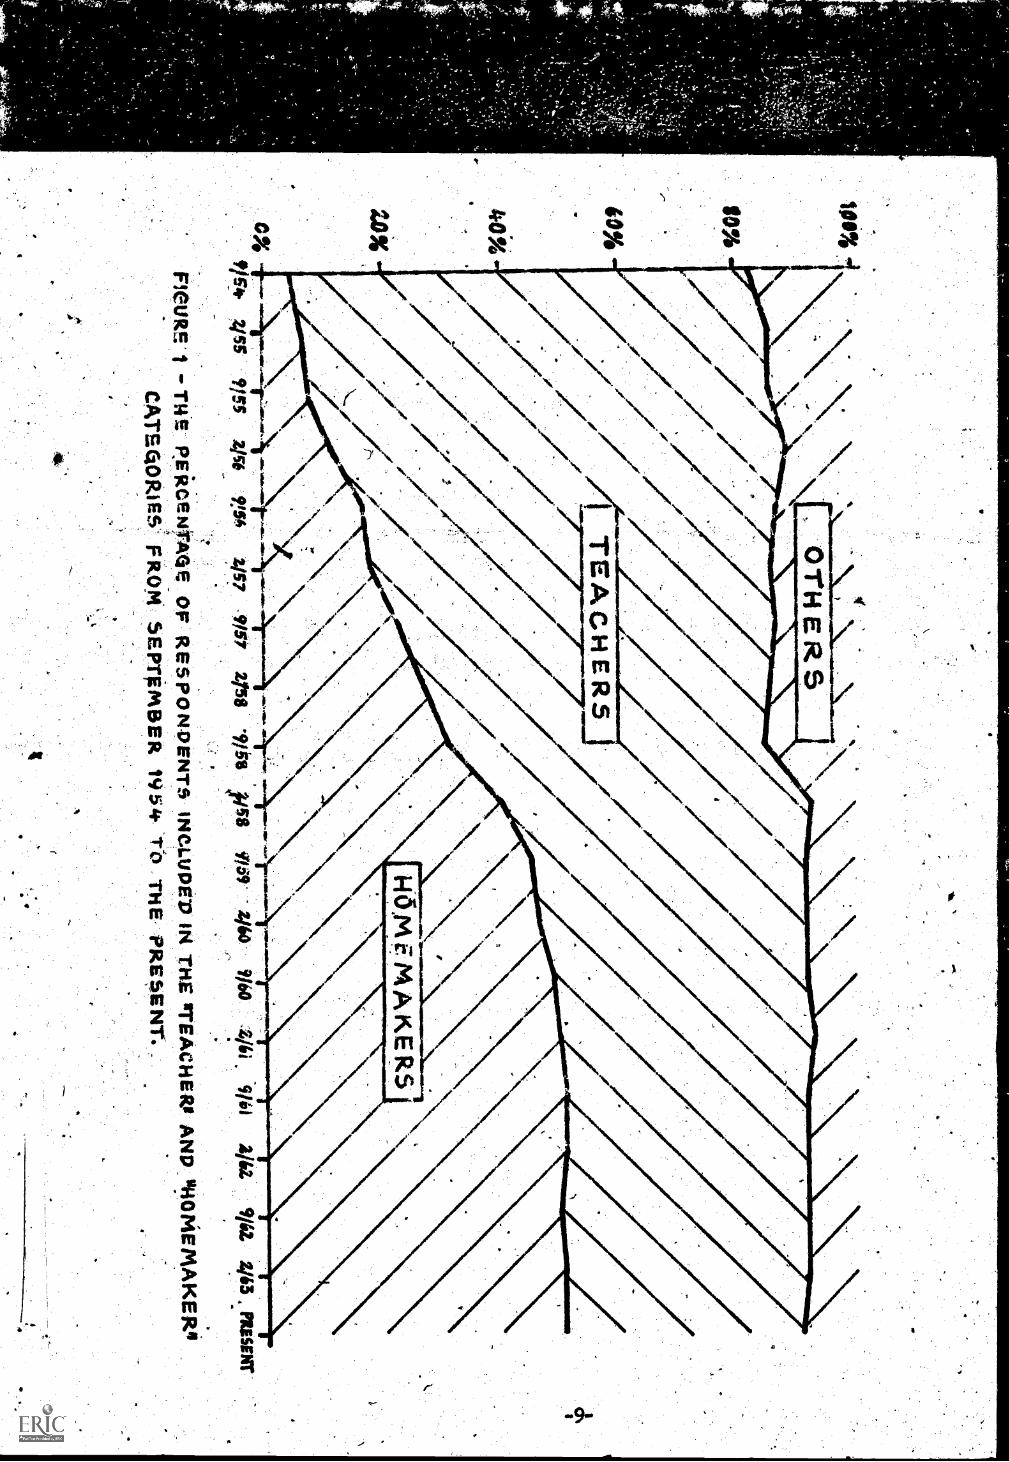
The occupational histories of the 840 respondents to the 1964
questionnaire, are summarized in Table 3 and Figure 1, for each semester from
September, 1958 to-the September, 1963 semester. At the time of the 1964.
survey, 40 percent of the respondents were employed as either regular-teachers,
permanent su'ostitutes or 'day-to-day substitutes. The homemaker category was
the largest, accounting for 51 percent of the 840'subjects.
Table 3
Career Histories of the 1964 BesPondeotsFrom Septeniber 1958 to the Present
9/58 to N 474 10 312 29 9 6 840'.1/59 % 56 1 37 4 1 100
2/59 to N .447 11 338 296/59 $ 53 1 40 4
9/59 to N 401 13 376 32
1/60 % 47 1 45 4
2/60 to. N 388 7 389 32
6/60 % 46 1 46 4
9/66 to N '' 364 4 415 351/61 % 43 1 49 4
2/61 to N 357 3 423 155
4 6/62 % 43 . 50 4
9/61 to N 345 4 433 38'1/62 Ips 41 4- 51 4
2/62 to, N 346 4 432 3810B- 1 41 1 51 4
9/62 to. N' 353 1 419 431/63 % 42 r.. 50 5
2/63 to N '345 2 426 426/63 % 51' 5.
Pregent N, 339 2 424% .40 51
506
8 7 8401
1100
16 7 8402 1 100
1? 7 8402 1 f 100
17 7 8402 1 100
14 8 840.
2 1 100
14, 6 840'2 1 100
142
61
,
840100
16 8 840*2. 1 100
'17 8,, 840'2 1 100
14 8402 1 100
41Theslreadher" category includes those employed at all' school levels as regularteachers, permanent substitutes, or day-to-day substitutes.
. 7-
9
11777,7'
Of' the remaining 75 subjects, are employed in non-teaching jobs,,1
14. are
unemployed and 11 did not responi to this question.
Immediately 'Following graduation (February 1955 -June 1955), 79 percent
of the respondents were employed as teachers; by 1957 the percentage had
dropped to 70. At the time of the 1959 survey, there were additional de-
creases of approximately 20 percent (5) in the teaching category./ The
mercentage of respondents teaching declined from 4? percent in September
1959 to 41. percent by January 1962, since which time it appears -to have
leveled,of. Consistent with the decrease in the beaching category, there
has been an increase in the'percentage of. respondents who give. their
occupation as homemaker. During the period. February through June 1955,
,7 'percent of the respondents. we honiemaers; by 1957 the percentage----N
increased to 21 percent. From September 1959 to January 1962 there was a
6 percent increase in the homemaker classification, corresponding exactly
to the decrease in teachers during this same period of time.
The percentage of respondents inthe teacher, homemaker, and all
other categories are presented in Figure .1, page 9; for each semester from
Septeiber 1954 to the September :1964 semester. Inspection of the Figure
and of Table 3 indicates a leveling off in these categories dating from
about 1960-61. In.the 1959 survey report, it was noted that "virtually
all of those leaVing teaching are women, ... obviously the primary factor
accounting for the steady reduction in the numbei, of teachers" (5).- The .
1964 results substantiate the trend. However, the fact that the categories
have tended to become fairly stable during the past two years may mean
that the decline in the percentage of employed teachers has passed its
critical stage. Will the next decade see a rise 'in the percentage of
respondents employed as teach4s?i Has a more extensive plateau been
reached, or will there be a down d trend?'" There is some reason to pre-
'diet a slight upward riseat leas temporarily and until retirement age--
which will be more fully discussed in Chapter IV:
1Of the 50 subjects classified in the non-teaching job category, 24 are
holding school-related positionsguidance counselor, assistant-to-thePrincOal, special coordinators,' etc. Since many,of the positions are
praiotional or have teaching-experience prerequisites, one would expectthe slit increase in this category since graduation.
-8-
II
4
OT
HE
RS
VS
* 4559/.55
2/s4*Z
IP2/57
9/572758
*9/511tti"
1/6921" 9W
'441.9/41
9/6Z14i3
..PRE
SEN
T.
FIC
-UR
.F. 1 -T
HE
RE
iteet#Aae O
F R
ES
PO
ND
EN
TS
INC
.LUD
ED
IN T
HE
*TE
AC
HE
R+
, AN
P"H
OM
EM
AK
ER
II
CA
TS
OR
ISE
) FR
OM
SE
PT
OM
BE
R 1954
Ti T
HE
PR
EE
NT
.
?*
.
.1
nap II
"?, .-
4-0
CHARACTERISTICS OF TEACHING RESIMICHTS
In this section of the results, descriptive data on the careers of339 teachers (those who responded to the .questionnaire as being currentlyemployed as classroom teachers, omitting those in non-teaching jobs) will ,
be presented. When relevant, the results of the 1964 survey will becontrasted with the results of the previous surveys. Several factorsthat may be related to persistence will be examined in detail.
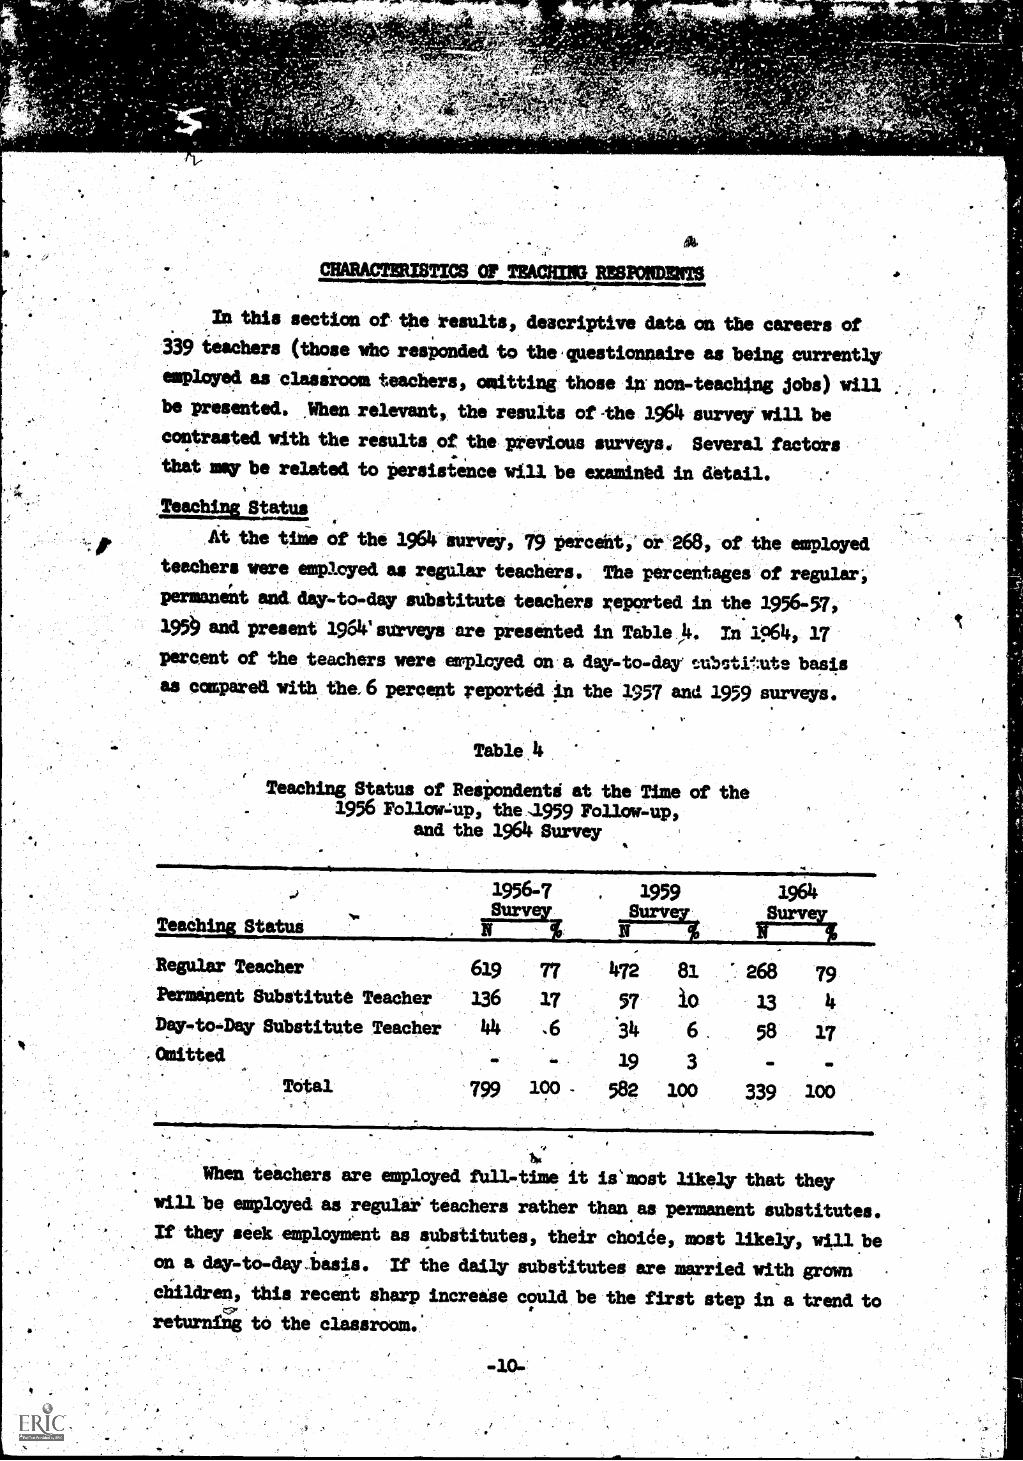
yeachiaratataAt the time of the 1964 -survey, 79 perceiit; or 268, of the employed
teachers were employed as regular teaciers, The percentages of regular;permanent and day-to-day subsitUte teachers reported in the 1956-57,195 and present 1961e surveys are presented in Table #. In 19611., 17percent of the teachers were employed on a day-to-day tubstrate basisas capered with the 6 percent reported In the 1957 and 1959 surveys.
Table
Teaching Status of Resiondente at the Time of the1956 Follow-;up, the .1959 Follow-up,
and the 1964 Survey
Teach Status
Regular TeacherPermanent Substitute TeacherDay-to-Day Substitute TeacherOmitted
Total
1956-7 , 1959Sury Surve-
N
619 77
3.36 3.7
472 8157
3.964Sury
268 79
13 lt44 .6 34 6.. 58 17
19 3
799 190 582 100 339 100
's
When teachers are employed full-time it is most likely that theywill be employed, as regular teachers rather than as permanent substitutes.If they seek employment as substitutes, their choide, most likely, will beon a day-to-day basis. If the daily substitutes are married with grownchildren,' this recent sharp increase could be the first step in a trend toreturning to the classroom.
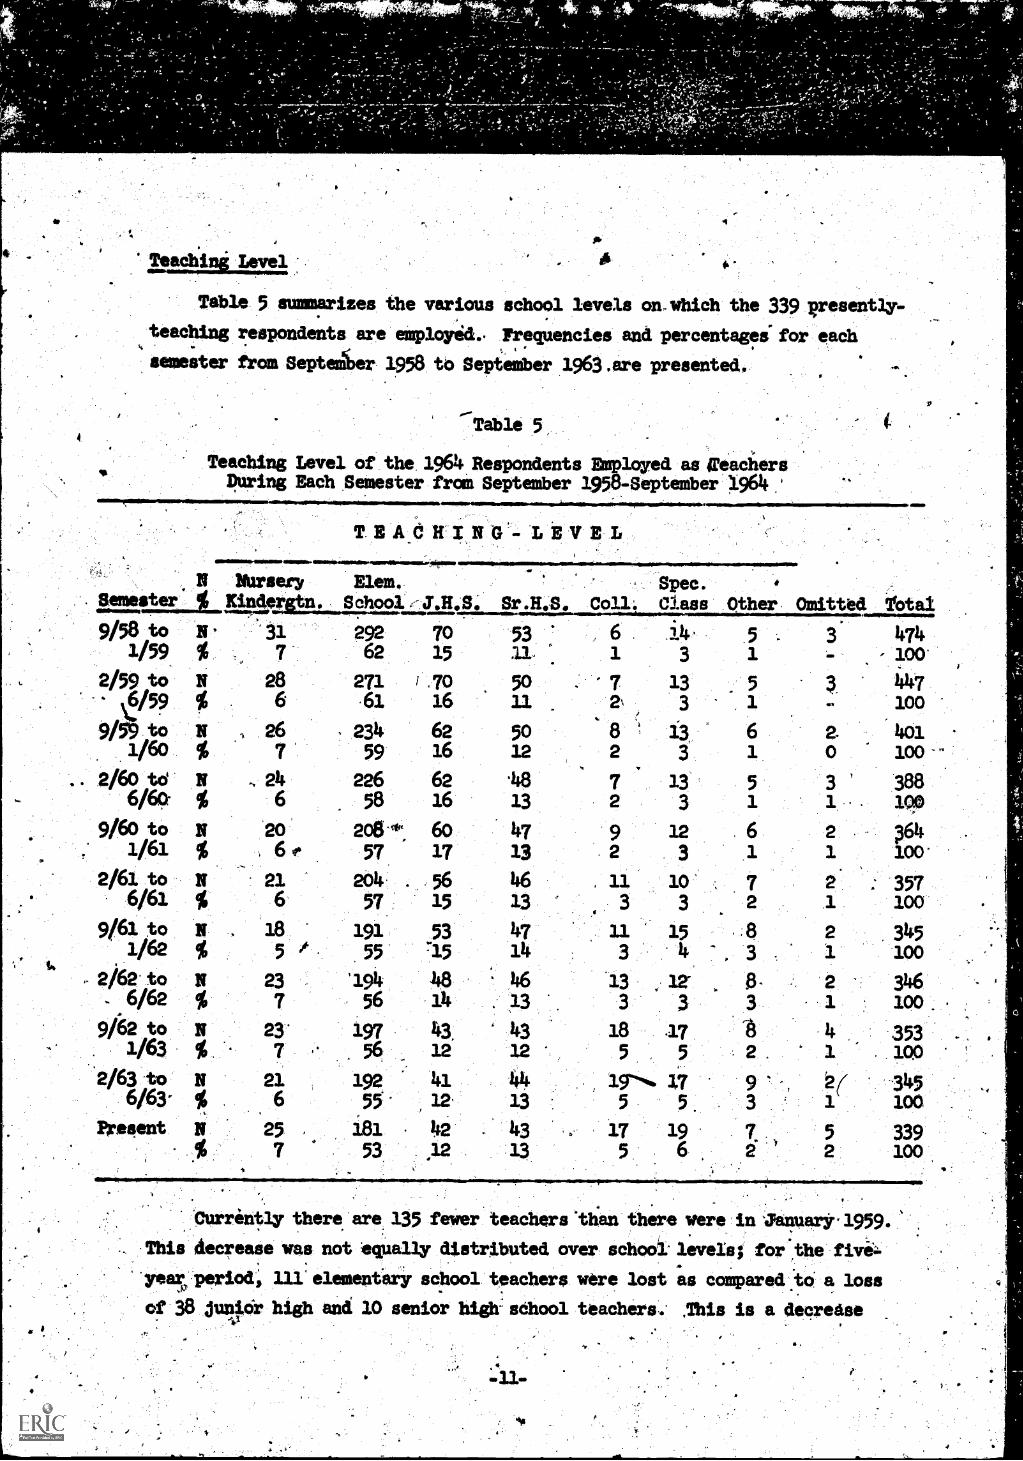
Teacla Level 1
Table .5 summarizes the various school levels on.which the 339 Rresently-
teaching respondents are employid.. Frequencies and percentages" for each
semester from Septeniter 1958 to Sepiember 1963 ,are presented,
Table 5
Teaching Level of the 1964 Respondents Employed as ireachersDuring Each Semester from September 1958-September ).964
MMINEftrIMMmUlMMOWNIINN1Yek 1111811.TEACHING-LEVEL
ilimelirsum 1111r...................,N !turnery Elem. , Spec.
Semester % ,ICindeissiall ,- J.H.S. Sr.H.S. Coll: Class Other Omitted *Total.
292 70 53 6 ,14. 5 3 4741/59 % 7 62 15 :Ix 1 3 1 - loo
2/59 to N 28 271 1 70 5o 7 13 5 44716/59 % 6 .61 16 It Z 3 1 loo
,,..9/59 to N 26 . 234 62 50 8 13 6 2 401
1/6o % 7 59 3.6 12 2 3 1 o loo ..
2/6o to N , 24 226 62 .48 7 3.3 5 3 3886/69- % 6 58 16 13 2 3 1 1 100
9/6o to N 20 206' 60 47 9 12 6 2 '641/61 % 6 t 57 17 13
.2 3 1 1 100.
2/61 to N 21 204- 56 46 . 11 10 7 2 . 3576/61 % 6 57 15 13 3 3 2 1 100
9/61 to N 18 191 53 47 11. 15 8 2 3451/62 % 5 / 55 715 14 3 4 3 1 loo
,. 2/62. to N 23 '194 48 46 13 ,, 12' 8 2 3466/62 % 7 56 14 13 3 3 3 1 loo .
9/62 to N 23' 197 43, 43 18 :17 'a 4 3531/63 % 7 56 12 12 5 5 2 1 100
.2/63 to N 23. 192 41 44 19 17 9 2( 3456/63' % 6 55 12. 13 5 5. 3 1 100
Present. N 25 181 42 43 A 17 19 7 5 339% 7 53 1312. 5 6 2 2 100
9/58 to N
'Currently there are. fewer teachers 'than there were in January 1959
This decrease was not equally distributed over school levels; for the fiv&
'years; period; Ill' elementnri school teachers were lost as coMpared:ta a loss
of 38 ju4cir high and 10 senior high' school teachers.. This is a decrease

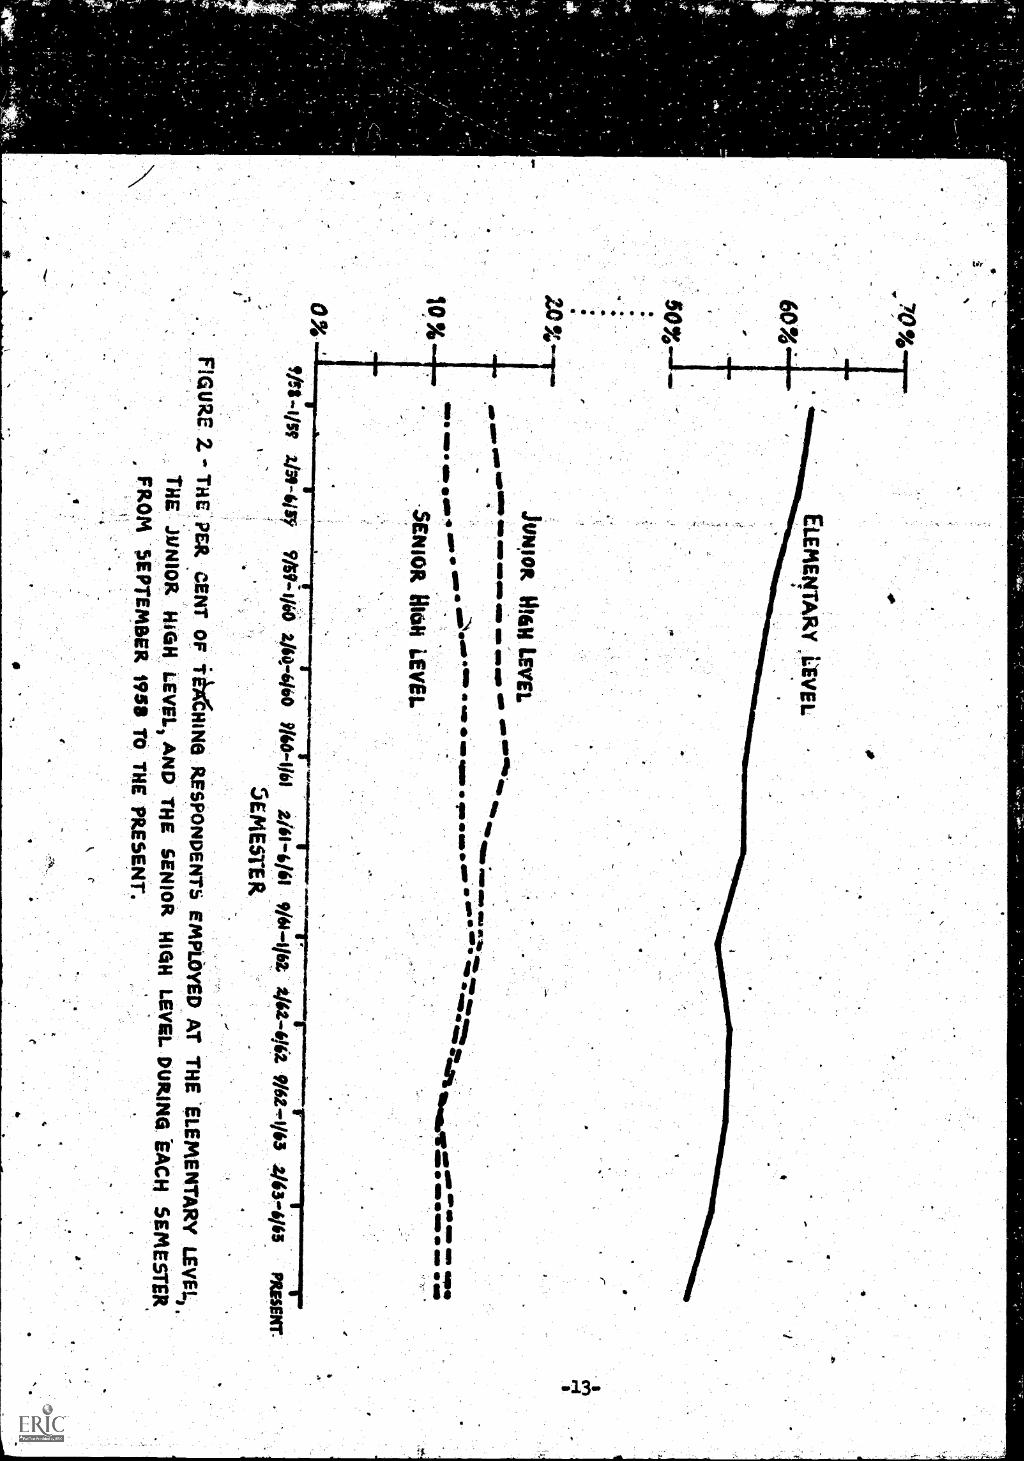
of -tics 62 percent to 53 percent at the elementary school level, 15 percent
to 12 percent at the junior high schOol level: The situation in the senior ,
high 'school, is different;vhile there was a loss of -ten teachers, the
percentage employed at this level increased. Since more than 90.percent of
the elementary school teacher,p are -*female, the great d;crease in this
category is predictable. At the higher levels there is a greater percent-,.
age of ma7.es'(5).
The perientage teaching it the nursery and kindergarten level has shown
little fluctuation. The number of yersons teaching at the college level has
almost tripled in number, and increased in p tentage from one to six. This
change, along with the slight increase in nom- thing jobs (see Table 3)
may be encouming. That is, although this represents a loss in a.vailethle
pubs sehoOl classroom personnel, these teachers are not lost to education.
Figure 21 page 13, -graphically portrays the percentage of teaching
respondents employed at the elementary., junior high and senior high school
level during each semester from September 1958 to the September 1963
semester.
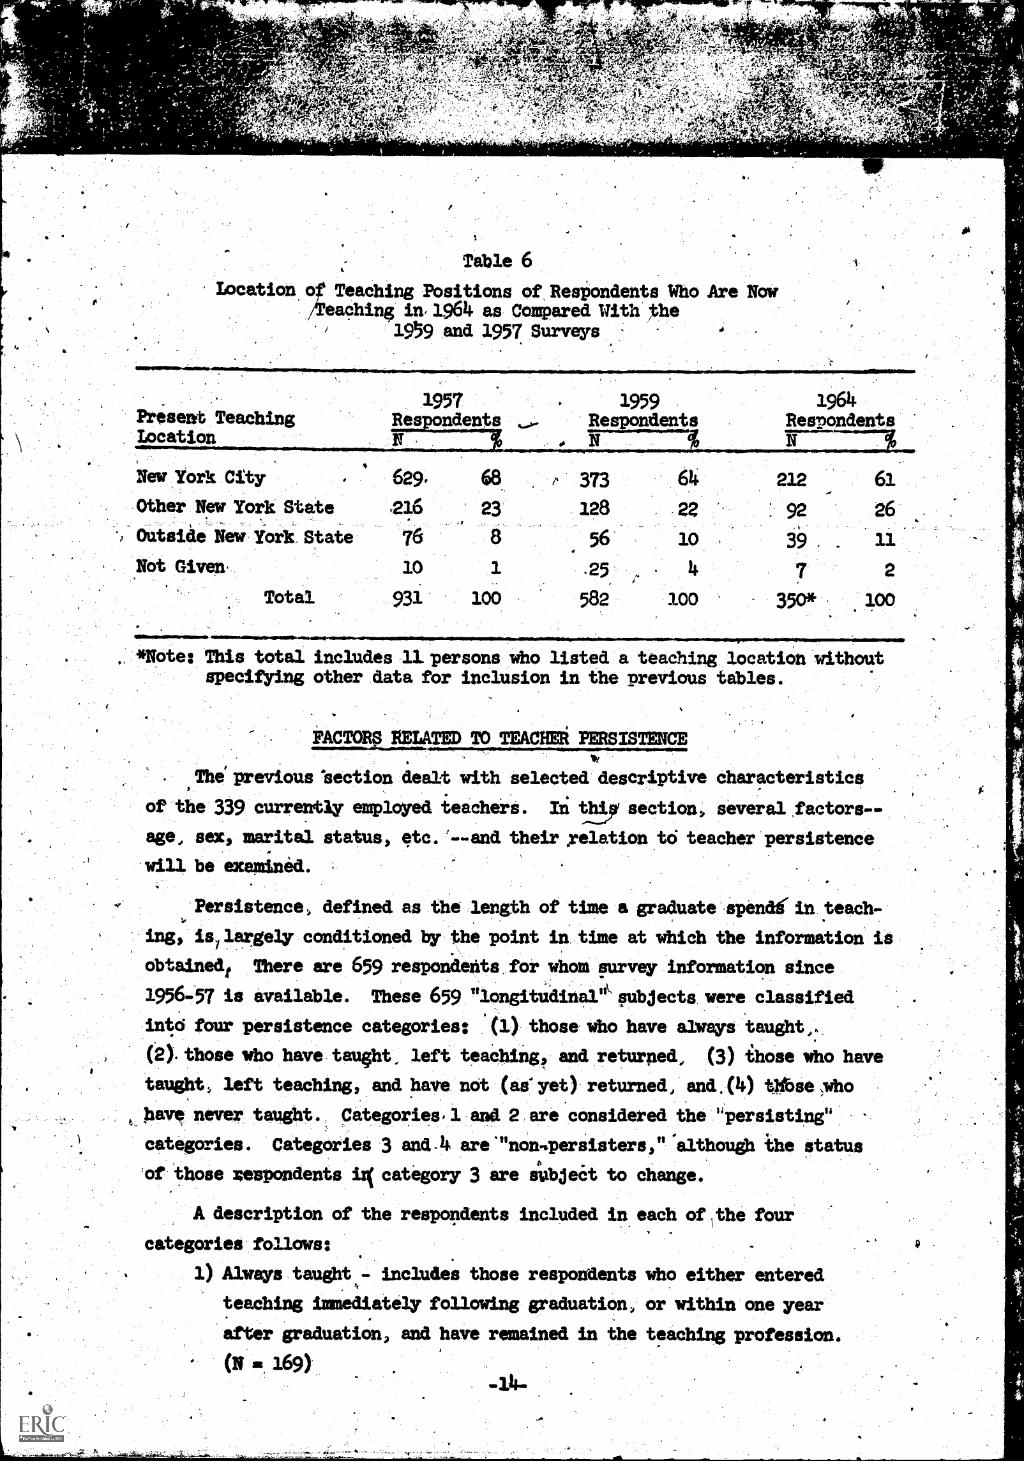
Location Of Teschl_nglosAtIan;
Another way of characterizing the teacher group is by the location of
their ,teaching positions. ,;Table 6`suntaarizes the number and percentage of
the 339 teachers teaching in new York City, schools, in schools in New York
State .'(other than`N.Y.C.), and in schools outside Nett York State. Similar
data ate presented for the teaching respondents in 1956-57., and 1959. Theiv
has been a small decrease-in the percentage of respondents located in -. .
,
Schools within the city, and the absolute number of N.Y.C. respondents
decreased-by almodttwothirds since 1957. The number of teachers located
in'ikchools outside New york City has decreased by approximately one-half,
althoigh the percentage has increased.
70%
6O50%
.0%
ELE
ME
NT
AR
Y LE
VE
L
JUN
IOR
IhfillLE
VE
L
"b glomw
o .61111114°.as
am.
ow! oP
IP
"I.,am
elle4111-41,"1111.
4111.*all
111111 IOW
0 eraN
al*O
M' e
4111_ftsim
ieM
mil
SE
NIO
RH
IOE
iE
YE
r
ei WO
a.'O
NO
OM
WO
O%
Saw
MD
MD
ID M
D a.
fir,9159;11/40 2/644460
1/4614121614/61 9/611/6Z
2/414/49/62"1/43 443°03
PR
ES
EN
T-
EM
ES
TE
R
F G
U Z
ET
HE
PE
R C
EN
T O
F ibC
CH
INE
IR
ES
PO
ND
EN
TS
EM
PLO
YE
D A
T T
HE
ELE
ME
NT
AR
Y LE
VE
L)T
HE
JUN
IOR
HIG
HLE
VE
L) AN
D T
HE
SE
NIO
R H
IGH
LEV
EL D
UR
ING
EA
CH
SE
ME
ST
ER
,F
RO
M S
EP
TE
MB
ER
1958 TO
TH
E P
RE
SE
NT
.
.1F-IF, I"'-;.c /*.,:7,1'
vor
.
4 41.7
;.
I 4
Table 6
.0
Location o Teaching Positions of, Respondents Who Are Now/Teaching in 19611 as Conrpared With the
Present TeachingLocation N.111111.1mmmluorr oonorisommolrmol.
109 and 1957 Surveys
1957Respondens
New York City 629. 68
Other New York State 216 23
Outside New York State 76 8
10 1
Total 931 100
Not Given,
1959Respondents
373 64
128 22 ".
56 10
.25
582 100
1964.
Respondents
212 61
:92 26
39 , 11
7 2
350* 100
*Note: This total includes 11. persons who listed a teaching location withoutspecifying other data, for inclusion in the Previous tables.
1ELATED TO TEACHER PERSISTENCE
The' previous 'section dealt with selected descriptive characteristics
of the 339 currently employed teachers. In tity section, several factors..-
age, sex, marital status, etc. 'and their ,relation to teacher persistence
will be examined.
- Persistence, defined as the length of time a graduate spendi in teach-
ing, is,largely conditioned by the point in time at which the information is
obtainedt There are 659 respondents for whom survey information since
1956-57 is available. These 659 "longitndinark subjects were classified
into four persistence categories: (1) those who have always taught,:,
(2). those who have taught, left teaching, and returned, (3) ihose who have
taught, left teaching, and have not (as' yet) returned, and,(4) tilbse who
have never taught. Categories, 1 and 2 are considered the "persisting
categories. Categories 3 and Ii. are 91non..persisters," 'although he status
2.
of those respondents egory 3 are subject to change.
A description of the respondents included in each of the four
categories follows:
1) Always taught - includes those respondents who either entered
teaching immediately following graduation, or within one year
after graduation, and have remained in the teaching profession.
(N al, 169)
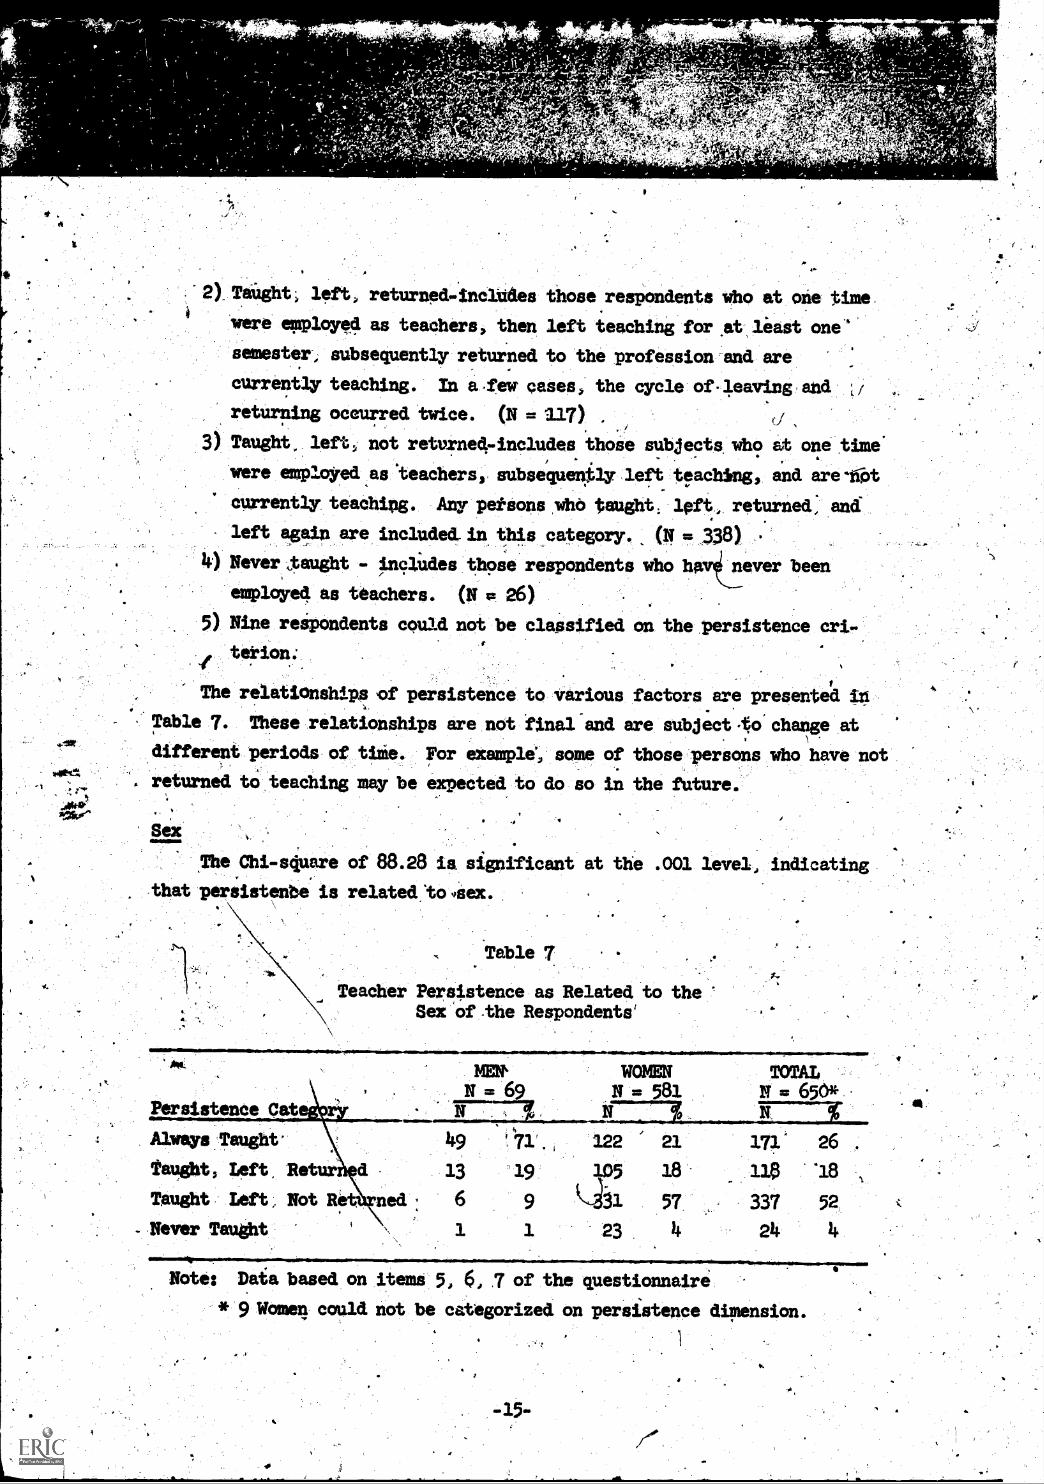
2) Taught) left, returned-incittes those respondents who at one timewere employed as teachers, then left teaching for ,atleast onesemester, subsequently returned to the profession-and are
currently teaching. In a-few cases, the cycle ofleaving and
returning occurred twice. (N = 217) if
3) Taught left:, not returned-includes thoie subjects. who at one timewere employed as *teachers,. subsequently left teaching, and are iiot
currently teaching. Any petsons whO taught; left, returned; and
left again are included, in this .category. (N = 338)Never,teught - includes those respondents who havnever beenemployed as teachers. (N = 26)
5) Nine reepondents could not be classified on the persistence cri-
I terion:
The relationships of persistence to various factors are presented.Table 7. These relationships are not final -and are subject to change at
different periods of time. For example, some of those persons who have not
returned to teaching may be expected to do so in the future.
Sex
,The Chi-scivare of 88.28 is significant at the .001 level, indicating
that persistenbe is related to4sex.
Table 7
Teacher Persistence as Related to theSex of the Respondents'
MEN, WOMEN TOTALN = 69 N 581 Et = 656*
Persistence Cat
Always Taught
taught; Left aetur =d
Taught Left, Not Ret ned
- Never Taught
' 41.f.; 122 21
13
6 9
1 1
18%tt
X331 57
23 4
111111.,
171' 26
.118 *18
337 52
24 4
Note: Data based on items 5, 6, ,7 of the questionnaire
* 9 Women could not be categorized on persistence dimension.
-15-
-1119TFI
Although 99 percent of, the men and at; least 96..97 percent of the women
have taught at some time, men are more likely to have remained in the
profession. .Seventy-one percent of .the males haVe been teachirt since
graduation; only 23. percent of the women have s taught. Even when the
"taught, left, and returned" category is com lied with the ,flalways taught"
category, the 'sex difference is striking- -90 percent 'of the men persist in
teaching as compared with 39 perCent of the women.
In the 1956-57 survey, the percentage of men and yawn in the "nowteaching" (equivalent to "always taught and taught, left, returned"
.- categories) category was equal (4). Five years after graduation, 78 per-
cent of the men were still teaching as compared with 47 percent of the
. wen (5). The 'differences noted in Table 7 are a clear indication that
although female teachers are still leaving the profession, the rate of
leaving has substantially decreased.
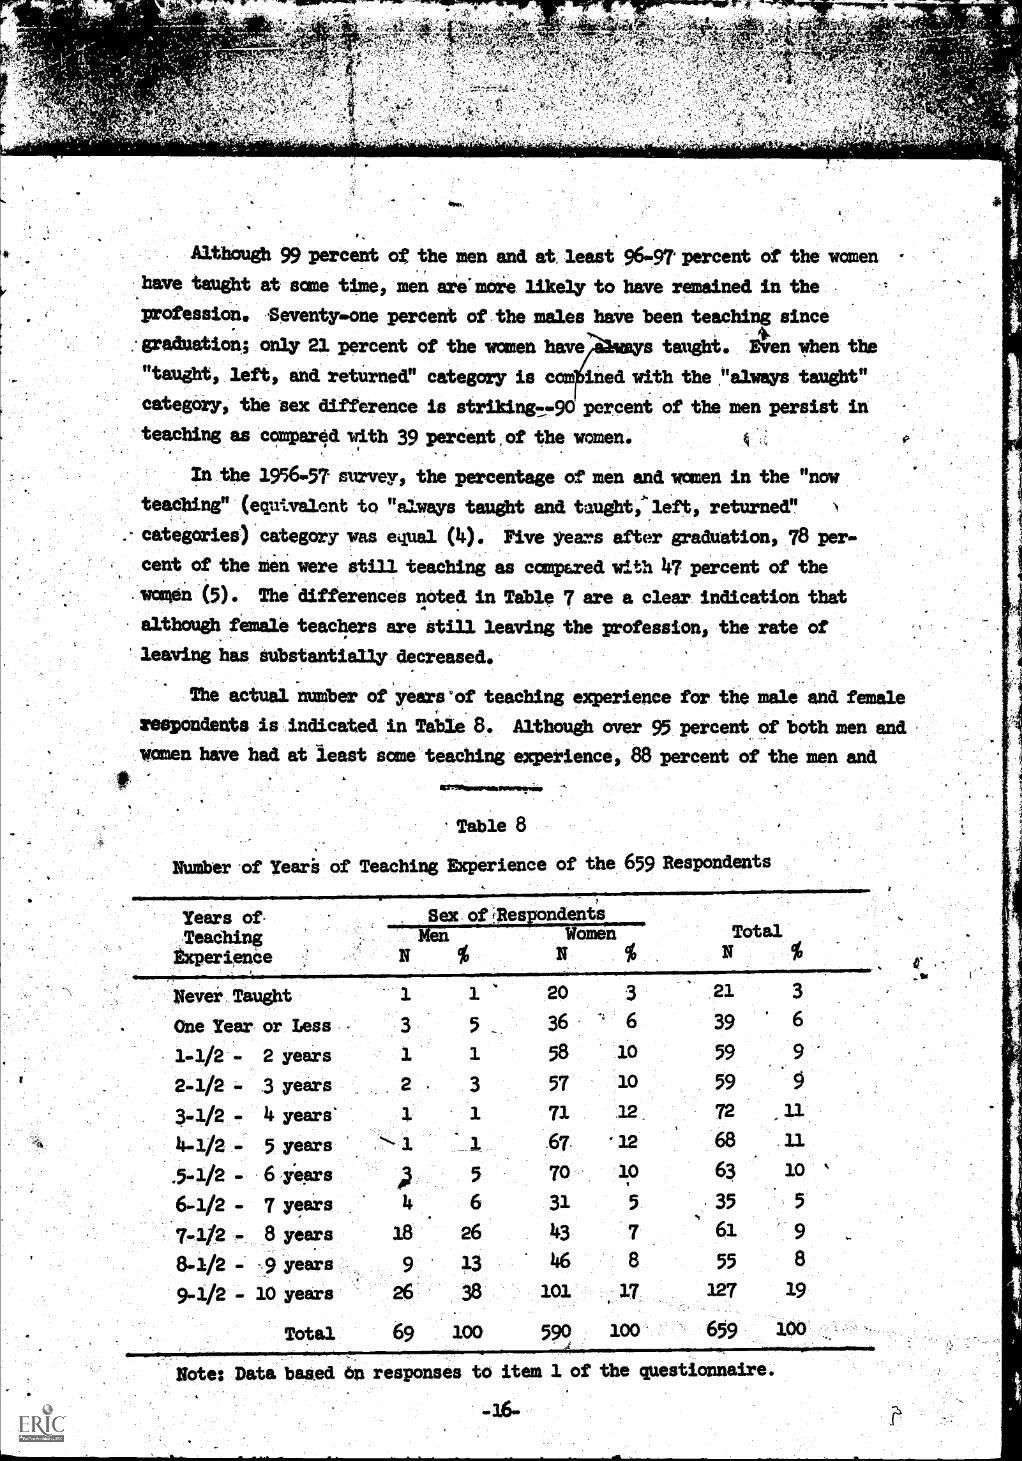
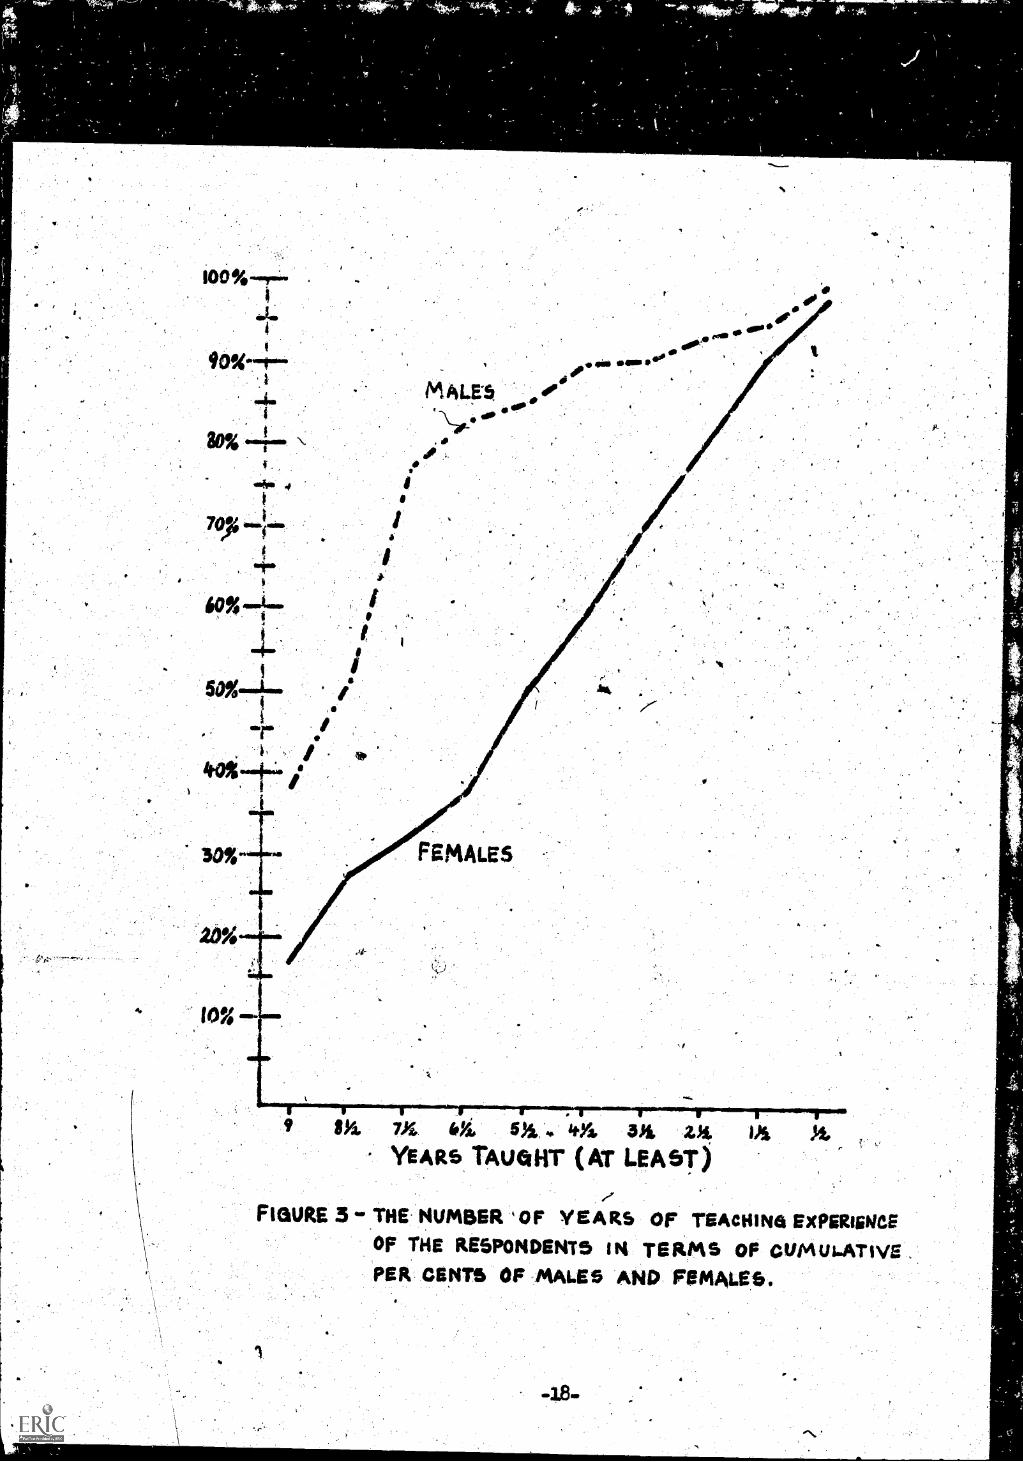
The actual number of years of teaching experience for the male and female
respondents is Andicated in Table 8. Although over 95 percent of both men and
women have had at least some teaching experience, 88 percent of the men and
Table 8
Number .of Yeare of Teaching Experience of the 659 Respondents
Years of-Teadhing
Experience
Never TaughtOne Year or Less
1 -1/2 - 2 years
2-1/2 - .3 year
3-1/2 4 years'
4-1/2 5 years
5.1/2 - 6 years6-1/2 - 7 years
7-1/2 - 8 -years
8-1/2 - -.9 years
9-1/2 - 10 years
Sex of !RespondentsMen Women
N % NTotalN %
1 1 20 3 .21 3
36 6 39 6
1 58 3.0 59 9
3 57 10 59 5
1 71 32 72 11
1 67 12 68 11
5 70 10 63 10
4 6 31 5 35 5
18 26 43 7 61 9
9 13 46 8 55 8
26 38 101 17 127 19
Total 69 100 59? 100 659 100
Note: Data based On responses to item 1 of the questionnaire.
f.-41111-14.11111rardiar,-..^r.-gpv--7
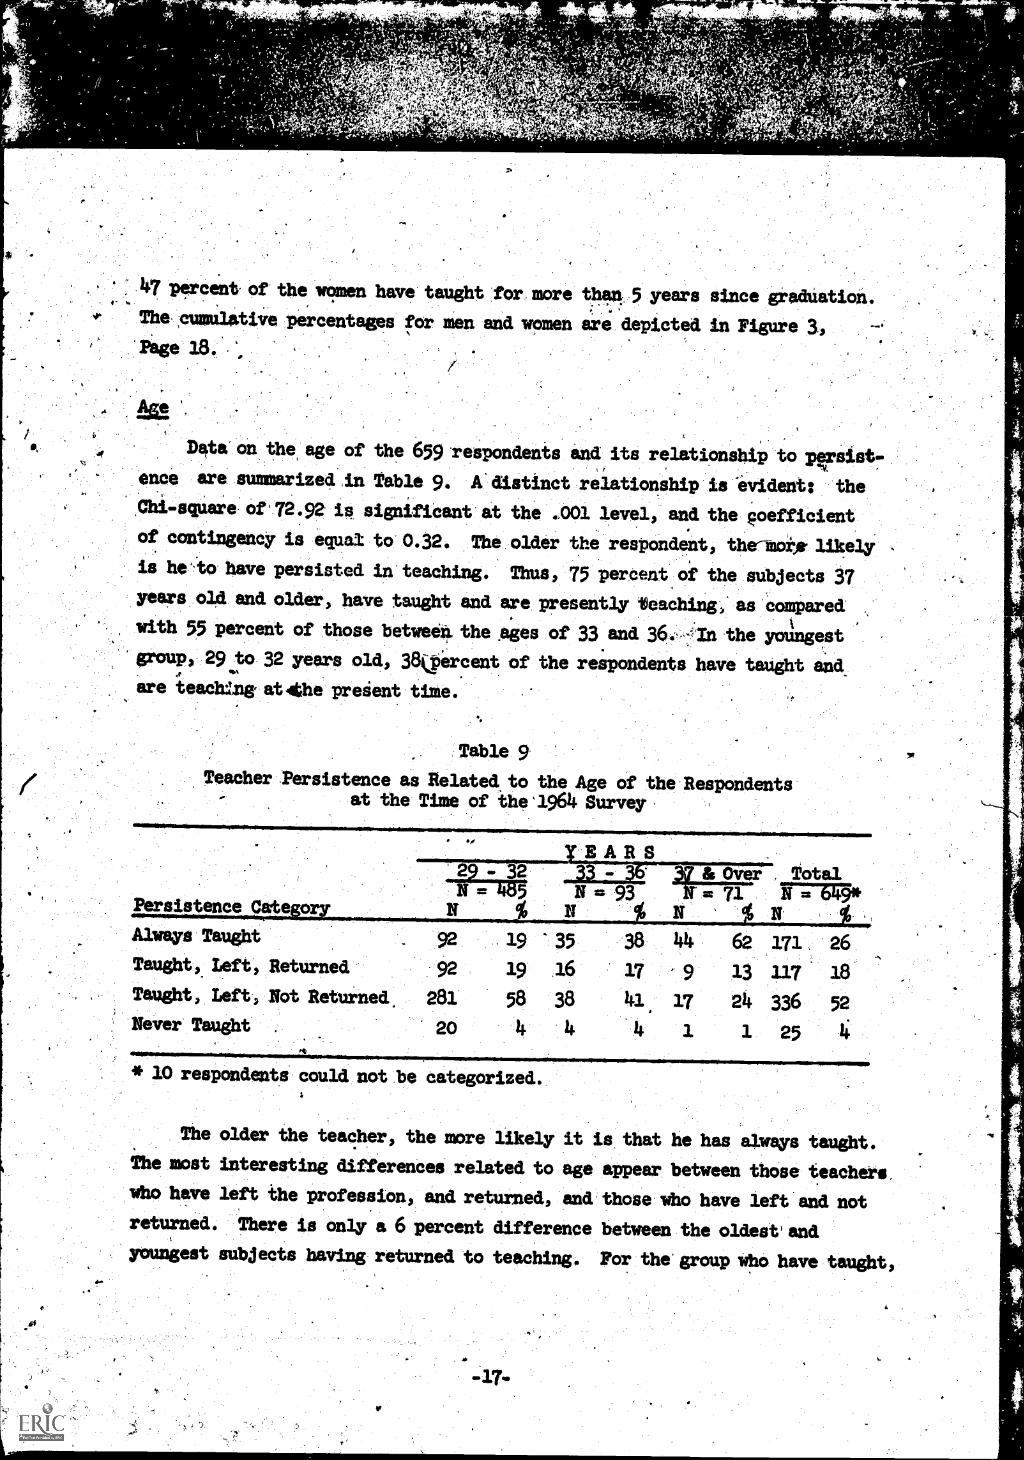
10 Percent of the women have taught for, more than. 5 years since graduation.
The cumulative percentages flor men and women are depicted in Figure 32Page 18.
Data on the age of the 659 respondents and its relationship to persist-ence are sunnarized in Table 9. A distinct relationship is evident: the
Chi-square of 72.92 is significant at the .001 level, and the poefficient
of contingency is equal to 0.32. The older the respondent, themorir likely
is he`..to have persisted in teaching. Thus, 75 percent of the subjects 37
years old end. older, have taught and are presently Veaching) as compared
with 55 percent of those between. the Ages of 33 and the yollingest
group, 29 to 32 years old, 38(percent of the respondents have taught and
are teaching at4he preient time.
Table 9
Teacher Persistence as Related to the Age of the Respondentsat the Time of the'1964 Survey,
Persistence Cate ory
Always TaughtTaught,. Left, ReturnedTaught, Left, Not Returned,
Never Taught
EARS
92
92281
20
19'3519 16
58 38
4 4
* 10 respondents could not be categorized.
& Over . Total= 71 r:-64§*
38 44 62. 173. , 26
17 9 13 117 18
41 24 336 52
4 3. 1 25
The older the teacher, the more likely it is that he has always taught.
The most interesting differences related to age appear between those teachers.
who have left the profession, and returned, and those who have left and not
returned. There is only a 6 percent difference between the oldest' and
youngest subjects having returned to teaching. For the group who have taught,
MALE5
FEMALES
FIGURE 3 4. THE NUMBER OF YEARS OF TEACHING EXPERIENCEOF THE RESPONDENTS IN TERMS OF CUMULATIVEPER CENTS OF MALES AND FEMALES.
F
left, and mein (yet) returned, there are large percentage differences for
each age group; almost 60 percent of the younger subjects have not returned
as compared with 24: percent of the oldest subjects. Some factor other than
age of respondents, but related to their age, appears to be determinant in
influencing their,return to the profession.
Marital and PamiDr Status
In the 1959 survey it, was found that the factor most closely related
to non -persistence of female' teachers was the presence of pre-school age
.children. That is, the difference between those women who persist as
teachers, and those who do not does not stem. from, marriage 'alone, nor simplyfrau the fis:Obit they have children. Rather, these women leave teaching
and remain away from teaching while their children are small and need their
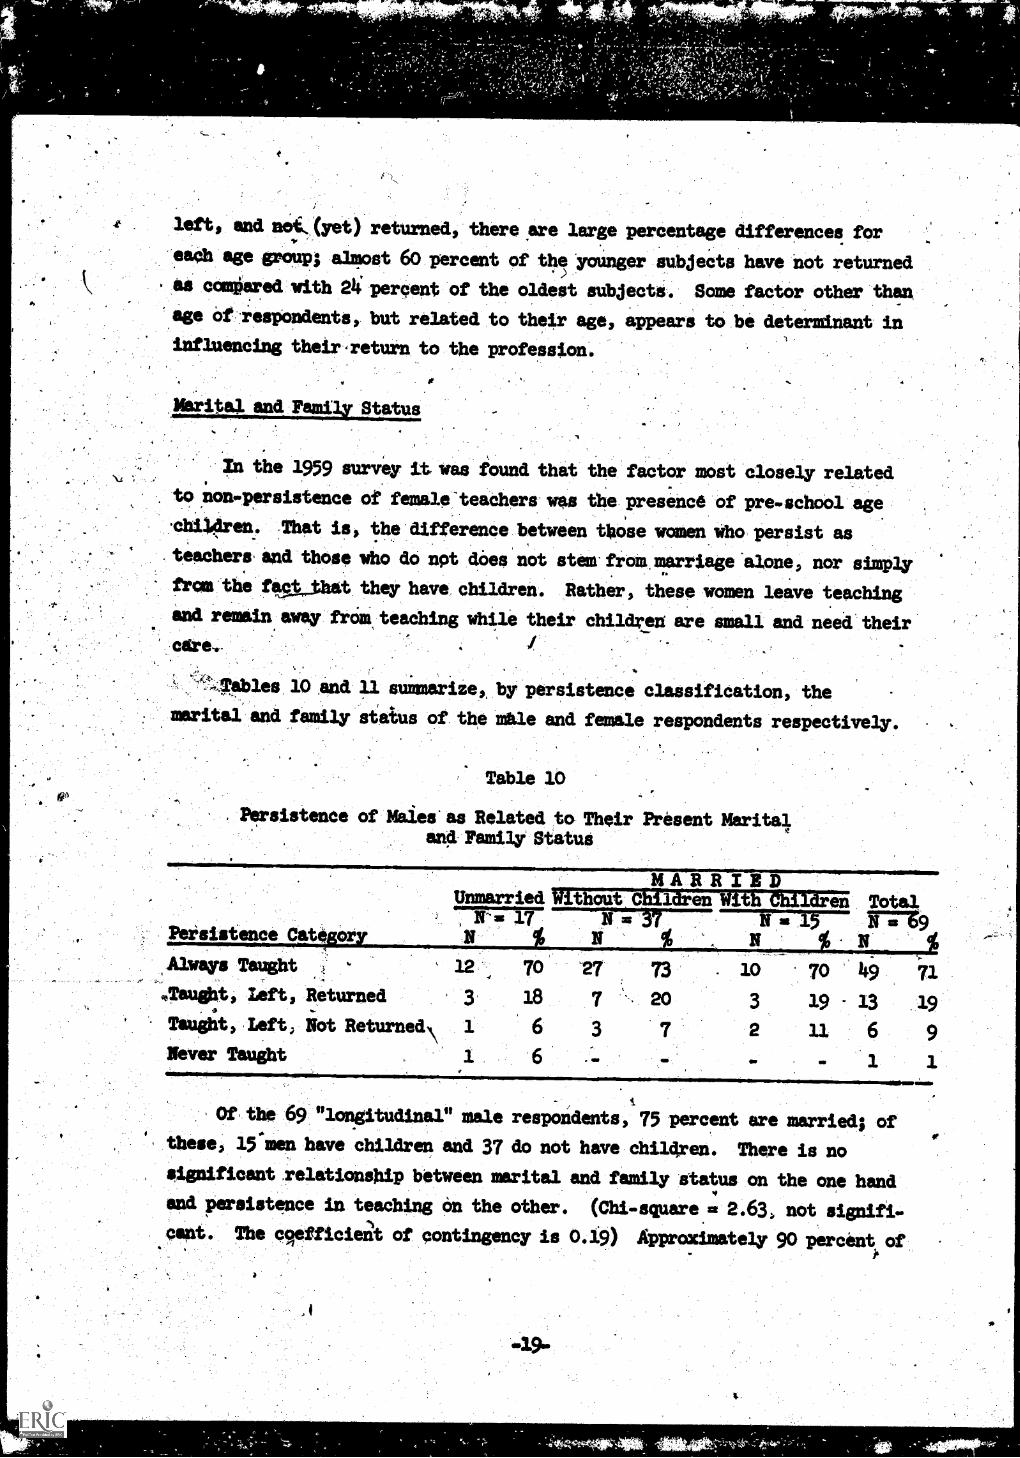
..1.ables 10 and 11 sumnarizes, by persistence classification, the
marital and family giallo of the Mille and female respondents respectively.
Table 10
Persistence of Males' as Related to Their Present Marital
Persistence Cate or
,Always Taught
Jaught, Left, Returned
Taught, Left Not Returned\
Never Taught
and Family Status
MARRIEDUnmarried wrmair eilirVINnii7nErn Totalit= 17 N 37 N = 15 rn9
70 '27 73 . 10 70 49 7118 7 20 3 19 13
1 6 3 7 2 11 61 6 1
Of the 69 "longitudinal" male respondents, 75 percent are married; of
these, 15men have children and 37 do not have children. There is nosignificant relationship between marital and family status on the one handand persistence in teaching on the other. (Chi-square = 2.63 not signifi-cant. The cqefficierit of contingency is 0.19) Approximately 90 percent of
49.
the men are Persisters, either always haying taught or having taught, lettand returned to teaching. This percentaie is slight4 greater than that
found in 1959, but the trends are similar (5). There is one contradiction
between the 1959 and 1964 findings: in the earlier survey, married men
were more often classifie4 as having "never taught" than their single counter-
parts. In the present survey, 6 percent of the =married men have never ,
taught while none of the married men fall into this category. Perhaps for
males, marriage effects a return to teac
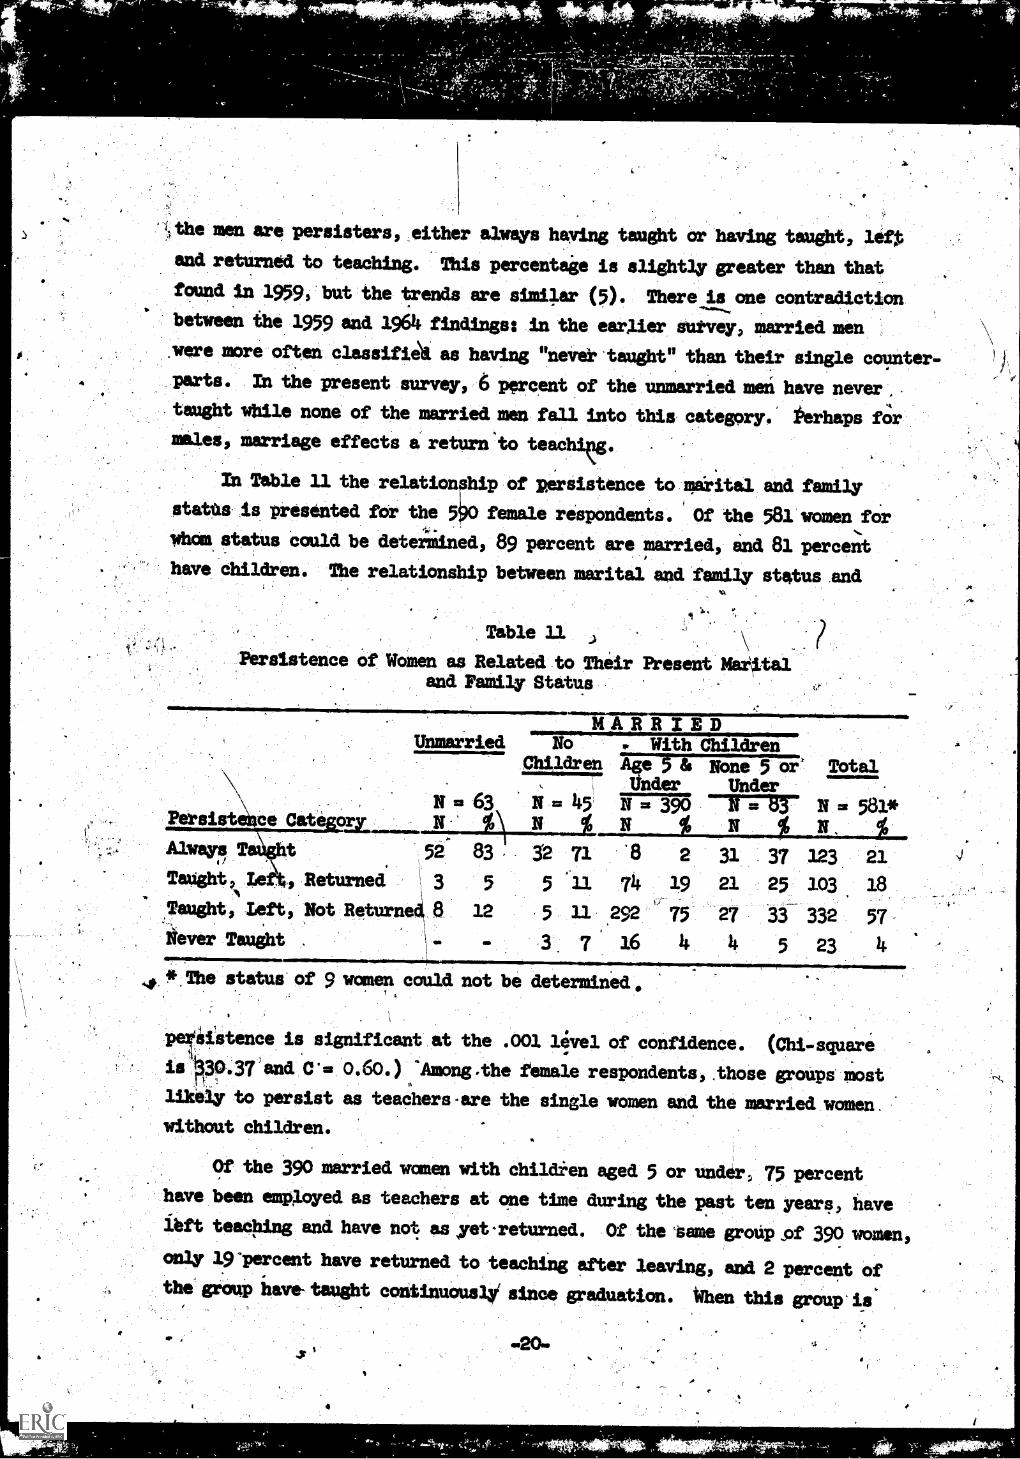
In Table 11 the relation p of persistence to marital and family
states is presented for the 5 female respondents. Of the 581 women for
*aa status could be deteiiiined., 89 percent are married, and 81 percent
have children. The relationship between marital and family status and
Table 11Pezbalttence of Women as Related to Their Present Marital
and Family Status
Unmarried
Persistence Categoy N
Always. T t 52 83
TaUght left, Returned 3 5
!aught, Left, Not Return. 8 12
Never Taught
MARRIEDNo
Children
63 ft 0 45'
N
32 71
5 '11
5 11
WithAge 5&UnderN 390N
8 2
74 19
292 75
ChildrenNone 5 or Total
UnderN =}33 N= 581*
37 123 2121 : 25 103 18
27 33 332 57-
3' 7 16 4 4 5 23
* The status of 9 women could not be determined
.;3
4stence is significant at the .001 livel of confidence. (Chi-square
s*p:37'and C'= 0.60.) ''Among.the female respondents, those groUps most
likely to perpist as teachers-are the single women and the married women.
without children.
Of the 390 married yawn with childien aged 5 or under, 75 percent
have been employed as teachers at one time during the past ten years, haveleft teaching and have not as yet-returned. Of the tame group 9f 390 women,
only 19'percent have returned to teaching after leaving, and 2 percent ofthe group have- taught continuous* since graduation. When this group* is
r711111Fir"1"7"1"711TWIris7
*4
S
T).1
:10111: -,-:rompfie;":,
caapared with the married women whose children are of school age or older,
there are substantial differences, especially in the categories "always
taught," and "taught, 'left, not returned." Women with no pre-ichool age
children are (a) much more likely to have remained in teaching (37%), and
(b) more likely to return to teaching if they, have lett (25%).
At the time of the 1959 survey, 96 percent' of the female pespondentswith children of schOol age or older' were teaching, whereas only 62 percent
of the same group are teaching at the present time. This discrepancy manybe d:ue in pert to the composition of the 1959 and.'1964 groups; the 1959
group of married women with children over schoiX age was, with few exeep.
tions, composed of older women whose children had been in school fur some
time. The 1964 group includes a majority of younger women whose children
hem only recently reached, school age. In 1959, 19 percent of the
female respondents were single as compared with 11 percent in 1964. In
1959, 22 percent of the married female subjects, had no' children; in 1964
less than 8 percent Were childless. There was an increase in the percent.
'age of women with young children, from 54 percent in 1959. to 67 percent
in 1964. It may be expected that some of the trained teachers who have
not ,yet. returned to teaching may gradually do so when or after their
children reach school age. Since this group accounts for 75 percent ofthe 390 married-with-Ai.Child respondents, they represent a crucial sourceOf future potential teachers.
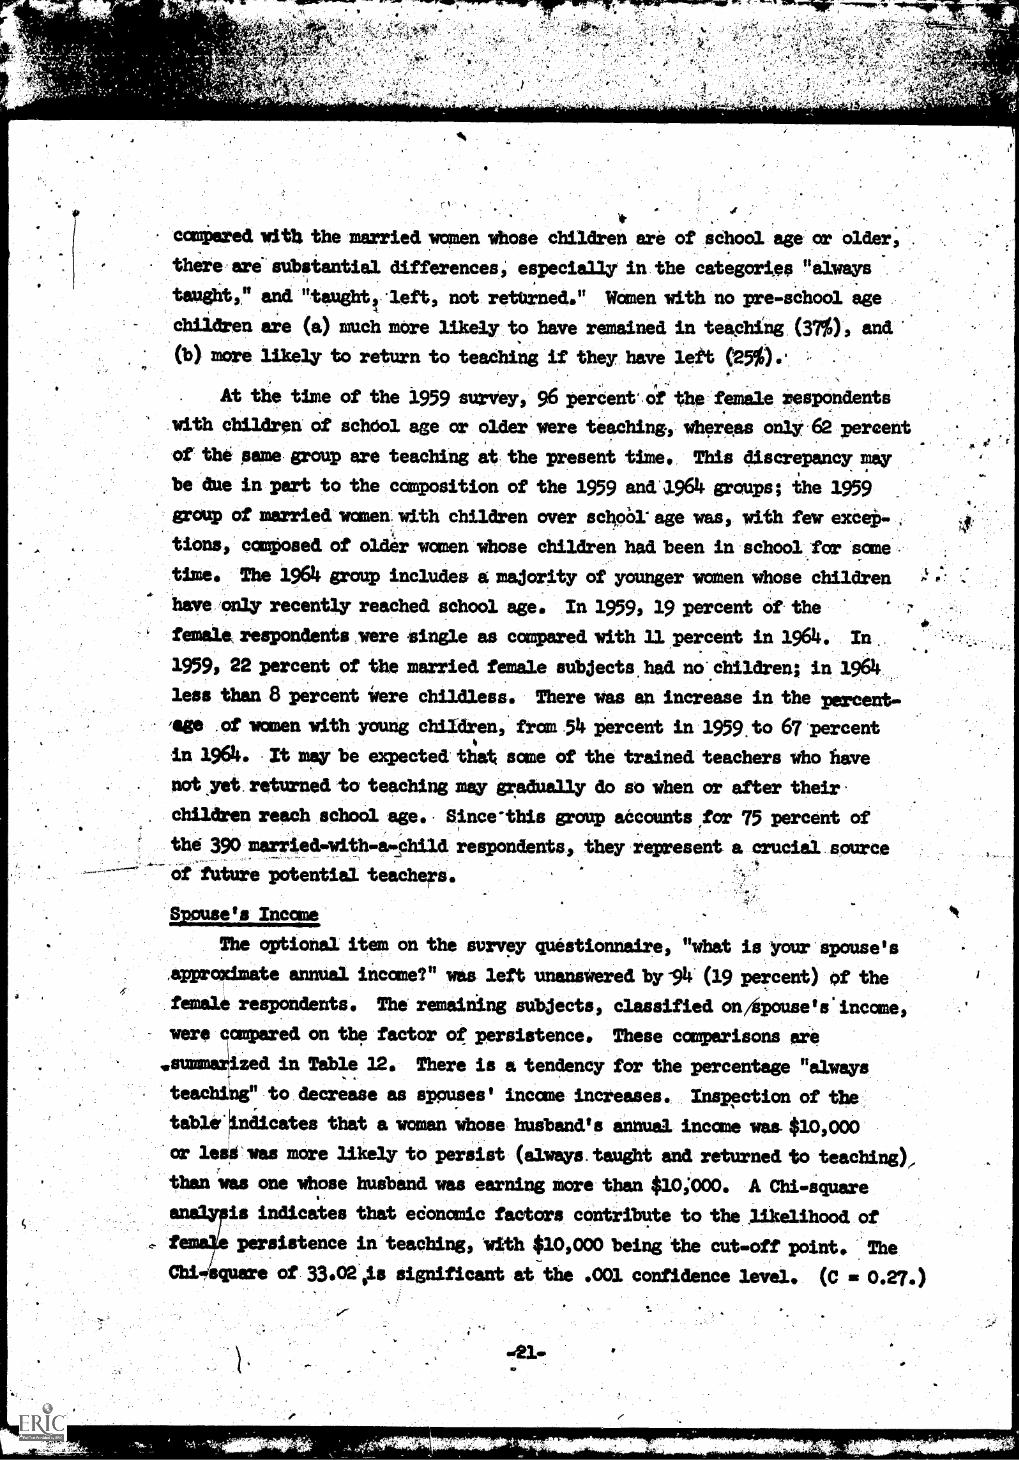
Spouse's Income
The optional item on the survey questionnaire, "what is your spouse's
,approximate annual. income?" was left unanswered by -94 (19 percent) of the
female respondents. The remaining subjects, classified onApouse's. income,were capered on the factor of persistence. These comparisons are
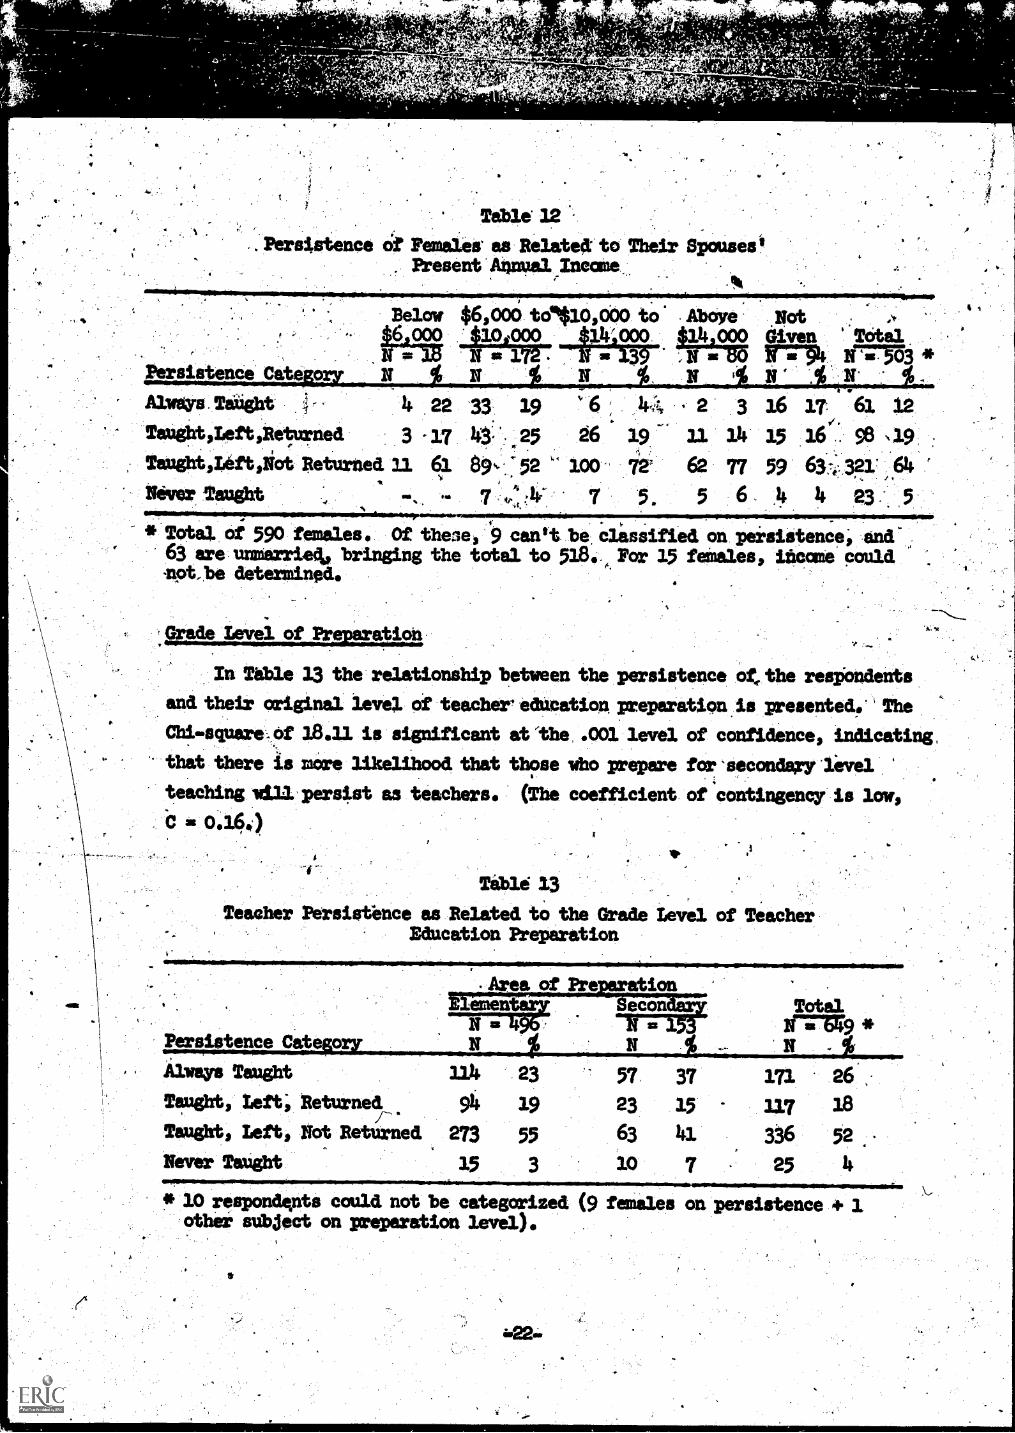
zed in Table 12. There is a tendency for the percentage "always
teaching" to decrease as spouses' income increases. Inspection of the
table'indicates that a woman whose husband's annual income was- $10,000or lesp'was more likely to persist (always. taught and returned to teaching),than itas one whose husband. was earning more than $10;000. A Chi-square
is indicates that economic factors contribute to the likelihood ofpersistence in'teaching, 'with $10,000 being the cut-off point. The
Chi square of 33.02',18 significant at the .001 confidence level. (C 0.27.)
ON.
'21-
Ake , .,7""17.11.17".9.141111,177
Te.ble 12persistence Of Pemaleir as Related to Their Spouses'
Present 'AnnualIncceae,:,
Below $6,000 toalio,Ooo to' Above Not6000 $101000 000 14 000 Given Vital
N 1 7 2 . 3 11.7311` 1(71715Z3 *Persistence Category N N N N
Always. Taiight 4 22 33. 19 6 2 3 16 17 61 12Tengbt,Left,Retyrned 3 -17 43.' .25 26 2.9 13. 14 15 16 se 19Taught,Left,Not Returned 11 61 89 52 100 72' 62 77 59 63:4.: 64
Myer Taught 7 5, 5 6 .4 4 23 5
* Total of 590 females. Of these, 9 can't be ciassified on persistence, and63 are unmarriedo bringing the total to 53.8..
FFor 15 females, Thecae could
not be determined....
In Table 13 the relationship between the persistence of the respondentsand their original level of teacher education preparation.is presented.' TheChi-square.,Of 3.8.11 is significant at 'the .001 level of confidence, indicating,that there is more likelihood that those who prepare for 'secondary levelteaching persist as teachers. (The coefficient of 'contingency is low,C ai 0.164
Wad 13Teacher Persistence as Related, to the Grade Level of Teacher
Education Preparation
Area of Pr ionmen - 'econ': Total.N If = 3.5 sr-779 *
Persistence Category N N % N - %.
Always Taught 114 23 57 37 171 26' ,'
Taught, Left; Returned_ 94 19 23 15 13.7 18Taught, Left, Not Returned 273 55 63 43. 336 52
Never Taught 15 3 10 7 25 4
* 10 respondents could not be categorized (9 females on persistence 4° 1.
other subject on preparation level).
1
,)4
a.
it
A breakdown by sex and level is not available; however, it should be
noted that of the total 659 subjects for whom longitudinal data are
only 69 respondents are male. In addition, results from the
1959 survey (5) indicated that men tend. to prepare for secondary school.,,positions 'whereas women tended to prepare for positions ton the elementary
, school level. A
Those respondents prepared for teaching at the secondary level exhibited
greater persistence in teaching than those prepared for the elementary,,school
leve3.. They are also more' likely to have always taught: However, the
subjects prepared for secondary level school teaching. are "Bore than twice
s' as likely as the elementery-prepared subjects never to have taught at
The differences noted above should be interpreted. cautiously; the data
are United, and the factor a sex not controlled.
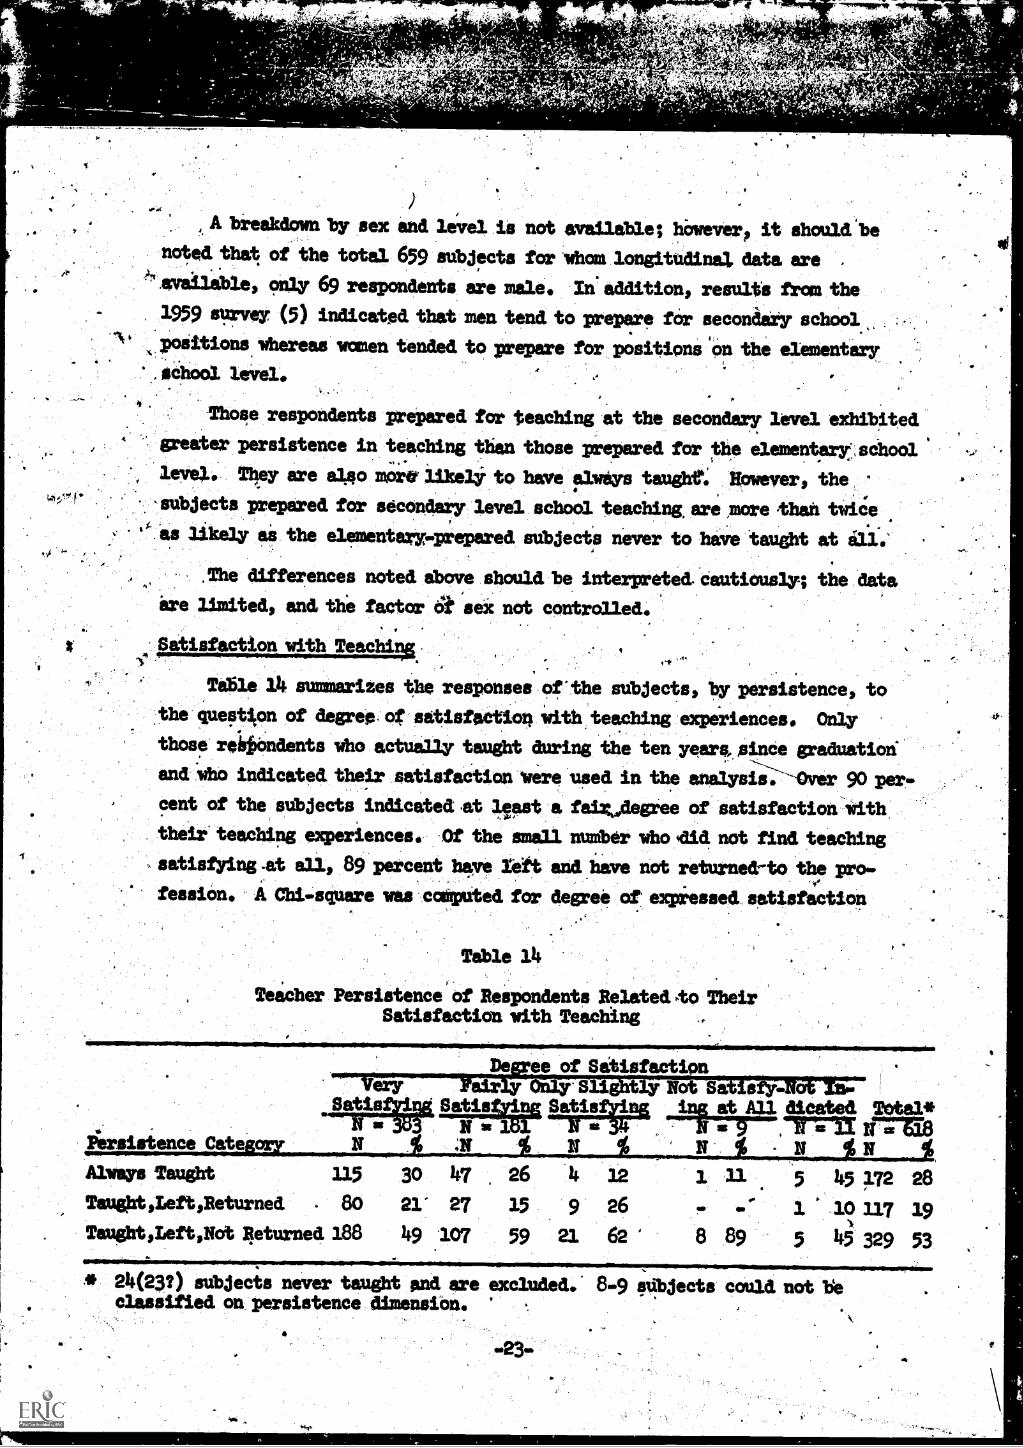
Satisfaction with Teaching.
Table 11 summarizes the responses of"the subjects, by persistence, tothe question of degree of satisfaction With teaching experiences. Only
those reiripixidents who actually taught during the ten years. since graduationand who indicated, their satisfaction were used in the analysiter 90 per
cent of the subjects indicated at least a taxi:levee of satisfaction withtheir teaching experiences. Of the small number who did not find teaching
satisfying at all, 89 percent have lett and have not returned-to the pro-fession. A Chi-scpare was computed for degree of expressed satisfaction
Table 14
Teacher Persistence of Respondents Related to TheirSatisfaction with Teaching -
Degree of Satisfaction , .
irairly OnlySlightly Not SatisfyNot I-ns.Satiafirir Satisfying Satisfying ins, at All dicated. Total*
. N at 161 NsiM N Is 9 Irani iramePersistence Cate 'N N N. NAlways Taught 115Taught ,Left ,Returned 80
Taught,Left,Not Returned 188
30 47 26
21" 27 15.49 107 59
11 12
9 .26
21 62'
1 3.3. 5 115172 28
8 .89 5 45 329 53
MP'
es-
IF 24(23?) subjects never taught and are excluded.' 8-9 subjects could not *classified on persistence dimension.
-23-
9E
7 k-i
with teaching and perAistence. The Chi-squar e of 14.28 was found to besig6ificant at the .05 level. As indicated satisfaction decreases, the
percentege leaving teaching not to return (as yet), increases. consistently,
as satisfaction decreases there is a decreasing percentage in the "always
taught" classification. Of those respondents who hitve taught, left, andreturned,.21 percent fotnd thpir experiences very satisfying, 15 percent
fairly satisfying and 26 percent found "only slight" satisfaction with
.teaching.
.FUTURE TEACHING PLUS
The final section of the results seeks to investigate the stated in.tentioni of the subjects concerning their future teaching plans, and to
identify those factors or sets of factors Which may be related to these plans.
The analysis of 'rata* teaching plans is based on the responses to the
1964 questionnalie of the total group of 840 respondents. The intentions
of a graup:Of subjects teaching at the present time are examined and can.pared with the statedplani of those subjects not currently employed' as
teachers.
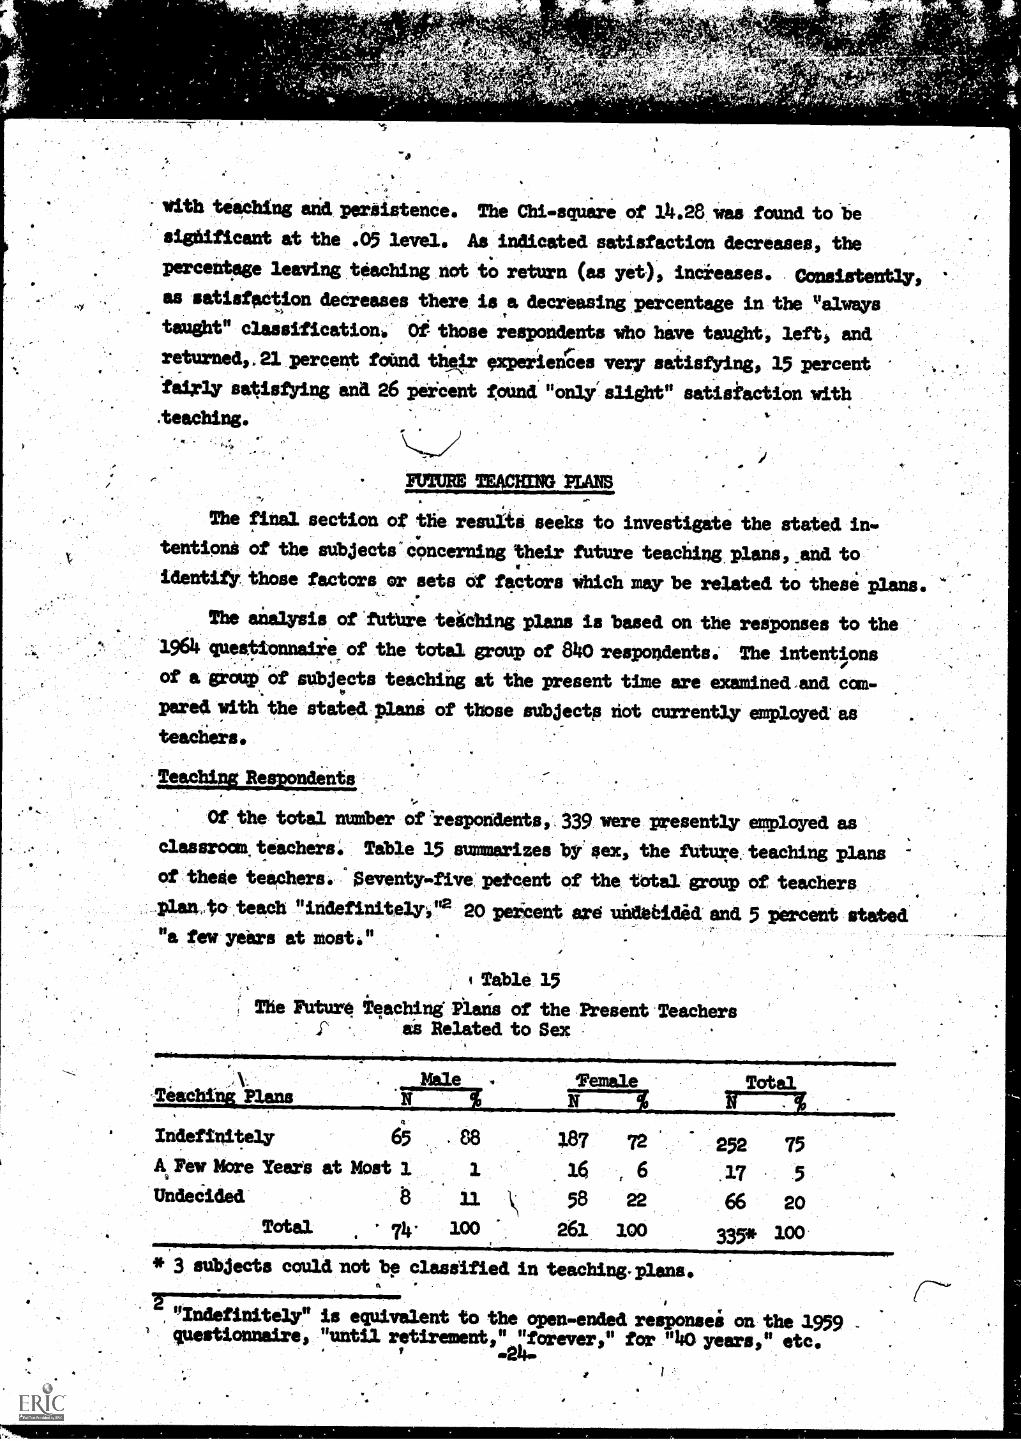
Tes.chinis Reskondents
Of the tote]. number of 'respondents, 339 were presently employed as
classroom, teachers. Table 15 summarizes by sex, the future, teaching plansof thetie teachers. Seventy-five peteent of the, tOtal group of teachers
Plan, ,teach "indefinitelr,"2 20 peicent are undebided and 5 percent stated
"a few yelars at most."
Table 15Th Future, Teaching Plans of the Present Teachers
is Related to Sex
Male 'FemaleTerichink Plans .411------3 N 3Indefinitely 65 . 88 3.87 72
_
252 75A Pew More Years at Moat 1 3. 16 6 .17 5
Undecided 8 11 \ 58 22 66 20Total , 74. 100 263. 100 335* 100
* 3 subjects could not bp classified in teaching. plans.
Total
2, "Indefinitely" is equivalent to the open-ended responses on the 1959questionnaire, "until retirement," "forever," for 140 years," etc.
-7-ipriprre4o*R.,- ir""WIF"-^ FwEr,,,,,wwifir.,w4werT wows .141.61,40.4P-wg- 111 - -.0,111.
At the time of the 1959 survey,. 45 percent of the teaching respond-cuts .plinned to teach indefinitely. During the five-year interval.betweenfollcni-iips, there was a 30 percent gain in. this category. Examination ofthe data by sex provides some explanation. Eighty-eight percent of themales and 72 perCent of the female respondents in 1964 indicated that theyplan to teach indefinitely.' In 1959, fewer than 40 percent of the womenplanned to continue teaching untikzetiriament (approximately 80. percentof the rlieri intended to continue teaching). It is likely that the gain of30 percent may be attributed to the chanie in the plans of females. Inaddition, in the previous survey, 20.percent of the women were classifiedas "undecided" as compared with 6 percent in 1964. This the passage oftime and/or factors unrelated directly to the profession may bebypothesize4 as influencing their plans:
The relationship` between future teacbing.plans and factors such asmarital and family status, spoimie's income; number of graduate creditsearned,. present teaching salary and 'preparation level, was examined.Since no", of these factors exhibited a significant relationship withfUture teaching plans, they wilt =ft be presented in detail.
However, in 1959 it was f6und that marital and family status and age,
sere highly related to the future teaching plans of females. Fifty -two'percent of the unmarried women, and 62 percent of the married women withpildren over school age pliuull...to-terh indefinitely, as compared with
'-ttewav than 20 percent of married women with no children. In addition,the older the female, subjea, the more likely she was to state that she
planned to teach indefiiiitely.'4 Perhaps. it would be desirable to reexamine
the current data, controlling: for sex, age, and marital status.
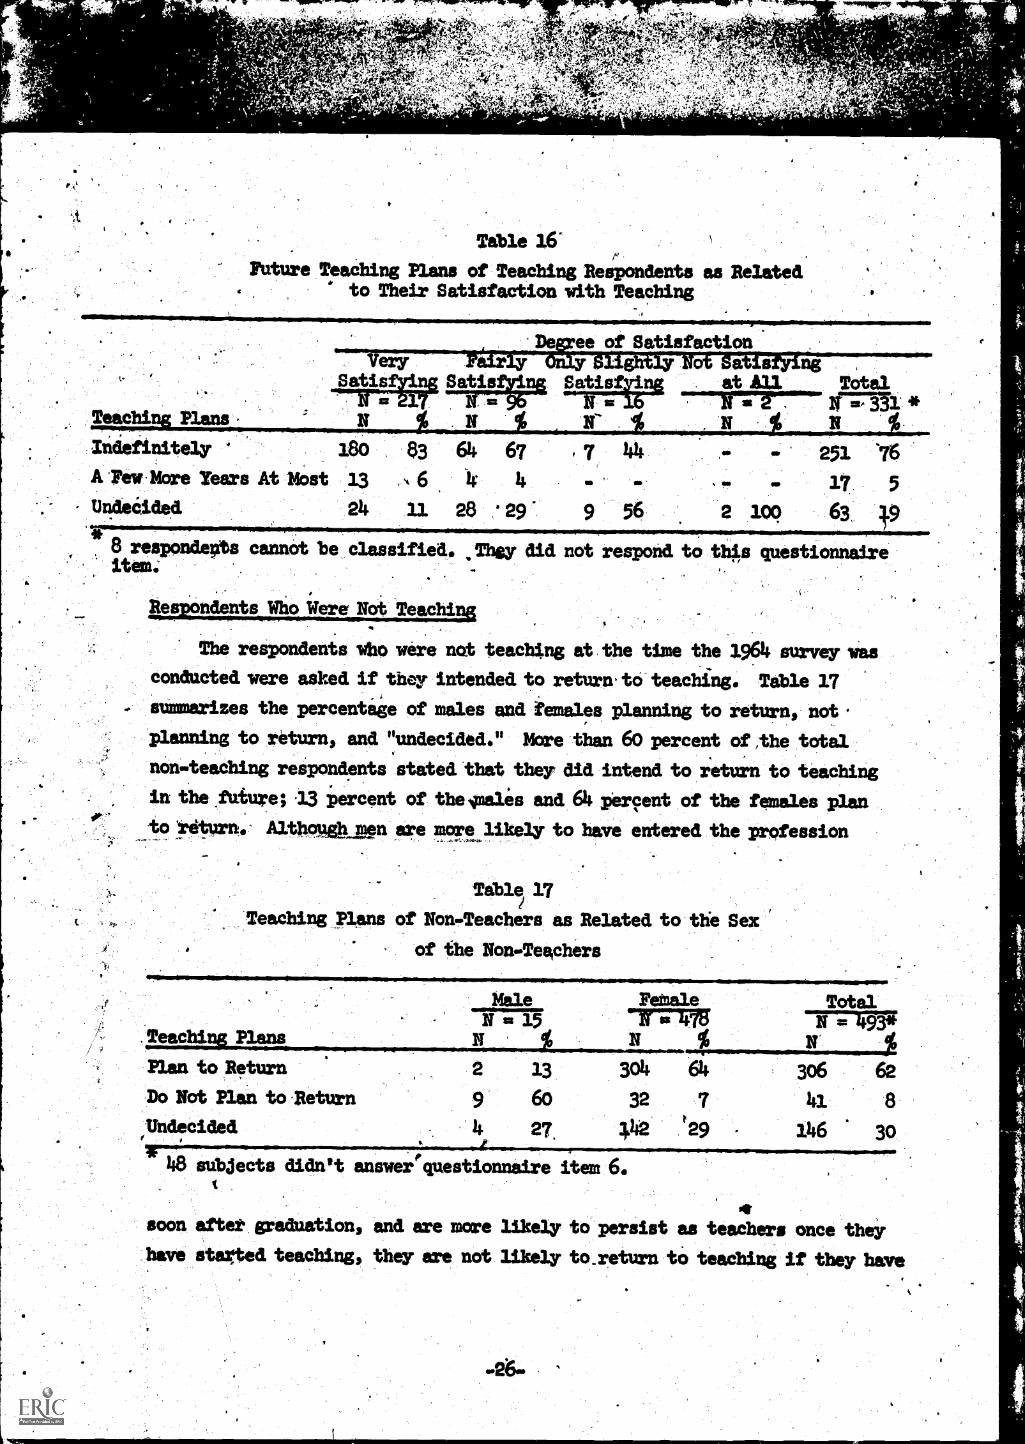
Table 16 shows the expreised degree of satisfaction with teaching
compared with future teaching plans. In general, the teachers who have
been better satisfied with teaching are more likely to plan to teach
indefinitely.
-25-
W W '1111111W -
1, .7.,,q ,,,43k),_, .J .,t
,,,,.., $::.. -, re ..Yf ',1Cat'7`.._;a-
, 44.7 ."'`triL .
-
wrirrownr-womp wr,
;0'.6 A
".
Table 16"
Future Teaching Plans of Teaching Respondents as Relatedto Their Satisfaction with Teaching
ee of SatisfactionVery a 13 ng
$atisf.ying Satf stying Satisfying at All TotalIi 331. *
N Nindefinitely 4 180 83 64 67 7 latA Pew More Tears At Most 13 s. 6 4
Undecided 24 11. 28 29 9 56 2 100 63 1.9
8 respondents cannot be classified. They did not respond to this questionnaixe-item:
Ter
- 253. 76
- 17 5
Respondents Who Were Not Teaching
The respondents 14ro were not teaching at the time the 3.964 survey wasconducted were asked if they intended to return to teaching. Table 17summarizes the percentage of males and females planning to return, notplanning to return, and "undecided." More than 60 percent of the total
non-teaching respondents stated that they did intend to return to teaching
in the future; '13 percent of the Imales and 64 per9ent of the females planto `return.' Although.mn are morelikel,y to have entered the profession
.111111111
-Table 17
Teaching Plans of Non-Teachers as Related to the Sexof the Non-Teachers
Male Feinale TotalN 15 g 476 N 193*
Teaclai % N'
Plan to Return 2 13 304 64 306 62no Not Plan to .Return 9 60 32 7 41 8
Undecided ii. 27. 1.42 '29 146 30
48 subjects didn't answer questionnaire item 6.
4soon aftet graduation, and are more likely to persist as teachers once theyhave start, ed teaching, they are not likely to_return to teaching if they have
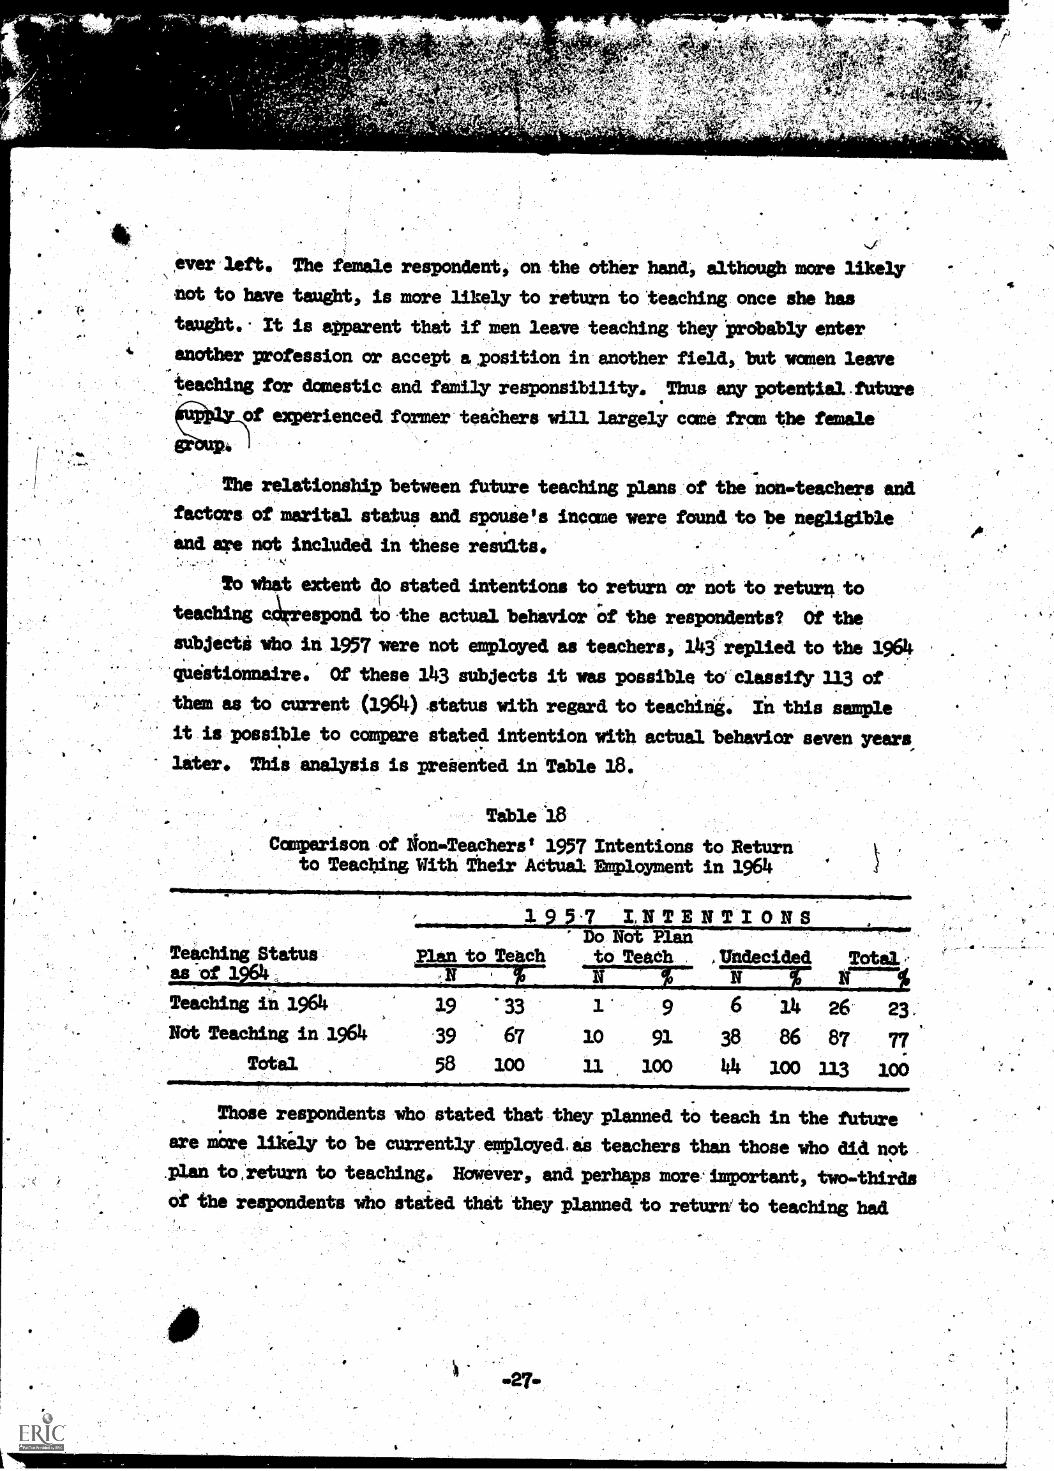
ever left. The female respondent, on the other hand, although more likely
not to have taught, is more likely to return to 'teaching once she hastaught. It is apparent that if men leave teaching they probably enteranother profession or accept a position in another field, but women leaveteaching for domestic and family responsibility. Thus any potential .future
of experienced former teachers will largely cane i'ram the female
The relationship between future teaching plans of the non teachers andfactors of marital status and spouee's income were found to be negligible
and are not included in these results.
To what extent do stated intentions to return or not to return to
teaching drespond to the actual behavior of the respondents? Of the
subjecti who in 1957 were not employed as teachers, lid replied to the 1964quistiOnnaire. Of these 143 subjects it was possible to' classify 113 ofthem as to current (1964) status with regard to teaching. In this sample
it is possible to compare stated intention with actual behavior seven years,later. This analysis is preaented in Table 18.
Table 18 .
Comparison of Non...Teachers' 1957 Intentions to Returnto Teaching With Their Actual: Employment in 1964
ONIIIIINNIMMIIIIIMostWar~ait.4NsoNiNSWININfemames
Do Not PlanTeaching Status Plan to Teach to Teachas "-of 1
Teaching in .1964. 19 *33 1. 9Not Teaching in 1964 .39 67 10 91
58 100 3.1 100
NTIONSUndecided Total,.
6 14 26 23,
86 87 77
44 100 113 100Total
38
Those respondents who stated that they planned to teach in the future
are more likely to be currently employed. as teachers than those who did not.plan to ,return to teaching, However, and perhaps more. important, two-thirdsof the respondents who stated that they planned to return to teaching had
not .yet done so seven years -latetii This percentage, is more encOuraging.:
when.compatiSons are my* with tig 91. percent nOtplanning to and not,returning to teaching, and. with the 86 percent oriii.nally mundebidee Who
are not teaching in 1964
"It would seem that the seven-year interval was an adequate measuringperiod, If most of the respondents were raising -children-of_pieeschool age.,More data about the Composition of this particular sample is needed.beforedefinitive ccinclUsions can be drawn. It is reasonable to conclude thattfie.percentalze already, Itiving returned represents a minimum estimate withmore females returning as time increases. This percentage of returnees
may offsetthe percentage of females leaving "teaching" for "ham:making"
at this time, and it is probable that it will increase. in the future:
741.""11,111,11"""r 1771771706*.111V177 - VVIP.i,TAW
tj
r.
CHAPTER, IV
DISCUSSION Aid CTCLUSION
This 1964- survey, the fourth follow-up study, was designed to examine
the- careers of the 1953-54' student teachers of the municipal colleges, and
to inirestigate the relationship of several factors to persistence in
teaching. The puipose of the investigation was to provide some, basic fits
concerning teacher persistence which might be useful in plans to meet the
growing demand for teachers.
In interpreting the findings it is important to take note of sane of
the limitations of the survey. The current study was based on data
collected on one class of student teachers graduated free the fair. New York
City municipal colleges. Although there is no reason to believe that these
graduates differ significantly frcxn municipal' college graduates of other
years, we must acknoiledge the possibility that factors of which we are
unaware may have been operative. The degree to which the results may be
generalized 'to graduates from other colleges and universities is uncertain.
IdeOlfying non-respondents is' a source of concern in all survey
studies; although sane' of the evidence 'indicated that there was no difference
between respondents and non-respondents on certain'selected factors, thepossibility, exists that the groups differ on other factors andtlitit thefindings might be significantly altered if replies to the questionnairewere received trail the entire population.
The results of all the four, surveys are similar. The overwhelming
majority of sttident teachers are females who are prepared for teaching atthe elementary school level as compared with the small number of males,
who tend to prepare for secondary. school teaching. Males are more liekelito be persistent teachers, provided they enter the profession soon after
graduationfb It ids quite clear that virtually all those leaving teachingare women, and that they leave because of marital and maternal obligations.
.29-
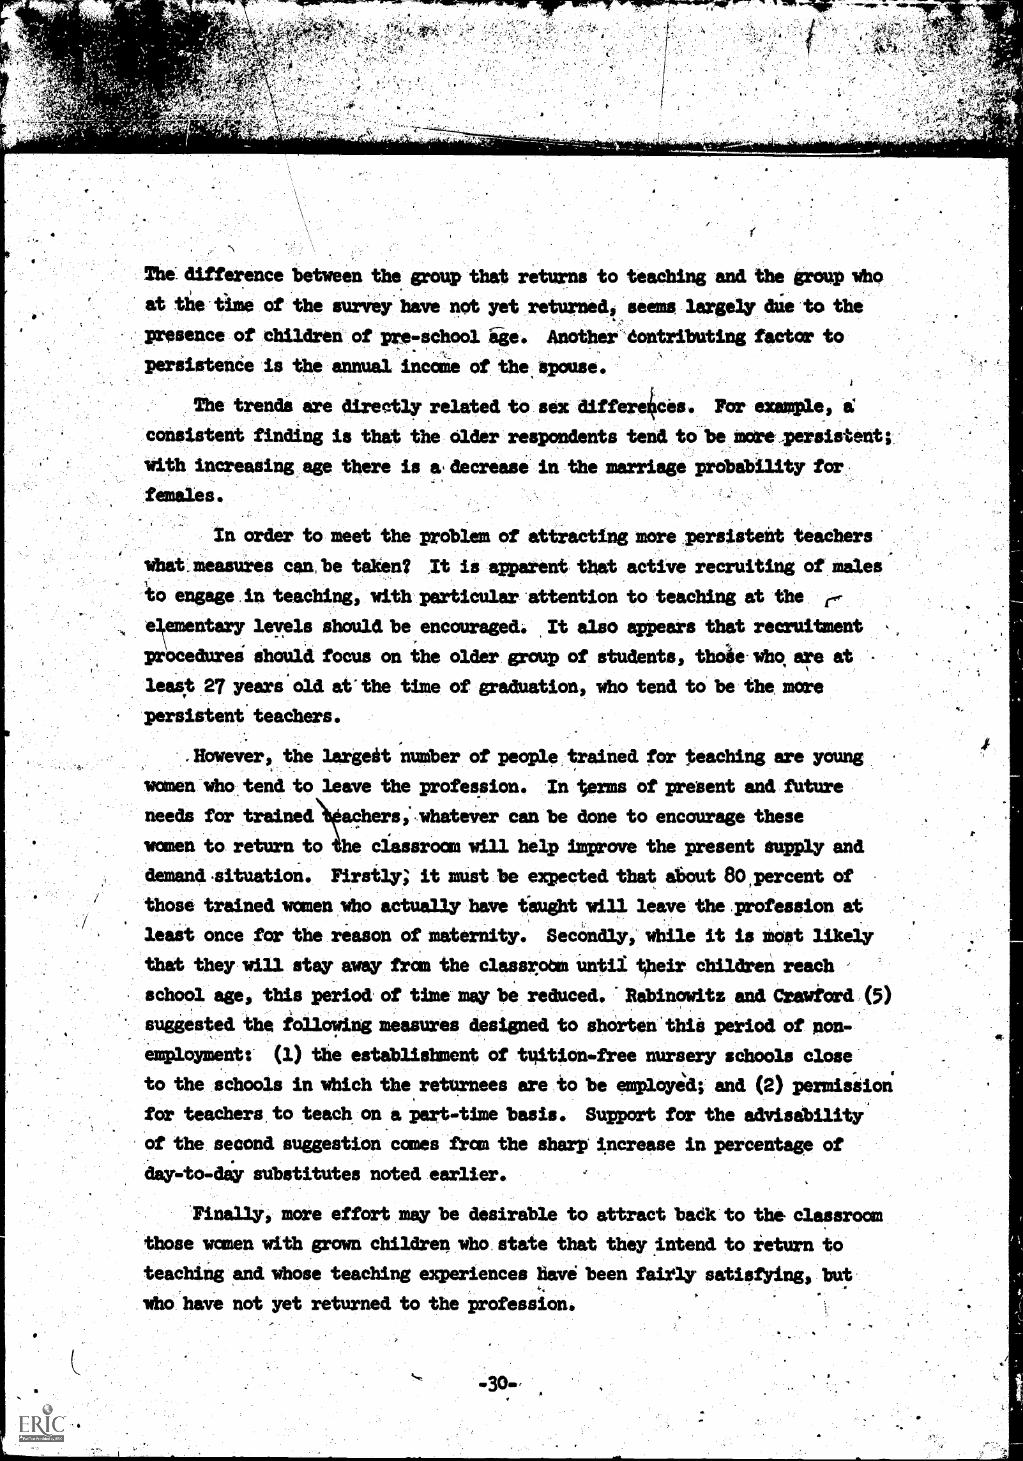
The difference between the group that returns to teaching and the group whoat tie'time of the survey have not yet returned, seems largely due to thepresence of children of pre- school See. Another'dontributing factor to
persistenCe is the annual incase of the, Spouse.
The trends are directly related to sex differe4ces. For example, eq,
consistent finding is that the older respondents tend to be more: ersistent;
with increasing age there is a. decrease in the marriage probability for
females,
In order to meet the problem of attracting more persistent teachers
what.measures can be taken? It is apparent that active recruiting of males
to engage in teaching, with particular 'attention to teaching at the re-
"mentary leyels should be encouraged. ,It also appears that recruitment
prOcedurei should focus on ihe older group of students, those- who, are at
least 27 years' old at"the time of graduation, who tend to be the, more
persistent teachers.
.However, the largeit number of people trained for teaching are young
women who tend to leave the profession. In farms of present and future
needs for trained adhers;.whatever can be done to encourage theseklt
warren to return to he classroom will help improve the present supply and
demand .situation. Firstly; it must be expected that about 80,percent of
those trained women who actually have taught will leave the profession at
least once for the reason of maternity. Secandly, while it is toot likely
that they will stay away fran the classrota until their children reach
school age, this period of time may be reduced. Rabinowitz and Cmwford (5)
suggested the following measures designed to shorten'thiii period of non-employment: (1) the establishment of tuition-free nursery schools close
to the schools in which the returnees are to be employed; and (2) permiision
for teachers, to teach on a part-time basis. Support for the advisability
of the second suggestion comes fran the sharp increase in percentage of
day-to-day substitutes noted earlier.
Finally, more effort, may be desirable to attract badk to the classroom
those women with grown children who state that they intend to return to
teaching and whose teaching experiences have been fairly satisfying, but
who have not yet returned to the profession.
-30-,
--"77:71rWT -ar
17,
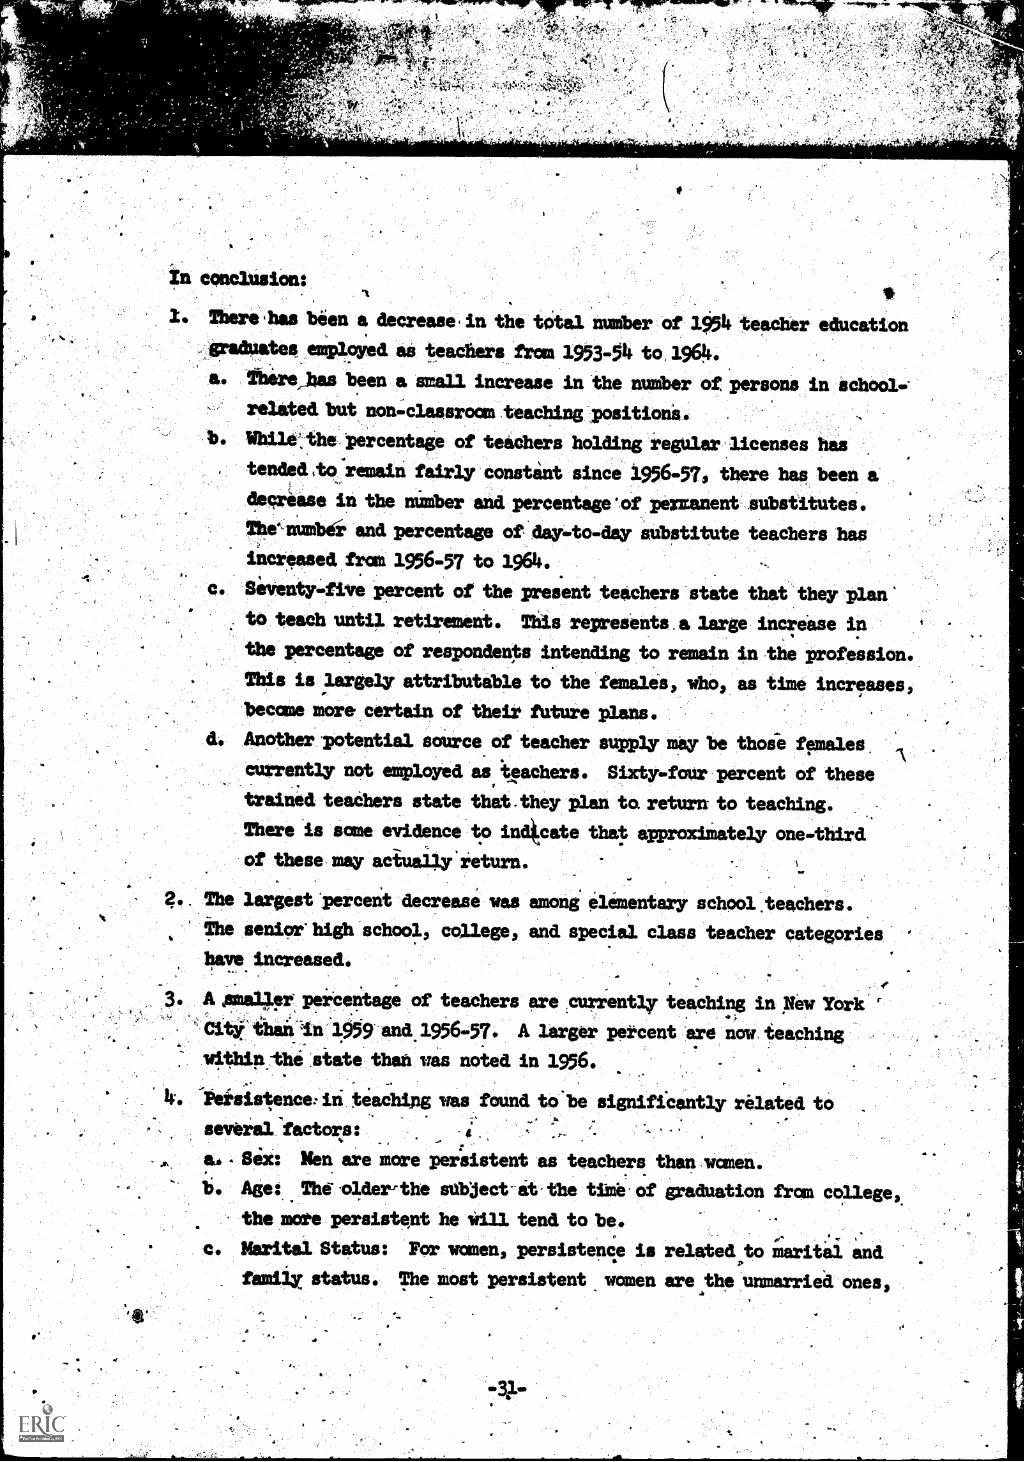
In conclusion:
Y. There has been a decrease, in the total number of 1054 teacher education
mates employed as teacliers frce 195344 to,1964.Thece,has been a small increase in the number of persons in school=related but non-classroom .teaching
b. 'While;the Percentage of teachers holding regUlar licenses hastended sto.remain fairly constant since 1956-57, there has been a
decrease in the number and percentage'of pezzanent substitutes.
The`-nimib6 and percentage of day-to-day Substitute teachers has
increased troll 1956-57 to 1964
Seventy-five percent of the present teachers state that they plan'
to teach until. retirement. This represents.a large increase in
the percentage of respondents intending to remain in the profession.This is largely attributable to the females who, as time increases,
becalm more certain of their fu.ture plans.
d. Another potential source of teacher supply may be those females.
currently not employed as*teachers. Sixty-four percent of these
trained teachers state that.they plan to return to teaching.
There 'is some evidence to in4cate that approxiiately one-third.
of these may acivally-return.
The largest 'percent decrease was among elementary school.teachers.*he seniaehigh school, college, and special class teacher categories
have increased.
A mailer, percentage of teachers are .currently teaching in New York'
City thanln'1959 and..196-57. A larger percent are now teaching
within the .state than was noted in 1956.
Persistence: in teachipg was found to significantly related to
several factors:
a. Sex: Men are more peisistent as teachers than wanen.
b. Age: The .old,er- the subject-at-the time. of graduation from college,.
the more persistent he Will tend to be.
Marital Status: For women, persistence is related,.to marital and
family status. The most persistent women are the unmarried ones,
tollord'hy the married* ones without children. Marriage.= family
responsibilities are not factors in the persistent teaching history
of male subjects.d. Income: The income of the spouse is importitnt in persistence.
!omen 4thosie husbands earn more than $10,000 are not likely topersisi in teaching. There is a tendency for women whosehinbandi earn- less than $10,000 to remain teaching.
&e.' Level of Preparation:, There is ktendency- for persons trained toteach at the secondary level to persist- in the profession, butthis is intertwined with the sex variable.Degree of Satisfaction with Teaching: There is a tendency forpersoili more satisfied with their teaching experiences to persistin teach14.
,^mnrri-14-9041relt V`WW.51r*OPOW 3 sew
..
Division of Teacher.Eftcation, The City, University of New-York.
iet Status Wh o C et e 6t6t e A:taovedftsw...Teacher' Education Program during 19614. 'PouSeenth Annual.,Survey, january 1965.
4iationel Education Association, Research Division. Teacher Supply and
Demand in Public Sclit54.1.0A3,. Research Report 190-R4, May 1963.
ItNational.!ducation AssOciation9 Research Division. Teacher Supply and
Demand in Public Schools, 1964. Research Repo 196449, April 1964.
Rabinowitz, W. and Williams, Ida P. The Teaching Creers of the. ,
"l953-1954 Class of Student-Teachers of the Municipal Colleges of
The City of New York: Research Series'' No. 352 DiVision ofTeacher Education, The College of the City of New York, January ?.9513.
Rabinowitz, Will.l.amead Orawfoisd, ifeby E. Teacher Education Graduatesof 1954*..- Their Careers Durinf the First Five Years. Division,.of Teacher Education,
,Board of Higher Education of the City' of
New York, August 1960 r