Embed Size (px)
Citation preview
2_Title Slide
Retail, Food Service, and Grocery
Sector Meet-UpMarta Schantz, Waypoint Building Group
Kyle Wilkes, JCPenney
Darrel Carter, Sprint
Moderators: Holly Carr, DOE, Zach Abrams, ICF, Cara Bastoni, ICF

Agenda
10:05 Welcome & Program Updates
10:15 Sector Updates and New Resources
10:20 Meet Your Colleagues in the Room
10:35 Roundtable Discussion
10:50 RTU Retrofits and Replacements Overview of Business Case Considerations for
Proactive RTU Replacement – Marta Schantz
JCPenney Case Study – Kyle Wilkes
Sprint Case Study – Darrel Carter
11:20 Conference/General Q&A
11:30 Adjourn
2
Starbucks1730 Pennsylvania Ave NW
Sector Tour
Tour Today!
3
For those that have registered, meet in the Lobby at 3:15

Conference Sessions of Interest for
Retail, Food Service, and Grocery
Wednesday Maximizing Supermarket Refrigeration System Energy Efficiency, 1:30 to 3pm
Reducing Energy Consumption in Restaurants and Kitchens, 1:30 to 3pm
The Value Proposition for Data Center Optimization, 3:30 -5pm
Retrofits: Making the Most of What You Have, 3:30 -5pm
Thursday Integrating Solar PV: Strategies and Case Studies, 10-11:30pm
Finding and Funding an Energy Management Information System That Is Right for Your Building Portfolio – 1:30 -3pm
High-Performance Troffer Lighting Solutions
FREE MONEY!: Working with Utilities to Make Your Energy Reduction Dreams Come True 3:30 -5pm
How to Drive Change with Workplace Charging 3:30 -5pm
Friday High-Impact Technologies Forum: Harnessing American Ingenuity and Innovation
1:30-3pm
4

Program Updates
5

About Better Buildings
Better Buildings: A broad, multi-strategy initiative aiming to improve the energy use of our nation’s
commercial, industrial, residential, and public buildings by 20% over 10 years
Better Buildings Challenge: A leadership initiative calling on CEOs, university presidents, building owners,
state and local government leaders, and residential housing developers to publically pledge to reduce entire
portfolio’s energy use
Better Buildings Alliance: Members address energy efficiency needs in their buildings by setting savings
goals, developing innovative resources, and adopting cost-effective technologies and market practices.
6
Better Buildings Alliance Snapshot, 2014
Membership
Number of Member Organizations 185
Square Feet Represented 10 billion
Percent of U.S. Commercial
Buildings11%
New Members in 2014 14
Activities
Energy Savings Activities Available
to Members50+
Results
Increase in Member Activity in 2014 More than 20%
Average Annual Energy
Savings ReportedMore than 2%
Better Buildings Challenge Snapshot, 2014
Membership
Number of Partners and Allies 250+
Square Feet Represented 3.5 billion
New Members in 2014 60
Solutions
Partner Solutions Available for
Replication160+
Results
Energy Saved (Btus) 94 trillion
Dollars Saved $840 million
Avoided C02e emissions (tons) 5.8 million
Funding Committed/Placed$5.5 billion /
$3 billion

New Better Buildings Partners
CKE Restaurants and Arby’s Restaurant Group
are the first food service organizations to join the
Better Buildings Challenge
Suncoast Credit Union joins the Better Buildings
Challenge
7

Water Savings Expansion
Last year, DOE launched a Water
Savings Pilot with 23 BBC Partners
Partners reported water savings
between 10% and 20%, against their
baseline years
In 2014, total water savings are equal
to about 570 Olympic-sized pools
Partners are sharing solutions!
Best practice guides for water efficiency
Strengthening the business case for
water saving projects
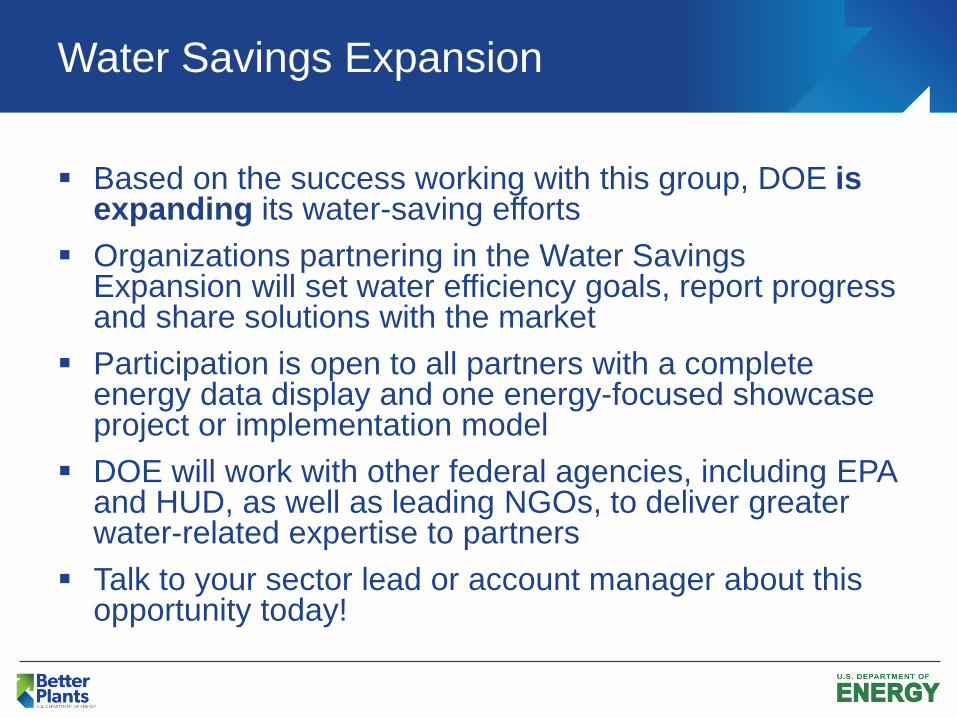
Water Savings Expansion
Based on the success working with this group, DOE is expanding its water-saving efforts
Organizations partnering in the Water Savings Expansion will set water efficiency goals, report progress and share solutions with the market
Participation is open to all partners with a complete energy data display and one energy-focused showcase project or implementation model
DOE will work with other federal agencies, including EPA and HUD, as well as leading NGOs, to deliver greater water-related expertise to partners
Talk to your sector lead or account manager about this opportunity today!

Interior Lighting Campaign (ILC) High Efficiency Troffer Lighting with Controls
10
Official launch - 2015 Better Buildings Summit
Recognition and awards initiative similar to LEEP Campaign
Goal to replace 100,000 standard troffers with high efficiency troffers by May 2016 Represents about 6.7 million kWh savings
Resources to include a specification for 2x2, 2x4, and 1x4 troffers, utility incentives database, product lists, technical reports, case studies, free technical assistance.
Join early! Better Buildings members may join before the launch, and be
recognized at the BB Summit as early adopters.
PNNL can help you identify appropriate sites, and the best product options to meet your unique needs.
Contact Linda Sandahl at [email protected].

Share the EE with the
Better Plants Supply Chain Pilot
DOE is working with a select group of existing partners to extend the benefits of energy efficiency to their suppliers.
Through this pilot initiative, DOE will partner with participating suppliers to: Join Better Plants
Set energy saving goals
Develop energy management plans
Track and report progress
Referring Partners receive recognition and an annual report of supplier energy savings.
Summit Session: “Driving Energy Savings in the Supply Chain,” Thursday, 10-11:30, Roosevelt 5

Benefits to Suppliers
National recognition for leadership
Access to DOE resources and expert assistance
Priority access to free energy audits from DOE’s
Industrial Assessment Centers (IACs)
Opportunity to network and learn from peers
These benefits are all designed to help your
suppliers save energy and reduce costs

Sector Updates and New Resources
13

The Retail, Food Service, and Grocery
Sector of the Better Buildings Alliance
45 members 2.7 billion sq. ft.
18% of the sector’s 14.6 billion
square feet in the U.S.
Top 3 Technology Teams:
Food Service
Lighting & Electrical
Space Conditioning
Key Links
Sector Webpage
Sector Opportunities document
14
Retail, Food Service, and Grocery Members
as a Percent of Market Floorspace

Steering Committee Members
Kyle Wilkes, JCPenney
(Chair)
Mike Ellinger, Whole Foods
Market
Bert Etheredge, American
Society of Heating,
Refrigerating, and Air
Conditioning Engineers
(ASHRAE)
Pat Hagan, Wawa
David Harpring, Yum! Brands
Erin Hiatt, Retail Industry
Leaders Association (RILA)
David Oshinski, The Home
Depot, Inc.
James P. McClendon,
Walmart Stores, Inc.
Bob Valair, Staples
15

New Resources & Activities
Technology Solutions Updates
Advanced Power Strip Specification
50% Advanced Energy Design Guide for Grocery
Market Solutions Updates
2015 Green Lease Leaders announced today
Latest Implementation Models
Whole Foods Market: Customized Utility Incentives
Sprint: Corporate Goal is a Catalyst for Custom Efficiency Strategies
Annual Progress Update Reports
Better Buildings Alliance
Better Buildings Challenge
Check the Summit webpage in June for all session presentations!
16

Meet Your Colleagues in the Room &
Roundtable Discussion
17

Introductions
Please answer one or both of the following questions:
What’s the most exciting energy efficiency
project you’re working on, or will be soon?
What’s your biggest energy efficiency
barrier/challenge?
18

Roundtable Discussion
What project did you just hear about that
makes you want to learn more?
What barrier did you hear about that you
have faced yourself?
What should Better Buildings be focused
on in the next year?
19

Marta Schantz, Waypoint Building Group
20
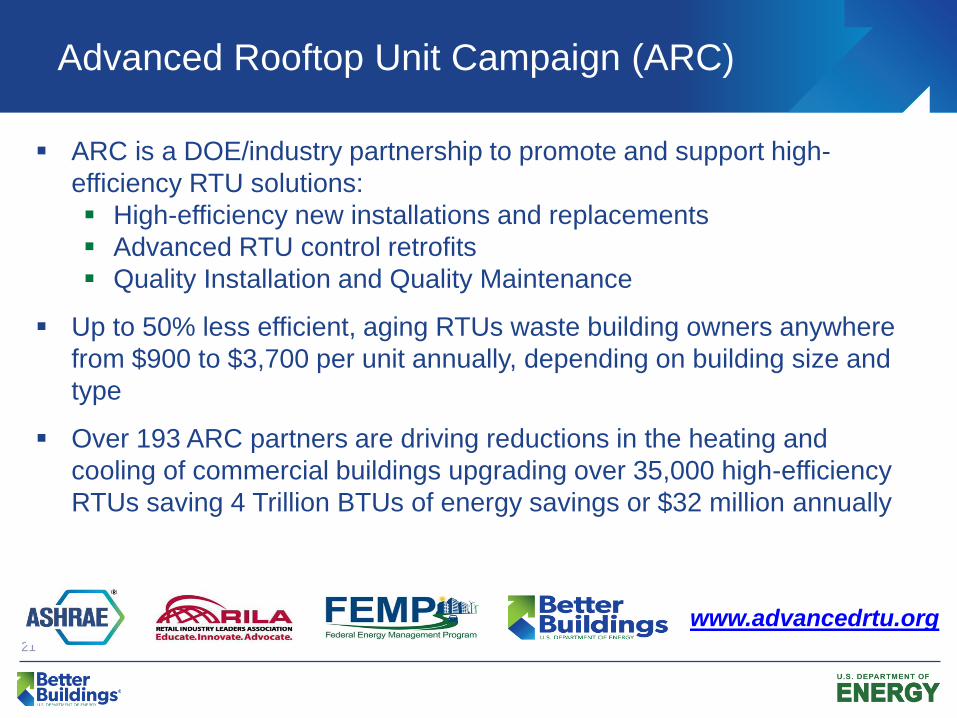
Advanced Rooftop Unit Campaign (ARC)
ARC is a DOE/industry partnership to promote and support high-
efficiency RTU solutions:
High-efficiency new installations and replacements
Advanced RTU control retrofits
Quality Installation and Quality Maintenance
Up to 50% less efficient, aging RTUs waste building owners anywhere
from $900 to $3,700 per unit annually, depending on building size and
type
Over 193 ARC partners are driving reductions in the heating and
cooling of commercial buildings upgrading over 35,000 high-efficiency
RTUs saving 4 Trillion BTUs of energy savings or $32 million annually
21
www.advancedrtu.org

Click To Edit Master
Title Style
May 2015
Better Buildings Summit
The Business Case for
Proactive RTU
Replacement
Marta Schantz
Waypoint Building
Group

Business Case Considerations for
Proactive RTU Replacement

The Business Case for Proactive RTU
Replacement
24

RTU Replacement Strategies that
include Varying Levels of Efficiency
1. Replacement-on-failure with like-for-like RTUs
2. Replacement at End of Useful Service Life (EUSL) with like-for-
like RTUs
3. Proactive replacement at EUSL or early retirement with right-
sized and higher-efficiency RTUs
4. Proactive replacement at EUSL or early retirement with an
engineered and optimized design
25
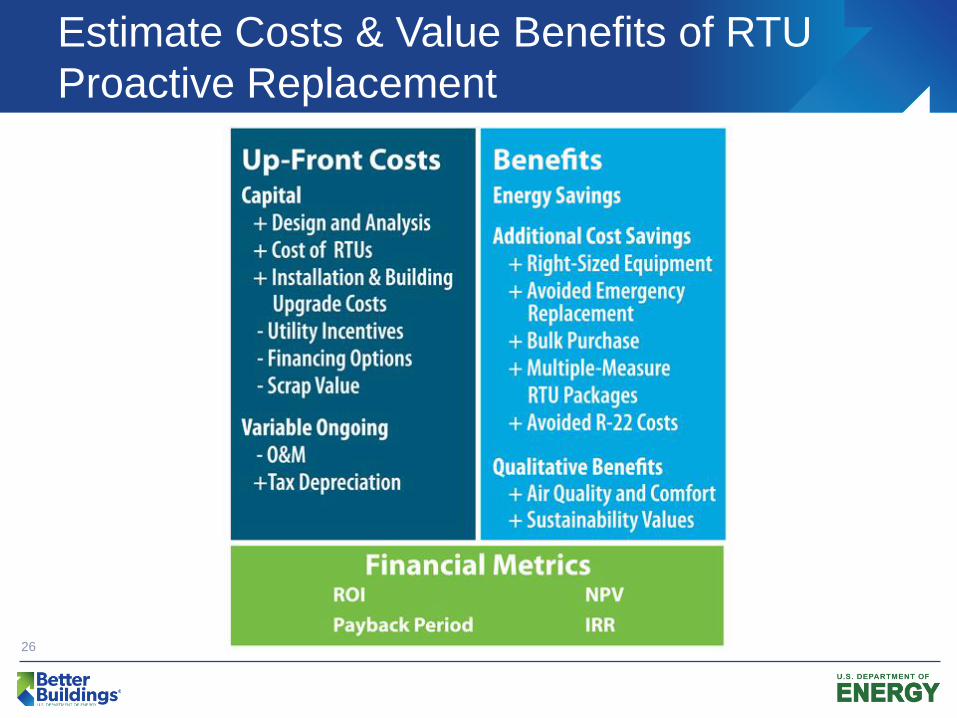
Estimate Costs & Value Benefits of RTU
Proactive Replacement
26
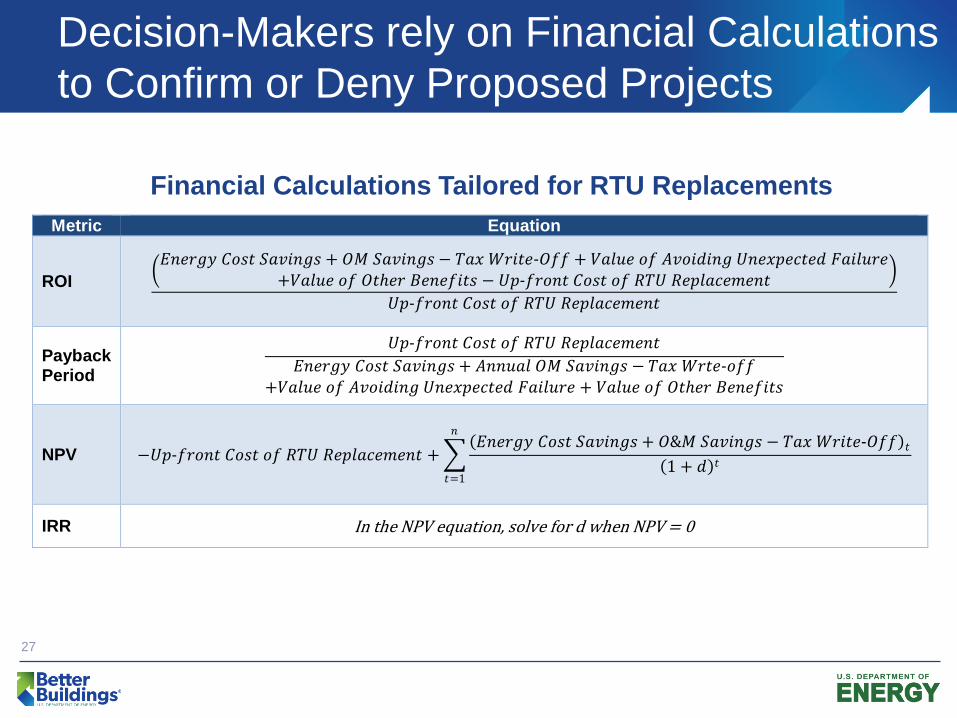
Decision-Makers rely on Financial Calculations
to Confirm or Deny Proposed Projects
27
Financial Calculations Tailored for RTU Replacements
Metric Equation
ROI 𝐸𝑛𝑒𝑟𝑔𝑦 𝐶𝑜𝑠𝑡 𝑆𝑎𝑣𝑖𝑛𝑔𝑠 + 𝑂𝑀 𝑆𝑎𝑣𝑖𝑛𝑔𝑠 − 𝑇𝑎𝑥 𝑊𝑟𝑖𝑡𝑒𝑂𝑓𝑓 + 𝑉𝑎𝑙𝑢𝑒 𝑜𝑓 𝐴𝑣𝑜𝑖𝑑𝑖𝑛𝑔 𝑈𝑛𝑒𝑥𝑝𝑒𝑐𝑡𝑒𝑑 𝐹𝑎𝑖𝑙𝑢𝑟𝑒
+𝑉𝑎𝑙𝑢𝑒 𝑜𝑓 𝑂𝑡ℎ𝑒𝑟 𝐵𝑒𝑛𝑒𝑓𝑖𝑡𝑠 − 𝑈𝑝𝑓𝑟𝑜𝑛𝑡 𝐶𝑜𝑠𝑡 𝑜𝑓 𝑅𝑇𝑈 𝑅𝑒𝑝𝑙𝑎𝑐𝑒𝑚𝑒𝑛𝑡
𝑈𝑝𝑓𝑟𝑜𝑛𝑡 𝐶𝑜𝑠𝑡 𝑜𝑓 𝑅𝑇𝑈 𝑅𝑒𝑝𝑙𝑎𝑐𝑒𝑚𝑒𝑛𝑡
Payback Period
𝑈𝑝𝑓𝑟𝑜𝑛𝑡 𝐶𝑜𝑠𝑡 𝑜𝑓 𝑅𝑇𝑈 𝑅𝑒𝑝𝑙𝑎𝑐𝑒𝑚𝑒𝑛𝑡
𝐸𝑛𝑒𝑟𝑔𝑦 𝐶𝑜𝑠𝑡 𝑆𝑎𝑣𝑖𝑛𝑔𝑠 + 𝐴𝑛𝑛𝑢𝑎𝑙 𝑂𝑀 𝑆𝑎𝑣𝑖𝑛𝑔𝑠 − 𝑇𝑎𝑥 𝑊𝑟𝑡𝑒𝑜𝑓𝑓+𝑉𝑎𝑙𝑢𝑒 𝑜𝑓 𝐴𝑣𝑜𝑖𝑑𝑖𝑛𝑔 𝑈𝑛𝑒𝑥𝑝𝑒𝑐𝑡𝑒𝑑 𝐹𝑎𝑖𝑙𝑢𝑟𝑒 + 𝑉𝑎𝑙𝑢𝑒 𝑜𝑓 𝑂𝑡ℎ𝑒𝑟 𝐵𝑒𝑛𝑒𝑓𝑖𝑡𝑠
NPV −𝑈𝑝𝑓𝑟𝑜𝑛𝑡 𝐶𝑜𝑠𝑡 𝑜𝑓 𝑅𝑇𝑈 𝑅𝑒𝑝𝑙𝑎𝑐𝑒𝑚𝑒𝑛𝑡 + 𝐸𝑛𝑒𝑟𝑔𝑦 𝐶𝑜𝑠𝑡 𝑆𝑎𝑣𝑖𝑛𝑔𝑠 + 𝑂&𝑀 𝑆𝑎𝑣𝑖𝑛𝑔𝑠 − 𝑇𝑎𝑥 𝑊𝑟𝑖𝑡𝑒𝑂𝑓𝑓 𝑡
1 + 𝑑 𝑡
𝑛
𝑡=1
IRR In the NPV equation, solve for d when NPV = 0

RTU Comparison Calculator (RTUCC) to
Estimate Energy Savings
The PNNL developed an online calculator tool
to estimate energy savings when comparing
between different RTUs for a commercial
building
Tool can be used to compare two potential
units for purchase, or to compare a current
existing unit with a potential replacement unit
This business case example lists the
candidate unit as a new 10-ton 12-EER RTU
with a $12,160 net cost, with the “standard”
unit as the existing 7.3 EER unit at $0
28

Example Business Case for “Superstore”
Proactive RTU Replacements
29

Example Business Case for Proactive RTU
Replacement at “Superstore” (Strategy 3)
30
Superstore is a hypothetical retail business with a
stand-alone store in Columbia, MO. The building
has five 15-year old 12-ton RTUs, with EER of
8.7 (code at the time) that degraded to an
effective 7.3.
Superstore is considering proactive replacement
of all five RTUs with CEE Tier II units. Engineers
right-sized the new RTUs down from 12-ton to
10-ton units, thus saving on the cost of the units
priced at $800/ton. New units’ efficiency is 12
EER and 13.8 IEER. They require less O&M,
partially due to the lack of R-22. Superstore
saves on installation costs by replacing all units at
once.
Inputting this
information into the
RTUCC results in
a savings
comparison of
74,638 kWh/year,
or $7,688/year in
energy savings
alone

Financial Outputs of Business Case
Example for Proactive RTU Replacement
31
Financial
Calculations
Energy-Related
Considerations
Adding Qualitative
Considerations
ROI -3.2% 52.4%
Payback Period 5.2 years 3.3 years
NPV -$15,337 $5,029
IRR -1% 16%
Details of Financial Calculation Inputs
and Assumptions for “Superstore”
32

Weighing the Energy-Related Costs and
Benefits at “Superstore”
Net Cost: $50,800 RTU Cost: $800/ton
RTU Size: 10 Tons
Cost to Replace 5 RTUs: $40,000
Cost to Install 5 RTUs: $20,000
Utility Rebate for the 5 RTUs: ($8,200)
Scrap Value of 5 old RTUs: ($1,000)
Net Savings over 5 years: $49,189 Annual Tax Depreciation Write-off for 5 RTUs: ($350)
Annual Energy Cost Savings for 5 RTUs: $7,688
Annual O&M Savings for 5 RTUs: $2,500
33

Valuing the Qualitative Benefits of Proactive
RTU Replacement at “Superstore”
Value of Avoiding Unexpected Failure:
$26,250
Emergency Replacement 50% Premium (higher cost of
units & labor for installation): $23,500
Lost profit from 2 days of a non-conditioned building:
$20,000
Probability of Failure over 5 years: 50%
Willingness to Pay for Improved Air Quality
at Superstore: $2,000
34

Weighing all the Costs and Benefits at
“Superstore” for Proactive RTU Replacement
35
Contact Information
Michael Deru, National Renewable Energy Laboratory [email protected]
303-384-7503
Marta Schantz, Waypoint Building Group [email protected]
231-598-2332
Advanced RTU Campaign (ARC) Website www.AdvancedRTU.org
36

RTU Retrofit with Advanced Controllers –
JCPenney Case Study from Kyle Wilkes
37

Kyle Wilkes, JCPenneyEnergy and Engineering Director
Texas Pilot Test Store RTU Details Built in 2006 and approximately 100,000 square feet in size
Conditioned with 12 packaged rooftop units
Savings of 16% achieved after retrofitting its RTUs with this type of VFD retrofit
technology
38
Texas Pilot Test Store Energy Savings
Texas Pilot Test Score RTU Details
RTU Count Size Blower hp
10 25 tons 7.5 hp
1 15 tons 5 hp
1 10 ton 3 hp
The retrofit package had an
ROI of 8 months

Kyle Wilkes, JCPenneyEnergy and Engineering Director
Nationwide VFD Retrofit Upgrade on Rooftop Units Roll out begging June 2011
Reduced Overall Energy Usage by 14%
Improved Operational Efficiency
39
JCPenney Organizational Profile
Established 1902Number of Facilities ~1,062 stores
Employees ~114,000 associates
Project ScopeRTU Retrofit Pilot expanded to 131
stores with 1330 Rooftop Units
VFD Retrofit Results
Energy Savings14% reduction from years prior to VFD
installation
Cost Savings$3.5 million annual savings years prior
to VFD installation
Payback Less than one year

Kyle Wilkes, JCPenneyEnergy and Engineering Director
Sustaining Savings Maintenance
Warranty Management
Same 131 stores 2014 energy reduction in now at 22%
$5M annual savings
Improved Operational Efficiency Store Scheduler
Emap
AEM
EMS revision upgrades
40

Darrel Carter, Sprint
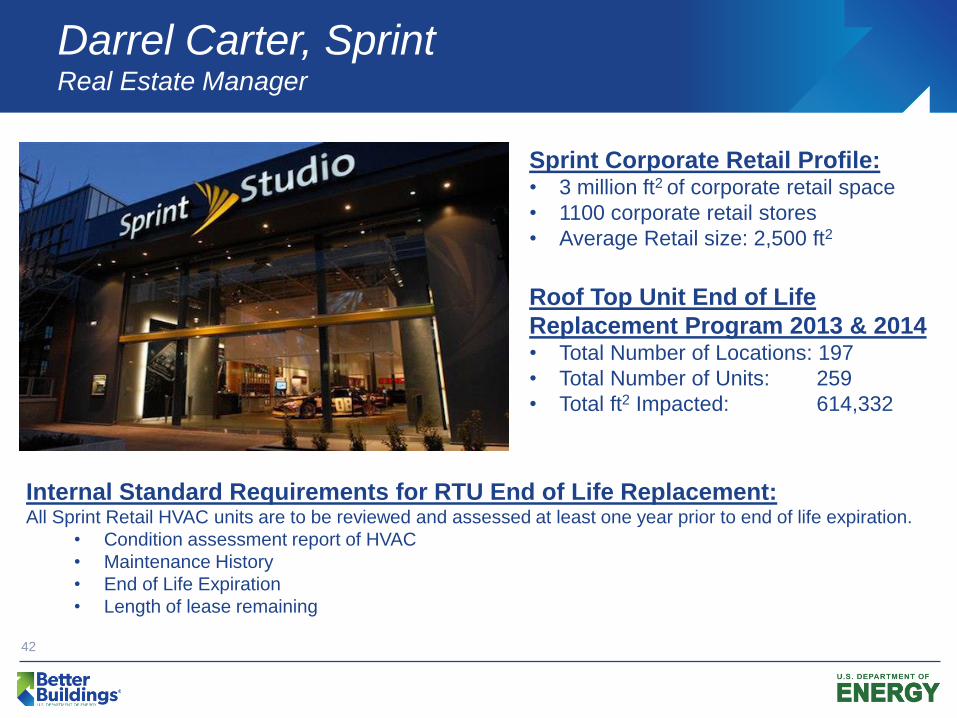
Darrel Carter, SprintReal Estate Manager
42
Sprint Corporate Retail Profile:• 3 million ft2 of corporate retail space
• 1100 corporate retail stores
• Average Retail size: 2,500 ft2
Roof Top Unit End of Life
Replacement Program 2013 & 2014• Total Number of Locations: 197
• Total Number of Units: 259
• Total ft2 Impacted: 614,332
Internal Standard Requirements for RTU End of Life Replacement:All Sprint Retail HVAC units are to be reviewed and assessed at least one year prior to end of life expiration.
• Condition assessment report of HVAC
• Maintenance History
• End of Life Expiration
• Length of lease remaining

Darrel Carter, SprintReal Estate Manager
43
Sites: 94
Units Replaced: 96
Ft2 Impacted: 317,075
kWh Reduction: 38.3%
Total cost of project: $1.08 M
Average Replacement Cost: $10,614
Average Unit Size: 5.08 Tons
Age of Equipment: 5-33 years
Average Age: 16.8 years
Sites: 103
Units Replaced: 163
Ft2 Impacted: 297,257
kWh Reduction: 33 %
Total cost of project: $1.71 M
Average Replacement Cost: $10,501
Average Unit Size: 5.5 Tons
Age of Equipment: 10-28 years
Average Age: 15.1
2013 Retail RTU Replacements:
2014 Retail RTU Replacements:
Roof Top Unit Replacement Drivers: • HVAC Maintenance savings
• Business operation continuity
• Energy savings

Q & A
44

Thank You
45
Holly Carr
DOE Better Buildings Sector Lead
202-287-1409
Andrew Mitchell
DOE Technology Teams Coordinator
202-287-1578
Kristen Taddonio
DOE Alliance Coordinator
202-287-1432
Zach Abrams
Retail Account Manager
646-334-1174
Cara Bastoni
Food Service and Grocery Account Manager
703-225-2915
Marta Schantz
Advanced RTU Campaign
231-598-2332

46
Overcoming the Barriers to Energy Savings –
Recent Implementation Models
How do I partner with my utility? Try Whole Foods’ IM on Customized Utility Incentives:
• Barrier: Utility incentives for energy efficiency are often prescriptive and not always
relevant to the grocery sector
• Solution: Propose sector-specific incentive package to utility, and enter into an agreement
specifying multi-site regional annual kWh consumption reduction targets with aggregate,
streamlined incentive process
How can I motivate my organization? Try Sprint’s IM on Corporate Goal is a Catalyst for
Custom Efficiency Strategies:
• Barrier: Lack of corporate energy goal or enterprise energy reporting and management
effort
• Solution: A multifaceted energy efficiency strategy includes applying a unique energy
savings approach to each asset class and tying compensation to energy reduction, which
has resulted in more than $60 million in avoided energy costs.
How do I reduce water use? Try Kohl’s IM (soon) on Multi-pronged Strategy for Water Use
Reduction:
• Barrier: Retail tenant water use charges are based on square footage occupied rather
than metered usage do not incentivize water conservation
• Solution: Negotiate water-favorable leases at initiation or renewal to allow submetering
and tenant control of exterior grounds maintenance. Upgrade or decommission irrigation
systems to take advantage of water and cost savings.