Embed Size (px)
Citation preview
RETAIL MARKET ANALYSIS
WEST CENTRAL DISTRICT ALBUQUERQUE, NEW MEXICO
Prepared For:
STRATA DESIGN 305 Hermosa NE
Albuquerque, New Mexico 87108
Prepared By: GIBBS PLANNING GROUP, Inc.
201 W. Mitchell Street, No. 150 Petoskey, Michigan 49770
19 January 2011
TABLE OF CONTENTS
INTRODUCTION…………………………………………………………………………. 1.Figure 1: West Central Study Area Map……………………………………………… 1.Executive Summary …………………………………………………………………….. 1.Figure 2: West Central gateway photo………………………………………………. . 2.Background…………………………………………………………………………….…. 2.Figure 3: Primary Trade Area Map……………………………………………………. 3.Figure 4: West Central gateway photos………………………………………….…… 4.Methodology……………………………………………………………………………… 4.Figure 5: Unser Crossing photos………………………………………………….…... 5.Limits of Study …………………………………………………………………….…….. 6.Figure 6: Primary and Secondary Trade Area Map ……………………………….. . 7.Trade Area……………………………………………………………………………….. 7.Demographic Characteristics………………………………….………………………. 8.Table 1: Demographic Comparison Table ………………………………………….... 8.Tapestry Lifestyles …………………………………………………………………….... 9.Table 2: Tapestry Lifestyles…………………………………………………………….. 9.Figure 7: Tapestry Lifestyles Segmentation Graph………………………………….. 12.Employment Base ……………………………………………………………………… 12.Table 3: Employment by Sector………………………………………………………… 13. TRADE AREA CHARACTERISTICS……………………………………………….…. 13.Location…………………………………………………………………………………… 13.Access………………………………………………………………………………..……. 13.Table 4: Traffic Counts ………………………………………………………………… . 14.Other Shopping Areas …………………………………………………………….……. 14.Figure 8: West Central Map …………………………………………………………… 15.Table 5: Existing Regional Centers……………………………………………….……. 15.Figure 9: Coors Boulevard & Interstate 40 Retail……………………………………. 16.Figure 10: Cottonwood Mall Photos ………………………………….………………. 16.Figure 11: Coronado Mall Photos…………………………………….……………….. 17.Figure 12: ABQ Uptown Photos……………………………….………………………. 17.Figure 13: Montgomery Plaza and Interstate 25 Retail …….………………………. 18. SUMMARY OF FINDINGS …………………………………………………………….. 18.Supportable 2010 Retail and Potential Tenants …… ……………………………… . 19.Table 6: Supportable Retail ………………………………………….………………… 21.Rationale………………………………………………………………………………….. 22. APPENDIX ………………………………………………………………………………. 23.Exhibit A: Supportable Retail Table ………………………………………………..…. 23.Exhibit B: Retail Expenditure Potential Table ………………………………………... 25.Trade Area Map: Population by Census Tract ……………………………………….. 26.
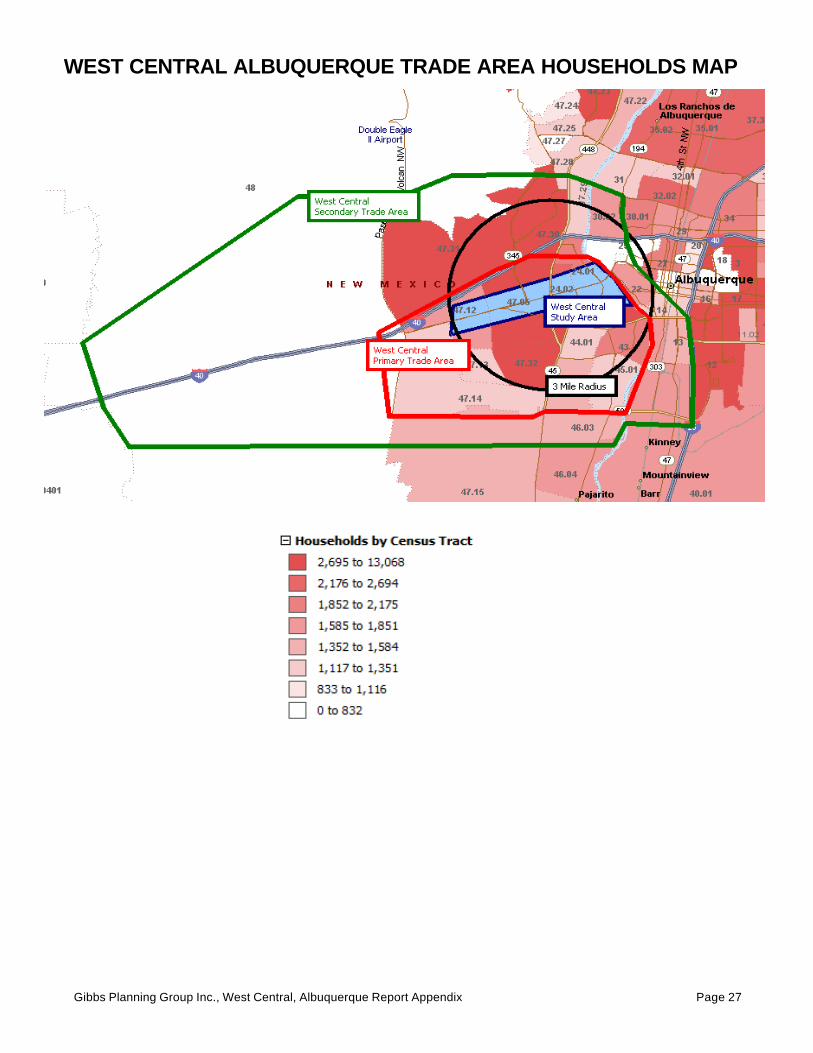
Trade Area Map: Households by Census Tract………………………………………. 27.Trade Area Map: Average Household Income by Census Tract……………………. 28.Trade Area Map: Neighborhood Competition Map …………………………………... 29.Regional Competition Table ………………………………………………………….… 30.Trade Area Competition Map: Community and Regional Centers………………… 33.Business-Facts: WorkPlace and Employment Summary …………………………... 34.Market Profile Table ……………………………………………………………………. 35.Population by Age Table……………………………………………………………….... 43.Income Profile Table……………………………………………………………………... 49.Demographic and Income Table……………………………………………………….. 50.Primary Lifestyles Table…………………………………………………………........... 52. Industrious Urban Fringe………………………………………………………. 53. Southwestern Families……………………………………………………….…. 54. Up and Coming Families…………………………………………………….…. 55. NeWest Residents…………………………………………………………….… 56. Inner City Tenants…………………………………………………………….… 57. City Dimensions…………………………………………………………………. 58. Rustbelt Traditions………………………………………………………………. 59. Crossroads……………………………………………………………………….. 60. Family Foundations……………………………………………………………... 61. Salt of the Earth………………………………………………………………….. 62.Housing Profile Table……………………………………………………………………. 63.
West Central Trade Area Market Study 1. Gibbs Planning Group, Inc. January 19, 2010
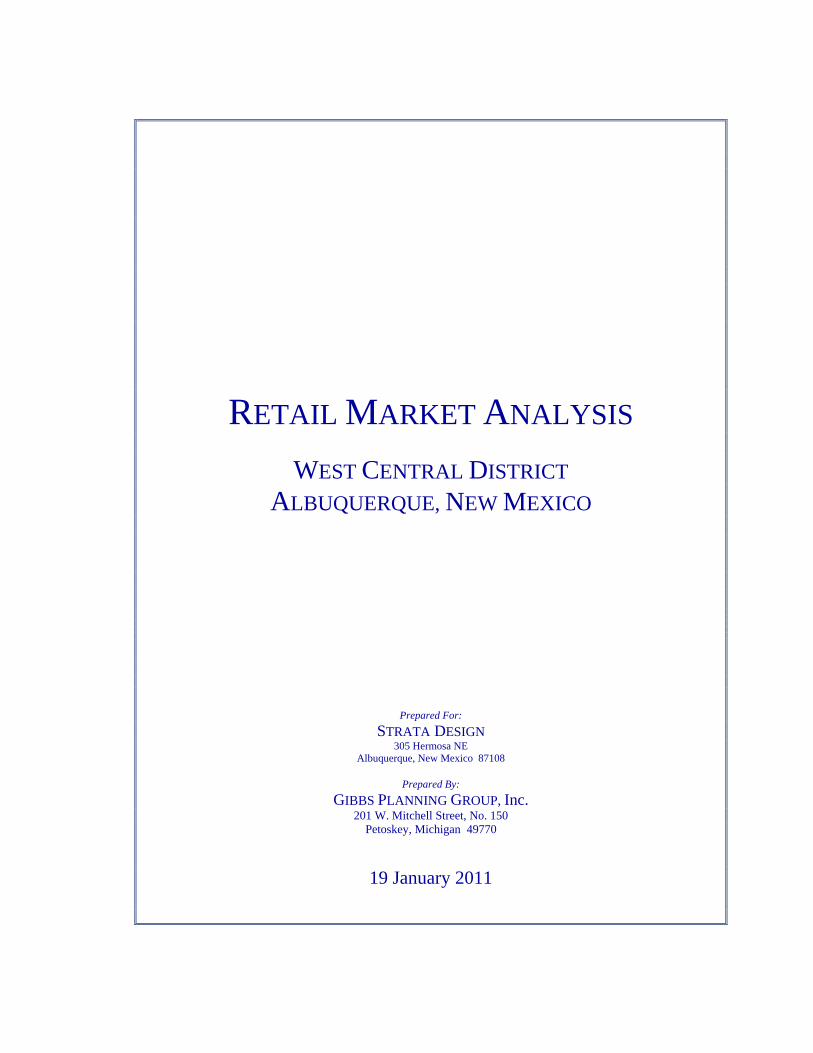
INTRODUCTION
Figure 1: The West Central Albuquerque study area lies 1.5 miles west of the Central Business District. Executive Summary This study finds that Albuquerque's West Central neighborhoods can presently support an additional 161,700 square feet of additional retail and restaurant development, generating over $38.9 million in new sales. By 2015 the study area can expand to 185,800 square feet of new commercial growth, generating $49.8 million in sales. Albuquerque's West Central district is based on and branded by "America's Mother Road", Route 66 (Central Avenue). This study area stretches from the sparse rural western edge near Interstate 40, to the dense urban eastern edge ending at the Central Avenue Bridge over the Rio Grande River. New commercial growth along this five mile retail strip has been concentrated in the western half of the study area, supported by the housing expansion on Albuquerque's southwest mesa just to the south. As residential growth seized up over the last two years, commercial development has also grinded to a halt in the general study area. This is best exemplified by the vacant speculative commercial centers located at Central Avenue and Unser Boulevard, and the vacant (but completely developed) community center, Unser Crossing, also at the intersection of Unser Boulevard and Route 66. The eastern portion of the study area is characterized by older retail and service businesses, and supported by the urban neighborhoods which are contiguous to it. This older discount-orientated strip creates a perceptual barrier dissuading consumers in the more affluent areas of central Albuquerque from traveling up the hill to the western half.
West Central Trade Area Market Study 2. Gibbs Planning Group, Inc. January 19, 2010
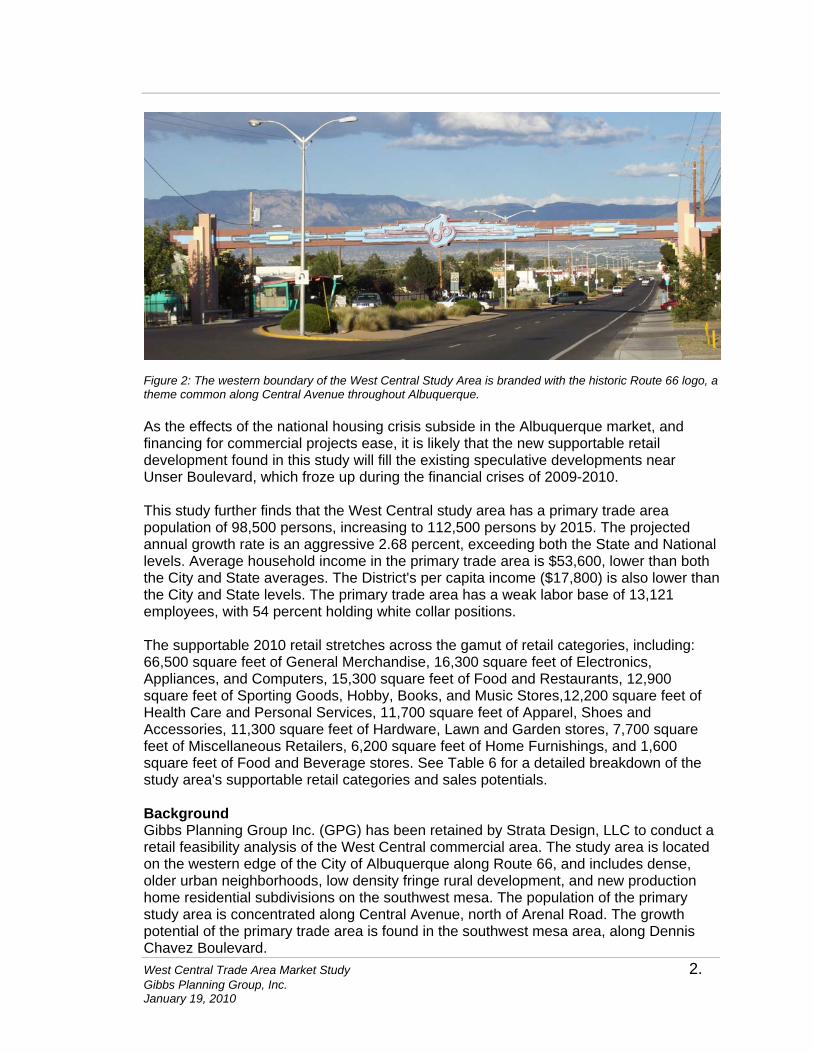
Figure 2: The western boundary of the West Central Study Area is branded with the historic Route 66 logo, a theme common along Central Avenue throughout Albuquerque. As the effects of the national housing crisis subside in the Albuquerque market, and financing for commercial projects ease, it is likely that the new supportable retail development found in this study will fill the existing speculative developments near Unser Boulevard, which froze up during the financial crises of 2009-2010. This study further finds that the West Central study area has a primary trade area population of 98,500 persons, increasing to 112,500 persons by 2015. The projected annual growth rate is an aggressive 2.68 percent, exceeding both the State and National levels. Average household income in the primary trade area is $53,600, lower than both the City and State averages. The District's per capita income ($17,800) is also lower than the City and State levels. The primary trade area has a weak labor base of 13,121 employees, with 54 percent holding white collar positions. The supportable 2010 retail stretches across the gamut of retail categories, including: 66,500 square feet of General Merchandise, 16,300 square feet of Electronics, Appliances, and Computers, 15,300 square feet of Food and Restaurants, 12,900 square feet of Sporting Goods, Hobby, Books, and Music Stores,12,200 square feet of Health Care and Personal Services, 11,700 square feet of Apparel, Shoes and Accessories, 11,300 square feet of Hardware, Lawn and Garden stores, 7,700 square feet of Miscellaneous Retailers, 6,200 square feet of Home Furnishings, and 1,600 square feet of Food and Beverage stores. See Table 6 for a detailed breakdown of the study area's supportable retail categories and sales potentials. Background Gibbs Planning Group Inc. (GPG) has been retained by Strata Design, LLC to conduct a retail feasibility analysis of the West Central commercial area. The study area is located on the western edge of the City of Albuquerque along Route 66, and includes dense, older urban neighborhoods, low density fringe rural development, and new production home residential subdivisions on the southwest mesa. The population of the primary study area is concentrated along Central Avenue, north of Arenal Road. The growth potential of the primary trade area is found in the southwest mesa area, along Dennis Chavez Boulevard.
West Central Trade Area Market Study 3. Gibbs Planning Group, Inc. January 19, 2010
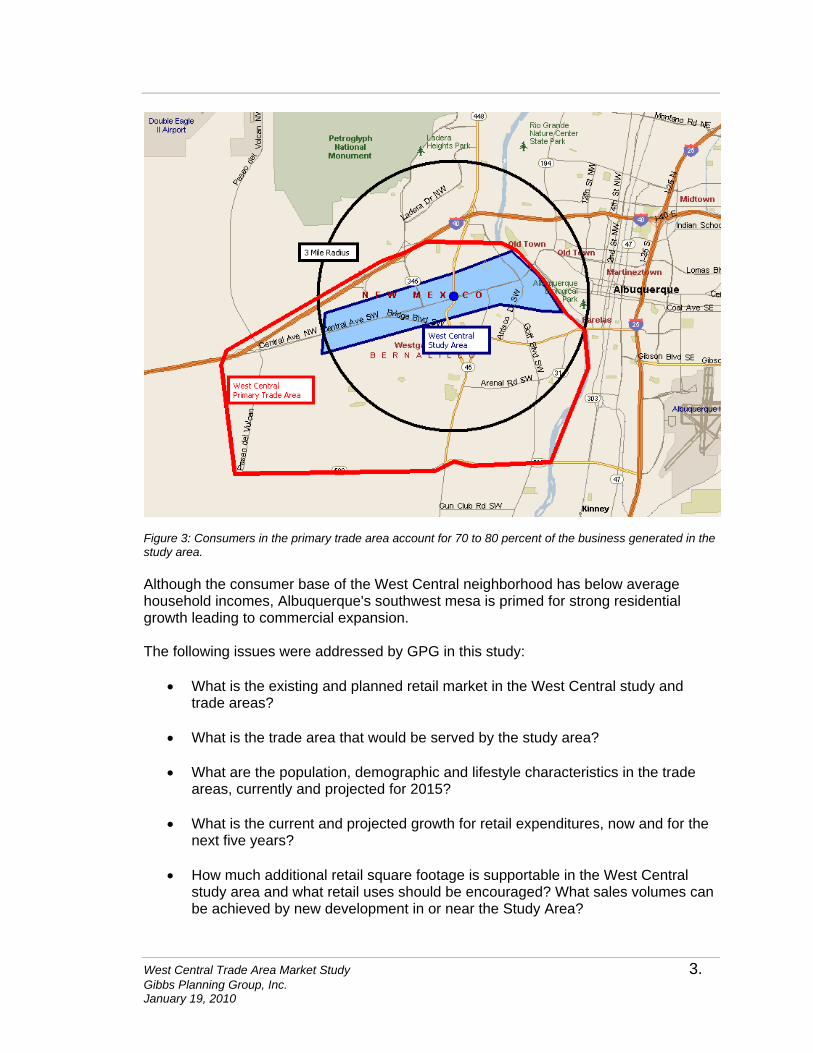
Figure 3: Consumers in the primary trade area account for 70 to 80 percent of the business generated in the study area. Although the consumer base of the West Central neighborhood has below average household incomes, Albuquerque's southwest mesa is primed for strong residential growth leading to commercial expansion. The following issues were addressed by GPG in this study:
• What is the existing and planned retail market in the West Central study and trade areas?
• What is the trade area that would be served by the study area?
• What are the population, demographic and lifestyle characteristics in the trade
areas, currently and projected for 2015? • What is the current and projected growth for retail expenditures, now and for the
next five years? • How much additional retail square footage is supportable in the West Central
study area and what retail uses should be encouraged? What sales volumes can be achieved by new development in or near the Study Area?
West Central Trade Area Market Study 4. Gibbs Planning Group, Inc. January 19, 2010
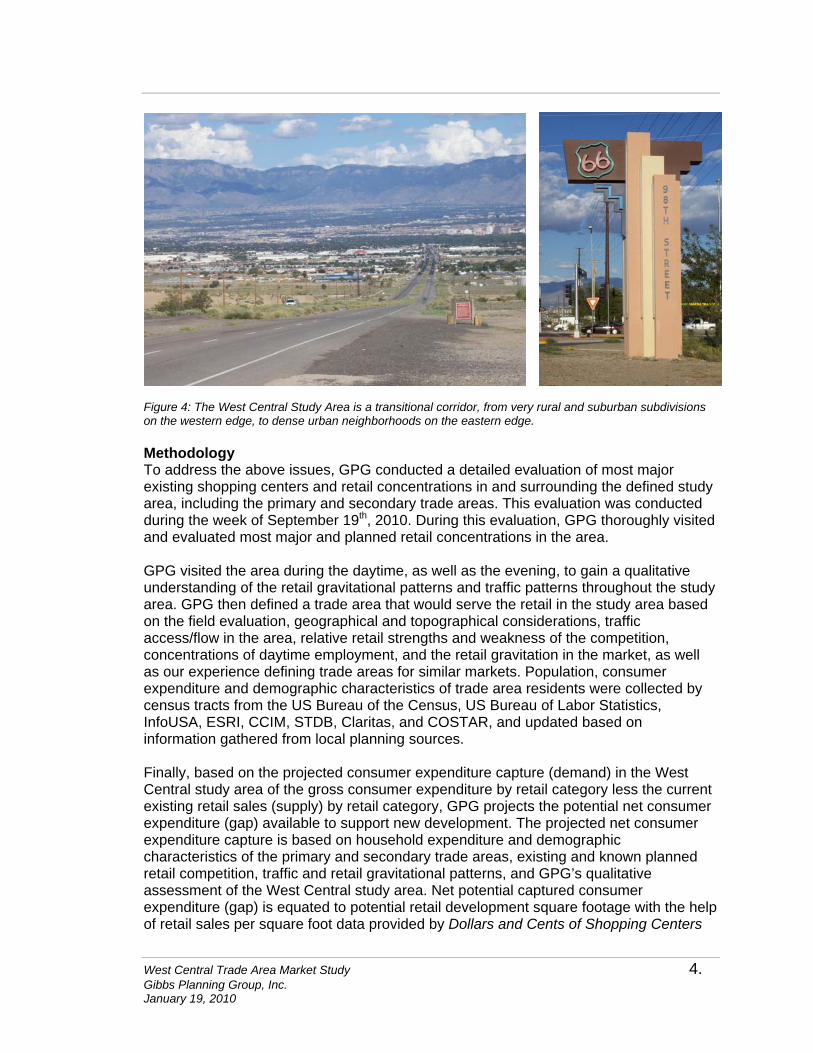
Figure 4: The West Central Study Area is a transitional corridor, from very rural and suburban subdivisions on the western edge, to dense urban neighborhoods on the eastern edge. Methodology To address the above issues, GPG conducted a detailed evaluation of most major existing shopping centers and retail concentrations in and surrounding the defined study area, including the primary and secondary trade areas. This evaluation was conducted during the week of September 19th, 2010. During this evaluation, GPG thoroughly visited and evaluated most major and planned retail concentrations in the area. GPG visited the area during the daytime, as well as the evening, to gain a qualitative understanding of the retail gravitational patterns and traffic patterns throughout the study area. GPG then defined a trade area that would serve the retail in the study area based on the field evaluation, geographical and topographical considerations, traffic access/flow in the area, relative retail strengths and weakness of the competition, concentrations of daytime employment, and the retail gravitation in the market, as well as our experience defining trade areas for similar markets. Population, consumer expenditure and demographic characteristics of trade area residents were collected by census tracts from the US Bureau of the Census, US Bureau of Labor Statistics, InfoUSA, ESRI, CCIM, STDB, Claritas, and COSTAR, and updated based on information gathered from local planning sources. Finally, based on the projected consumer expenditure capture (demand) in the West Central study area of the gross consumer expenditure by retail category less the current existing retail sales (supply) by retail category, GPG projects the potential net consumer expenditure (gap) available to support new development. The projected net consumer expenditure capture is based on household expenditure and demographic characteristics of the primary and secondary trade areas, existing and known planned retail competition, traffic and retail gravitational patterns, and GPG’s qualitative assessment of the West Central study area. Net potential captured consumer expenditure (gap) is equated to potential retail development square footage with the help of retail sales per square foot data provided by Dollars and Cents of Shopping Centers
West Central Trade Area Market Study 5. Gibbs Planning Group, Inc. January 19, 2010
(Urban Land Institute and International Council of Shopping Centers), qualitatively adjusted to fit the urbanism of the West Central study area.
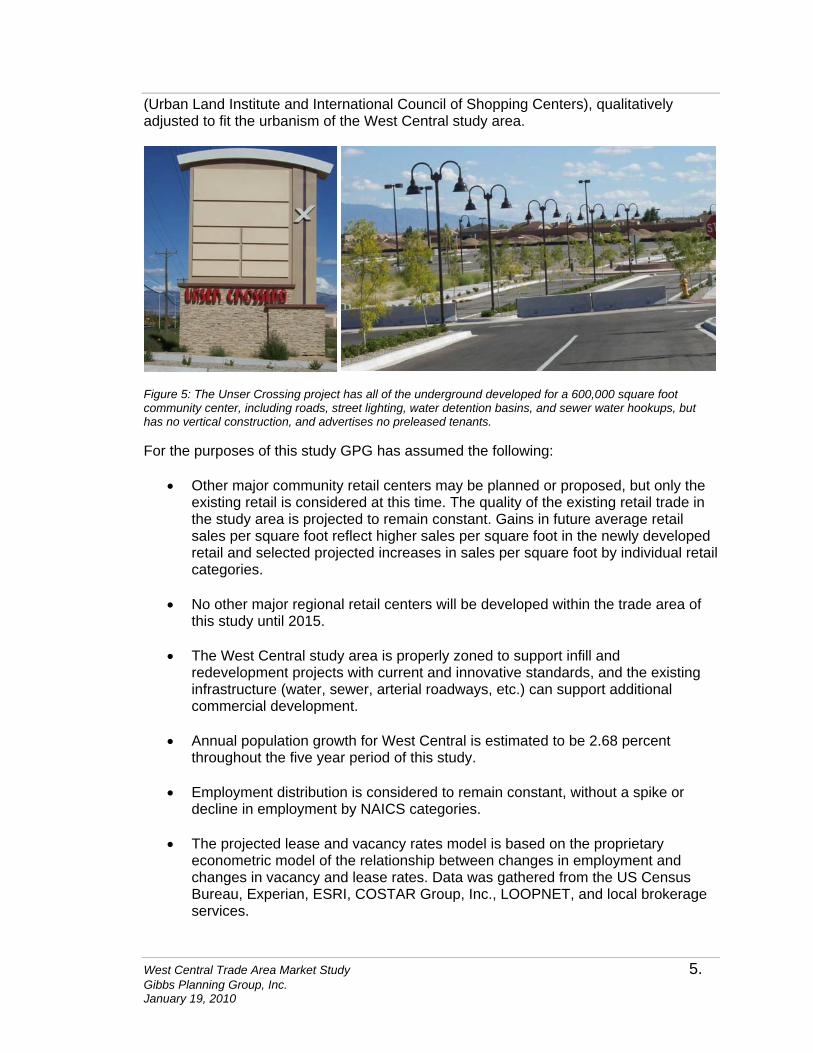
Figure 5: The Unser Crossing project has all of the underground developed for a 600,000 square foot community center, including roads, street lighting, water detention basins, and sewer water hookups, but has no vertical construction, and advertises no preleased tenants. For the purposes of this study GPG has assumed the following:
• Other major community retail centers may be planned or proposed, but only the existing retail is considered at this time. The quality of the existing retail trade in the study area is projected to remain constant. Gains in future average retail sales per square foot reflect higher sales per square foot in the newly developed retail and selected projected increases in sales per square foot by individual retail categories.
• No other major regional retail centers will be developed within the trade area of
this study until 2015.
• The West Central study area is properly zoned to support infill and redevelopment projects with current and innovative standards, and the existing infrastructure (water, sewer, arterial roadways, etc.) can support additional commercial development.
• Annual population growth for West Central is estimated to be 2.68 percent throughout the five year period of this study.
• Employment distribution is considered to remain constant, without a spike or decline in employment by NAICS categories.
• The projected lease and vacancy rates model is based on the proprietary
econometric model of the relationship between changes in employment and changes in vacancy and lease rates. Data was gathered from the US Census Bureau, Experian, ESRI, COSTAR Group, Inc., LOOPNET, and local brokerage services.
West Central Trade Area Market Study 6. Gibbs Planning Group, Inc. January 19, 2010
• The region’s economy will continue at normal or above normal ranges of employment, inflation, retail demand and growth.
• Any new construction in the West Central study area will be planned, designed,
built and managed to the best practices of The American Planning Association, The Congress for the New Urbanism, The International Council of Shopping Centers and The Urban Land Institute.
• Parking for new projects will meet or exceed the minimum requirements of the City,
with easy access to the retailers in the development via on-street, surface lots, or deck parking.
• Visibility of any new retail is also assumed to be very good, with signage as
required to assure easy visibility of the retailers.
• Infill or redevelopment projects in the study area will open with sustainable amounts of retail and anchor tenants, at planned intervals and per industry standards.
Limits of Study The findings of this study represent GPG’s best estimates for the amounts and types of retail projects that should be supportable in the study area. Every reasonable effort has been made to ensure that the data contained in this study reflect the most accurate and timely information possible and are believed to be reliable. This study is based on estimates, assumptions, and other information developed by GPG independent research effort, general knowledge of the industry, and consultations with the client and its representatives. No responsibility is assumed for inaccuracies in reporting by the client, its agent and representatives or in any other data source used in preparing or presenting this study. This report is based on information that was current as of September 23th, 2010, and GPG has not undertaken any update of its research effort since such date. This report may contain prospective financial information, estimates, or opinions that represent GPG’s view of reasonable expectations at a particular time, but such information, estimates, or opinions are not offered as predictions or assurances that a particular level of income or profit will be achieved, that particular events will occur, or that a particular price will be offered or accepted. Actual results achieved during the period covered by our prospective financial analysis may vary from those described in our report, and the variations may be material. Therefore, no warranty or representation is made by GPG that any of the projected values or results contained in this study will be achieved. This study should not be the sole basis for programming, planning, designing, financing or development of any commercial center. This study is intended for the use of Strata Design and the City of Albuquerque, for general planning purposes only, and is void for other site locations or developers.
West Central Trade Area Market Study 7. Gibbs Planning Group, Inc. January 19, 2010
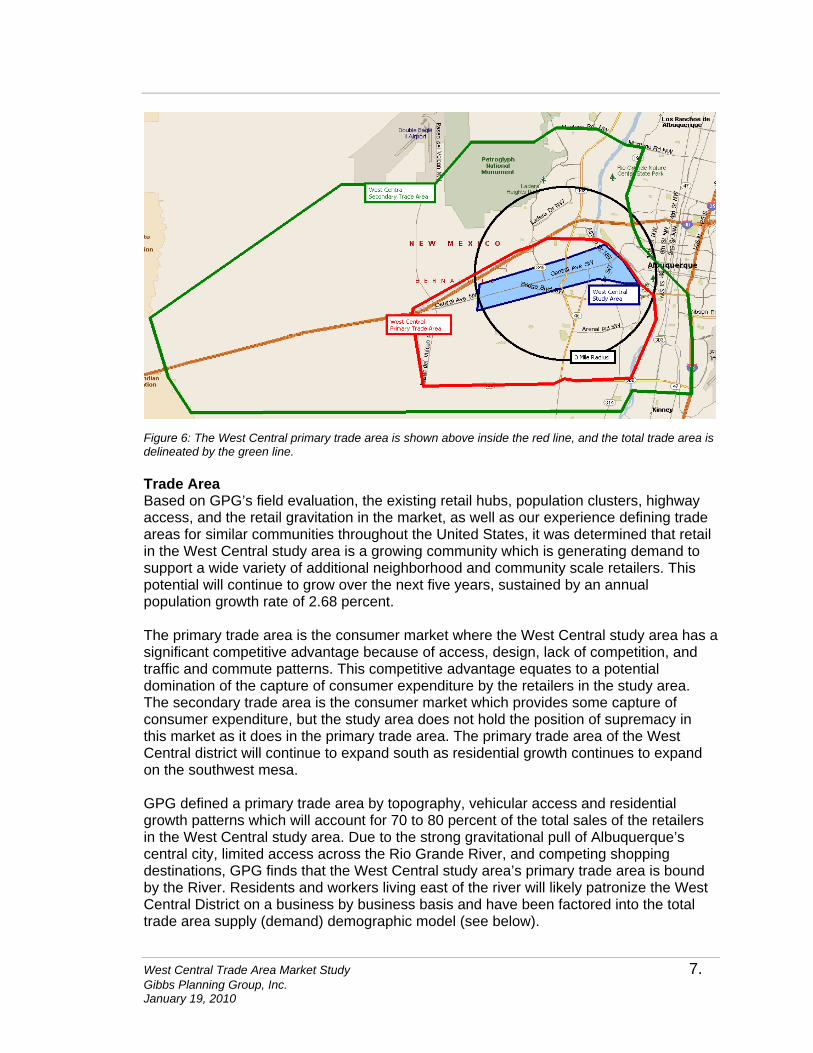
Figure 6: The West Central primary trade area is shown above inside the red line, and the total trade area is delineated by the green line. Trade Area Based on GPG’s field evaluation, the existing retail hubs, population clusters, highway access, and the retail gravitation in the market, as well as our experience defining trade areas for similar communities throughout the United States, it was determined that retail in the West Central study area is a growing community which is generating demand to support a wide variety of additional neighborhood and community scale retailers. This potential will continue to grow over the next five years, sustained by an annual population growth rate of 2.68 percent. The primary trade area is the consumer market where the West Central study area has a significant competitive advantage because of access, design, lack of competition, and traffic and commute patterns. This competitive advantage equates to a potential domination of the capture of consumer expenditure by the retailers in the study area. The secondary trade area is the consumer market which provides some capture of consumer expenditure, but the study area does not hold the position of supremacy in this market as it does in the primary trade area. The primary trade area of the West Central district will continue to expand south as residential growth continues to expand on the southwest mesa. GPG defined a primary trade area by topography, vehicular access and residential growth patterns which will account for 70 to 80 percent of the total sales of the retailers in the West Central study area. Due to the strong gravitational pull of Albuquerque’s central city, limited access across the Rio Grande River, and competing shopping destinations, GPG finds that the West Central study area’s primary trade area is bound by the River. Residents and workers living east of the river will likely patronize the West Central District on a business by business basis and have been factored into the total trade area supply (demand) demographic model (see below).
West Central Trade Area Market Study 8. Gibbs Planning Group, Inc. January 19, 2010
The primary trade area is approximately delineated by the following borders: The Rio Grande River to the east. Rio Bravo and Dennis Chavez Boulevards to the south. The western boundary of 114th Street. Interstate 40 and Fortuna Road to the north.
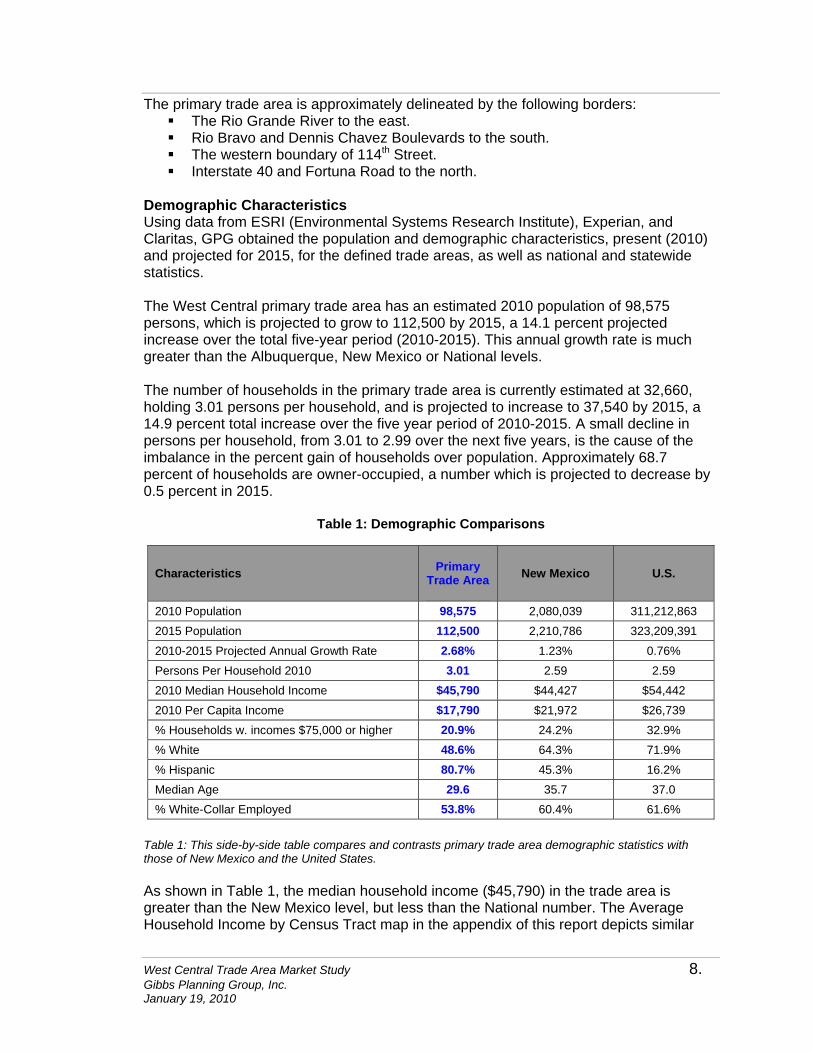
Demographic Characteristics Using data from ESRI (Environmental Systems Research Institute), Experian, and Claritas, GPG obtained the population and demographic characteristics, present (2010) and projected for 2015, for the defined trade areas, as well as national and statewide statistics. The West Central primary trade area has an estimated 2010 population of 98,575 persons, which is projected to grow to 112,500 by 2015, a 14.1 percent projected increase over the total five-year period (2010-2015). This annual growth rate is much greater than the Albuquerque, New Mexico or National levels. The number of households in the primary trade area is currently estimated at 32,660, holding 3.01 persons per household, and is projected to increase to 37,540 by 2015, a 14.9 percent total increase over the five year period of 2010-2015. A small decline in persons per household, from 3.01 to 2.99 over the next five years, is the cause of the imbalance in the percent gain of households over population. Approximately 68.7 percent of households are owner-occupied, a number which is projected to decrease by 0.5 percent in 2015.
Table 1: Demographic Comparisons
Characteristics Primary Trade Area
New Mexico U.S.
2010 Population 98,575 2,080,039 311,212,863 2015 Population 112,500 2,210,786 323,209,391 2010-2015 Projected Annual Growth Rate 2.68% 1.23% 0.76% Persons Per Household 2010 3.01 2.59 2.59 2010 Median Household Income $45,790 $44,427 $54,442 2010 Per Capita Income $17,790 $21,972 $26,739 % Households w. incomes $75,000 or higher 20.9% 24.2% 32.9% % White 48.6% 64.3% 71.9% % Hispanic 80.7% 45.3% 16.2% Median Age 29.6 35.7 37.0 % White-Collar Employed 53.8% 60.4% 61.6%
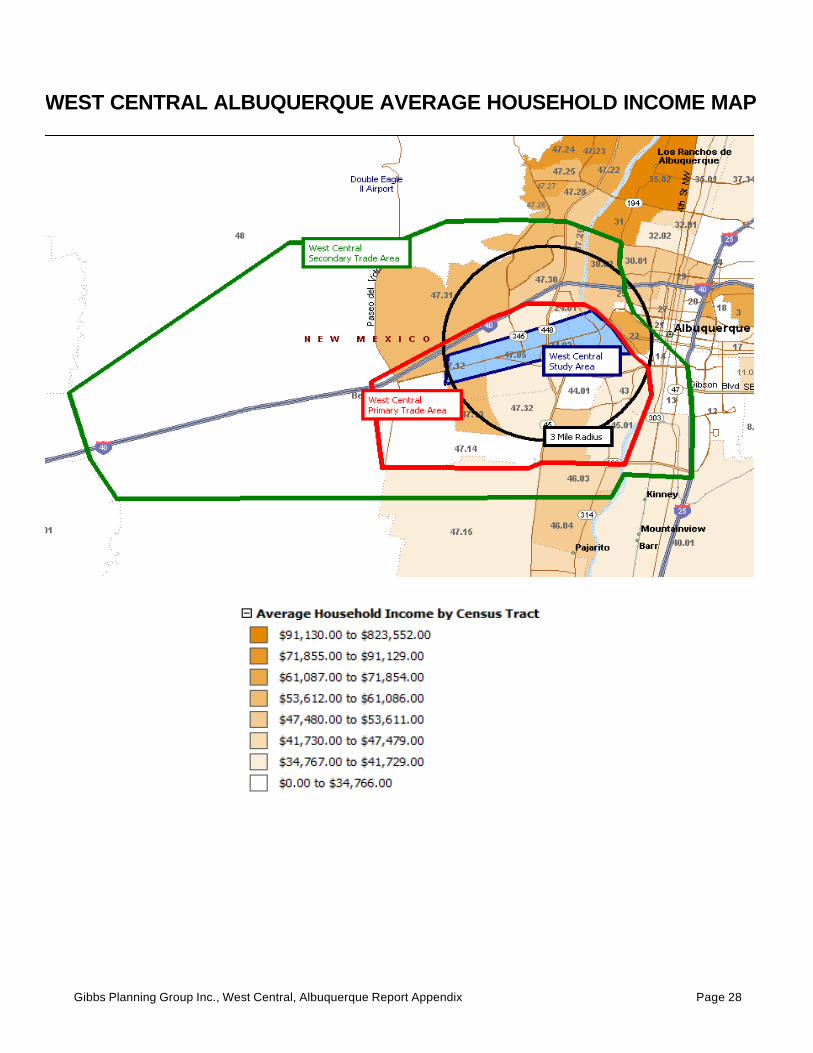
Table 1: This side-by-side table compares and contrasts primary trade area demographic statistics with those of New Mexico and the United States. As shown in Table 1, the median household income ($45,790) in the trade area is greater than the New Mexico level, but less than the National number. The Average Household Income by Census Tract map in the appendix of this report depicts similar
West Central Trade Area Market Study 9. Gibbs Planning Group, Inc. January 19, 2010
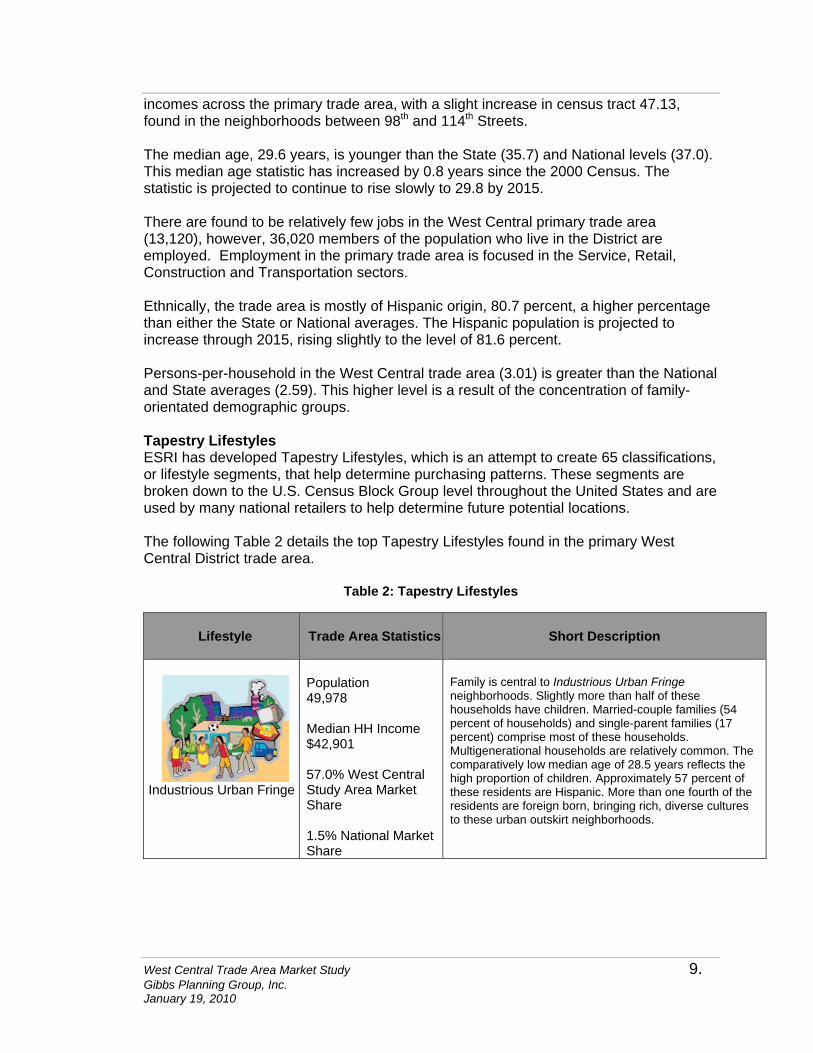
incomes across the primary trade area, with a slight increase in census tract 47.13, found in the neighborhoods between 98th and 114th Streets. The median age, 29.6 years, is younger than the State (35.7) and National levels (37.0). This median age statistic has increased by 0.8 years since the 2000 Census. The statistic is projected to continue to rise slowly to 29.8 by 2015. There are found to be relatively few jobs in the West Central primary trade area (13,120), however, 36,020 members of the population who live in the District are employed. Employment in the primary trade area is focused in the Service, Retail, Construction and Transportation sectors. Ethnically, the trade area is mostly of Hispanic origin, 80.7 percent, a higher percentage than either the State or National averages. The Hispanic population is projected to increase through 2015, rising slightly to the level of 81.6 percent. Persons-per-household in the West Central trade area (3.01) is greater than the National and State averages (2.59). This higher level is a result of the concentration of family- orientated demographic groups. Tapestry Lifestyles ESRI has developed Tapestry Lifestyles, which is an attempt to create 65 classifications, or lifestyle segments, that help determine purchasing patterns. These segments are broken down to the U.S. Census Block Group level throughout the United States and are used by many national retailers to help determine future potential locations. The following Table 2 details the top Tapestry Lifestyles found in the primary West Central District trade area.
Table 2: Tapestry Lifestyles
Lifestyle
Trade Area Statistics
Short Description
Industrious Urban Fringe
Population 49,978 Median HH Income $42,901 57.0% West Central Study Area Market Share 1.5% National Market Share
Family is central to Industrious Urban Fringe neighborhoods. Slightly more than half of these households have children. Married-couple families (54 percent of households) and single-parent families (17 percent) comprise most of these households. Multigenerational households are relatively common. The comparatively low median age of 28.5 years reflects the high proportion of children. Approximately 57 percent of these residents are Hispanic. More than one fourth of the residents are foreign born, bringing rich, diverse cultures to these urban outskirt neighborhoods.
West Central Trade Area Market Study 10. Gibbs Planning Group, Inc. January 19, 2010
Lifestyle
Trade Area Statistics
Short Description
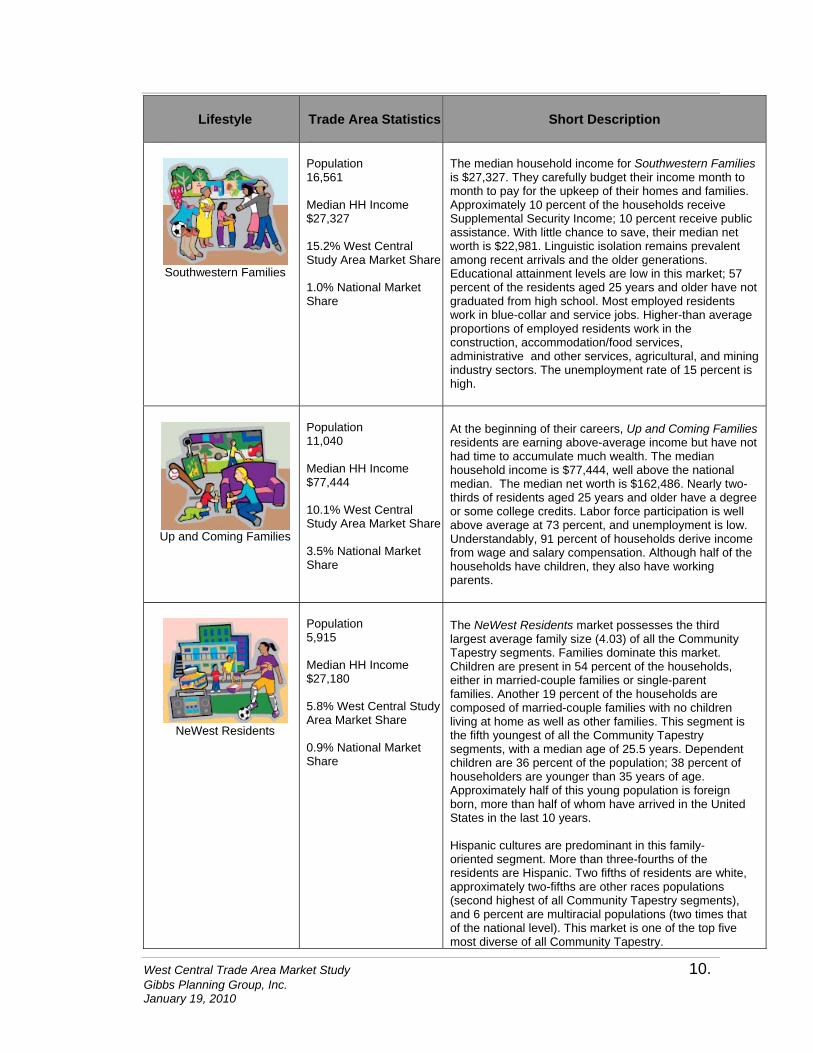
Southwestern Families
Population 16,561 Median HH Income $27,327 15.2% West Central Study Area Market Share 1.0% National Market Share
The median household income for Southwestern Families is $27,327. They carefully budget their income month to month to pay for the upkeep of their homes and families. Approximately 10 percent of the households receive Supplemental Security Income; 10 percent receive public assistance. With little chance to save, their median net worth is $22,981. Linguistic isolation remains prevalent among recent arrivals and the older generations. Educational attainment levels are low in this market; 57 percent of the residents aged 25 years and older have not graduated from high school. Most employed residents work in blue-collar and service jobs. Higher-than average proportions of employed residents work in the construction, accommodation/food services, administrative and other services, agricultural, and mining industry sectors. The unemployment rate of 15 percent is high.
Up and Coming Families
Population 11,040 Median HH Income $77,444 10.1% West Central Study Area Market Share 3.5% National Market Share
At the beginning of their careers, Up and Coming Families residents are earning above-average income but have not had time to accumulate much wealth. The median household income is $77,444, well above the national median. The median net worth is $162,486. Nearly two-thirds of residents aged 25 years and older have a degree or some college credits. Labor force participation is well above average at 73 percent, and unemployment is low. Understandably, 91 percent of households derive income from wage and salary compensation. Although half of the households have children, they also have working parents.
NeWest Residents
Population 5,915 Median HH Income $27,180 5.8% West Central Study Area Market Share 0.9% National Market Share
The NeWest Residents market possesses the third largest average family size (4.03) of all the Community Tapestry segments. Families dominate this market. Children are present in 54 percent of the households, either in married-couple families or single-parent families. Another 19 percent of the households are composed of married-couple families with no children living at home as well as other families. This segment is the fifth youngest of all the Community Tapestry segments, with a median age of 25.5 years. Dependent children are 36 percent of the population; 38 percent of householders are younger than 35 years of age. Approximately half of this young population is foreign born, more than half of whom have arrived in the United States in the last 10 years. Hispanic cultures are predominant in this family-oriented segment. More than three-fourths of the residents are Hispanic. Two fifths of residents are white, approximately two-fifths are other races populations (second highest of all Community Tapestry segments), and 6 percent are multiracial populations (two times that of the national level). This market is one of the top five most diverse of all Community Tapestry.
West Central Trade Area Market Study 11. Gibbs Planning Group, Inc. January 19, 2010
Lifestyle
Trade Area Statistics
Short Description
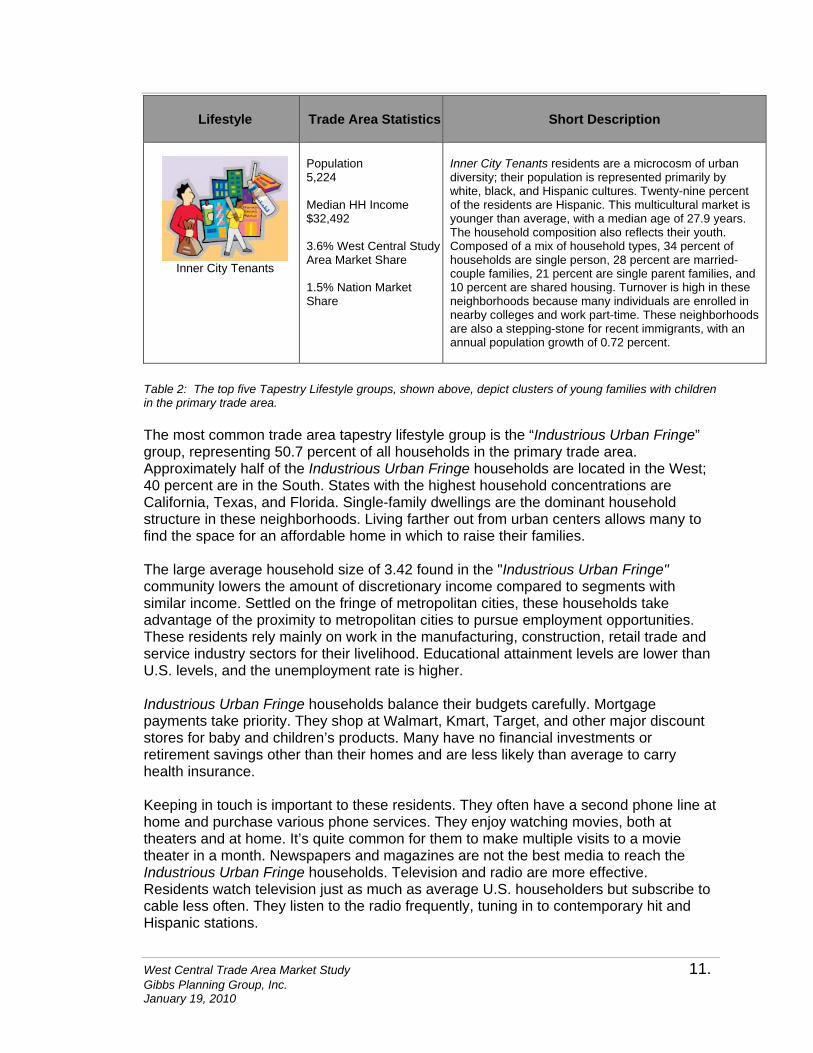
Inner City Tenants
Population 5,224 Median HH Income $32,492 3.6% West Central Study Area Market Share 1.5% Nation Market Share
Inner City Tenants residents are a microcosm of urban diversity; their population is represented primarily by white, black, and Hispanic cultures. Twenty-nine percent of the residents are Hispanic. This multicultural market is younger than average, with a median age of 27.9 years. The household composition also reflects their youth. Composed of a mix of household types, 34 percent of households are single person, 28 percent are married-couple families, 21 percent are single parent families, and 10 percent are shared housing. Turnover is high in these neighborhoods because many individuals are enrolled in nearby colleges and work part-time. These neighborhoods are also a stepping-stone for recent immigrants, with an annual population growth of 0.72 percent.
Table 2: The top five Tapestry Lifestyle groups, shown above, depict clusters of young families with children in the primary trade area. The most common trade area tapestry lifestyle group is the “Industrious Urban Fringe” group, representing 50.7 percent of all households in the primary trade area. Approximately half of the Industrious Urban Fringe households are located in the West; 40 percent are in the South. States with the highest household concentrations are California, Texas, and Florida. Single-family dwellings are the dominant household structure in these neighborhoods. Living farther out from urban centers allows many to find the space for an affordable home in which to raise their families. The large average household size of 3.42 found in the "Industrious Urban Fringe" community lowers the amount of discretionary income compared to segments with similar income. Settled on the fringe of metropolitan cities, these households take advantage of the proximity to metropolitan cities to pursue employment opportunities. These residents rely mainly on work in the manufacturing, construction, retail trade and service industry sectors for their livelihood. Educational attainment levels are lower than U.S. levels, and the unemployment rate is higher. Industrious Urban Fringe households balance their budgets carefully. Mortgage payments take priority. They shop at Walmart, Kmart, Target, and other major discount stores for baby and children’s products. Many have no financial investments or retirement savings other than their homes and are less likely than average to carry health insurance. Keeping in touch is important to these residents. They often have a second phone line at home and purchase various phone services. They enjoy watching movies, both at theaters and at home. It’s quite common for them to make multiple visits to a movie theater in a month. Newspapers and magazines are not the best media to reach the Industrious Urban Fringe households. Television and radio are more effective. Residents watch television just as much as average U.S. householders but subscribe to cable less often. They listen to the radio frequently, tuning in to contemporary hit and Hispanic stations.
West Central Trade Area Market Study 12. Gibbs Planning Group, Inc. January 19, 2010
The Industrious Urban Fringe household seeks value-orientated retailers such as dollar stores, Walmart, and Payless shoes to meet the pressing demands of their large households. They tend to also prepare most meals at home, and are price sensitive when shopping for groceries. They dine out less often than average households, but when they do dine out, they seek fast food, pizza or value- orientated family style restaurants.
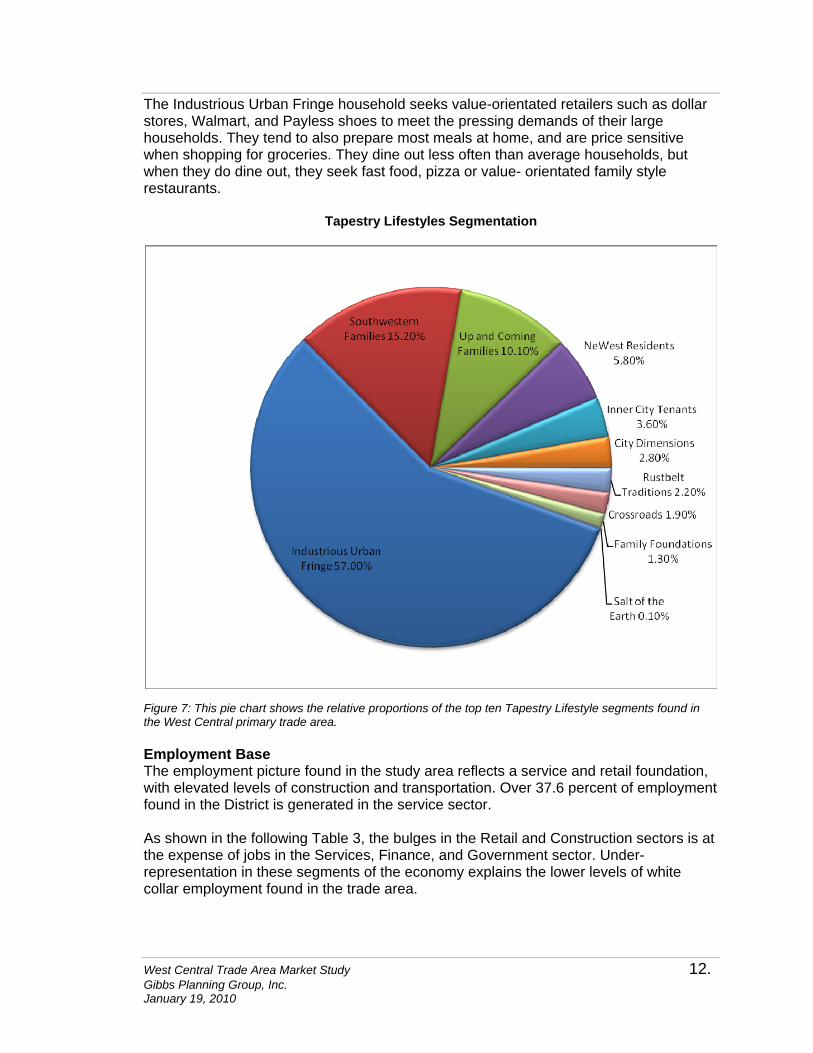
Tapestry Lifestyles Segmentation
Figure 7: This pie chart shows the relative proportions of the top ten Tapestry Lifestyle segments found in the West Central primary trade area. Employment Base The employment picture found in the study area reflects a service and retail foundation, with elevated levels of construction and transportation. Over 37.6 percent of employment found in the District is generated in the service sector. As shown in the following Table 3, the bulges in the Retail and Construction sectors is at the expense of jobs in the Services, Finance, and Government sector. Under- representation in these segments of the economy explains the lower levels of white collar employment found in the trade area.
West Central Trade Area Market Study 13. Gibbs Planning Group, Inc. January 19, 2010
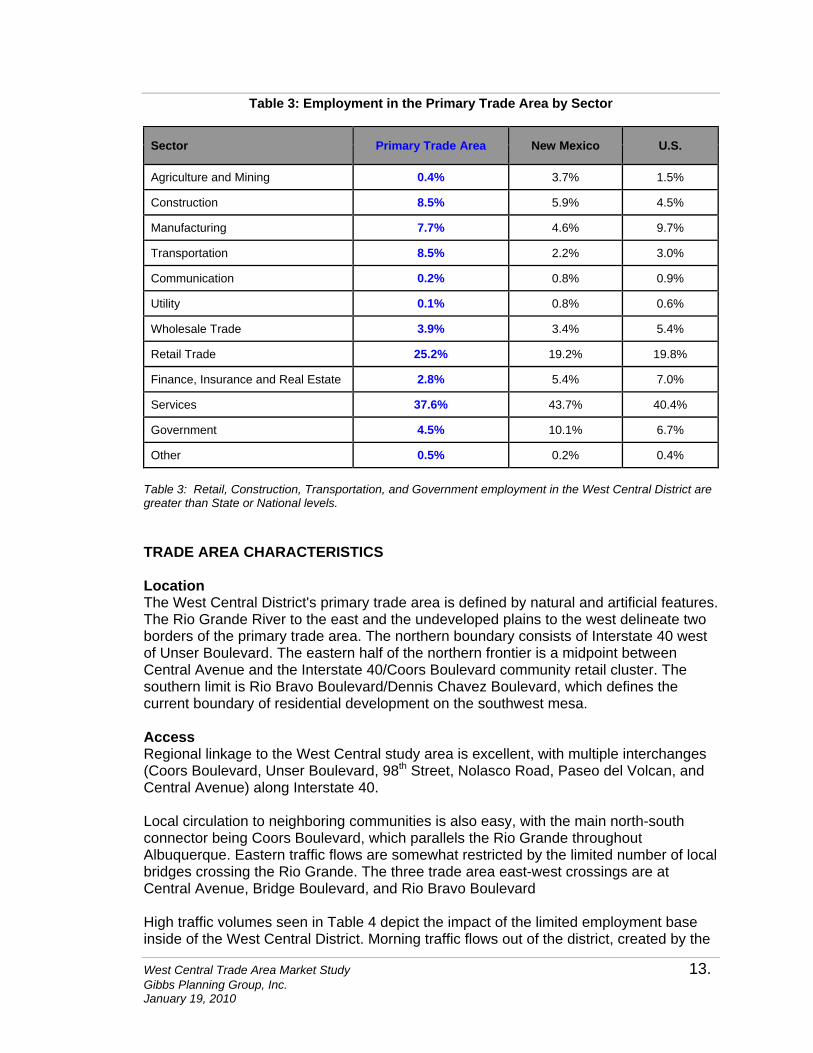
Table 3: Employment in the Primary Trade Area by Sector
Sector Primary Trade Area New Mexico U.S.
Agriculture and Mining 0.4% 3.7% 1.5%
Construction 8.5% 5.9% 4.5%
Manufacturing 7.7% 4.6% 9.7%
Transportation 8.5% 2.2% 3.0%
Communication 0.2% 0.8% 0.9%
Utility 0.1% 0.8% 0.6%
Wholesale Trade 3.9% 3.4% 5.4%
Retail Trade 25.2% 19.2% 19.8%
Finance, Insurance and Real Estate 2.8% 5.4% 7.0%
Services 37.6% 43.7% 40.4%
Government 4.5% 10.1% 6.7%
Other 0.5% 0.2% 0.4%
Table 3: Retail, Construction, Transportation, and Government employment in the West Central District are greater than State or National levels. TRADE AREA CHARACTERISTICS Location The West Central District's primary trade area is defined by natural and artificial features. The Rio Grande River to the east and the undeveloped plains to the west delineate two borders of the primary trade area. The northern boundary consists of Interstate 40 west of Unser Boulevard. The eastern half of the northern frontier is a midpoint between Central Avenue and the Interstate 40/Coors Boulevard community retail cluster. The southern limit is Rio Bravo Boulevard/Dennis Chavez Boulevard, which defines the current boundary of residential development on the southwest mesa. Access Regional linkage to the West Central study area is excellent, with multiple interchanges (Coors Boulevard, Unser Boulevard, 98th Street, Nolasco Road, Paseo del Volcan, and Central Avenue) along Interstate 40. Local circulation to neighboring communities is also easy, with the main north-south connector being Coors Boulevard, which parallels the Rio Grande throughout Albuquerque. Eastern traffic flows are somewhat restricted by the limited number of local bridges crossing the Rio Grande. The three trade area east-west crossings are at Central Avenue, Bridge Boulevard, and Rio Bravo Boulevard High traffic volumes seen in Table 4 depict the impact of the limited employment base inside of the West Central District. Morning traffic flows out of the district, created by the
West Central Trade Area Market Study 14. Gibbs Planning Group, Inc. January 19, 2010
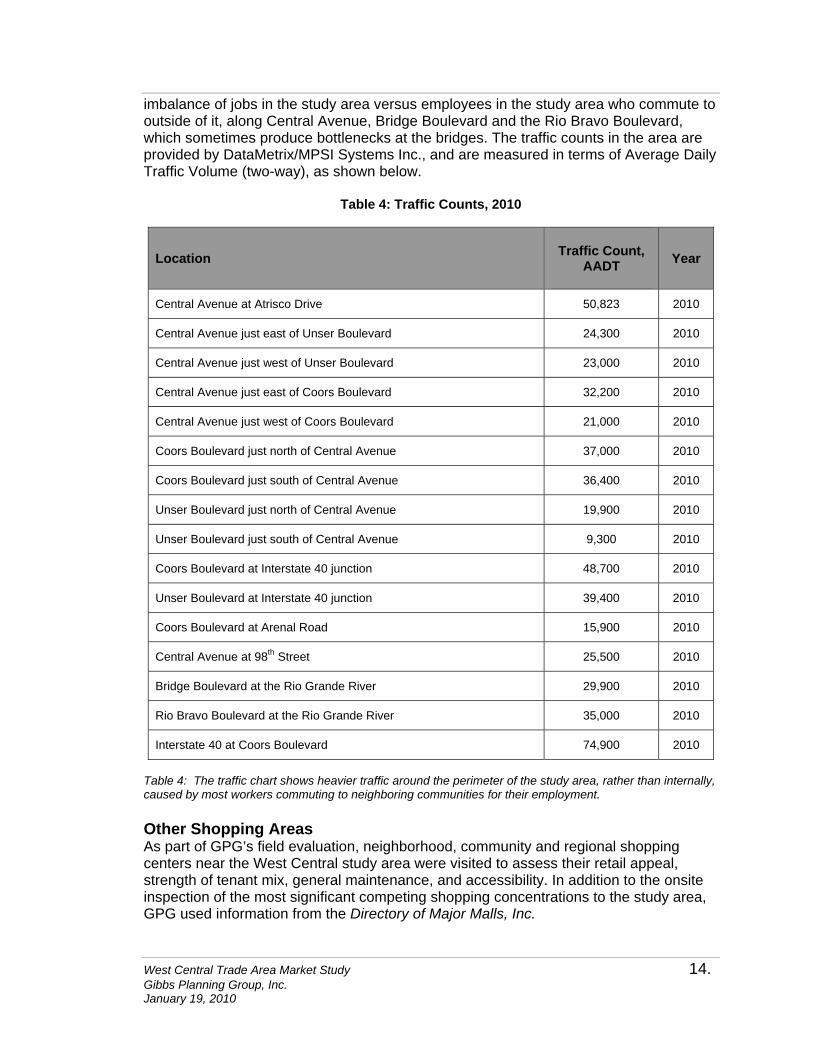
imbalance of jobs in the study area versus employees in the study area who commute to outside of it, along Central Avenue, Bridge Boulevard and the Rio Bravo Boulevard, which sometimes produce bottlenecks at the bridges. The traffic counts in the area are provided by DataMetrix/MPSI Systems Inc., and are measured in terms of Average Daily Traffic Volume (two-way), as shown below.
Table 4: Traffic Counts, 2010
Location
Traffic Count, AADT
Year
Central Avenue at Atrisco Drive 50,823 2010
Central Avenue just east of Unser Boulevard 24,300 2010
Central Avenue just west of Unser Boulevard 23,000 2010
Central Avenue just east of Coors Boulevard 32,200 2010
Central Avenue just west of Coors Boulevard 21,000 2010
Coors Boulevard just north of Central Avenue 37,000 2010
Coors Boulevard just south of Central Avenue 36,400 2010
Unser Boulevard just north of Central Avenue 19,900 2010
Unser Boulevard just south of Central Avenue 9,300 2010
Coors Boulevard at Interstate 40 junction 48,700 2010
Unser Boulevard at Interstate 40 junction 39,400 2010
Coors Boulevard at Arenal Road 15,900 2010
Central Avenue at 98th Street 25,500 2010
Bridge Boulevard at the Rio Grande River 29,900 2010
Rio Bravo Boulevard at the Rio Grande River 35,000 2010
Interstate 40 at Coors Boulevard 74,900 2010
Table 4: The traffic chart shows heavier traffic around the perimeter of the study area, rather than internally, caused by most workers commuting to neighboring communities for their employment. Other Shopping Areas As part of GPG’s field evaluation, neighborhood, community and regional shopping centers near the West Central study area were visited to assess their retail appeal, strength of tenant mix, general maintenance, and accessibility. In addition to the onsite inspection of the most significant competing shopping concentrations to the study area, GPG used information from the Directory of Major Malls, Inc.
West Central Trade Area Market Study 15. Gibbs Planning Group, Inc. January 19, 2010
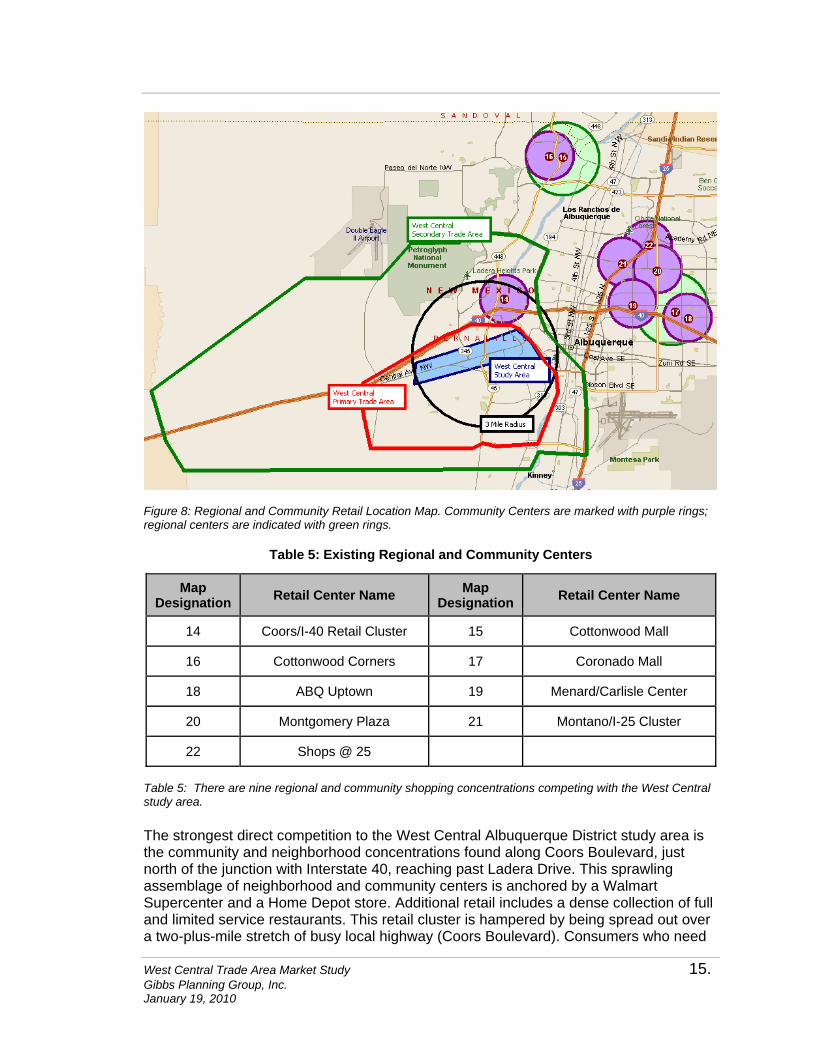
Figure 8: Regional and Community Retail Location Map. Community Centers are marked with purple rings; regional centers are indicated with green rings.
Table 5: Existing Regional and Community Centers
Table 5: There are nine regional and community shopping concentrations competing with the West Central study area. The strongest direct competition to the West Central Albuquerque District study area is the community and neighborhood concentrations found along Coors Boulevard, just north of the junction with Interstate 40, reaching past Ladera Drive. This sprawling assemblage of neighborhood and community centers is anchored by a Walmart Supercenter and a Home Depot store. Additional retail includes a dense collection of full and limited service restaurants. This retail cluster is hampered by being spread out over a two-plus-mile stretch of busy local highway (Coors Boulevard). Consumers who need
Map Designation Retail Center Name Map
Designation Retail Center Name
14 Coors/I-40 Retail Cluster 15 Cottonwood Mall
16 Cottonwood Corners 17 Coronado Mall
18 ABQ Uptown 19 Menard/Carlisle Center
20 Montgomery Plaza 21 Montano/I-25 Cluster
22 Shops @ 25
West Central Trade Area Market Study 16. Gibbs Planning Group, Inc. January 19, 2010
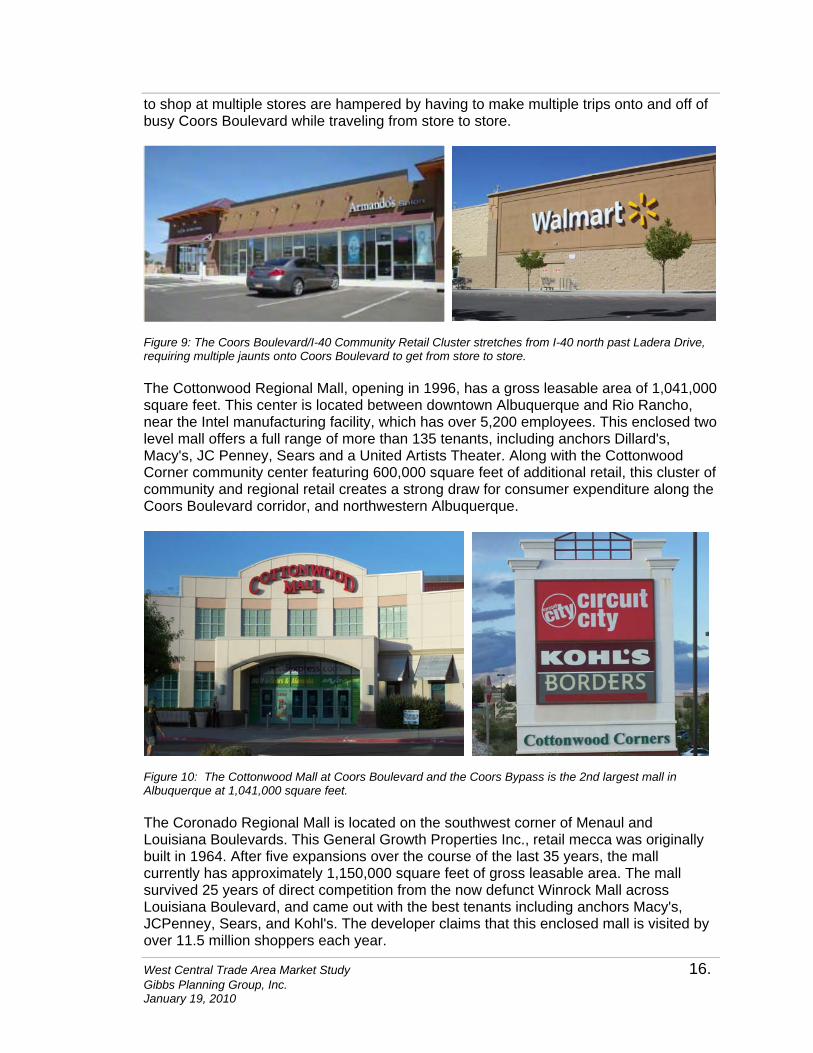
to shop at multiple stores are hampered by having to make multiple trips onto and off of busy Coors Boulevard while traveling from store to store.
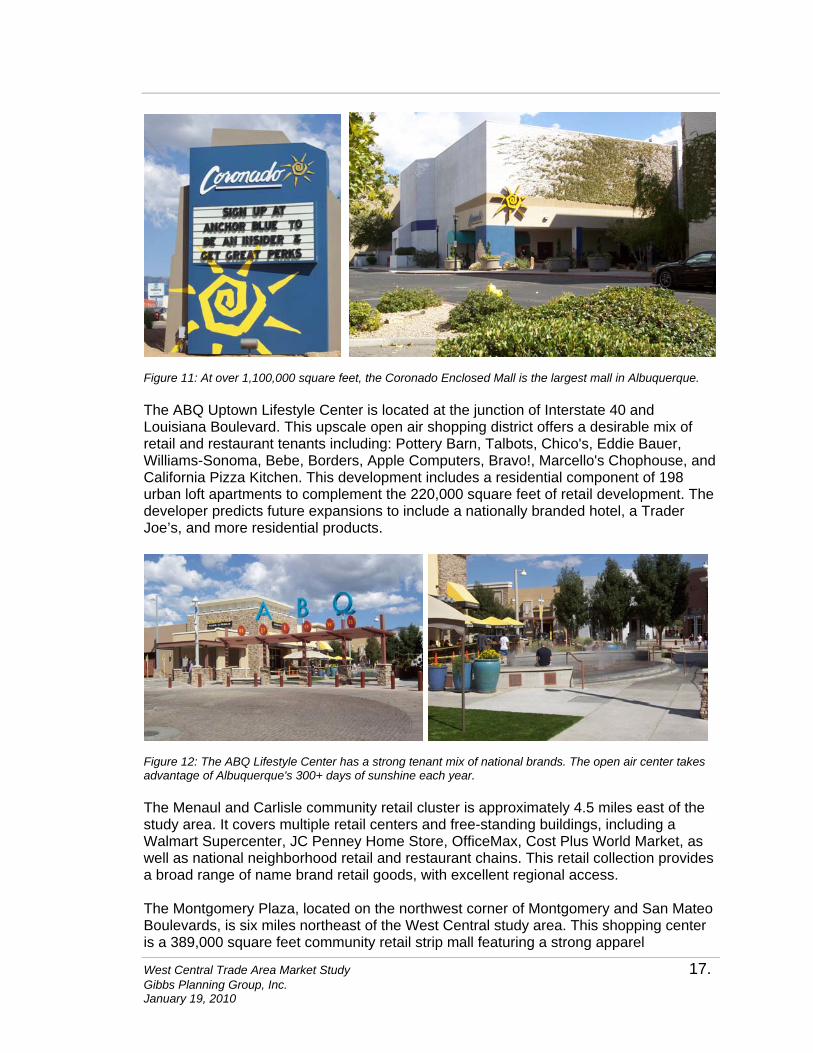
Figure 9: The Coors Boulevard/I-40 Community Retail Cluster stretches from I-40 north past Ladera Drive, requiring multiple jaunts onto Coors Boulevard to get from store to store. The Cottonwood Regional Mall, opening in 1996, has a gross leasable area of 1,041,000 square feet. This center is located between downtown Albuquerque and Rio Rancho, near the Intel manufacturing facility, which has over 5,200 employees. This enclosed two level mall offers a full range of more than 135 tenants, including anchors Dillard's, Macy's, JC Penney, Sears and a United Artists Theater. Along with the Cottonwood Corner community center featuring 600,000 square feet of additional retail, this cluster of community and regional retail creates a strong draw for consumer expenditure along the Coors Boulevard corridor, and northwestern Albuquerque.
Figure 10: The Cottonwood Mall at Coors Boulevard and the Coors Bypass is the 2nd largest mall in Albuquerque at 1,041,000 square feet. The Coronado Regional Mall is located on the southwest corner of Menaul and Louisiana Boulevards. This General Growth Properties Inc., retail mecca was originally built in 1964. After five expansions over the course of the last 35 years, the mall currently has approximately 1,150,000 square feet of gross leasable area. The mall survived 25 years of direct competition from the now defunct Winrock Mall across Louisiana Boulevard, and came out with the best tenants including anchors Macy's, JCPenney, Sears, and Kohl's. The developer claims that this enclosed mall is visited by over 11.5 million shoppers each year.
West Central Trade Area Market Study 17. Gibbs Planning Group, Inc. January 19, 2010
Figure 11: At over 1,100,000 square feet, the Coronado Enclosed Mall is the largest mall in Albuquerque. The ABQ Uptown Lifestyle Center is located at the junction of Interstate 40 and Louisiana Boulevard. This upscale open air shopping district offers a desirable mix of retail and restaurant tenants including: Pottery Barn, Talbots, Chico's, Eddie Bauer, Williams-Sonoma, Bebe, Borders, Apple Computers, Bravo!, Marcello's Chophouse, and California Pizza Kitchen. This development includes a residential component of 198 urban loft apartments to complement the 220,000 square feet of retail development. The developer predicts future expansions to include a nationally branded hotel, a Trader Joe’s, and more residential products.
Figure 12: The ABQ Lifestyle Center has a strong tenant mix of national brands. The open air center takes advantage of Albuquerque's 300+ days of sunshine each year. The Menaul and Carlisle community retail cluster is approximately 4.5 miles east of the study area. It covers multiple retail centers and free-standing buildings, including a Walmart Supercenter, JC Penney Home Store, OfficeMax, Cost Plus World Market, as well as national neighborhood retail and restaurant chains. This retail collection provides a broad range of name brand retail goods, with excellent regional access. The Montgomery Plaza, located on the northwest corner of Montgomery and San Mateo Boulevards, is six miles northeast of the West Central study area. This shopping center is a 389,000 square feet community retail strip mall featuring a strong apparel
West Central Trade Area Market Study 18. Gibbs Planning Group, Inc. January 19, 2010
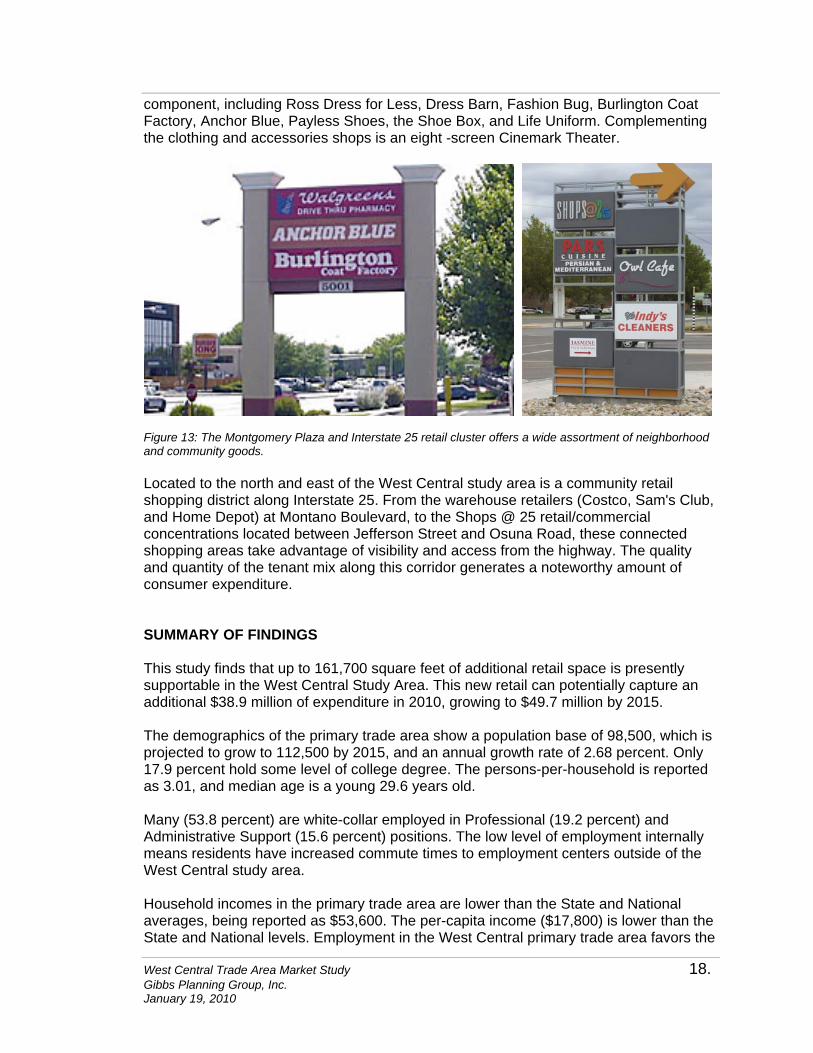
component, including Ross Dress for Less, Dress Barn, Fashion Bug, Burlington Coat Factory, Anchor Blue, Payless Shoes, the Shoe Box, and Life Uniform. Complementing the clothing and accessories shops is an eight -screen Cinemark Theater.
Figure 13: The Montgomery Plaza and Interstate 25 retail cluster offers a wide assortment of neighborhood and community goods. Located to the north and east of the West Central study area is a community retail shopping district along Interstate 25. From the warehouse retailers (Costco, Sam's Club, and Home Depot) at Montano Boulevard, to the Shops @ 25 retail/commercial concentrations located between Jefferson Street and Osuna Road, these connected shopping areas take advantage of visibility and access from the highway. The quality and quantity of the tenant mix along this corridor generates a noteworthy amount of consumer expenditure. SUMMARY OF FINDINGS This study finds that up to 161,700 square feet of additional retail space is presently supportable in the West Central Study Area. This new retail can potentially capture an additional $38.9 million of expenditure in 2010, growing to $49.7 million by 2015. The demographics of the primary trade area show a population base of 98,500, which is projected to grow to 112,500 by 2015, and an annual growth rate of 2.68 percent. Only 17.9 percent hold some level of college degree. The persons-per-household is reported as 3.01, and median age is a young 29.6 years old. Many (53.8 percent) are white-collar employed in Professional (19.2 percent) and Administrative Support (15.6 percent) positions. The low level of employment internally means residents have increased commute times to employment centers outside of the West Central study area. Household incomes in the primary trade area are lower than the State and National averages, being reported as $53,600. The per-capita income ($17,800) is lower than the State and National levels. Employment in the West Central primary trade area favors the

West Central Trade Area Market Study 19. Gibbs Planning Group, Inc. January 19, 2010
Construction, Transportation, and Retail Trade sectors, while being weak in the Government, Service, and Finance, Insurance and Real Estate categories. Tapestry lifestyles in the market reflect a majority base of “Industrious Urban Fringe” households. Family is central to Industrious Urban Fringe neighborhoods. Slightly more than half of these households have children. Married-couple families (54 percent of households) and single-parent families (17 percent) comprise most of these households. Multigenerational households are relatively common. The comparatively low median age of 28.5 years reflects the high proportion of children. Approximately 57 percent of these residents are Hispanic. More than one fourth of the residents are foreign born, bringing rich, diverse cultures to these urban outskirt neighborhoods.
Supportable 2010 Retail and Potential Tenants
• 66,500 square feet Department and Discount Department Stores:
Discount Department Stores make up approximately 60 percent of the new growth in this category in the United States. Beall's Outlet Stores or a Beall's/Stage Department store has not made it to the Albuquerque market yet, but currently have five locations in the state of New Mexico. Other potential retailers include: Sears, Bed Bath & Beyond, Kohl's, JC Penney, or the Stage Stores, Inc.
• 16,300 square feet of Electronics, Appliances, & Computer retail: Over half of the supportable retail square footage in this category is found in Appliance Retail. Possible retailers include: SAS Appliance, Ultimate Electronics, Aaron's Inc., Radio Shack Corp., and The Kitchen Collection. The new supportable space projected in the retail class could be adapted into existing buildings, or as tenants in new development
• 15,300 square feet of Food & Restaurant: Approximately two thirds of this class is found in the Limited Service Restaurant (without alcohol) group. Potential tenants looking in the New Mexico market are: Arby's, Buffalo Wild Wing, Inc., Dos Hermanos, the Original SoupMan, Romano's Macaroni Grill Inc., Jimmy John's Franchise, LLC, and Tim Horton's, Inc. This Food & Restaurant space could easily and quickly fit into existing vacant space in the West Central corridor.
• 12,900 square feet of Sporting Goods, Hobby, Books, and Music Stores:
This retail group is spearheaded by the Books & Music subcategory. Prospective retailers include: Books-a-Million, Berean Christian Stores, Hobby Lobby Stores, The Book Rack, Jo-Ann Stores, Inc., Learning Express, Westcroft Beadworks, Inc., Hancock Fabrics, Inc., Guitar Center, Inc., or Logos Bookstores, Inc. This additional retail space could be split into existing West Central vacant buildings.
• 12,200 square feet of Health Care & Personal Services: Drug Stores make
up half of this class of retail potential. Possible retailers include: Medicap Pharmacies, Inc., Emerging Vision, Inc., Medicine Shoppe International, Inc., Pharmaca Integrative Pharmacy, Inc., Eye Care Centers of America, Sally Beauty Holdings, Inc., Aveda Corporation, or Crabtree & Evelyn, Ltd.
West Central Trade Area Market Study 20. Gibbs Planning Group, Inc. January 19, 2010
Pharmacies now require drive thru windows, so it is likely that this space will need new development.
• 11,700 square feet of Apparel, Shoes and Accessories: All subgroups of this broad NAICS type are in demand - women's, men's, children's, and unisex apparel, as well as a shoe store. Potential retailers include: Bon Worth Factory Outlets, Dress Barn, Casual Male, Haggar Clothing, totes Isotoner Corporation, Red Wing Shoe Co., Life Uniform, the Men's Wearhouse, Naturalizer Retail, Anchor Blue Retail Group, or Foot Solutions, Inc. New space required for this category could be existing vacant properties.
• 11,300 square feet of Hardware, Lawn and Garden Stores: All of this
category’s potential is found in Building Materials and Supplies retail. Feasible tenants are: Do it Best Corp, True Value Co., Ace Hardware Corporation, or California Closets. Building Materials/Supplies companies often need outdoor storage, so existing property with the necessary zoning would be required.
• 7,700 square feet of Miscellaneous Retail: Miscellaneous retail includes office supplies, gift shops, pet supplies, florists, and tobacco supplies. Suggested retailers are: Hallmark Gold Crown Stores, Petland, Inc., The Cigarette Store Corp., Smoker Friendly International, Wild Birds Unlimited, Flowerama of America, and Party Land, Inc. The small users proposed in this category would fit easily into existing retail development.
• 6,200 square feet of Home Furnishings: Eighty percent of the Home
Furnishings retail should be in the furniture niche. Retailers include The Mattress Firm, Inc., Kirkland's, Inc., Relax the Back Corporation, 3 Day Blinds, Inc., Cort Business Services, and LoveSac Alternative Furniture Co. Home Furnishings space could be easily adapted into an existing building.
• 1,600 square feet of Food and Beverage Stores: All of this supportable square footage can be concentrated into the convenience food category. Possible retailers include: 7-Eleven, Inc., Pic Quik Stores, Inc., Southwest Convenience Stores, LLC, or Sunmart, Inc. The additional needs of this category could be met by new development or existing buildings.
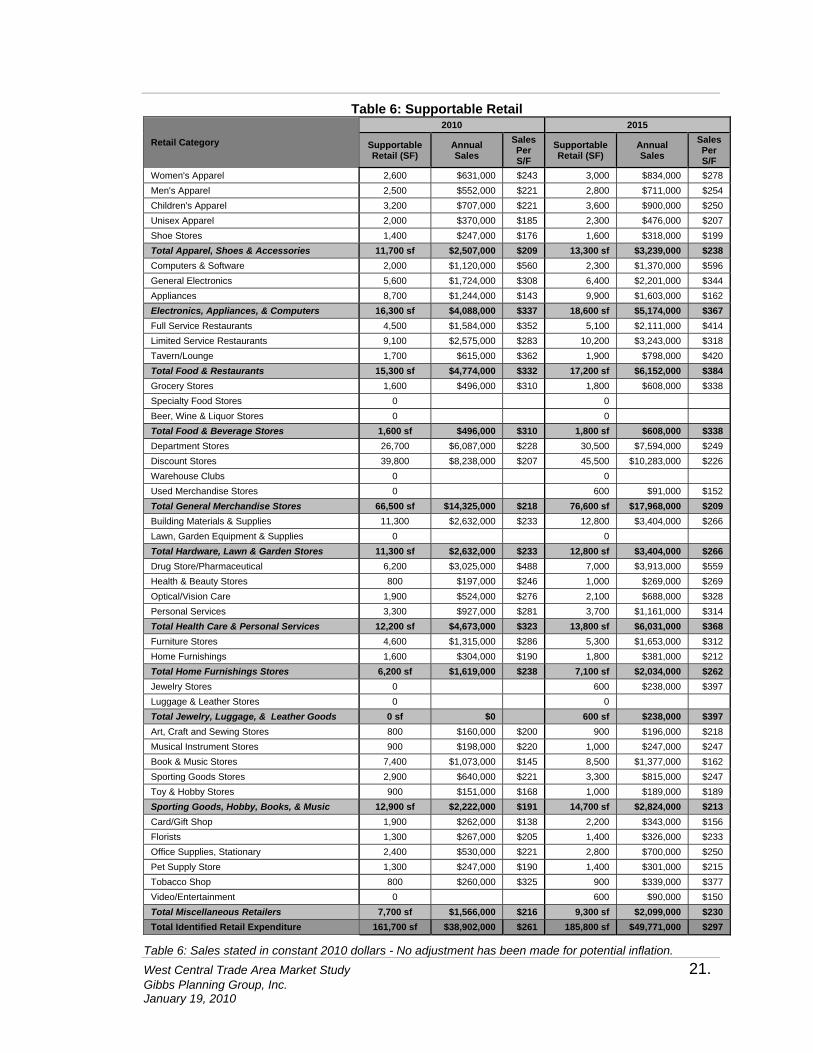
A detailed examination of the supportable square footage of retail uses can be found in Table 6.
West Central Trade Area Market Study 21. Gibbs Planning Group, Inc. January 19, 2010
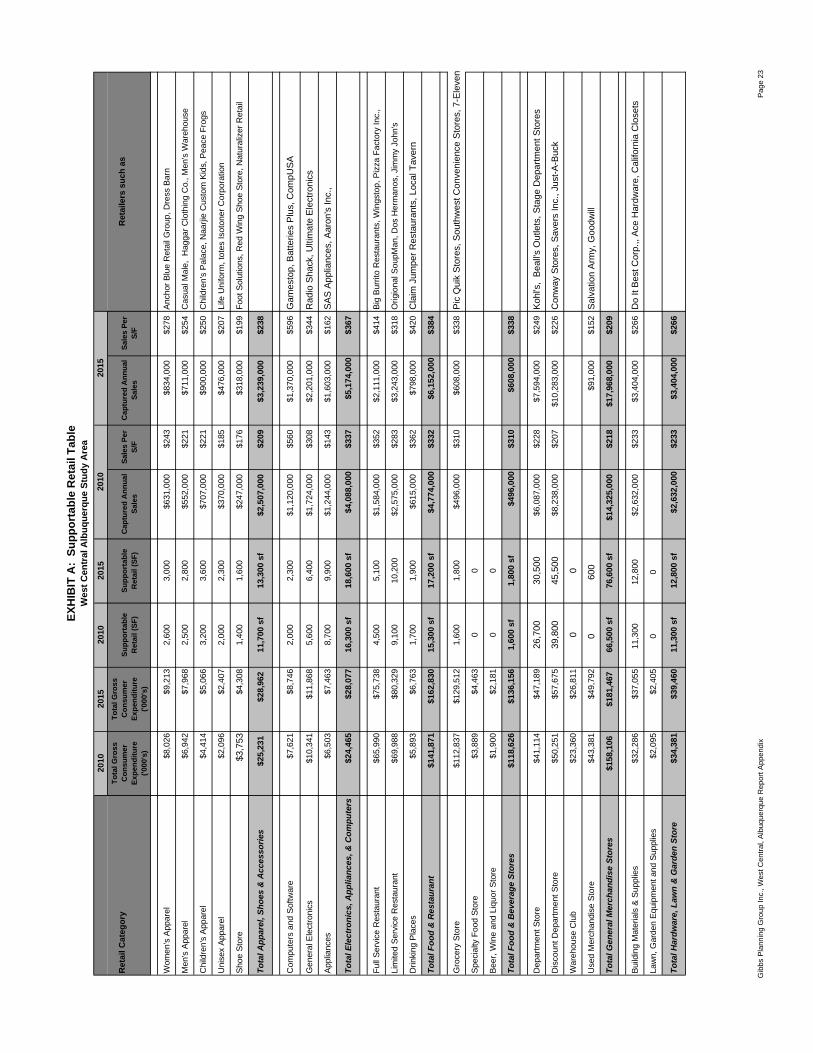
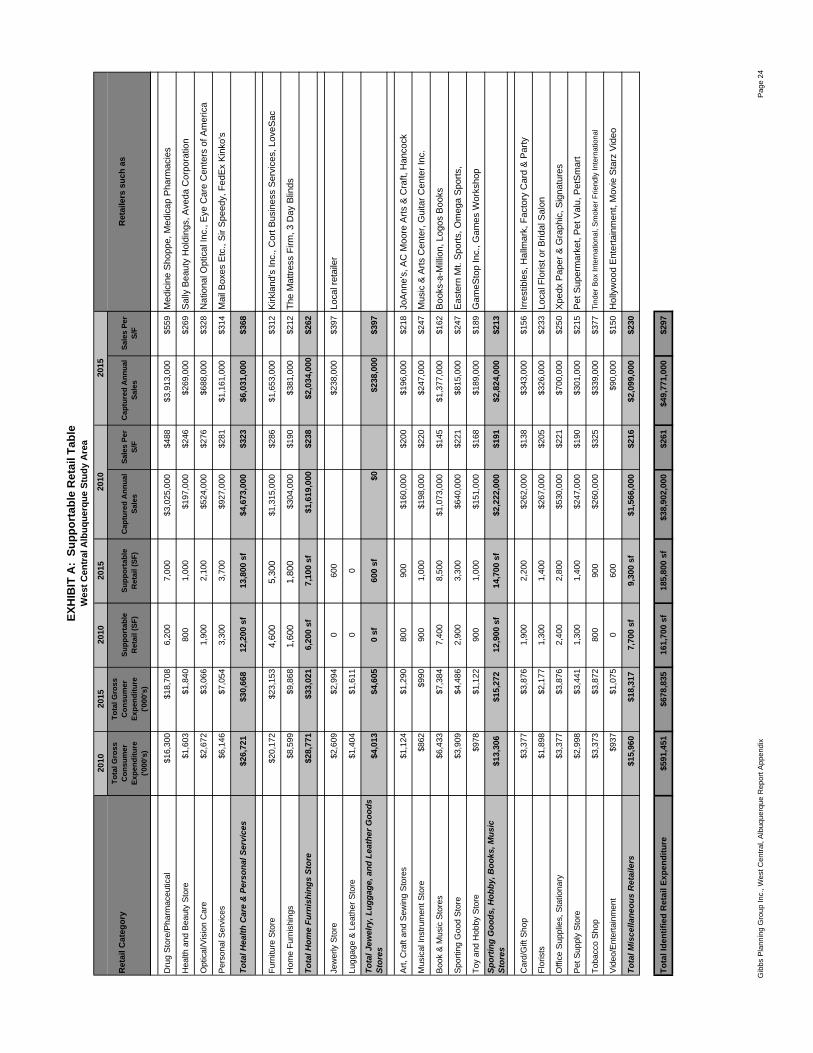
Table 6: Supportable Retail
Retail Category
2010 2015
Supportable Retail (SF)
Annual Sales
Sales Per S/F
Supportable Retail (SF)
Annual Sales
Sales Per S/F
Women's Apparel 2,600 $631,000 $243 3,000 $834,000 $278 Men's Apparel 2,500 $552,000 $221 2,800 $711,000 $254 Children's Apparel 3,200 $707,000 $221 3,600 $900,000 $250 Unisex Apparel 2,000 $370,000 $185 2,300 $476,000 $207 Shoe Stores 1,400 $247,000 $176 1,600 $318,000 $199 Total Apparel, Shoes & Accessories 11,700 sf $2,507,000 $209 13,300 sf $3,239,000 $238 Computers & Software 2,000 $1,120,000 $560 2,300 $1,370,000 $596 General Electronics 5,600 $1,724,000 $308 6,400 $2,201,000 $344 Appliances 8,700 $1,244,000 $143 9,900 $1,603,000 $162 Electronics, Appliances, & Computers 16,300 sf $4,088,000 $337 18,600 sf $5,174,000 $367 Full Service Restaurants 4,500 $1,584,000 $352 5,100 $2,111,000 $414 Limited Service Restaurants 9,100 $2,575,000 $283 10,200 $3,243,000 $318 Tavern/Lounge 1,700 $615,000 $362 1,900 $798,000 $420 Total Food & Restaurants 15,300 sf $4,774,000 $332 17,200 sf $6,152,000 $384 Grocery Stores 1,600 $496,000 $310 1,800 $608,000 $338 Specialty Food Stores 0 0 Beer, Wine & Liquor Stores 0 0 Total Food & Beverage Stores 1,600 sf $496,000 $310 1,800 sf $608,000 $338 Department Stores 26,700 $6,087,000 $228 30,500 $7,594,000 $249 Discount Stores 39,800 $8,238,000 $207 45,500 $10,283,000 $226 Warehouse Clubs 0 0 Used Merchandise Stores 0 600 $91,000 $152 Total General Merchandise Stores 66,500 sf $14,325,000 $218 76,600 sf $17,968,000 $209 Building Materials & Supplies 11,300 $2,632,000 $233 12,800 $3,404,000 $266 Lawn, Garden Equipment & Supplies 0 0 Total Hardware, Lawn & Garden Stores 11,300 sf $2,632,000 $233 12,800 sf $3,404,000 $266 Drug Store/Pharmaceutical 6,200 $3,025,000 $488 7,000 $3,913,000 $559 Health & Beauty Stores 800 $197,000 $246 1,000 $269,000 $269 Optical/Vision Care 1,900 $524,000 $276 2,100 $688,000 $328 Personal Services 3,300 $927,000 $281 3,700 $1,161,000 $314 Total Health Care & Personal Services 12,200 sf $4,673,000 $323 13,800 sf $6,031,000 $368 Furniture Stores 4,600 $1,315,000 $286 5,300 $1,653,000 $312 Home Furnishings 1,600 $304,000 $190 1,800 $381,000 $212 Total Home Furnishings Stores 6,200 sf $1,619,000 $238 7,100 sf $2,034,000 $262 Jewelry Stores 0 600 $238,000 $397 Luggage & Leather Stores 0 0 Total Jewelry, Luggage, & Leather Goods 0 sf $0 600 sf $238,000 $397 Art, Craft and Sewing Stores 800 $160,000 $200 900 $196,000 $218 Musical Instrument Stores 900 $198,000 $220 1,000 $247,000 $247 Book & Music Stores 7,400 $1,073,000 $145 8,500 $1,377,000 $162 Sporting Goods Stores 2,900 $640,000 $221 3,300 $815,000 $247 Toy & Hobby Stores 900 $151,000 $168 1,000 $189,000 $189 Sporting Goods, Hobby, Books, & Music 12,900 sf $2,222,000 $191 14,700 sf $2,824,000 $213 Card/Gift Shop 1,900 $262,000 $138 2,200 $343,000 $156 Florists 1,300 $267,000 $205 1,400 $326,000 $233 Office Supplies, Stationary 2,400 $530,000 $221 2,800 $700,000 $250 Pet Supply Store 1,300 $247,000 $190 1,400 $301,000 $215 Tobacco Shop 800 $260,000 $325 900 $339,000 $377 Video/Entertainment 0 600 $90,000 $150 Total Miscellaneous Retailers 7,700 sf $1,566,000 $216 9,300 sf $2,099,000 $230 Total Identified Retail Expenditure 161,700 sf $38,902,000 $261 185,800 sf $49,771,000 $297
Table 6: Sales stated in constant 2010 dollars - No adjustment has been made for potential inflation.
West Central Trade Area Market Study 22. Gibbs Planning Group, Inc. January 19, 2010
Rationale The rationale for the findings in this study follows:
Strong demographic growth: Although average and median household
incomes are modest, the annual growth rate of 2.68 percent equates into a total growth rate of 14.1 percent. Regardless of disposable income levels, the growing base of households in the primary study area needs daily goods.
Existing retail infrastructure development: The suddenness of the 2008
housing crisis and the 2009 financial crisis stopped residential and retail development in its tracks in the West Central District. This study area can fill first generation tenant space overnight at the neighborhood retail centers on Unser Boulevard and Central Avenue, or begin construction of warehouse retailers without the delay of acquisition, approval, demolition, and infrastructure development.
Single site critical mass development: The West Central District’s potential availability of a large, single site development, such as Unser Crossing, if built by an experienced shopping center developer, will likely attract new retailers to the market. In addition, existing retailers presently located along Coors Boulevard seeking to expand may consider relocating into new or infill West Central District shopping centers.
Access to Surrounding Neighborhoods: Although the West Central District is not located directly along Interstate 40, its convenience to surrounding neighborhoods will appeal to numerous modern retailers.
Impacts on Other Business Districts: The implementation of new shopping centers and the opening of new types of retailers that are not presently located in the West Central District area will capture projected population growth and household spending that is presently occurring elsewhere in the region, or not at all. This shift in consumer habits will impact existing retailers to various levels, depending on how they respond to the opening of new businesses. In some cases, retailers will expand promotions, as well as their goods and services in response to new competition, resulting in an overall net gain in sales. Others may lose market share and close. Often, the new shopping centers and retailers tap into an unmet consumer market that does not impact the region’s overall sales. This study forecasts that for the most part, the supportable 161,700 square feet of new retail will result in a net gain of up to $38.9 million in restaurant and retail sales. This is not to warrant that some existing business will not experience a net loss in sales.
-- END OF REPORT --
2010
2015
2010
2015
To
tal G
ross
C
on
sum
er
Exp
end
itu
re
('000
's)
To
tal G
ross
C
on
sum
er
Exp
end
itu
re
('000
's)
Su
pp
ort
able
R
etai
l (S
F)
Su
pp
ort
able
R
etai
l (S
F)
Cap
ture
d A
nn
ual
S
ales
Sal
es P
er
S/F
Cap
ture
d A
nn
ual
S
ales
Sal
es P
er
S/F
Wom
en's
App
arel
$8,0
26$9
,213
2,60
03,
000
$631
,000
$243
$834
,000
$278
Anc
hor
Blu
e R
etai
l Gro
up, D
ress
Bar
n
Men
's A
ppar
el$6
,942
$7,9
682,
500
2,80
0$5
52,0
00$2
21$7
11,0
00$2
54C
asua
l Mal
e, H
agga
r C
loth
ing
Co.
, Men
's W
areh
ouse
Chi
ldre
n's
App
arel
$4,4
14$5
,066
3,20
03,
600
$707
,000
$221
$900
,000
$250
Chi
ldre
n's
Pal
ace,
Naa
rjie
Cus
tom
Kid
s, P
eace
Fro
gs
Uni
sex
App
arel
$2,0
96$2
,407
2,00
02,
300
$370
,000
$185
$476
,000
$207
Life
Uni
form
, tot
es Is
oton
er C
orpo
ratio
n
Sho
e S
tore
$3,7
53$4
,308
1,40
01,
600
$247
,000
$176
$318
,000
$199
Foot
Sol
utio
ns, R
ed W
ing
Sho
e S
tore
, Nat
ural
izer
Ret
ail
To
tal A
pp
arel
, Sh
oes
& A
cces
sori
es$2
5,23
1$2
8,96
211
,700
sf
13,3
00 s
f$2
,507
,000
$209
$3,2
39,0
00$2
38
Com
pute
rs a
nd S
oftw
are
$7,6
21$8
,746
2,00
02,
300
$1,1
20,0
00$5
60$1
,370
,000
$596
Gam
esto
p, B
atte
ries
Plu
s, C
ompU
SA
Gen
eral
Ele
ctro
nics
$10,
341
$11,
868
5,60
06,
400
$1,7
24,0
00$3
08$2
,201
,000
$344
Rad
io S
hack
, Ulti
mat
e E
lect
roni
cs
App
lianc
es$6
,503
$7,4
638,
700
9,90
0$1
,244
,000
$143
$1,6
03,0
00$1
62S
AS
App
lianc
es, A
aron
's In
c.,
To
tal E
lect
ron
ics,
Ap
plia
nce
s, &
Co
mp
ute
rs$2
4,46
5$2
8,07
716
,300
sf
18,6
00 s
f$4
,088
,000
$337
$5,1
74,0
00$3
67
Full
Ser
vice
Res
taur
ant
$65,
990
$75,
738
4,50
05,
100
$1,5
84,0
00$3
52$2
,111
,000
$414
Big
Bur
rito
Res
taur
ants
, Win
gsto
p, P
izza
Fac
tory
Inc.
,
Lim
ited
Ser
vice
Res
taur
ant
$69,
988
$80,
329
9,10
010
,200
$2,5
75,0
00$2
83$3
,243
,000
$318
Orig
iona
l Sou
pMan
, Dos
Her
man
os, J
imm
y Jo
hn's
Drin
king
Pla
ces
$5,8
93$6
,763
1,70
01,
900
$615
,000
$362
$798
,000
$420
Cla
im J
umpe
r R
esta
uran
ts, L
ocal
Tav
ern
To
tal F
oo
d &
Res
tau
ran
t$1
41,8
71$1
62,8
3015
,300
sf
17,2
00 s
f$4
,774
,000
$332
$6,1
52,0
00$3
84
Gro
cery
Sto
re$1
12,8
37$1
29,5
121,
600
1,80
0$4
96,0
00$3
10$6
08,0
00$3
38P
ic Q
uik
Sto
res,
Sou
thw
est C
onve
nien
ce S
tore
s, 7
-Ele
ven
Spe
cial
ty F
ood
Sto
re$3
,889
$4,4
630
0
Bee
r, W
ine
and
Liqu
or S
tore
$1,9
00$2
,181
00
To
tal F
oo
d &
Bev
erag
e S
tore
s$1
18,6
26$1
36,1
561,
600
sf1,
800
sf$4
96,0
00$3
10$6
08,0
00$3
38
Dep
artm
ent S
tore
$41,
114
$47,
189
26,7
0030
,500
$6,0
87,0
00$2
28$7
,594
,000
$249
Koh
l's,
Bea
ll's
Out
lets
, Sta
ge D
epar
tmen
t Sto
res
Dis
coun
t Dep
artm
ent S
tore
$50,
251
$57,
675
39,8
0045
,500
$8,2
38,0
00$2
07$1
0,28
3,00
0$2
26C
onw
ay S
tore
s, S
aver
s In
c., J
ust-A
-Buc
k
War
ehou
se C
lub
$23,
360
$26,
811
00
Use
d M
erch
andi
se S
tore
$43,
381
$49,
792
060
0$9
1,00
0$1
52S
alva
tion
Arm
y, G
oodw
ill
To
tal G
ener
al M
erch
and
ise
Sto
res
$158
,106
$181
,467
66,5
00 s
f76
,600
sf
$14,
325,
000
$218
$17,
968,
000
$209
Bui
ldin
g M
ater
ials
& S
uppl
ies
$32,
286
$37,
055
11,3
0012
,800
$2,6
32,0
00$2
33$3
,404
,000
$266
Do
It B
est C
orp.
,, A
ce H
ardw
are,
Cal
iforn
ia C
lose
ts
Law
n, G
arde
n E
quip
men
t and
Sup
plie
s$2
,095
$2,4
050
0
To
tal H
ard
war
e, L
awn
& G
ard
en S
tore
$34,
381
$39,
460
11,3
00 s
f12
,800
sf
$2,6
32,0
00$2
33$3
,404
,000
$266
EX
HIB
IT A
: S
up
po
rtab
le R
etai
l Tab
le
Ret
aile
rs s
uch
as
Ret
ail C
ateg
ory
2010
2015
Wes
t Cen
tral
Alb
uque
rque
Stu
dy A
rea
Gib
bs P
lann
ing
Gro
up In
c., W
est C
entr
al, A
lbuq
uerq
ue R
epor
t App
endi
xP
age
23
2010
2015
2010
2015
To
tal G
ross
C
on
sum
er
Exp
end
itu
re
('000
's)
To
tal G
ross
C
on
sum
er
Exp
end
itu
re
('000
's)
Su
pp
ort
able
R
etai
l (S
F)
Su
pp
ort
able
R
etai
l (S
F)
Cap
ture
d A
nn
ual
S
ales
Sal
es P
er
S/F
Cap
ture
d A
nn
ual
S
ales
Sal
es P
er
S/F
EX
HIB
IT A
: S
up
po
rtab
le R
etai
l Tab
le
Ret
aile
rs s
uch
as
Ret
ail C
ateg
ory
2010
2015
Wes
t Cen
tral
Alb
uque
rque
Stu
dy A
rea
Dru
g S
tore
/Pha
rmac
eutic
al$1
6,30
0$1
8,70
86,
200
7,00
0$3
,025
,000
$488
$3,9
13,0
00$5
59M
edic
ine
Sho
ppe,
Med
icap
Pha
rmac
ies
Hea
lth a
nd B
eaut
y S
tore
$1,6
03$1
,840
800
1,00
0$1
97,0
00$2
46$2
69,0
00$2
69S
ally
Bea
uty
Hol
ding
s, A
veda
Cor
pora
tion
Opt
ical
/Vis
ion
Car
e$2
,672
$3,0
661,
900
2,10
0$5
24,0
00$2
76$6
88,0
00$3
28N
atio
nal O
ptic
al In
c., E
ye C
are
Cen
ters
of A
mer
ica
Per
sona
l Ser
vice
s$6
,146
$7,0
543,
300
3,70
0$9
27,0
00$2
81$1
,161
,000
$314
Mai
l Box
es E
tc.,
Sir
Spe
edy,
Fed
Ex
Kin
ko's
To
tal H
ealth
Car
e &
Per
son
al S
ervi
ces
$26,
721
$30,
668
12,2
00 s
f13
,800
sf
$4,6
73,0
00$3
23$6
,031
,000
$368
Furn
iture
Sto
re$2
0,17
2$2
3,15
34,
600
5,30
0$1
,315
,000
$286
$1,6
53,0
00$3
12K
irkla
nd's
Inc.
, Cor
t Bus
ines
s S
ervi
ces,
Lov
eSac
Hom
e Fu
rnis
hing
s$8
,599
$9,8
681,
600
1,80
0$3
04,0
00$1
90$3
81,0
00$2
12T
he M
attre
ss F
irm, 3
Day
Blin
ds
To
tal H
om
e F
urn
ish
ing
s S
tore
$28,
771
$33,
021
6,20
0 sf
7,10
0 sf
$1,6
19,0
00$2
38$2
,034
,000
$262
Jew
erly
Sto
re$2
,609
$2,9
940
600
$238
,000
$397
Loca
l ret
aile
r
Lugg
age
& L
eath
er S
tore
$1,4
04$1
,611
00
To
tal J
ewel
ry, L
ug
gag
e, a
nd
Lea
ther
Go
od
s S
tore
s$4
,013
$4,6
050
sf60
0 sf
$0$2
38,0
00$3
97
Art,
Cra
ft an
d S
ewin
g S
tore
s$1
,124
$1,2
9080
090
0$1
60,0
00$2
00$1
96,0
00$2
18Jo
Ann
e's,
AC
Moo
re A
rts
& C
raft,
Han
cock
Mus
ical
Inst
rum
ent S
tore
$862
$990
900
1,00
0$1
98,0
00$2
20$2
47,0
00$2
47M
usic
& A
rts C
ente
r, G
uita
r Cen
ter I
nc.
Boo
k &
Mus
ic S
tore
s$6
,433
$7,3
847,
400
8,50
0$1
,073
,000
$145
$1,3
77,0
00$1
62B
ooks
-a-M
illio
n, L
ogos
Boo
ks
Spo
rting
Goo
d S
tore
$3,9
09$4
,486
2,90
03,
300
$640
,000
$221
$815
,000
$247
Eas
tern
Mt.
Spo
rts,
Om
ega
Spo
rts,
Toy
and
Hob
by S
tore
$978
$1,1
2290
01,
000
$151
,000
$168
$189
,000
$189
Gam
eSto
p In
c., G
ames
Wor
ksho
p
Sp
ort
ing
Go
od
s, H
ob
by,
Bo
oks
, Mu
sic
Sto
res
$13,
306
$15,
272
12,9
00 s
f14
,700
sf
$2,2
22,0
00$1
91$2
,824
,000
$213
Car
d/G
ift S
hop
$3,3
77$3
,876
1,90
02,
200
$262
,000
$138
$343
,000
$156
Irre
stib
les,
Hal
lmar
k, F
acto
ry C
ard
& P
arty
Flo
rists
$1,8
98$2
,177
1,30
01,
400
$267
,000
$205
$326
,000
$233
Loca
l Flo
rist o
r B
ridal
Sal
on
Offi
ce S
uppl
ies,
Sta
tiona
ry$3
,377
$3,8
762,
400
2,80
0$5
30,0
00$2
21$7
00,0
00$2
50X
pedx
Pap
er &
Gra
phic
, Sig
natu
res
Pet
Sup
ply
Sto
re$2
,998
$3,4
411,
300
1,40
0$2
47,0
00$1
90$3
01,0
00$2
15P
et S
uper
mar
ket,
Pet
Val
u, P
etS
mar
t
Toba
cco
Sho
p$3
,373
$3,8
7280
090
0$2
60,0
00$3
25$3
39,0
00$3
77T
inde
r Box
Inte
rnat
iona
l, S
mok
er F
riend
ly In
tern
atio
nal
Vid
eo/E
nter
tain
men
t$9
37$1
,075
060
0$9
0,00
0$1
50H
olly
woo
d E
nter
tain
men
t, M
ovie
Sta
rz V
ideo
To
tal M
isce
llan
eou
s R
etai
lers
$15,
960
$18,
317
7,70
0 sf
9,30
0 sf
$1,5
66,0
00$2
16$2
,099
,000
$230
To
tal I
den
tifi
ed R
etai
l Exp
end
itu
re$5
91,4
51$6
78,8
3516
1,70
0 sf
185,
800
sf$3
8,90
2,00
0$2
61$4
9,77
1,00
0$2
97
Gib
bs P
lann
ing
Gro
up In
c., W
est C
entr
al, A
lbuq
uerq
ue R
epor
t App
endi
xP
age
24
2010 2015
Trade Area ('000's)
Trade Area ('000's)
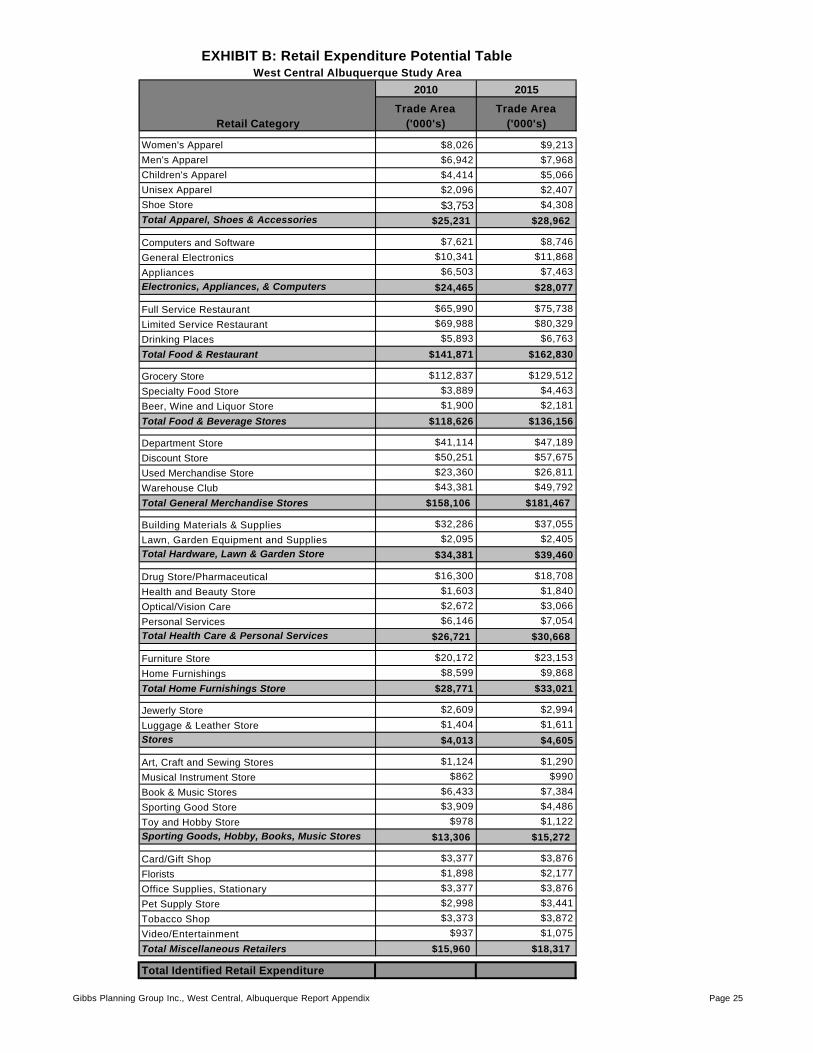
Women's Apparel $8,026 $9,213Men's Apparel $6,942 $7,968Children's Apparel $4,414 $5,066Unisex Apparel $2,096 $2,407Shoe Store $3,753 $4,308Total Apparel, Shoes & Accessories $25,231 $28,962
Computers and Software $7,621 $8,746
General Electronics $10,341 $11,868
Appliances $6,503 $7,463Electronics, Appliances, & Computers $24,465 $28,077
Full Service Restaurant $65,990 $75,738
Limited Service Restaurant $69,988 $80,329
Drinking Places $5,893 $6,763
Total Food & Restaurant $141,871 $162,830
Grocery Store $112,837 $129,512
Specialty Food Store $3,889 $4,463
Beer, Wine and Liquor Store $1,900 $2,181
Total Food & Beverage Stores $118,626 $136,156
Department Store $41,114 $47,189
Discount Store $50,251 $57,675
Used Merchandise Store $23,360 $26,811
Warehouse Club $43,381 $49,792
Total General Merchandise Stores $158,106 $181,467
Building Materials & Supplies $32,286 $37,055
Lawn, Garden Equipment and Supplies $2,095 $2,405Total Hardware, Lawn & Garden Store $34,381 $39,460
Drug Store/Pharmaceutical $16,300 $18,708
Health and Beauty Store $1,603 $1,840
Optical/Vision Care $2,672 $3,066
Personal Services $6,146 $7,054Total Health Care & Personal Services $26,721 $30,668
Furniture Store $20,172 $23,153
Home Furnishings $8,599 $9,868
Total Home Furnishings Store $28,771 $33,021
Jewerly Store $2,609 $2,994
Luggage & Leather Store $1,404 $1,611Stores $4,013 $4,605
Art, Craft and Sewing Stores $1,124 $1,290
Musical Instrument Store $862 $990
Book & Music Stores $6,433 $7,384
Sporting Good Store $3,909 $4,486
Toy and Hobby Store $978 $1,122Sporting Goods, Hobby, Books, Music Stores $13,306 $15,272
Card/Gift Shop $3,377 $3,876
Florists $1,898 $2,177
Office Supplies, Stationary $3,377 $3,876
Pet Supply Store $2,998 $3,441
Tobacco Shop $3,373 $3,872
Video/Entertainment $937 $1,075
Total Miscellaneous Retailers $15,960 $18,317
Total Identified Retail Expenditure
Retail Category
EXHIBIT B: Retail Expenditure Potential TableWest Central Albuquerque Study Area
Gibbs Planning Group Inc., West Central, Albuquerque Report Appendix Page 25
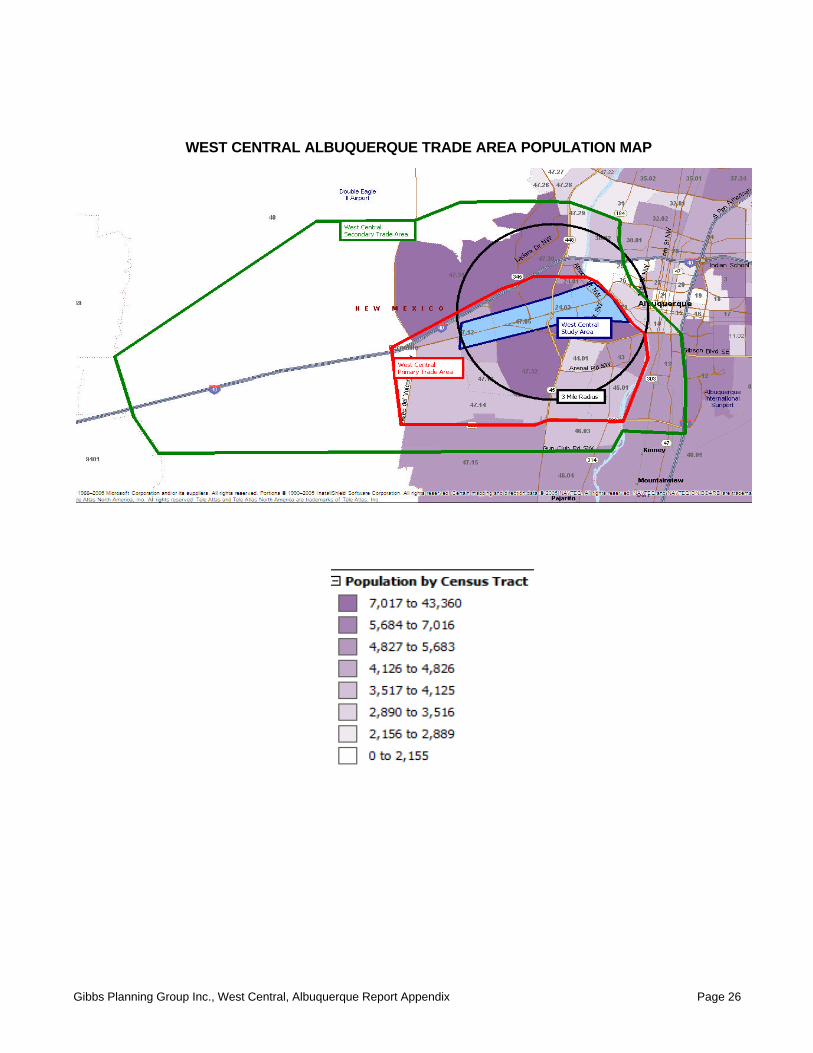
WEST CENTRAL ALBUQUERQUE TRADE AREA POPULATION MAP
Gibbs Planning Group Inc., West Central, Albuquerque Report Appendix Page 26
WEST CENTRAL ALBUQUERQUE TRADE AREA HOUSEHOLDS MAP
Gibbs Planning Group Inc., West Central, Albuquerque Report Appendix Page 27
WEST CENTRAL ALBUQUERQUE AVERAGE HOUSEHOLD INCOME MAP
Gibbs Planning Group Inc., West Central, Albuquerque Report Appendix Page 28
WEST CENTRAL ALBUQUERQUE TRADE AREA COMPETITION MAP
NEIGHBORHOOD RETAIL CENTERS
Gibbs Planning Group Inc., West Central, Albuquerque Report Appendix Page 29
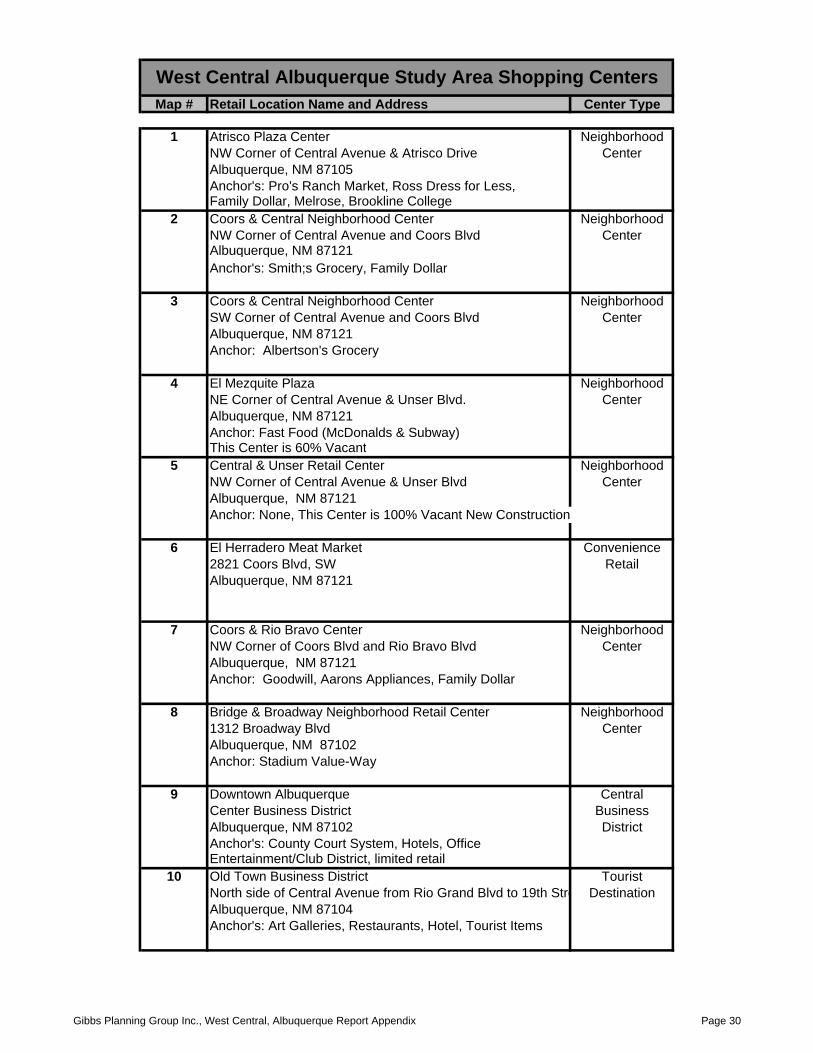
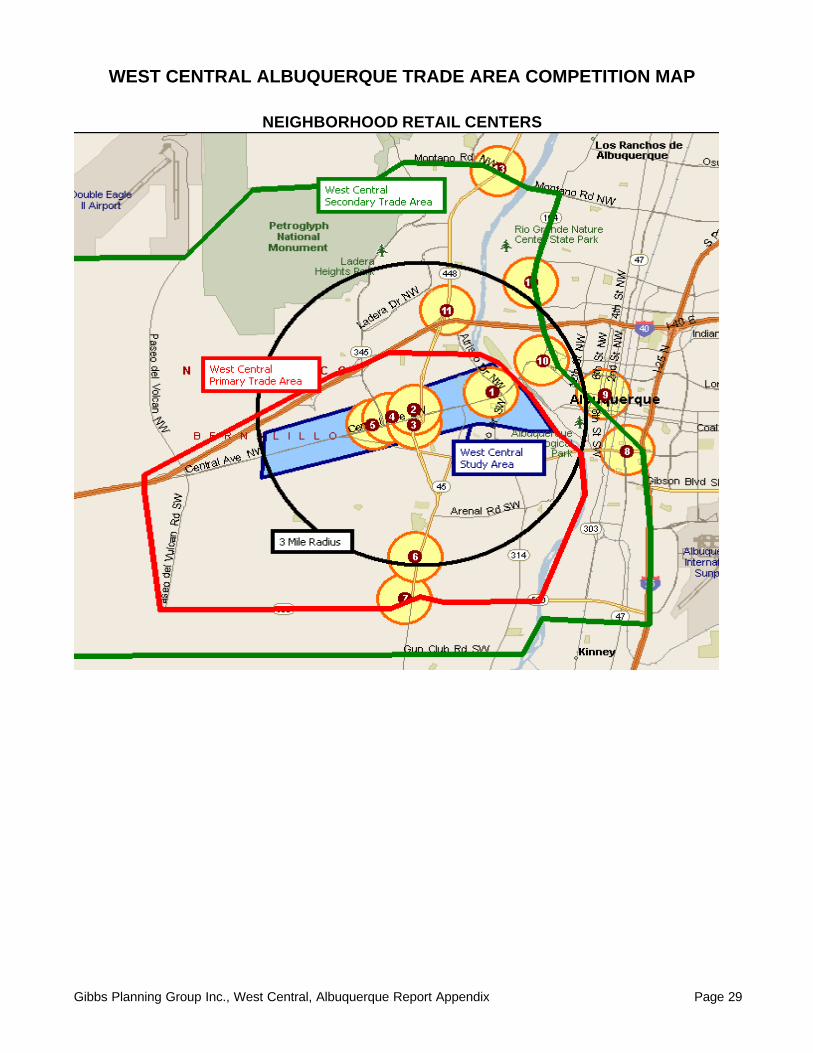
Map # Retail Location Name and Address Center Type
1 Atrisco Plaza Center NeighborhoodNW Corner of Central Avenue & Atrisco Drive CenterAlbuquerque, NM 87105Anchor's: Pro's Ranch Market, Ross Dress for Less,Family Dollar, Melrose, Brookline College
2 Coors & Central Neighborhood Center NeighborhoodNW Corner of Central Avenue and Coors Blvd CenterAlbuquerque, NM 87121Anchor's: Smith;s Grocery, Family Dollar
3 Coors & Central Neighborhood Center NeighborhoodSW Corner of Central Avenue and Coors Blvd CenterAlbuquerque, NM 87121Anchor: Albertson's Grocery
4 El Mezquite Plaza NeighborhoodNE Corner of Central Avenue & Unser Blvd. CenterAlbuquerque, NM 87121Anchor: Fast Food (McDonalds & Subway)This Center is 60% Vacant
5 Central & Unser Retail Center NeighborhoodNW Corner of Central Avenue & Unser Blvd CenterAlbuquerque, NM 87121Anchor: None, This Center is 100% Vacant New Construction
6 El Herradero Meat Market Convenience2821 Coors Blvd, SW RetailAlbuquerque, NM 87121
7 Coors & Rio Bravo Center NeighborhoodNW Corner of Coors Blvd and Rio Bravo Blvd CenterAlbuquerque, NM 87121Anchor: Goodwill, Aarons Appliances, Family Dollar
8 Bridge & Broadway Neighborhood Retail Center Neighborhood1312 Broadway Blvd CenterAlbuquerque, NM 87102Anchor: Stadium Value-Way
9 Downtown Albuquerque CentralCenter Business District BusinessAlbuquerque, NM 87102 DistrictAnchor's: County Court System, Hotels, OfficeEntertainment/Club District, limited retail
10 Old Town Business District TouristNorth side of Central Avenue from Rio Grand Blvd to 19th Street DestinationAlbuquerque, NM 87104Anchor's: Art Galleries, Restaurants, Hotel, Tourist Items
West Central Albuquerque Study Area Shopping Centers
Gibbs Planning Group Inc., West Central, Albuquerque Report Appendix Page 30
Map # Retail Location Name and Address Center Type
West Central Albuquerque Study Area Shopping Centers
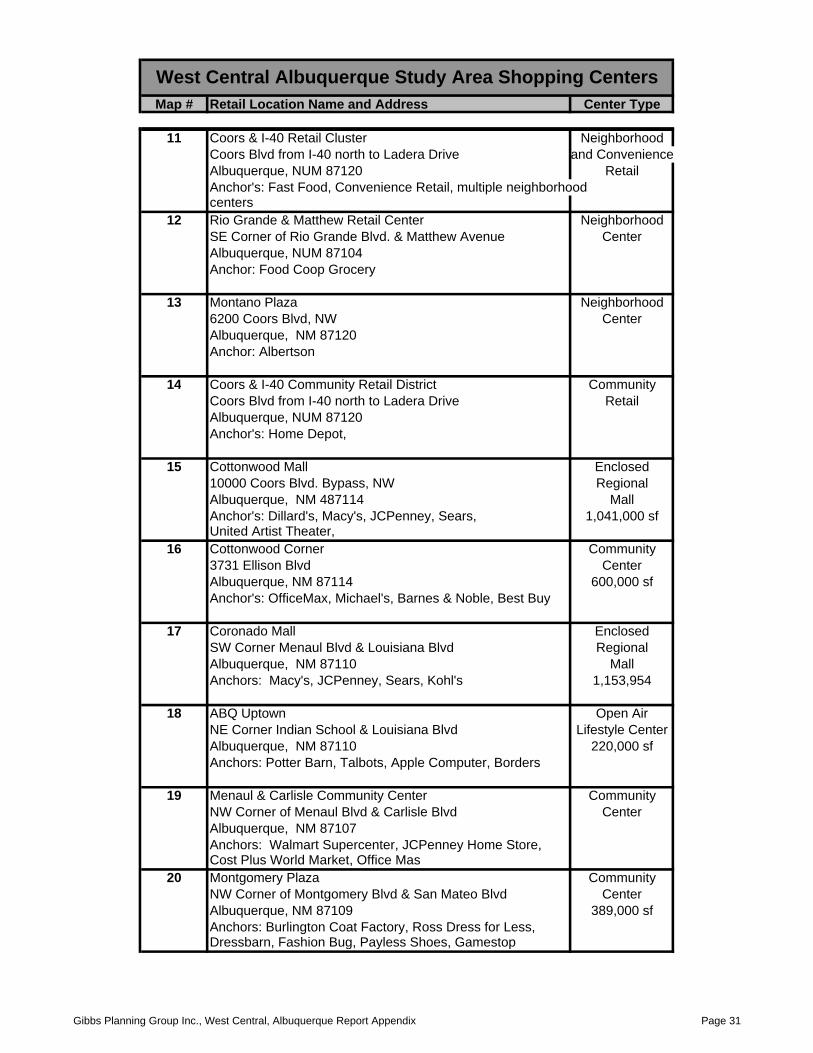
11 Coors & I-40 Retail Cluster NeighborhoodCoors Blvd from I-40 north to Ladera Drive and ConvenienceAlbuquerque, NUM 87120 RetailAnchor's: Fast Food, Convenience Retail, multiple neighborhoodcenters
12 Rio Grande & Matthew Retail Center NeighborhoodSE Corner of Rio Grande Blvd. & Matthew Avenue CenterAlbuquerque, NUM 87104Anchor: Food Coop Grocery
13 Montano Plaza Neighborhood6200 Coors Blvd, NW CenterAlbuquerque, NM 87120Anchor: Albertson
14 Coors & I-40 Community Retail District CommunityCoors Blvd from I-40 north to Ladera Drive RetailAlbuquerque, NUM 87120Anchor's: Home Depot,
15 Cottonwood Mall Enclosed10000 Coors Blvd. Bypass, NW RegionalAlbuquerque, NM 487114 MallAnchor's: Dillard's, Macy's, JCPenney, Sears, 1,041,000 sfUnited Artist Theater,
16 Cottonwood Corner Community3731 Ellison Blvd CenterAlbuquerque, NM 87114 600,000 sfAnchor's: OfficeMax, Michael's, Barnes & Noble, Best Buy
17 Coronado Mall EnclosedSW Corner Menaul Blvd & Louisiana Blvd RegionalAlbuquerque, NM 87110 MallAnchors: Macy's, JCPenney, Sears, Kohl's 1,153,954
18 ABQ Uptown Open AirNE Corner Indian School & Louisiana Blvd Lifestyle CenterAlbuquerque, NM 87110 220,000 sfAnchors: Potter Barn, Talbots, Apple Computer, Borders
19 Menaul & Carlisle Community Center CommunityNW Corner of Menaul Blvd & Carlisle Blvd CenterAlbuquerque, NM 87107Anchors: Walmart Supercenter, JCPenney Home Store,Cost Plus World Market, Office Mas
20 Montgomery Plaza CommunityNW Corner of Montgomery Blvd & San Mateo Blvd CenterAlbuquerque, NM 87109 389,000 sfAnchors: Burlington Coat Factory, Ross Dress for Less,Dressbarn, Fashion Bug, Payless Shoes, Gamestop
Gibbs Planning Group Inc., West Central, Albuquerque Report Appendix Page 31
Map # Retail Location Name and Address Center Type
West Central Albuquerque Study Area Shopping Centers
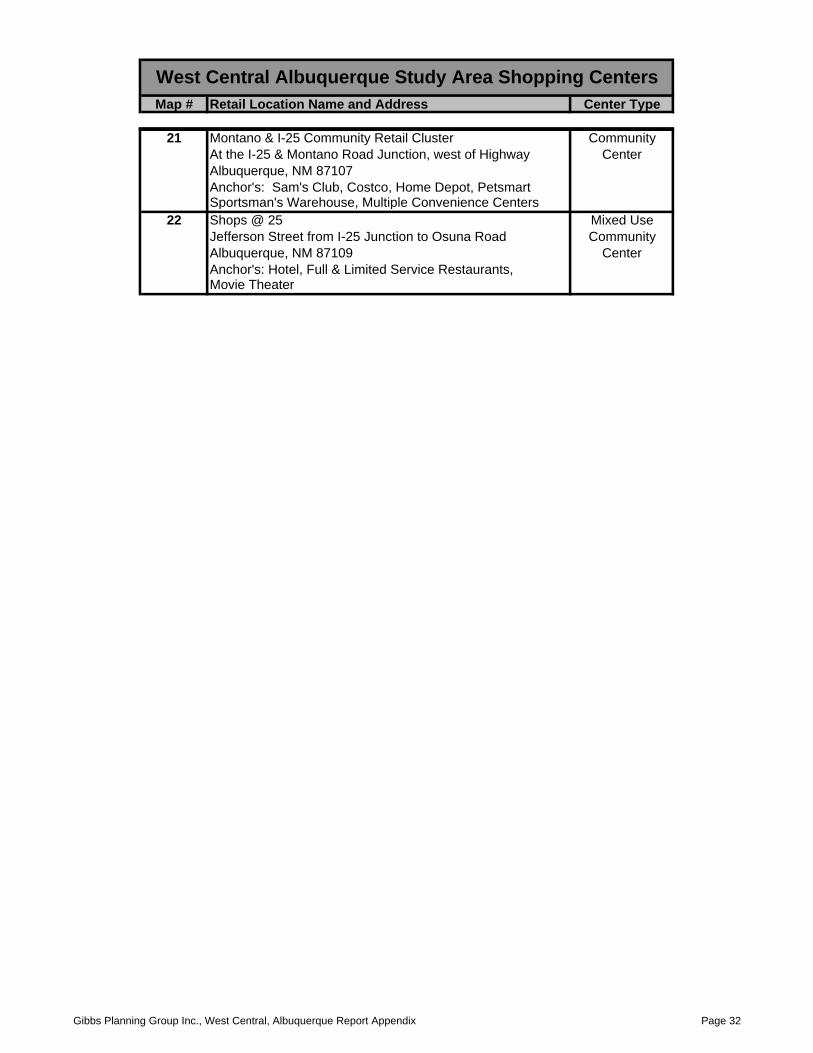
21 Montano & I-25 Community Retail Cluster CommunityAt the I-25 & Montano Road Junction, west of Highway CenterAlbuquerque, NM 87107Anchor's: Sam's Club, Costco, Home Depot, PetsmartSportsman's Warehouse, Multiple Convenience Centers
22 Shops @ 25 Mixed UseJefferson Street from I-25 Junction to Osuna Road CommunityAlbuquerque, NM 87109 CenterAnchor's: Hotel, Full & Limited Service Restaurants,Movie Theater
Gibbs Planning Group Inc., West Central, Albuquerque Report Appendix Page 32
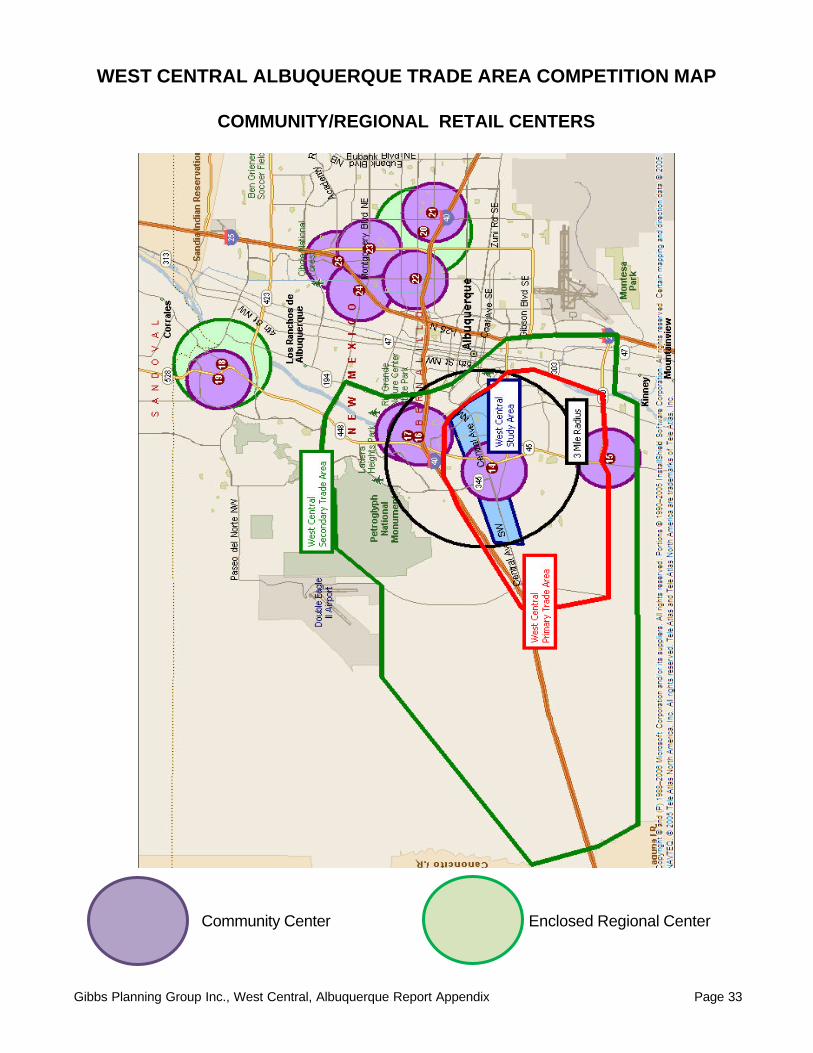
Community Center Enclosed Regional Center
COMMUNITY/REGIONAL RETAIL CENTERS
WEST CENTRAL ALBUQUERQUE TRADE AREA COMPETITION MAP
Gibbs Planning Group Inc., West Central, Albuquerque Report Appendix Page 33
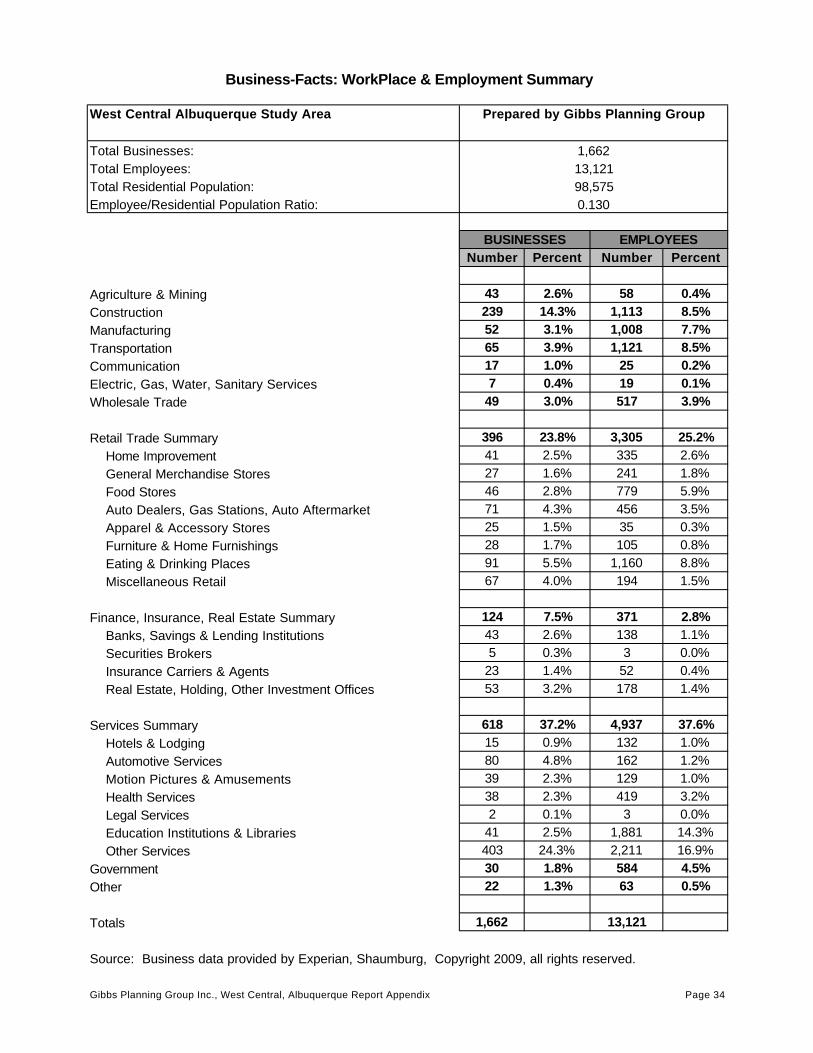
West Central Albuquerque Study Area
Total Businesses:Total Employees:Total Residential Population:Employee/Residential Population Ratio:
Number Percent Number Percent
Agriculture & Mining 43 2.6% 58 0.4%Construction 239 14.3% 1,113 8.5%Manufacturing 52 3.1% 1,008 7.7%Transportation 65 3.9% 1,121 8.5%Communication 17 1.0% 25 0.2%Electric, Gas, Water, Sanitary Services 7 0.4% 19 0.1%Wholesale Trade 49 3.0% 517 3.9%
Retail Trade Summary 396 23.8% 3,305 25.2% Home Improvement 41 2.5% 335 2.6% General Merchandise Stores 27 1.6% 241 1.8% Food Stores 46 2.8% 779 5.9% Auto Dealers, Gas Stations, Auto Aftermarket 71 4.3% 456 3.5% Apparel & Accessory Stores 25 1.5% 35 0.3% Furniture & Home Furnishings 28 1.7% 105 0.8% Eating & Drinking Places 91 5.5% 1,160 8.8% Miscellaneous Retail 67 4.0% 194 1.5%
Finance, Insurance, Real Estate Summary 124 7.5% 371 2.8% Banks, Savings & Lending Institutions 43 2.6% 138 1.1% Securities Brokers 5 0.3% 3 0.0% Insurance Carriers & Agents 23 1.4% 52 0.4% Real Estate, Holding, Other Investment Offices 53 3.2% 178 1.4%
Services Summary 618 37.2% 4,937 37.6% Hotels & Lodging 15 0.9% 132 1.0% Automotive Services 80 4.8% 162 1.2% Motion Pictures & Amusements 39 2.3% 129 1.0% Health Services 38 2.3% 419 3.2% Legal Services 2 0.1% 3 0.0% Education Institutions & Libraries 41 2.5% 1,881 14.3% Other Services 403 24.3% 2,211 16.9%Government 30 1.8% 584 4.5%Other 22 1.3% 63 0.5%
Totals 1,662 13,121
Source: Business data provided by Experian, Shaumburg, Copyright 2009, all rights reserved.
Gibbs Planning Group Inc., West Central, Albuquerque Report Appendix Page 34
Business-Facts: WorkPlace & Employment Summary
BUSINESSES EMPLOYEES
1,66213,12198,5750.130
Prepared by Gibbs Planning Group
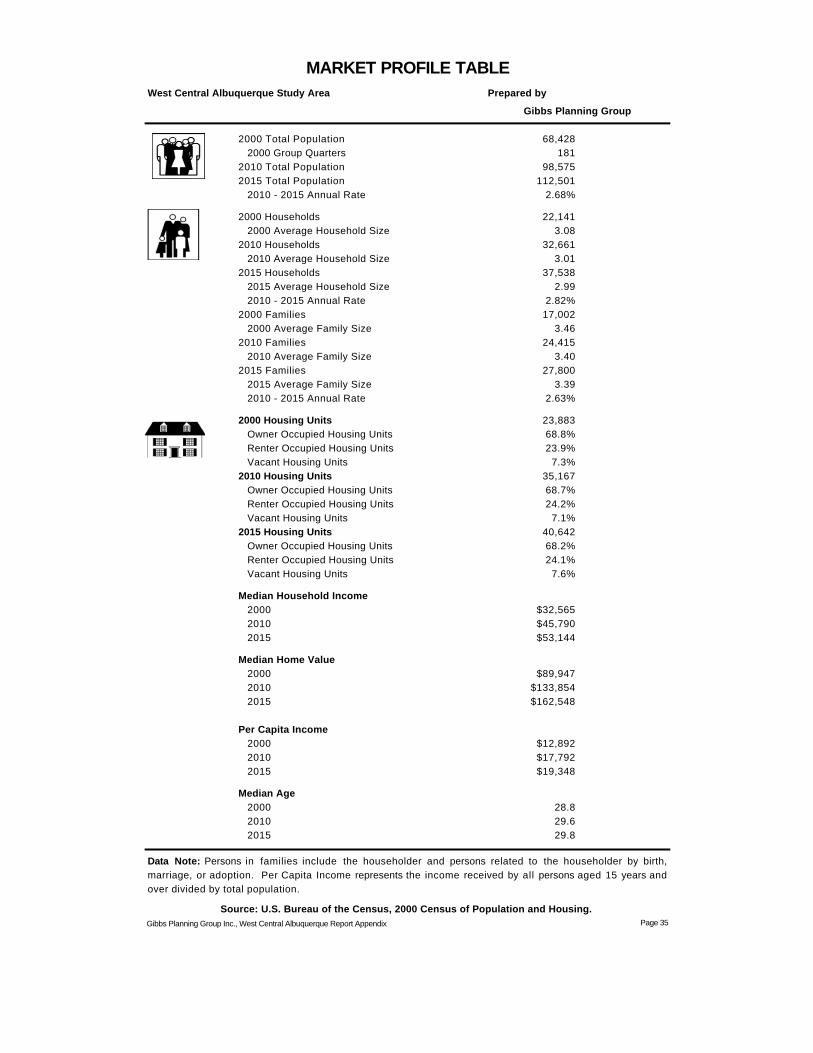
Prepared by
2000 Total Population 68,428 2000 Group Quarters 1812010 Total Population 98,5752015 Total Population 112,501 2010 - 2015 Annual Rate 2.68%
2000 Households 22,141 2000 Average Household Size 3.082010 Households 32,661 2010 Average Household Size 3.012015 Households 37,538 2015 Average Household Size 2.99 2010 - 2015 Annual Rate 2.82%2000 Families 17,002 2000 Average Family Size 3.462010 Families 24,415 2010 Average Family Size 3.402015 Families 27,800 2015 Average Family Size 3.39 2010 - 2015 Annual Rate 2.63%
2000 Housing Units 23,883 Owner Occupied Housing Units 68.8% Renter Occupied Housing Units 23.9% Vacant Housing Units 7.3%2010 Housing Units 35,167 Owner Occupied Housing Units 68.7% Renter Occupied Housing Units 24.2% Vacant Housing Units 7.1%2015 Housing Units 40,642 Owner Occupied Housing Units 68.2% Renter Occupied Housing Units 24.1% Vacant Housing Units 7.6%
Median Household Income 2000 $32,565 2010 $45,790 2015 $53,144
Median Home Value 2000 $89,947 2010 $133,854 2015 $162,548
Per Capita Income 2000 $12,892 2010 $17,792 2015 $19,348
Median Age 2000 28.8 2010 29.6 2015 29.8
Gibbs Planning Group Inc., West Central Albuquerque Report Appendix Page 35
MARKET PROFILE TABLE
Data Note: Persons in families include the householder and persons related to the householder by birth,marriage, or adoption. Per Capita Income represents the income received by all persons aged 15 years andover divided by total population.
Source: U.S. Bureau of the Census, 2000 Census of Population and Housing.
West Central Albuquerque Study Area
Gibbs Planning Group
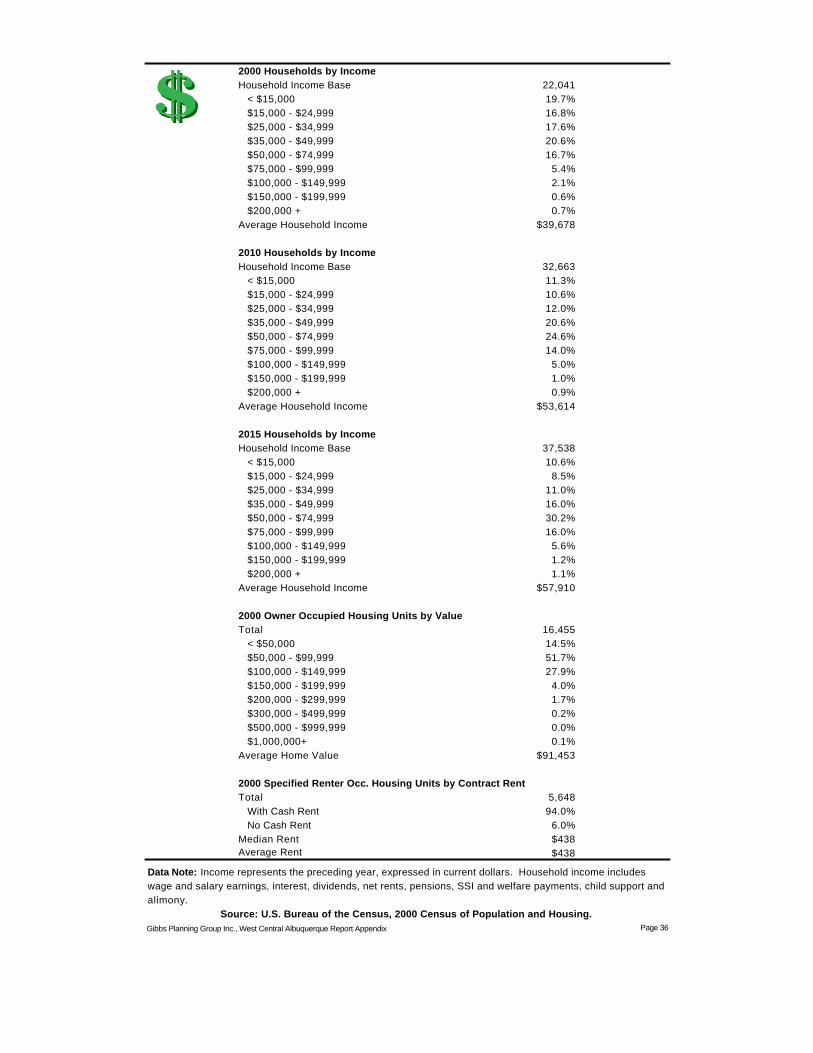
2000 Households by IncomeHousehold Income Base 22,041 < $15,000 19.7% $15,000 - $24,999 16.8% $25,000 - $34,999 17.6% $35,000 - $49,999 20.6% $50,000 - $74,999 16.7% $75,000 - $99,999 5.4% $100,000 - $149,999 2.1% $150,000 - $199,999 0.6% $200,000 + 0.7%Average Household Income $39,678
2010 Households by IncomeHousehold Income Base 32,663 < $15,000 11.3% $15,000 - $24,999 10.6% $25,000 - $34,999 12.0% $35,000 - $49,999 20.6% $50,000 - $74,999 24.6% $75,000 - $99,999 14.0% $100,000 - $149,999 5.0% $150,000 - $199,999 1.0% $200,000 + 0.9%Average Household Income $53,614
2015 Households by IncomeHousehold Income Base 37,538 < $15,000 10.6% $15,000 - $24,999 8.5% $25,000 - $34,999 11.0% $35,000 - $49,999 16.0% $50,000 - $74,999 30.2% $75,000 - $99,999 16.0% $100,000 - $149,999 5.6% $150,000 - $199,999 1.2% $200,000 + 1.1%Average Household Income $57,910
2000 Owner Occupied Housing Units by ValueTotal 16,455 < $50,000 14.5% $50,000 - $99,999 51.7% $100,000 - $149,999 27.9% $150,000 - $199,999 4.0% $200,000 - $299,999 1.7% $300,000 - $499,999 0.2% $500,000 - $999,999 0.0% $1,000,000+ 0.1%Average Home Value $91,453
2000 Specified Renter Occ. Housing Units by Contract RentTotal 5,648 With Cash Rent 94.0% No Cash Rent 6.0%Median Rent $438Average Rent $438
Gibbs Planning Group Inc., West Central Albuquerque Report Appendix Page 36
Data Note: Income represents the preceding year, expressed in current dollars. Household income includes wage and salary earnings, interest, dividends, net rents, pensions, SSI and welfare payments, child support and alimony.
Source: U.S. Bureau of the Census, 2000 Census of Population and Housing.
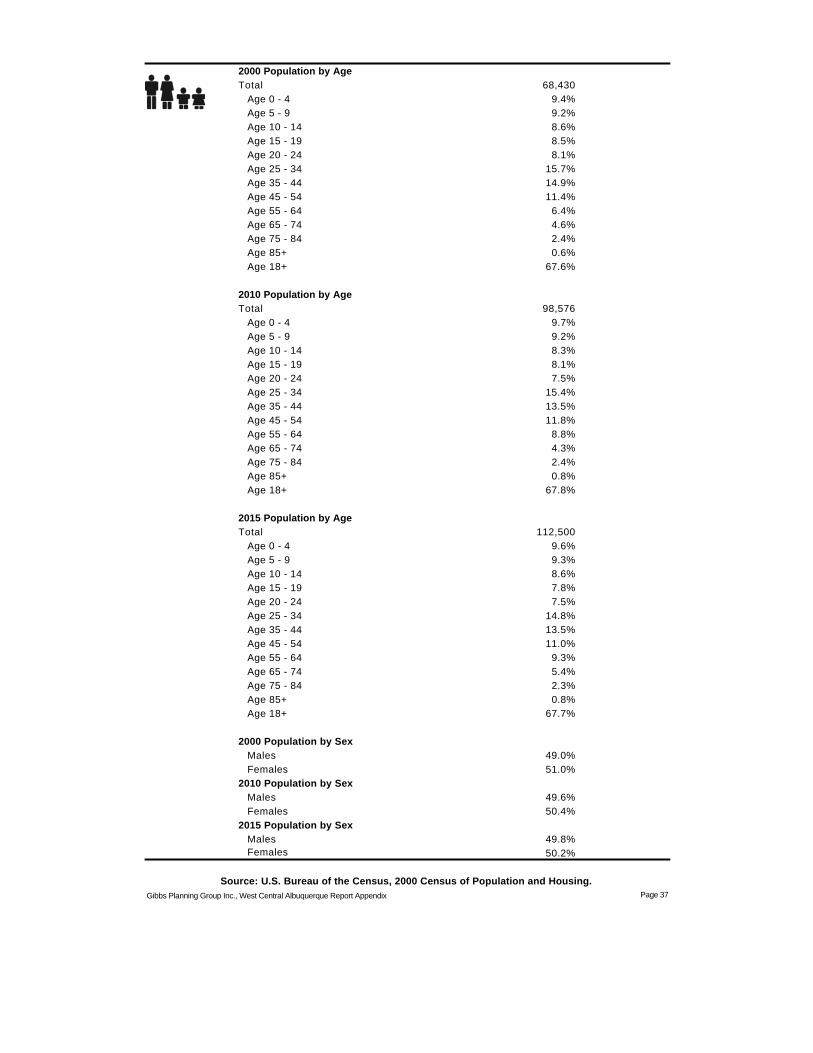
2000 Population by AgeTotal 68,430 Age 0 - 4 9.4% Age 5 - 9 9.2% Age 10 - 14 8.6% Age 15 - 19 8.5% Age 20 - 24 8.1% Age 25 - 34 15.7% Age 35 - 44 14.9% Age 45 - 54 11.4% Age 55 - 64 6.4% Age 65 - 74 4.6% Age 75 - 84 2.4% Age 85+ 0.6% Age 18+ 67.6%
2010 Population by AgeTotal 98,576 Age 0 - 4 9.7% Age 5 - 9 9.2% Age 10 - 14 8.3% Age 15 - 19 8.1% Age 20 - 24 7.5% Age 25 - 34 15.4% Age 35 - 44 13.5% Age 45 - 54 11.8% Age 55 - 64 8.8% Age 65 - 74 4.3% Age 75 - 84 2.4% Age 85+ 0.8% Age 18+ 67.8%
2015 Population by AgeTotal 112,500 Age 0 - 4 9.6% Age 5 - 9 9.3% Age 10 - 14 8.6% Age 15 - 19 7.8% Age 20 - 24 7.5% Age 25 - 34 14.8% Age 35 - 44 13.5% Age 45 - 54 11.0% Age 55 - 64 9.3% Age 65 - 74 5.4% Age 75 - 84 2.3% Age 85+ 0.8% Age 18+ 67.7%
2000 Population by Sex Males 49.0% Females 51.0%2010 Population by Sex Males 49.6% Females 50.4%2015 Population by Sex Males 49.8% Females 50.2%
Gibbs Planning Group Inc., West Central Albuquerque Report Appendix Page 37
Source: U.S. Bureau of the Census, 2000 Census of Population and Housing.
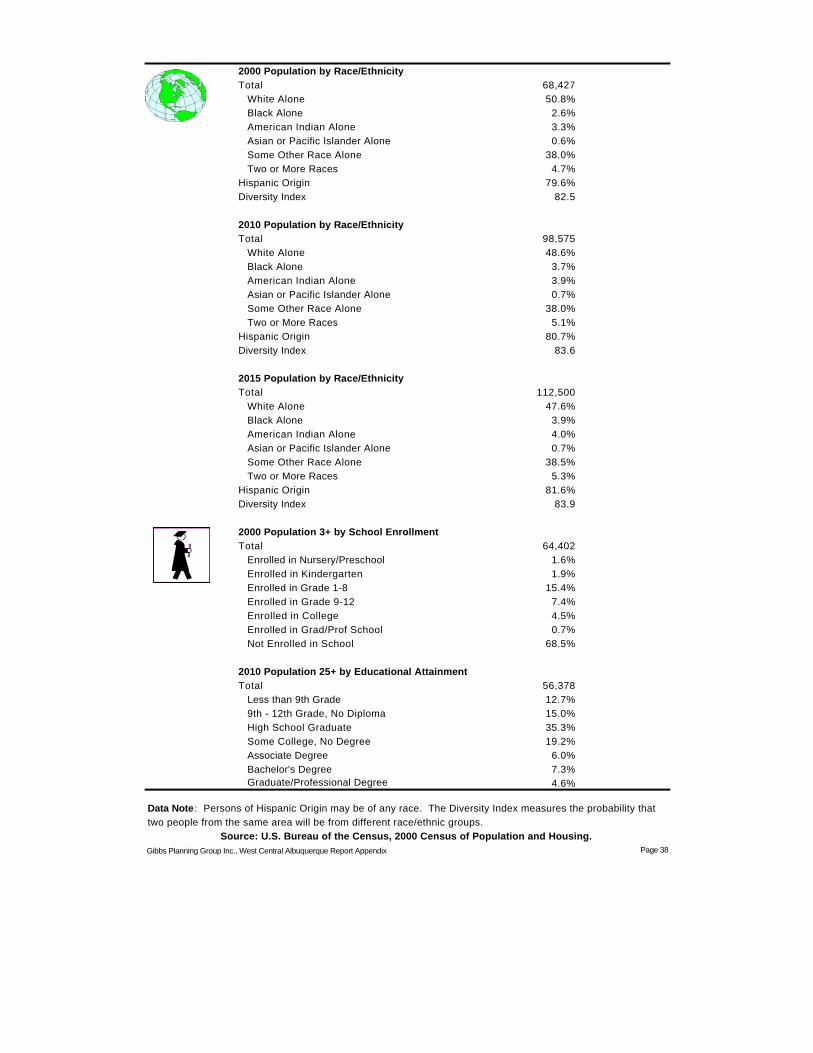
2000 Population by Race/EthnicityTotal 68,427 White Alone 50.8% Black Alone 2.6% American Indian Alone 3.3% Asian or Pacific Islander Alone 0.6% Some Other Race Alone 38.0% Two or More Races 4.7%Hispanic Origin 79.6%Diversity Index 82.5
2010 Population by Race/EthnicityTotal 98,575 White Alone 48.6% Black Alone 3.7% American Indian Alone 3.9% Asian or Pacific Islander Alone 0.7% Some Other Race Alone 38.0% Two or More Races 5.1%Hispanic Origin 80.7%Diversity Index 83.6
2015 Population by Race/EthnicityTotal 112,500 White Alone 47.6% Black Alone 3.9% American Indian Alone 4.0% Asian or Pacific Islander Alone 0.7% Some Other Race Alone 38.5% Two or More Races 5.3%Hispanic Origin 81.6%Diversity Index 83.9
2000 Population 3+ by School EnrollmentTotal 64,402 Enrolled in Nursery/Preschool 1.6% Enrolled in Kindergarten 1.9% Enrolled in Grade 1-8 15.4% Enrolled in Grade 9-12 7.4% Enrolled in College 4.5% Enrolled in Grad/Prof School 0.7% Not Enrolled in School 68.5%
2010 Population 25+ by Educational AttainmentTotal 56,378 Less than 9th Grade 12.7% 9th - 12th Grade, No Diploma 15.0% High School Graduate 35.3% Some College, No Degree 19.2% Associate Degree 6.0% Bachelor's Degree 7.3% Graduate/Professional Degree 4.6%
Gibbs Planning Group Inc., West Central Albuquerque Report Appendix Page 38
Data Note : Persons of Hispanic Origin may be of any race. The Diversity Index measures the probability that two people from the same area will be from different race/ethnic groups.
Source: U.S. Bureau of the Census, 2000 Census of Population and Housing.
2010 Population 15+ by Marital StatusTotal 71,725 Never Married 39.6% Married 42.3% Widowed 4.6% Divorced 13.5%
2000 Population 16+ by Employment StatusTotal 48,501 In Labor Force 61.3% Civilian Employed 56.1% Civilian Unemployed 4.8% In Armed Forces 0.4% Not in Labor Force 38.7%
2010 Civilian Population 16+ in Labor Force Civilian Employed 87.6% Civilian Unemployed 12.4%
2015 Civilian Population 16+ in Labor Force Civilian Employed 88.7% Civilian Unemployed 11.3%
2000 Females 16+ by Employment Status and Age of ChildrenTotal 25,433 Own Children < 6 Only 9.3% Employed/in Armed Forces 4.7% Unemployed 0.4% Not in Labor Force 4.2% Own Children <6 and 6-17 9.3% Employed/in Armed Forces 5.0% Unemployed 0.4% Not in Labor Force 4.0% Own Children 6-17 Only 19.6% Employed/in Armed Forces 12.8% Unemployed 0.9% Not in Labor Force 6.0% No Own Children <18 61.8% Employed/in Armed Forces 28.1% Unemployed 2.2% Not in Labor Force 31.5%
Gibbs Planning Group Inc., West Central Albuquerque Report Appendix Page 39
Source: U.S. Bureau of the Census, 2000 Census of Population and Housing.
2010 Employed Population 16+ by IndustryTotal 36,016 Agriculture/Mining 0.2% Construction 10.1% Manufacturing 5.2% Wholesale Trade 3.5% Retail Trade 10.5% Transportation/Utilities 5.0% Information 2.1% Finance/Insurance/Real Estate 5.1% Services 51.8% Public Administration 6.4%
2010 Employed Population 16+ by OccupationTotal 36,019 White Collar 53.8% Management/Business/Financial 8.5% Professional 19.2% Sales 10.4% Administrative Support 15.6% Services 23.6% Blue Collar 22.7% Farming/Forestry/Fishing 0.1% Construction/Extraction 8.4% Installation/Maintenance/Repair 3.5% Production 4.5% Transportation/Material Moving 6.1%
2000 Workers 16+ by Means of Transportation to WorkTotal 26,698 Drove Alone - Car, Truck, or Van 74.4% Carpooled - Car, Truck, or Van 20.1% Public Transportation 1.1% Walked 0.9% Other Means 1.3% Worked at Home 2.2%
2000 Workers 16+ by Travel Time to WorkTotal 26,697 Did not Work at Home 97.8% Less than 5 minutes 1.5% 5 to 9 minutes 5.7% 10 to 19 minutes 28.9% 20 to 24 minutes 23.9% 25 to 34 minutes 27.3% 35 to 44 minutes 3.3% 45 to 59 minutes 3.4% 60 to 89 minutes 2.7% 90 or more minutes 1.2% Worked at Home 2.2%Average Travel Time to Work (in min) 23.5
2000 Households by Vehicles AvailableTotal 22,115 None 6.2% 1 34.3% 2 39.3% 3 14.0% 4 4.4% 5+ 1.7%Average Number of Vehicles Available 1.8
Gibbs Planning Group Inc., West Central Albuquerque Report Appendix Page 40
Source: U.S. Bureau of the Census, 2000 Census of Population and Housing.
2000 Households by TypeTotal 22,140 Family Households 76.8% Married-couple Family 48.5% With Related Children 29.3% Other Family (No Spouse) 28.3% With Related Children 20.7% Nonfamily Households 23.2% Householder Living Alone 17.5% Householder Not Living Alone 5.7%
Households with Related Children 50.0%Households with Persons 65+ 18.1%
2000 Households by SizeTotal 22,141 1 Person Household 17.5% 2 Person Household 25.6% 3 Person Household 20.3% 4 Person Household 18.3% 5 Person Household 10.4% 6 Person Household 4.7% 7+ Person Household 3.2%
2000 Households by Year Householder Moved InTotal 22,115 Moved in 1999 to March 2000 23.7% Moved in 1995 to 1998 29.7% Moved in 1990 to 1994 11.9% Moved in 1980 to 1989 12.2% Moved in 1970 to 1979 10.2% Moved in 1969 or Earlier 12.3%Median Year Householder Moved In 1995
2000 Housing Units by Units in StructureTotal 23,860 1, Detached 70.6% 1, Attached 4.9% 2 1.6% 3 or 4 2.4% 5 to 9 1.7% 10 to 19 1.7% 20+ 3.0% Mobile Home 14.1% Other 0.0%
2000 Housing Units by Year Structure BuiltTotal 23,857 1999 to March 2000 6.8% 1995 to 1998 17.4% 1990 to 1994 5.4% 1980 to 1989 14.0% 1970 to 1979 17.9% 1969 or Earlier 38.4%Median Year Structure Built 1976
Gibbs Planning Group Inc., West Central Albuquerque Report Appendix Page 41
Source: U.S. Bureau of the Census, 2000 Census of Population and Housing.
1.
2.
3.
Apparel & Services: Total $ $43,093,977Average Spent $1,319.43Spending Potential Index 55
Computers & Accessories: Total $ $5,819,580Average Spent $178.18Spending Potential Index 81
Education: Total $ $27,750,385Average Spent $849.65Spending Potential Index 70
Entertainment/Recreation: Total $ $80,403,649Average Spent $2,461.76Spending Potential Index 76
Food at Home: Total $ $117,216,584Average Spent $3,588.89Spending Potential Index 80
Food Away from Home: Total $ $83,469,714Average Spent $2,555.64Spending Potential Index 79
Health Care: Total $ $86,990,110Average Spent $2,663.42Spending Potential Index 71
Household Furnishings & Equip: Total $ $45,937,187Average Spent $1,406.48Spending Potential Index 68
Investments: Total $ $35,953,814Average Spent $1,100.82Spending Potential Index 63
Retail Goods: Total $ $608,298,574Average Spent $18,624.62Spending Potential Index 75
Shelter: Total $ $415,047,732Average Spent $12,707.75Spending Potential Index 80
TV/Video/Audio: Total $ $31,289,476Average Spent $958.01Spending Potential Index 77
Travel: Total $ $45,713,795Average Spent $1,399.64Spending Potential Index 74
Vehicle Maintenance & Repairs: Total $ $24,261,895Average Spent $742.84Spending Potential Index 79
Gibbs Planning Group Inc., West Central Albuquerque Report Appendix Page 42
Source: Expenditure data are derived from the 2005 and 2006 Consumer Expenditure Surveys, Bureau of Labor Statistics.
Top 3 Tapestry Segments
2010 Consumer Spending shows the amount spent on a variety of goods and services by households that reside in the market area. Expenditures are shown by broad budget categories that are not mutually exclusive. Consumer spending does not equal business revenue.
Data Note: The Spending Potential Index represents the amount spent in the area relative to a national average of 100.
Up and Coming Families
Industrious Urban Fringe
Southwestern Families
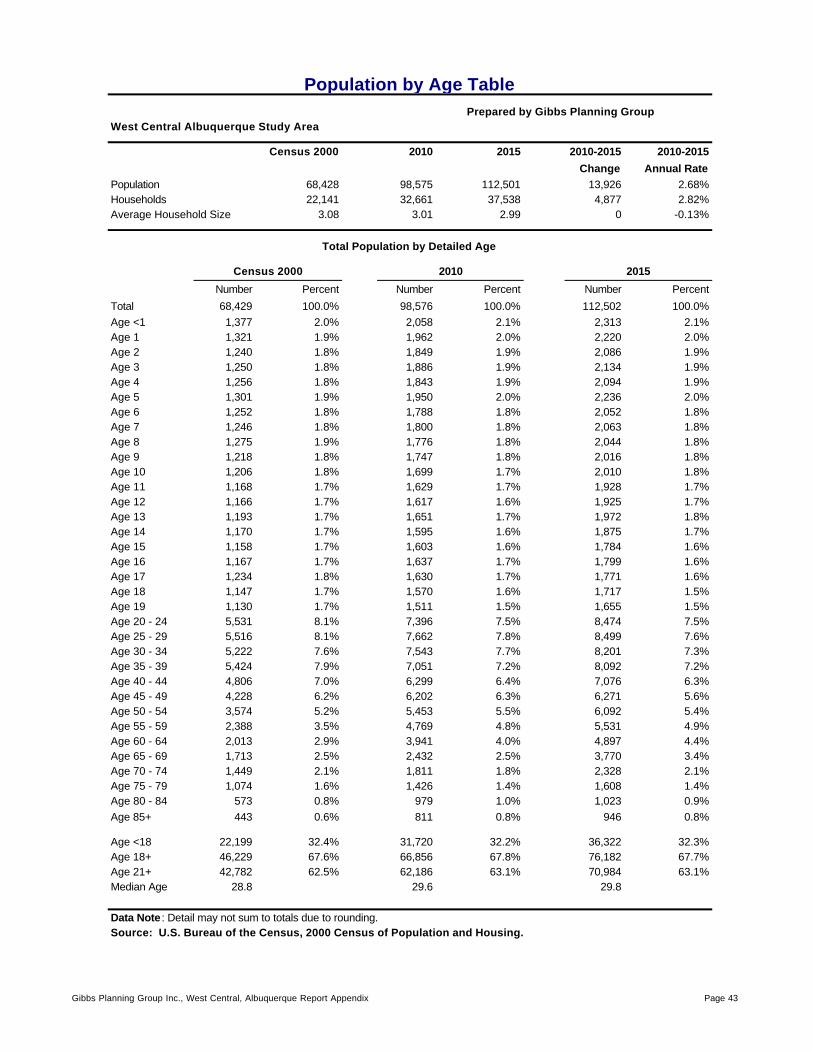
Prepared by Gibbs Planning GroupWest Central Albuquerque Study Area
Census 2000 2010 2015 2010-2015 2010-2015
Change Annual RatePopulation 68,428 98,575 112,501 13,926 2.68%Households 22,141 32,661 37,538 4,877 2.82%Average Household Size 3.08 3.01 2.99 0 -0.13%
Number Percent Number Percent Number Percent
Total 68,429 100.0% 98,576 100.0% 112,502 100.0%Age <1 1,377 2.0% 2,058 2.1% 2,313 2.1%Age 1 1,321 1.9% 1,962 2.0% 2,220 2.0%Age 2 1,240 1.8% 1,849 1.9% 2,086 1.9%Age 3 1,250 1.8% 1,886 1.9% 2,134 1.9%Age 4 1,256 1.8% 1,843 1.9% 2,094 1.9%Age 5 1,301 1.9% 1,950 2.0% 2,236 2.0%Age 6 1,252 1.8% 1,788 1.8% 2,052 1.8%Age 7 1,246 1.8% 1,800 1.8% 2,063 1.8%Age 8 1,275 1.9% 1,776 1.8% 2,044 1.8%Age 9 1,218 1.8% 1,747 1.8% 2,016 1.8%Age 10 1,206 1.8% 1,699 1.7% 2,010 1.8%Age 11 1,168 1.7% 1,629 1.7% 1,928 1.7%Age 12 1,166 1.7% 1,617 1.6% 1,925 1.7%Age 13 1,193 1.7% 1,651 1.7% 1,972 1.8%Age 14 1,170 1.7% 1,595 1.6% 1,875 1.7%Age 15 1,158 1.7% 1,603 1.6% 1,784 1.6%Age 16 1,167 1.7% 1,637 1.7% 1,799 1.6%Age 17 1,234 1.8% 1,630 1.7% 1,771 1.6%Age 18 1,147 1.7% 1,570 1.6% 1,717 1.5%Age 19 1,130 1.7% 1,511 1.5% 1,655 1.5%Age 20 - 24 5,531 8.1% 7,396 7.5% 8,474 7.5%Age 25 - 29 5,516 8.1% 7,662 7.8% 8,499 7.6%Age 30 - 34 5,222 7.6% 7,543 7.7% 8,201 7.3%Age 35 - 39 5,424 7.9% 7,051 7.2% 8,092 7.2%Age 40 - 44 4,806 7.0% 6,299 6.4% 7,076 6.3%Age 45 - 49 4,228 6.2% 6,202 6.3% 6,271 5.6%Age 50 - 54 3,574 5.2% 5,453 5.5% 6,092 5.4%Age 55 - 59 2,388 3.5% 4,769 4.8% 5,531 4.9%Age 60 - 64 2,013 2.9% 3,941 4.0% 4,897 4.4%Age 65 - 69 1,713 2.5% 2,432 2.5% 3,770 3.4%Age 70 - 74 1,449 2.1% 1,811 1.8% 2,328 2.1%Age 75 - 79 1,074 1.6% 1,426 1.4% 1,608 1.4%Age 80 - 84 573 0.8% 979 1.0% 1,023 0.9%Age 85+ 443 0.6% 811 0.8% 946 0.8%
Age <18 22,199 32.4% 31,720 32.2% 36,322 32.3%Age 18+ 46,229 67.6% 66,856 67.8% 76,182 67.7%Age 21+ 42,782 62.5% 62,186 63.1% 70,984 63.1%Median Age 28.8 29.6 29.8
Data Note : Detail may not sum to totals due to rounding.Source: U.S. Bureau of the Census, 2000 Census of Population and Housing.
Census 2000 2010 2015
Population by Age Table
Total Population by Detailed Age
Gibbs Planning Group Inc., West Central, Albuquerque Report Appendix Page 43
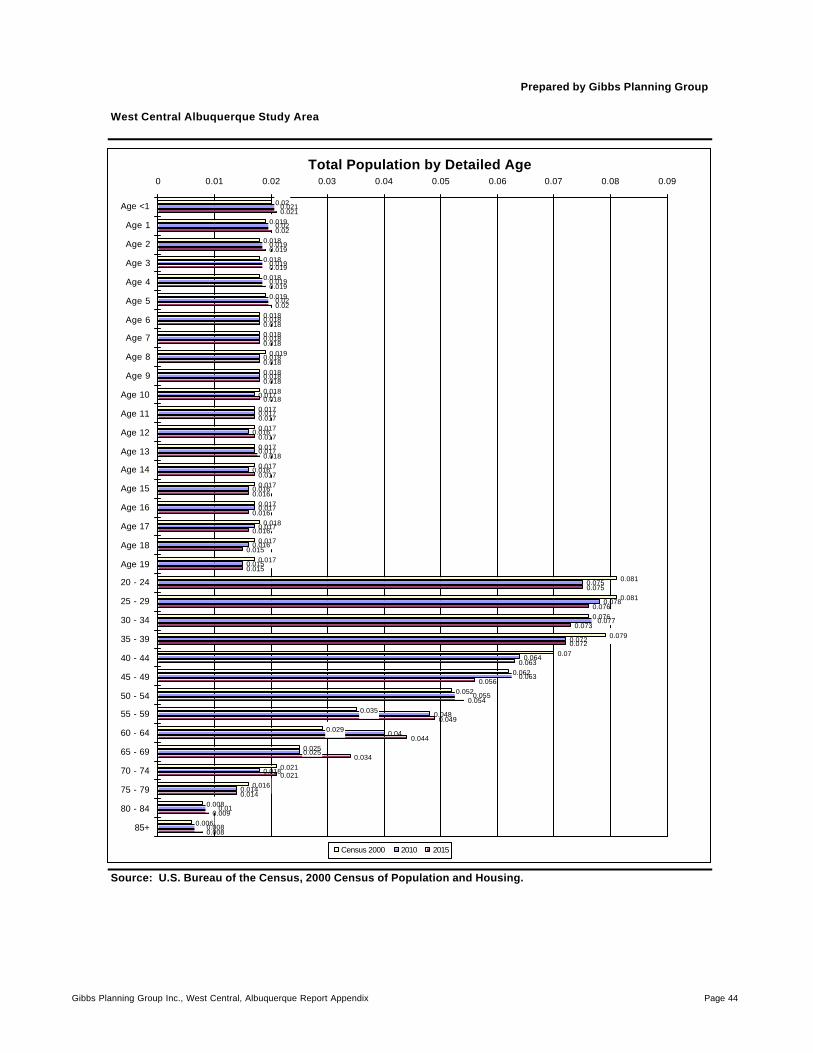
Prepared by Gibbs Planning Group West Central Albuquerque Study Area
Source: U.S. Bureau of the Census, 2000 Census of Population and Housing.
Total Population by Detailed Age
0.02
0.019
0.018
0.018
0.018
0.019
0.018
0.018
0.019
0.018
0.018
0.017
0.017
0.017
0.017
0.017
0.017
0.018
0.017
0.017
0.081
0.081
0.076
0.079
0.07
0.062
0.052
0.035
0.029
0.025
0.021
0.016
0.008
0.006
0.021
0.02
0.019
0.019
0.019
0.02
0.018
0.018
0.018
0.018
0.017
0.017
0.016
0.017
0.016
0.016
0.017
0.017
0.016
0.015
0.075
0.078
0.077
0.072
0.064
0.063
0.055
0.048
0.04
0.025
0.018
0.014
0.01
0.008
0.021
0.02
0.019
0.019
0.019
0.02
0.018
0.018
0.018
0.018
0.018
0.017
0.017
0.018
0.017
0.016
0.016
0.016
0.015
0.015
0.075
0.076
0.073
0.072
0.063
0.056
0.054
0.049
0.044
0.034
0.021
0.014
0.009
0.008
0 0.01 0.02 0.03 0.04 0.05 0.06 0.07 0.08 0.09
Age <1
Age 1
Age 2
Age 3
Age 4
Age 5
Age 6
Age 7
Age 8
Age 9
Age 10
Age 11
Age 12
Age 13
Age 14
Age 15
Age 16
Age 17
Age 18
Age 19
20 - 24
25 - 29
30 - 34
35 - 39
40 - 44
45 - 49
50 - 54
55 - 59
60 - 64
65 - 69
70 - 74
75 - 79
80 - 84
85+
Census 2000 2010 2015
Gibbs Planning Group Inc., West Central, Albuquerque Report Appendix Page 44
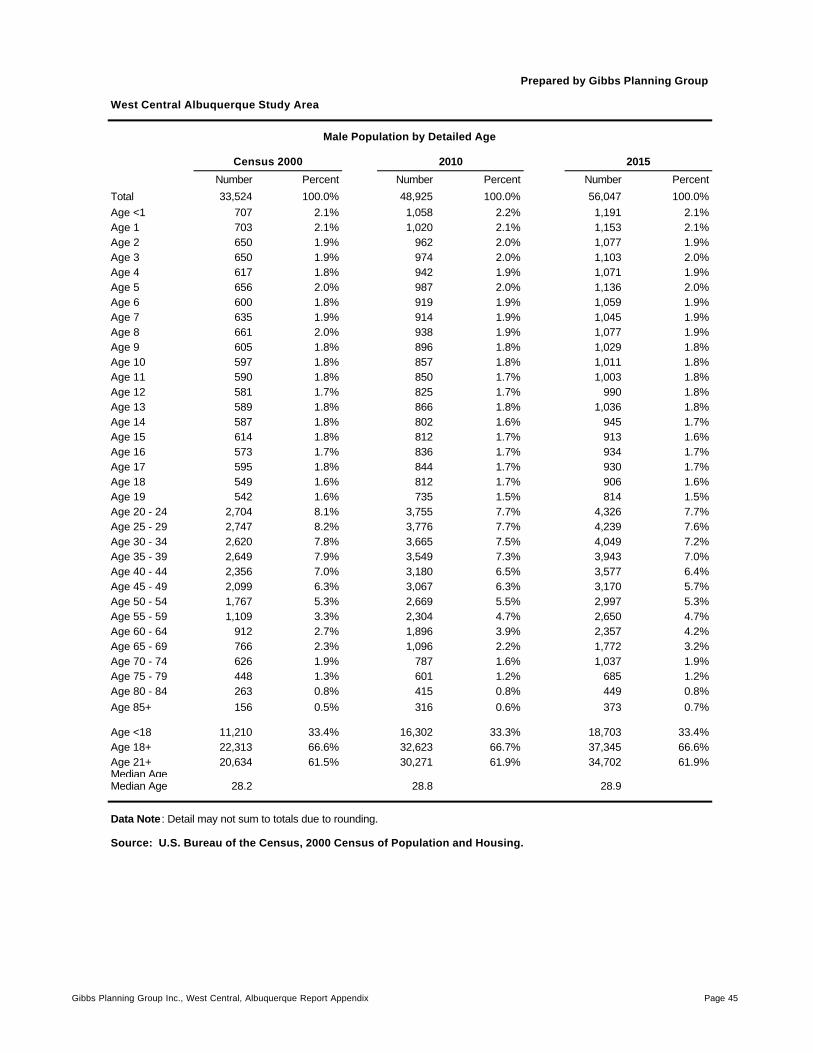
Prepared by Gibbs Planning Group West Central Albuquerque Study Area
Number Percent Number Percent Number Percent
Total 33,524 100.0% 48,925 100.0% 56,047 100.0%Age <1 707 2.1% 1,058 2.2% 1,191 2.1%Age 1 703 2.1% 1,020 2.1% 1,153 2.1%Age 2 650 1.9% 962 2.0% 1,077 1.9%Age 3 650 1.9% 974 2.0% 1,103 2.0%Age 4 617 1.8% 942 1.9% 1,071 1.9%Age 5 656 2.0% 987 2.0% 1,136 2.0%Age 6 600 1.8% 919 1.9% 1,059 1.9%Age 7 635 1.9% 914 1.9% 1,045 1.9%Age 8 661 2.0% 938 1.9% 1,077 1.9%Age 9 605 1.8% 896 1.8% 1,029 1.8%Age 10 597 1.8% 857 1.8% 1,011 1.8%Age 11 590 1.8% 850 1.7% 1,003 1.8%Age 12 581 1.7% 825 1.7% 990 1.8%Age 13 589 1.8% 866 1.8% 1,036 1.8%Age 14 587 1.8% 802 1.6% 945 1.7%Age 15 614 1.8% 812 1.7% 913 1.6%Age 16 573 1.7% 836 1.7% 934 1.7%Age 17 595 1.8% 844 1.7% 930 1.7%Age 18 549 1.6% 812 1.7% 906 1.6%Age 19 542 1.6% 735 1.5% 814 1.5%Age 20 - 24 2,704 8.1% 3,755 7.7% 4,326 7.7%Age 25 - 29 2,747 8.2% 3,776 7.7% 4,239 7.6%Age 30 - 34 2,620 7.8% 3,665 7.5% 4,049 7.2%Age 35 - 39 2,649 7.9% 3,549 7.3% 3,943 7.0%Age 40 - 44 2,356 7.0% 3,180 6.5% 3,577 6.4%Age 45 - 49 2,099 6.3% 3,067 6.3% 3,170 5.7%Age 50 - 54 1,767 5.3% 2,669 5.5% 2,997 5.3%Age 55 - 59 1,109 3.3% 2,304 4.7% 2,650 4.7%Age 60 - 64 912 2.7% 1,896 3.9% 2,357 4.2%Age 65 - 69 766 2.3% 1,096 2.2% 1,772 3.2%Age 70 - 74 626 1.9% 787 1.6% 1,037 1.9%Age 75 - 79 448 1.3% 601 1.2% 685 1.2%Age 80 - 84 263 0.8% 415 0.8% 449 0.8%Age 85+ 156 0.5% 316 0.6% 373 0.7%
Age <18 11,210 33.4% 16,302 33.3% 18,703 33.4%Age 18+ 22,313 66.6% 32,623 66.7% 37,345 66.6%Age 21+ 20,634 61.5% 30,271 61.9% 34,702 61.9%Median AgeMedian Age 28.2 28.8 28.9
Data Note : Detail may not sum to totals due to rounding.
Source: U.S. Bureau of the Census, 2000 Census of Population and Housing.
Male Population by Detailed Age
Census 2000 2010 2015
Gibbs Planning Group Inc., West Central, Albuquerque Report Appendix Page 45
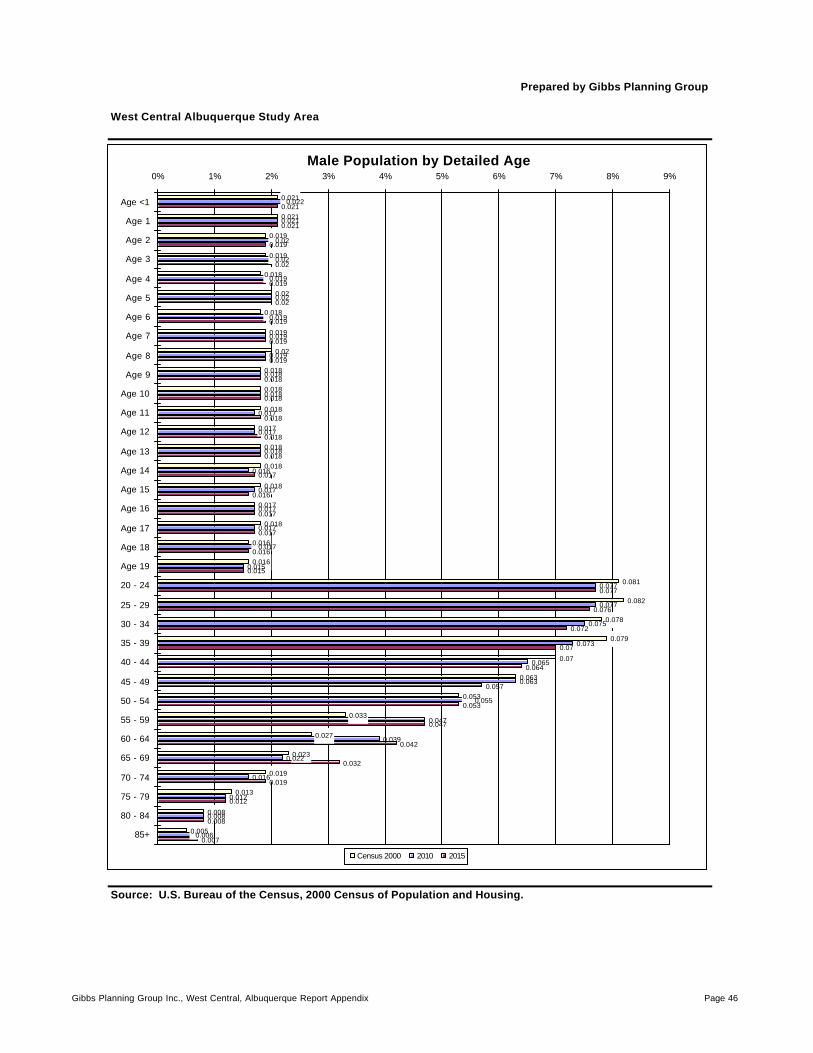
Prepared by Gibbs Planning Group West Central Albuquerque Study Area
Source: U.S. Bureau of the Census, 2000 Census of Population and Housing.
Male Population by Detailed Age
0.021
0.021
0.019
0.019
0.018
0.02
0.018
0.019
0.02
0.018
0.018
0.018
0.017
0.018
0.018
0.018
0.017
0.018
0.016
0.016
0.081
0.082
0.078
0.079
0.07
0.063
0.053
0.033
0.027
0.023
0.019
0.013
0.008
0.005
0.022
0.021
0.02
0.02
0.019
0.02
0.019
0.019
0.019
0.018
0.018
0.017
0.017
0.018
0.016
0.017
0.017
0.017
0.017
0.015
0.077
0.077
0.075
0.073
0.065
0.063
0.055
0.047
0.039
0.022
0.016
0.012
0.008
0.006
0.021
0.021
0.019
0.02
0.019
0.02
0.019
0.019
0.019
0.018
0.018
0.018
0.018
0.018
0.017
0.016
0.017
0.017
0.016
0.015
0.077
0.076
0.072
0.07
0.064
0.057
0.053
0.047
0.042
0.032
0.019
0.012
0.008
0.007
0% 1% 2% 3% 4% 5% 6% 7% 8% 9%
Age <1
Age 1
Age 2
Age 3
Age 4
Age 5
Age 6
Age 7
Age 8
Age 9
Age 10
Age 11
Age 12
Age 13
Age 14
Age 15
Age 16
Age 17
Age 18
Age 19
20 - 24
25 - 29
30 - 34
35 - 39
40 - 44
45 - 49
50 - 54
55 - 59
60 - 64
65 - 69
70 - 74
75 - 79
80 - 84
85+
Census 2000 2010 2015
Gibbs Planning Group Inc., West Central, Albuquerque Report Appendix Page 46
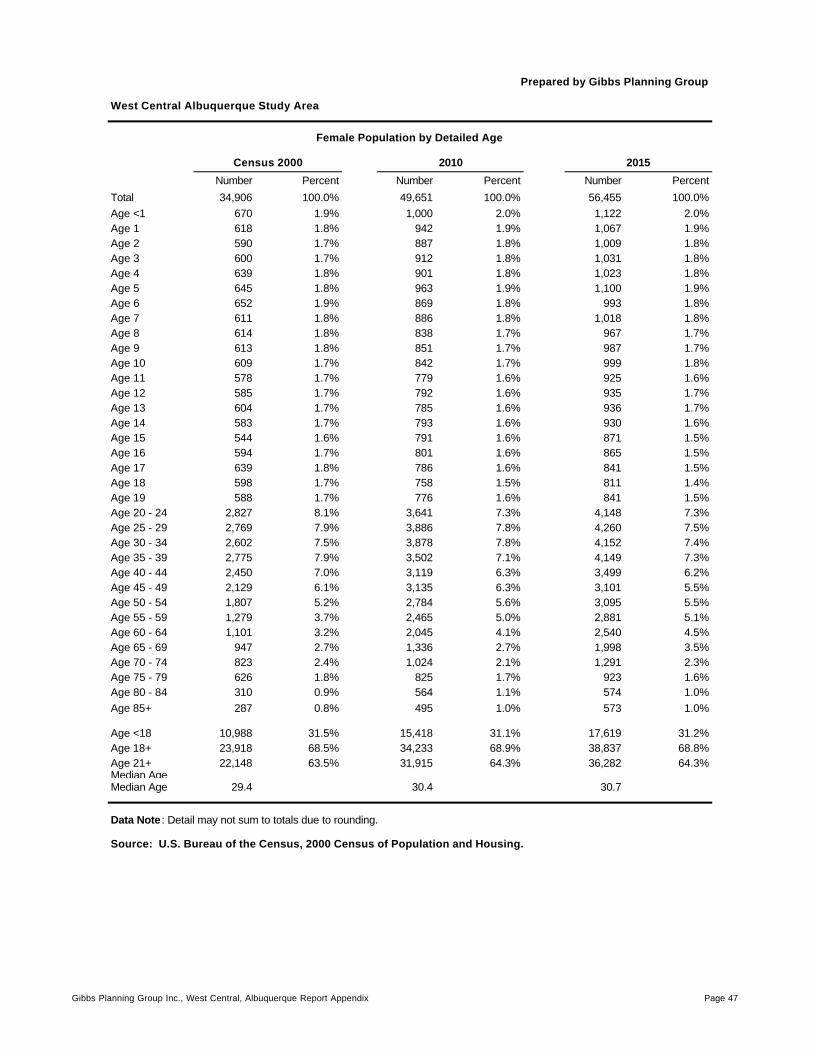
Prepared by Gibbs Planning Group West Central Albuquerque Study Area
Number Percent Number Percent Number Percent
Total 34,906 100.0% 49,651 100.0% 56,455 100.0%Age <1 670 1.9% 1,000 2.0% 1,122 2.0%Age 1 618 1.8% 942 1.9% 1,067 1.9%Age 2 590 1.7% 887 1.8% 1,009 1.8%Age 3 600 1.7% 912 1.8% 1,031 1.8%Age 4 639 1.8% 901 1.8% 1,023 1.8%Age 5 645 1.8% 963 1.9% 1,100 1.9%Age 6 652 1.9% 869 1.8% 993 1.8%Age 7 611 1.8% 886 1.8% 1,018 1.8%Age 8 614 1.8% 838 1.7% 967 1.7%Age 9 613 1.8% 851 1.7% 987 1.7%Age 10 609 1.7% 842 1.7% 999 1.8%Age 11 578 1.7% 779 1.6% 925 1.6%Age 12 585 1.7% 792 1.6% 935 1.7%Age 13 604 1.7% 785 1.6% 936 1.7%Age 14 583 1.7% 793 1.6% 930 1.6%Age 15 544 1.6% 791 1.6% 871 1.5%Age 16 594 1.7% 801 1.6% 865 1.5%Age 17 639 1.8% 786 1.6% 841 1.5%Age 18 598 1.7% 758 1.5% 811 1.4%Age 19 588 1.7% 776 1.6% 841 1.5%Age 20 - 24 2,827 8.1% 3,641 7.3% 4,148 7.3%Age 25 - 29 2,769 7.9% 3,886 7.8% 4,260 7.5%Age 30 - 34 2,602 7.5% 3,878 7.8% 4,152 7.4%Age 35 - 39 2,775 7.9% 3,502 7.1% 4,149 7.3%Age 40 - 44 2,450 7.0% 3,119 6.3% 3,499 6.2%Age 45 - 49 2,129 6.1% 3,135 6.3% 3,101 5.5%Age 50 - 54 1,807 5.2% 2,784 5.6% 3,095 5.5%Age 55 - 59 1,279 3.7% 2,465 5.0% 2,881 5.1%Age 60 - 64 1,101 3.2% 2,045 4.1% 2,540 4.5%Age 65 - 69 947 2.7% 1,336 2.7% 1,998 3.5%Age 70 - 74 823 2.4% 1,024 2.1% 1,291 2.3%Age 75 - 79 626 1.8% 825 1.7% 923 1.6%Age 80 - 84 310 0.9% 564 1.1% 574 1.0%Age 85+ 287 0.8% 495 1.0% 573 1.0%
Age <18 10,988 31.5% 15,418 31.1% 17,619 31.2%Age 18+ 23,918 68.5% 34,233 68.9% 38,837 68.8%Age 21+ 22,148 63.5% 31,915 64.3% 36,282 64.3%Median AgeMedian Age 29.4 30.4 30.7
Data Note : Detail may not sum to totals due to rounding.
Source: U.S. Bureau of the Census, 2000 Census of Population and Housing.
Census 2000 2010 2015
Female Population by Detailed Age
Gibbs Planning Group Inc., West Central, Albuquerque Report Appendix Page 47
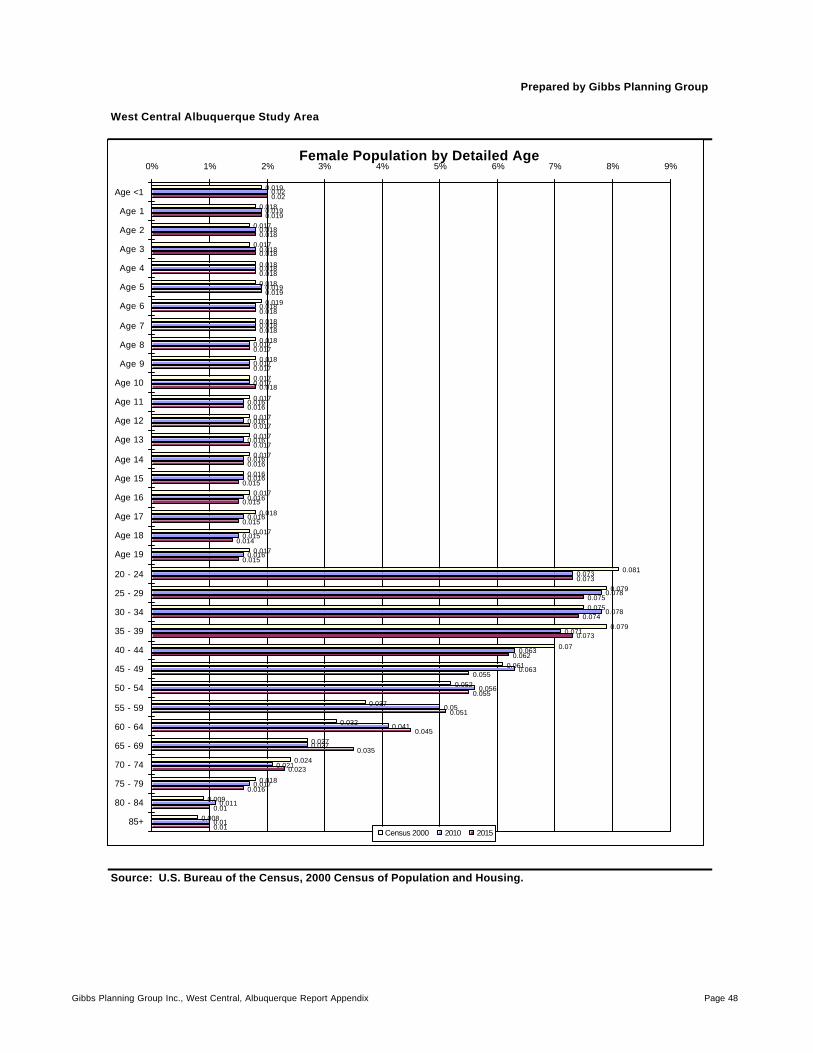
Prepared by Gibbs Planning Group West Central Albuquerque Study Area
Source: U.S. Bureau of the Census, 2000 Census of Population and Housing.
Female Population by Detailed Age
0.019
0.018
0.017
0.017
0.018
0.018
0.019
0.018
0.018
0.018
0.017
0.017
0.017
0.017
0.017
0.016
0.017
0.018
0.017
0.017
0.081
0.079
0.075
0.079
0.07
0.061
0.052
0.037
0.032
0.027
0.024
0.018
0.009
0.008
0.02
0.019
0.018
0.018
0.018
0.019
0.018
0.018
0.017
0.017
0.017
0.016
0.016
0.016
0.016
0.016
0.016
0.016
0.015
0.016
0.073
0.078
0.078
0.071
0.063
0.063
0.056
0.05
0.041
0.027
0.021
0.017
0.011
0.01
0.02
0.019
0.018
0.018
0.018
0.019
0.018
0.018
0.017
0.017
0.018
0.016
0.017
0.017
0.016
0.015
0.015
0.015
0.014
0.015
0.073
0.075
0.074
0.073
0.062
0.055
0.055
0.051
0.045
0.035
0.023
0.016
0.01
0.01
0% 1% 2% 3% 4% 5% 6% 7% 8% 9%
Age <1
Age 1
Age 2
Age 3
Age 4
Age 5
Age 6
Age 7
Age 8
Age 9
Age 10
Age 11
Age 12
Age 13
Age 14
Age 15
Age 16
Age 17
Age 18
Age 19
20 - 24
25 - 29
30 - 34
35 - 39
40 - 44
45 - 49
50 - 54
55 - 59
60 - 64
65 - 69
70 - 74
75 - 79
80 - 84
85+Census 2000 2010 2015
Gibbs Planning Group Inc., West Central, Albuquerque Report Appendix Page 48
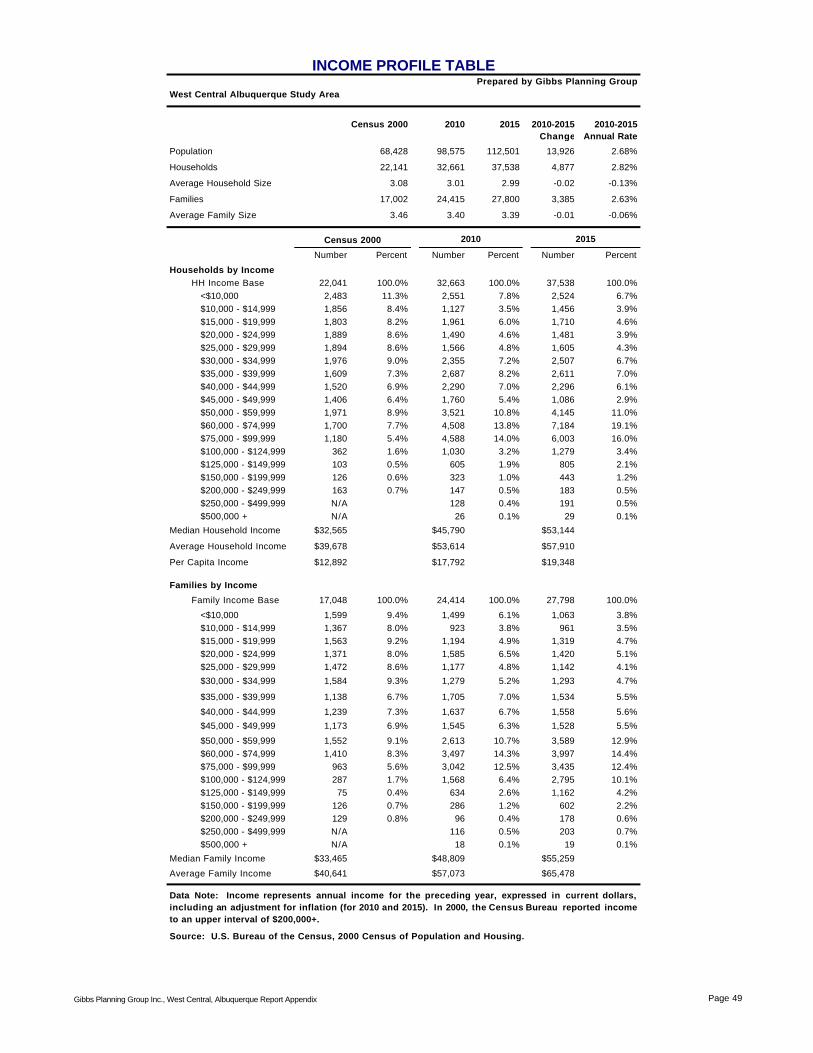
Prepared by Gibbs Planning GroupWest Central Albuquerque Study Area
Census 2000 2010 2015 2010-2015 2010-2015Change Annual Rate
Population 68,428 98,575 112,501 13,926 2.68%
Households 22,141 32,661 37,538 4,877 2.82%
Average Household Size 3.08 3.01 2.99 -0.02 -0.13%
Families 17,002 24,415 27,800 3,385 2.63%
Average Family Size 3.46 3.40 3.39 -0.01 -0.06%
Census 2000
Number Percent Number Percent Number Percent
Households by IncomeHH Income Base 22,041 100.0% 32,663 100.0% 37,538 100.0% <$10,000 2,483 11.3% 2,551 7.8% 2,524 6.7% $10,000 - $14,999 1,856 8.4% 1,127 3.5% 1,456 3.9% $15,000 - $19,999 1,803 8.2% 1,961 6.0% 1,710 4.6% $20,000 - $24,999 1,889 8.6% 1,490 4.6% 1,481 3.9% $25,000 - $29,999 1,894 8.6% 1,566 4.8% 1,605 4.3% $30,000 - $34,999 1,976 9.0% 2,355 7.2% 2,507 6.7% $35,000 - $39,999 1,609 7.3% 2,687 8.2% 2,611 7.0% $40,000 - $44,999 1,520 6.9% 2,290 7.0% 2,296 6.1% $45,000 - $49,999 1,406 6.4% 1,760 5.4% 1,086 2.9% $50,000 - $59,999 1,971 8.9% 3,521 10.8% 4,145 11.0% $60,000 - $74,999 1,700 7.7% 4,508 13.8% 7,184 19.1% $75,000 - $99,999 1,180 5.4% 4,588 14.0% 6,003 16.0% $100,000 - $124,999 362 1.6% 1,030 3.2% 1,279 3.4% $125,000 - $149,999 103 0.5% 605 1.9% 805 2.1% $150,000 - $199,999 126 0.6% 323 1.0% 443 1.2% $200,000 - $249,999 163 0.7% 147 0.5% 183 0.5% $250,000 - $499,999 N/A 128 0.4% 191 0.5% $500,000 + N/A 26 0.1% 29 0.1%
Median Household Income $32,565 $45,790 $53,144
Average Household Income $39,678 $53,614 $57,910
Per Capita Income $12,892 $17,792 $19,348
Families by Income
Family Income Base 17,048 100.0% 24,414 100.0% 27,798 100.0%
<$10,000 1,599 9.4% 1,499 6.1% 1,063 3.8% $10,000 - $14,999 1,367 8.0% 923 3.8% 961 3.5% $15,000 - $19,999 1,563 9.2% 1,194 4.9% 1,319 4.7% $20,000 - $24,999 1,371 8.0% 1,585 6.5% 1,420 5.1% $25,000 - $29,999 1,472 8.6% 1,177 4.8% 1,142 4.1%
$30,000 - $34,999 1,584 9.3% 1,279 5.2% 1,293 4.7%
$35,000 - $39,999 1,138 6.7% 1,705 7.0% 1,534 5.5%
$40,000 - $44,999 1,239 7.3% 1,637 6.7% 1,558 5.6%
$45,000 - $49,999 1,173 6.9% 1,545 6.3% 1,528 5.5%
$50,000 - $59,999 1,552 9.1% 2,613 10.7% 3,589 12.9% $60,000 - $74,999 1,410 8.3% 3,497 14.3% 3,997 14.4% $75,000 - $99,999 963 5.6% 3,042 12.5% 3,435 12.4% $100,000 - $124,999 287 1.7% 1,568 6.4% 2,795 10.1% $125,000 - $149,999 75 0.4% 634 2.6% 1,162 4.2% $150,000 - $199,999 126 0.7% 286 1.2% 602 2.2% $200,000 - $249,999 129 0.8% 96 0.4% 178 0.6% $250,000 - $499,999 N/A 116 0.5% 203 0.7% $500,000 + N/A 18 0.1% 19 0.1%
Median Family Income $33,465 $48,809 $55,259
Average Family Income $40,641 $57,073 $65,478
Source: U.S. Bureau of the Census, 2000 Census of Population and Housing.
Data Note: Income represents annual income for the preceding year, expressed in current dollars,including an adjustment for inflation (for 2010 and 2015). In 2000, the Census Bureau reported incometo an upper interval of $200,000+.
INCOME PROFILE TABLE
2010 2015
Gibbs Planning Group Inc., West Central, Albuquerque Report Appendix Page 49
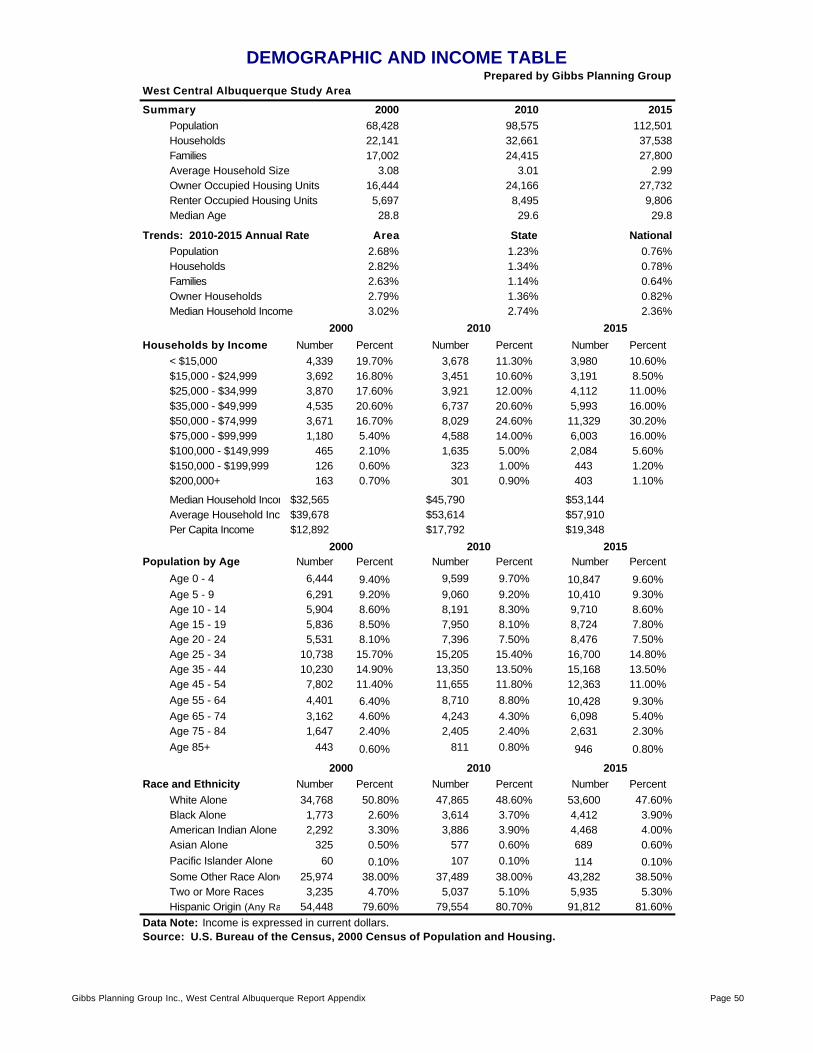
Prepared by Gibbs Planning GroupWest Central Albuquerque Study Area Summary 2000 2010 2015
Population 68,428 98,575 112,501Households 22,141 32,661 37,538Families 17,002 24,415 27,800Average Household Size 3.08 3.01 2.99Owner Occupied Housing Units 16,444 24,166 27,732Renter Occupied Housing Units 5,697 8,495 9,806Median Age 28.8 29.6 29.8
Trends: 2010-2015 Annual Rate Area State NationalPopulation 2.68% 1.23% 0.76%Households 2.82% 1.34% 0.78%Families 2.63% 1.14% 0.64%Owner Households 2.79% 1.36% 0.82%Median Household Income 3.02% 2.74% 2.36%
Households by Income Number Percent Number Percent Number Percent< $15,000 4,339 19.70% 3,678 11.30% 3,980 10.60%$15,000 - $24,999 3,692 16.80% 3,451 10.60% 3,191 8.50%$25,000 - $34,999 3,870 17.60% 3,921 12.00% 4,112 11.00%$35,000 - $49,999 4,535 20.60% 6,737 20.60% 5,993 16.00%$50,000 - $74,999 3,671 16.70% 8,029 24.60% 11,329 30.20%$75,000 - $99,999 1,180 5.40% 4,588 14.00% 6,003 16.00%$100,000 - $149,999 465 2.10% 1,635 5.00% 2,084 5.60%$150,000 - $199,999 126 0.60% 323 1.00% 443 1.20%$200,000+ 163 0.70% 301 0.90% 403 1.10%
Median Household Income$32,565 $45,790 $53,144Average Household Income$39,678 $53,614 $57,910Per Capita Income $12,892 $17,792 $19,348
Population by Age Number Percent Number Percent Number Percent
Age 0 - 4 6,444 9.40% 9,599 9.70% 10,847 9.60%Age 5 - 9 6,291 9.20% 9,060 9.20% 10,410 9.30%Age 10 - 14 5,904 8.60% 8,191 8.30% 9,710 8.60%Age 15 - 19 5,836 8.50% 7,950 8.10% 8,724 7.80%Age 20 - 24 5,531 8.10% 7,396 7.50% 8,476 7.50%Age 25 - 34 10,738 15.70% 15,205 15.40% 16,700 14.80%Age 35 - 44 10,230 14.90% 13,350 13.50% 15,168 13.50%Age 45 - 54 7,802 11.40% 11,655 11.80% 12,363 11.00%Age 55 - 64 4,401 6.40% 8,710 8.80% 10,428 9.30%Age 65 - 74 3,162 4.60% 4,243 4.30% 6,098 5.40%Age 75 - 84 1,647 2.40% 2,405 2.40% 2,631 2.30%Age 85+ 443 0.60% 811 0.80% 946 0.80%
Race and Ethnicity Number Percent Number Percent Number PercentWhite Alone 34,768 50.80% 47,865 48.60% 53,600 47.60%Black Alone 1,773 2.60% 3,614 3.70% 4,412 3.90%American Indian Alone 2,292 3.30% 3,886 3.90% 4,468 4.00%Asian Alone 325 0.50% 577 0.60% 689 0.60%Pacific Islander Alone 60 0.10% 107 0.10% 114 0.10%Some Other Race Alone 25,974 38.00% 37,489 38.00% 43,282 38.50%Two or More Races 3,235 4.70% 5,037 5.10% 5,935 5.30%Hispanic Origin (Any Race) 54,448 79.60% 79,554 80.70% 91,812 81.60%
2000 2010 2015
Source: U.S. Bureau of the Census, 2000 Census of Population and Housing.Data Note: Income is expressed in current dollars.
DEMOGRAPHIC AND INCOME TABLE
2000 2010 2015
2000 2010 2015
Gibbs Planning Group Inc., West Central Albuquerque Report Appendix Page 50
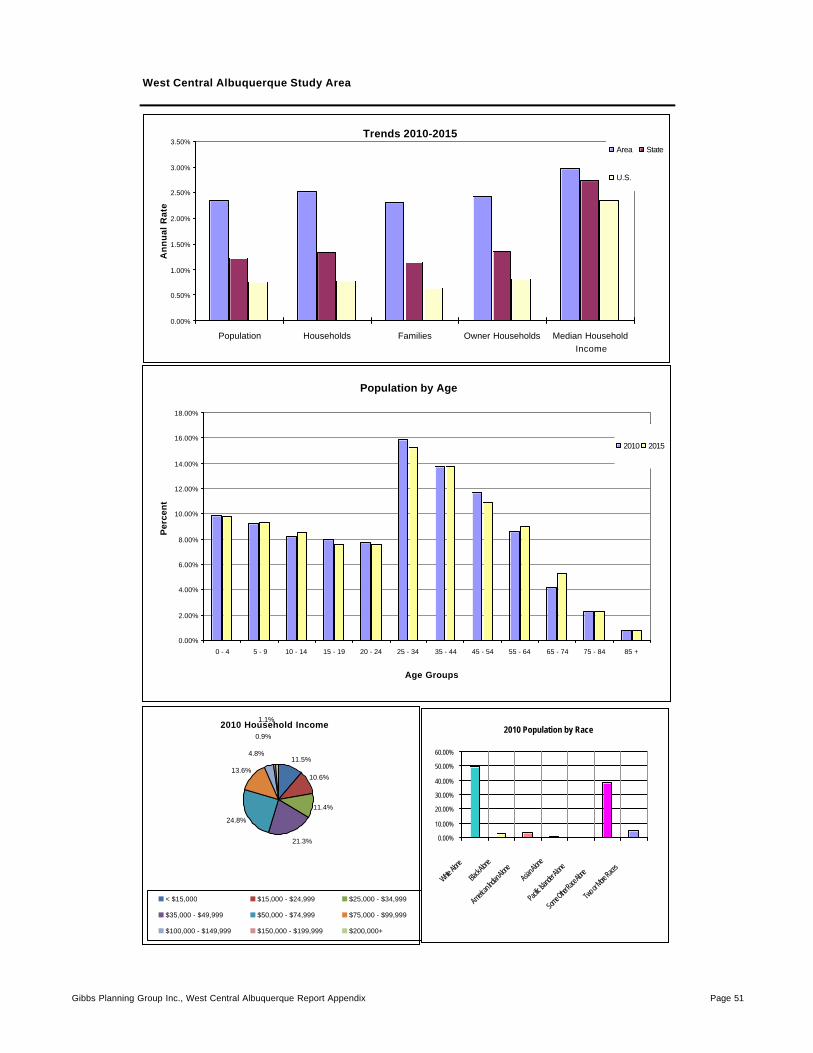
West Central Albuquerque Study Area
Trends 2010-2015
0.00%
0.50%
1.00%
1.50%
2.00%
2.50%
3.00%
3.50%
Population Households Families Owner Households Median HouseholdIncome
An
nu
al R
ate
Area State
U.S.
Population by Age
0.00%
2.00%
4.00%
6.00%
8.00%
10.00%
12.00%
14.00%
16.00%
18.00%
0 - 4 5 - 9 10 - 14 15 - 19 20 - 24 25 - 34 35 - 44 45 - 54 55 - 64 65 - 74 75 - 84 85 +
Age Groups
Per
cen
t
2010 2015
2010 Household Income
11.5%
10.6%
11.4%
21.3%
24.8%
13.6%
4.8%
0.9%
1.1%
< $15,000 $15,000 - $24,999 $25,000 - $34,999
$35,000 - $49,999 $50,000 - $74,999 $75,000 - $99,999
$100,000 - $149,999 $150,000 - $199,999 $200,000+
2010 Population by Race
0.00%
10.00%
20.00%
30.00%
40.00%
50.00%
60.00%
White Alo
ne
Black A
lone
Americ
an Ind
ian Alo
neAsi
an Alo
ne
Pacific I
slander
Alone
Some O
ther Ra
ce Alone
Two o
r More
Races
Gibbs Planning Group Inc., West Central Albuquerque Report Appendix Page 51
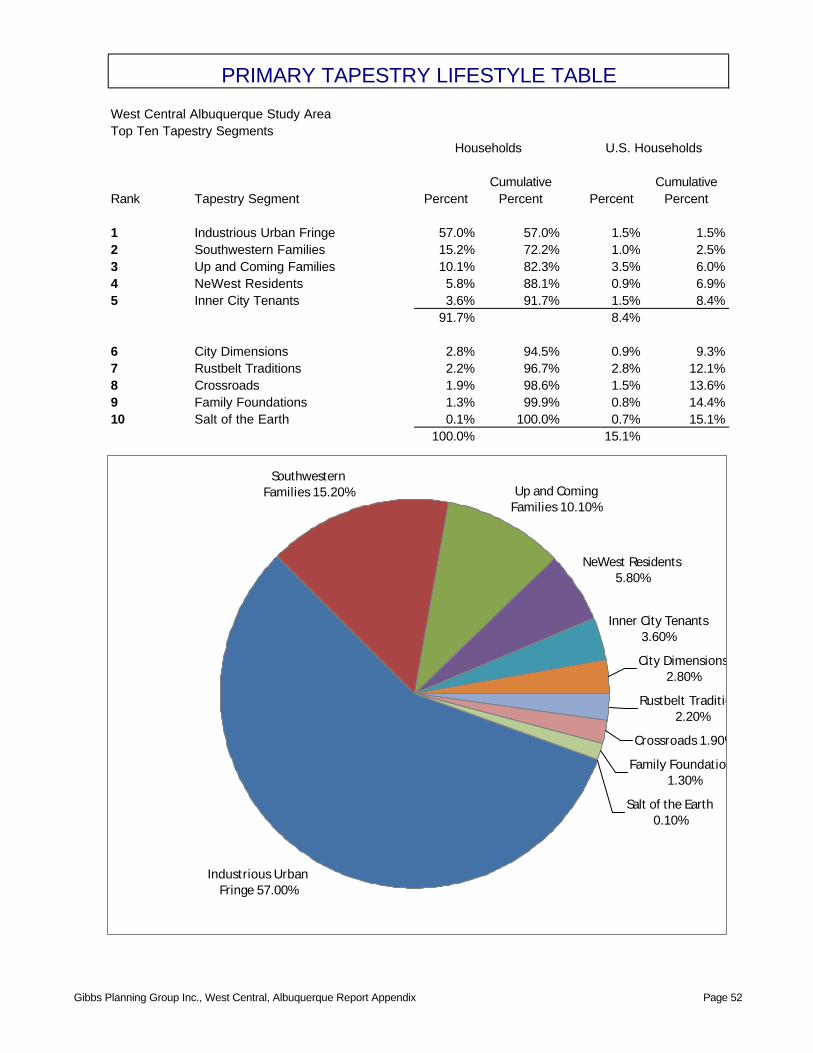
West Central Albuquerque Study Area Top Ten Tapestry Segments
Cumulative CumulativeRank Tapestry Segment Percent Percent Percent Percent
1 Industrious Urban Fringe 57.0% 57.0% 1.5% 1.5%2 Southwestern Families 15.2% 72.2% 1.0% 2.5%3 Up and Coming Families 10.1% 82.3% 3.5% 6.0%4 NeWest Residents 5.8% 88.1% 0.9% 6.9%5 Inner City Tenants 3.6% 91.7% 1.5% 8.4%
91.7% 8.4%
6 City Dimensions 2.8% 94.5% 0.9% 9.3%7 Rustbelt Traditions 2.2% 96.7% 2.8% 12.1%8 Crossroads 1.9% 98.6% 1.5% 13.6%9 Family Foundations 1.3% 99.9% 0.8% 14.4%10 Salt of the Earth 0.1% 100.0% 0.7% 15.1%
100.0% 15.1%
PRIMARY TAPESTRY LIFESTYLE TABLE
U.S. HouseholdsHouseholds
Industrious Urban Fringe 57.00%
Southwestern Families 15.20% Up and Coming
Families 10.10%
NeWest Residents 5.80%
Inner City Tenants 3.60%
City Dimensions 2.80%
Rustbelt Traditions 2.20%
Crossroads 1.90%
Family Foundations 1.30%
Salt of the Earth 0.10%
Gibbs Planning Group Inc., West Central, Albuquerque Report Appendix Page 52
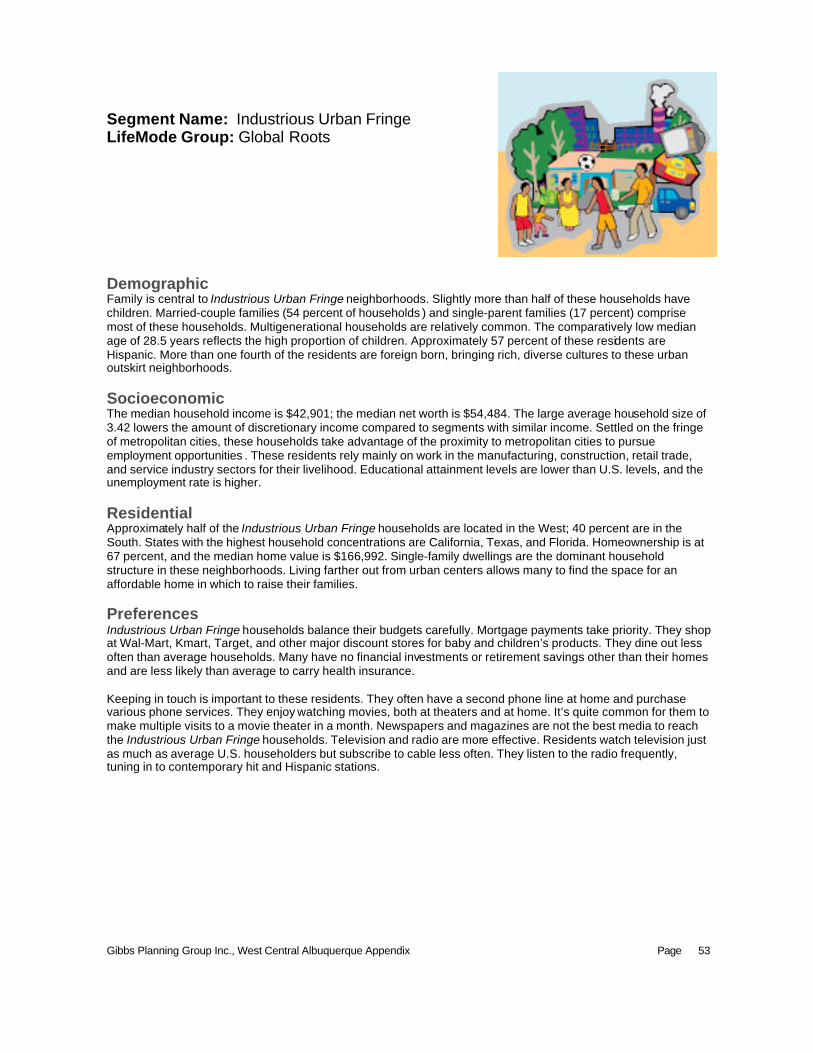
Gibbs Planning Group Inc., West Central Albuquerque Appendix Page
53
Segment Name: Industrious Urban Fringe LifeMode Group: Global Roots
Demographic Family is central to Industrious Urban Fringe neighborhoods. Slightly more than half of these households have children. Married-couple families (54 percent of households ) and single-parent families (17 percent) comprise most of these households. Multigenerational households are relatively common. The comparatively low median age of 28.5 years reflects the high proportion of children. Approximately 57 percent of these residents are Hispanic. More than one fourth of the residents are foreign born, bringing rich, diverse cultures to these urban outskirt neighborhoods. Socioeconomic The median household income is $42,901; the median net worth is $54,484. The large average household size of 3.42 lowers the amount of discretionary income compared to segments with similar income. Settled on the fringe of metropolitan cities, these households take advantage of the proximity to metropolitan cities to pursue employment opportunities . These residents rely mainly on work in the manufacturing, construction, retail trade, and service industry sectors for their livelihood. Educational attainment levels are lower than U.S. levels, and the unemployment rate is higher. Residential Approximately half of the Industrious Urban Fringe households are located in the West; 40 percent are in the South. States with the highest household concentrations are California, Texas, and Florida. Homeownership is at 67 percent, and the median home value is $166,992. Single-family dwellings are the dominant household structure in these neighborhoods. Living farther out from urban centers allows many to find the space for an affordable home in which to raise their families. Preferences Industrious Urban Fringe households balance their budgets carefully. Mortgage payments take priority. They shop at Wal-Mart, Kmart, Target, and other major discount stores for baby and children’s products. They dine out less often than average households. Many have no financial investments or retirement savings other than their homes and are less likely than average to carry health insurance. Keeping in touch is important to these residents. They often have a second phone line at home and purchase various phone services. They enjoy watching movies, both at theaters and at home. It’s quite common for them to make multiple visits to a movie theater in a month. Newspapers and magazines are not the best media to reach the Industrious Urban Fringe households. Television and radio are more effective. Residents watch television just as much as average U.S. householders but subscribe to cable less often. They listen to the radio frequently, tuning in to contemporary hit and Hispanic stations.
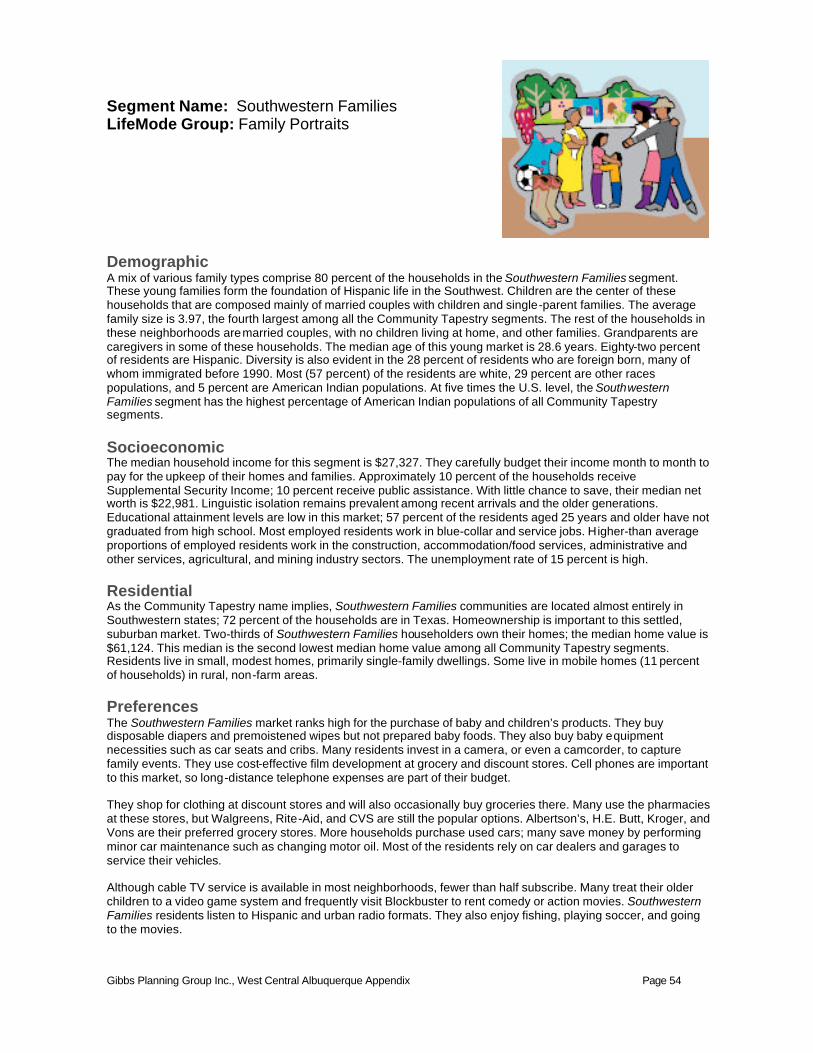
Gibbs Planning Group Inc., West Central Albuquerque Appendix Page 54
Segment Name: Southwestern Families LifeMode Group: Family Portraits
Demographic A mix of various family types comprise 80 percent of the households in the Southwestern Families segment. These young families form the foundation of Hispanic life in the Southwest. Children are the center of these households that are composed mainly of married couples with children and single-parent families. The average family size is 3.97, the fourth largest among all the Community Tapestry segments. The rest of the households in these neighborhoods are married couples, with no children living at home, and other families. Grandparents are caregivers in some of these households. The median age of this young market is 28.6 years. Eighty-two percent of residents are Hispanic. Diversity is also evident in the 28 percent of residents who are foreign born, many of whom immigrated before 1990. Most (57 percent) of the residents are white, 29 percent are other races populations, and 5 percent are American Indian populations. At five times the U.S. level, the Southwestern Families segment has the highest percentage of American Indian populations of all Community Tapestry segments. Socioeconomic The median household income for this segment is $27,327. They carefully budget their income month to month to pay for the upkeep of their homes and families. Approximately 10 percent of the households receive Supplemental Security Income; 10 percent receive public assistance. With little chance to save, their median net worth is $22,981. Linguistic isolation remains prevalent among recent arrivals and the older generations. Educational attainment levels are low in this market; 57 percent of the residents aged 25 years and older have not graduated from high school. Most employed residents work in blue-collar and service jobs. Higher-than average proportions of employed residents work in the construction, accommodation/food services, administrative and other services, agricultural, and mining industry sectors. The unemployment rate of 15 percent is high. Residential As the Community Tapestry name implies, Southwestern Families communities are located almost entirely in Southwestern states; 72 percent of the households are in Texas. Homeownership is important to this settled, suburban market. Two-thirds of Southwestern Families householders own their homes; the median home value is $61,124. This median is the second lowest median home value among all Community Tapestry segments. Residents live in small, modest homes, primarily single-family dwellings. Some live in mobile homes (11 percent of households) in rural, non-farm areas. Preferences The Southwestern Families market ranks high for the purchase of baby and children’s products. They buy disposable diapers and premoistened wipes but not prepared baby foods. They also buy baby equipment necessities such as car seats and cribs. Many residents invest in a camera, or even a camcorder, to capture family events. They use cost-effective film development at grocery and discount stores. Cell phones are important to this market, so long-distance telephone expenses are part of their budget. They shop for clothing at discount stores and will also occasionally buy groceries there. Many use the pharmacies at these stores, but Walgreens, Rite-Aid, and CVS are still the popular options. Albertson’s, H.E. Butt, Kroger, and Vons are their preferred grocery stores. More households purchase used cars; many save money by performing minor car maintenance such as changing motor oil. Most of the residents rely on car dealers and garages to service their vehicles. Although cable TV service is available in most neighborhoods, fewer than half subscribe. Many treat their older children to a video game system and frequently visit Blockbuster to rent comedy or action movies. Southwestern Families residents listen to Hispanic and urban radio formats. They also enjoy fishing, playing soccer, and going to the movies.
Gibbs Planning Group Inc., West Central Albuquerque Appendix Page 55
Segment Name: Up and Coming Families LifeMode Group: Family Portrait
Demographic With an annual growth rate of 4.2 percent, Up and Coming Families represents the second highest household growth market and the youngest affluent family market (with a median age of 32.0 years) of Community Tapestry. Residents are a mix of Generation X’ers and baby boomers. The profile for this market is young, affluent families with younger children. Eighty percent of households are composed of families. Approximately two-fifths of households consist of married couples with children. Most of the residents in this segment are white; however, the diversity of the population is increasing with its size. Socioeconomic At the beginning of their careers, Up and Coming Families residents are earning above-average income but have not had time to accumulate much wealth. The median household income is $77,444, well above the national median. The median net worth is $162,486. Nearly two-thirds of residents aged 25 years and older have a degree or some college credits. Labor force participation is well above average at 73 percent, and unemployment is low. Understandably, 91 percent of households derive income from wage and salary compensation. Although half of the households have children, they also have working parents. Residential Nearly half of Up and Coming Families segments are concentrated in the South, the other half in the West and Midwest. These neighborhoods are located in suburban outskirts of midsized metropolitan areas with populations higher than 250,000. Households are mainly new single-family dwellings. Homeownership is at 85 percent. More than half of the housing units were built in the last 10 years. Houses in these neighborhoods are valued at $221,956, slightly above the U.S. median. Preferences Consumer choices for Up and Coming Families are dictated by family and home. Many are beginning or expanding their families, so maternity clothes and baby equipment are essential purchases in addition to children’s clothing and toys. Because many are ?rst-time homeowners, purchases such as basic household furniture and lawn fertilizer, weed control, and insecticide are important. Vying for attention in the family budget are car loans, student loans, and mortgage payments. Up and Coming Families residents most likely own or lease an SUV or minivan. They enjoy eating out at family restaurants such as Red Robin, Chili’s Grill & Bar, and Olive Garden and fast-food restaurants such as Chick-fil-A, Chuck E. Cheese’s, and Papa John’s. Leisure activities include playing softball, going to the zoo, and visiting theme parks (generally Sea World or Disney World), where they make good use of their digital camera or camcorder. They enjoy renting science fiction, comedy, and family type DVDs. A favorite TV show is 24. Favorite cable stations are Oxygen, E!, and the Discovery Health Channel. Residents prefer to listen to soft adult contemporary, sports, and classic hits radio.
Gibbs Planning Group Inc., West Central Albuquerque Appendix Page 56
Segment Name: NeWest Residents LifeMode Group: Global Roots
Demographic The NeWest Residents market possesses the third largest average family size (4.03) of all the Community Tapestry segments. Families dominate this market. Children are present in 54 percent of the households, either in married-couple families or single-parent families. Another 19 percent of the households are composed of married-couple families with no children living at home as well as other families. This segment is the fifth youngest of all the Community Tapestry segments, with a median age of 25.5 years. Dependent children are 36 percent of the population; 38 percent of householders are younger than 35 years of age. Approximately half of this young population is foreign born, more than half of whom have arrived in the United States in the last 10 years. Hispanic cultures are predominant in this family-oriented segment. More than three-fourths of the residents are His panic. Two fifths of residents are white, approximately two-fifths are other races populations (second highest of all Community Tapestry segments), and 6 percent are multiracial populations (two times that of the national level). This market is one of the top five most diverse of all Community Tapestry markets. Socioeconomic Most NeWest Residents are not only new to America but also beginning their careers and families. They arrived in the country with few funds but began saving their hard-earned dollars. The median net worth is about $15,946. Language is a significant barrier for many; this market has the highest concentration of households who speak a language other than English. Approximately 59 percent of residents aged 25 years and older have not completed high school. Lack of education limits their employment options. Most residents who are employed work in service and skilled labor occupations. Higher-than-average proportions of employed residents work in the construction, manufacturing, accommodation/ food services, administrative services, other services, and agricultural industry sectors. The 15 percent rate of unemployment is high. Some households receive Supplemental Security Income or public assistance. The median household income for this segment is $27,180. Residential Most NeWest Residents rent apartments in mid- or highrise buildings in major cities, chiefly in the West and South. California has the largest concentration of households, followed by Texas. The average gross rent is approximately $556 per month. Most housing units in these neighborhoods were built before 1980. Homeownership is at 18 percent; the median home value is $179,477. Preferences NeWest Residents families put their children first. They lead a strong, family-oriented lifestyle with an emphasis on buying groceries and baby and children’s products. They usually buy only the essentials such as baby food, baby supplies, baby car seats, and children’s clothing. They shop for groceries at Vons, Pathmark, and Ralphs but will stop at local convenience stores for milk, juice drinks, and nonprescription drugs. To save money, they prepare from-scratch meals at home, steering away from prepackaged meals. Residents prefer to use cash; credit card ownership and usage are low in this market. Because most of these householders rent, they do not participate in gardening or invest in big-ticket furniture items. They buy basic bedding and bath goods as well as cooking and serving items. They own one television set; few have Internet access, and cable TV is not considered a necessity. They like to watch soccer and professional wrestling on TV, in particular, and listen to Hispanic radio stations.
Gibbs Planning Group Inc., West Central Albuquerque Appendix Page 57
Segment Name: Inner City Tenants LifeMode Group: Global Roots
Demographic Inner City Tenants residents are a microcosm of urban diversity; their population is represented primarily by white, black, and Hispanic cultures. Twenty-nine percent of the residents are Hispanic. This multicultural market is younger than average, with a median age of 27.9 years. The household composition also reflects their youth. Composed of a mix of household types, 34 percent of households are single person, 28 percent are married-couple families, 21 percent are single parent families, and 10 percent are shared hous ing. Turnover is high in these neighborhoods because many individuals are enrolled in nearby colleges and work part-time. These neighborhoods are also a stepping-stone for recent immigrants, with an annual population growth of 0.72 percent. Socioeconomic The median household income for this segment is $32,497; the median net worth is $23,508. Because few own their homes, most of their net worth comes from savings. Eighty three percent of households derive income from wages and salaries; 7 percent receive public assistance income. Thirty percent of the residents aged 25 years and older have attended college. Earning a college degree is at the forefront of their goals, so many work part- and full-time to fund their college education. Approximately half of the employed residents work in white-collar occupations. This market has twice the national level of residents who work in the accommodation/ food services industry. Residential These neighborhoods are located primarily in the South and West. Most Inner City Tenants residents rent economical apartments in mid- or high-rise buildings. One-fifth of the housing is owner-occupied, and the median home value is $132,310. Most of the housing units were built in the 1960s, 1970s, and 1980s. For their average commute to work of 24.6 minutes, many residents drive their vehicle or depend on other modes of transportation. Seventeen percent of the households do not own a vehicle. Preferences With their busy lifestyle, Inner City Tenants residents frequently eat at fast-food restaurants and shop for groceries at nearby stores such as Pathmark and Food Lion. They prefer easy-to-prepare frozen and canned foods. Internet access at home is not typical in this market, but those who have no access at home will surf the Internet at school or at the library. Playing games and visiting chat rooms are typical online activities. Residents refer to the Yellow Pages frequently to look up all kinds of information. Recent household purchases by this market include video game systems as well as baby food, baby products, baby furniture, and baby equipment. Many households carry renter’s insurance. Residents prefer to shop at discount stores such as Wal-Mart and T.J. Maxx. Inner City Tenants residents go to the movies and attend professional football and basketball games. They water-ski and play football, basketball, and soccer. They read music, baby, computer, and sports magazines; enjoy religious books and adventure stories; and listen to professional football and urban radio. Some enjoy the nightlife, visiting bars and nightclubs to go dancing.
Gibbs Planning Group Inc., West Central Albuquerque Appendix Page 58
Segment Name: City Dimensions LifeMode Group: Global Roots
Demographic Diversity in household type and ethnicity characterizes City Dimensions neighborhoods. Most of these residents are young, with a median age of 29.2 years. Households are a mix of types; most are singles who live alone (31 percent), married-couple families (30 percent), and single-parent families (23 percent). Ethnic diversity is high. Half of the residents are white and one-fourth are black; however, higher-than average proportions of other races populations are also represented. Twenty-nine percent of the residents are of Hispanic origin.
Socioeconomic The median household income for this market is $27,639. Ten percent of the households receive Supplemental Security Income; 11 percent receive public assistance. Employed residents work full-time or part-time, primarily in the service, manufacturing, and retail trade industry sectors. At 16 percent, unemployment is high. Overall, 60 percent of the residents aged 25 years and older have graduated from high school. Approximately 7 percent hold a bachelor’s or graduate degree. The median net worth is $19,226.
Residential City Dimensions neighborhoods are a mix of housing types, but more than half of householders live in apartments in multiunit structures. Most of the real estate is older. Nearly 70 percent of the housing units were built before 1960; 42 percent are pre-1940 structures. Sixty-four percent of the householders rent. The urban locations of this segment keep the average gross rent at approximately $477 per month. Housing types are split between single-family homes and apartments in two- to four-unit buildings. The median home value for owner-occupied dwellings is $88,841. Population density remains high, with 2,888 people per square mile. Although most homes have a vehicle, residents seek jobs near their homes, commuting an average of 22.3 minutes to work.
Preferences City Dimensions residents are frequent viewers of cable television, preferring movies and news programs over documentaries. Most households own more than one television set. Video game systems are popular. Residents are avid watchers of sports such as football, basketball, and soccer. They represent one of the top markets for purchasing and wearing team sports clothing, and prefer branded athletic shoes. Few homes are equipped with central air conditioning, so if necessary, they rely on room air conditioners or ceiling fans. Because many households have recently moved, they have purchased household furnishings such as bedding/bath linens, kitchen items, and a variety of other goods. Families with children spend wisely for children’s and baby products, preferring to shop at discount stores and use store brand products, particularly for expensive items such as disposable diapers. Households that own vehicles prefer domestic cars and buy used vehicles. Those with automotive repair expertise service their own cars; others rely on the car dealer or a nearby garage. For entertainment, they dine out and enjoy going dancing, attending music performances, and occasionally visiting bars. They also go to the movies and visit theme parks.
Gibbs Planning Group Inc., West Central Albuquerque Appendix Page 59
Segment Name: Rustbelt Traditions LifeMode Group: Traditional Living
Demographic Rustbelt Traditions neighborhoods are primarily a mix of married-couple families, single-parent families, and singles who live alone, similar to the U.S. household type distribution. This segment has the sixth largest population of all the Community Tapestry segments, with 8.4 million people. The median age is 36.1 years, just below the U.S. median. Most of the residents are white. Socioeconomic The median household income is $49,579, slightly below that of the U.S. median. Half of the employed residents work in white-collar jobs. For years, these residents sustained the manufacturing industry that drove local economies. Now, the service industry predominates, followed by manufacturing and retail trade. The median net worth for this segment is $90,754. Overall, 80 percent of residents aged 25 years and older have graduated from high school, 12 percent hold a bachelor’s or graduate degree, and 29 percent have attended college. Residential Rustbelt Traditions neighborhoods are the backbone of older Industrial cities in states that border the Great Lakes. Most residents live in modest, single-family homes. Homeownership is at 76 percent. The median home value of $107,222 is approximately three-fifths of the U.S. median. The relatively lower median home value is partially due to the age of the homes in these communities; nearly two-thirds of the housing units were built prior to 1960. Preferences Residents of Rustbelt Traditions are aptly named: They have lived, worked, spent, and played in the same area for years. They do not follow fads; they stick with the products and services they know. They prefer domestic car manufacturers. Some of their purchases re?ect their attention to the maintenance of their homes and yards. For specialized projects, they will contract for roo?ng, ?ooring, and carpet installations. Financially conservative, Rustbelt Traditions residents prefer to use a credit union and invest in certificates of deposit. They are likely to have a personal loan that is not a student or vacation loan, and hold low-value variable life and homeowner’s insurance policies. Residents watch their pennies, using coupons regularly, especially at Sam’s Club. They prefer to see a doctor for diet control and own a stationary bike for exercise. Favorite leisure activities include bowling; fishing; hunting; and attending auto races, country music shows, and ice hockey games. Watching television is a common pastime for Rustbelt Traditions residents. They subscribe to cable TV and watch it regularly, but their favorite programs are sports events.
Gibbs Planning Group Inc., West Central Albuquerque Appendix Page 60
Segment Name: Crossroads LifeMode Group: American Quilt
Demographic Crossroads neighborhoods are primarily home to married couple families with and without children and single-parent families. These residents are young, with a median age of 32.0 years. Householders tend to be younger than the U.S. average; approximately half of them are younger than 45 years. The population in this segment is growing more than 1.6 percent annually, a faster rate than the U.S. population. Nineteen percent of residents are Hispanic. Although 73 percent of residents are white, other racial groups are represented in this market. Socioeconomic The median household income for this market is $41,213, somewhat below the U.S. median; the median net worth is $47,371, less than half the U.S. value. Educational attainment levels are lower than U.S. levels; only 36 percent of residents aged 25 years and older hold a bachelor’s or graduate degree or have attended college. Most of the employed residents work in the manufacturing, construction, retail trade, and service industry sectors. Labor force participation is comparable to the U.S. level, but unemployment is slightly higher. Residential Crossroads communities are growing neighborhoods that are frequently found in small towns throughout the South, Midwest, and West. These small towns provide affordable housing for young families, providing them an opportunity to own their homes. Homeownership is 77 percent; the median home value is $74,804, much lower than the U.S. median. More than half of Crossroads households are mobile homes; 36 percent are single-family dwellings. Most of the housing was built after 1969. Preferences Mindful of their expenses, Crossroads households budget for what they buy and choose selectively where to spend their money. They shop at discount department stores such as Wal-Mart and Kmart. Many shop for groceries at Wal-Mart Supercenters. Their priorities are their families and their cars. Children are the focus of their lives, and they buy children’s products in addition to groceries. They prefer domestic cars or trucks, commonly buy used vehicles, and handle the maintenance themselves. Investing and saving for retirement are a low priority; many households do not own mutual funds, stocks, or retirement savings accounts. Home improvement projects also rank low. Crossroads residents enjoy watching television, especially cartoon channels for the kids and ?shing or NASCAR racing for the adults. Typically, they own a satellite dish or subscribe to cable. They also like to listen to the radio, preferring country and contemporary hit music to other formats. They read the newspaper less frequently than average U.S. households; however, they read magazines, especially automotive, boating, motorcycle, and ?shing publications. They like to ?sh and go to the movies. Most households have pets such as cats and dogs. Birds are especially popular.
Gibbs Planning Group Inc., West Central Albuquerque Appendix Page 61
Segment Name: Family Foundations LifeMode Group: Traditional Living
Demographic Family is the cornerstone of life in these communities; 73 percent of the households are composed of various family types. A mix of married couples, single parents, and grandparents, as well as young and adult children, populate Family Foundations neighborhoods. The median age is 39.1 years. Householders in this market are slightly older compared to the national level; 41 percent of householders are 45 years or older. There is little diversity in this segment: 85 percent of the population is black.
Socioeconomic The median household income is $45,278. As workers are beginning to retire, labor force participation runs below average at 57 percent. Nearly 23 percent of employed residents are government employees. Approximately one-third of the households receive Social Security benefits, and nearly one-fourth of households receive retirement income. At 13 percent, the unemployment rate is high. Some households obtain Supplemental Security Income or public assistance income. Their median net worth is $92,296. Except for a slightly higher proportion of residents aged 25 years and older who have some college credits, educational attainment levels are slightly below U.S. levels.
Residential Family Foundations neighborhoods are small urban communities located in large metropolitan areas, primarily in the South and Midwest. This market represents stability. Recording almost no household growth since 2000, there is little turnover in these neighborhoods. More than three in four householders own their homes. Most of these houses are single-family structures, built before 1970. The median home value is $112,327.
Preferences Family Foundations residents are active in their communities, attending church services, serving on church boards, helping with fund-raising projects, and participating in civic activities. As consumers, they spend money for home maintenance and their families. Style is important, so they buy casual and dressy clothing for themselves and their children. Buying baby products and apparel is also a priority. They watch their budgets carefully. They do not dine out often, opting to prepare meals at home. Residents shop at discount stores, such as Marshalls and T.J. Maxx, and take advantage of savings at Sam’s Club. A favorite entertainment source is television, so many households own multiple TV sets. Although high in television viewership, Family Foundations households subscribe to cable at a rate near the U.S. level. Residents prefer to watch courtroom TV shows, sports, and news programs and listen to gospel, urban, and jazz radio formats. Basketball is a favorite sport; they play it, attend professional games, watch games on TV, and listen to games on the radio.
Gibbs Planning Group Inc., West Central Albuquerque Appendix Page 62
Segment Name: Salt of the Earth LifeMode Group: Factories and Farms
Demographic Salt of the Earth households are dominated by married couples with children (36 percent) and without (29 percent). Both household percentages are higher than the U.S. values. One-fifth of households are composed of singles who live alone. The average household size for this market is 2.60, extremely close to the U.S. value of 2.59; however, the average family size is 2.99, falling below the U.S. average of 3.14. With a median age of 41.3 years, this is a slightly older market. Because ethnic diversity in these neighborhoods is negligible—94 percent of the residents are white—Salt of the Earth neighborhoods are the least diverse of all the Community Tapestry segments. Socioeconomic Employed Salt of the Earth residents work in a variety of occupations including management and professional positions and unskilled labor jobs. Higher-than-average proportions work in skilled labor occupations. Approximately one-fifth work in the manufacturing industry. The 66 percent labor force participation is high, and unemployment is low at 5 percent. The median household income is $50,538, close to the U.S. median. Besides wages, household income is supplemented by interest income, dividends, rental income, self-employment income, retirement income, and Social Security benefits, all above national proportions. The median net worth for this market is $108,631. One-fourth of Salt of the Earth residents aged 25 years and older have attended college; 13 percent hold a bachelor’s or graduate degree. Residential Salt of the Earth neighborhoods are located in rural areas throughout the United States. Nearly half of the households are in the Midwest; the other half are found almost entirely in the South and Northeast. States with the highest concentrations of these households are Pennsylvania, Ohio, Indiana, and Michigan. Homeownership is at 86 percent, and the median home value is $139,060. The majority of households are single-family units (83 percent); 12 percent are mobile homes. Twenty-two percent of the housing units were built before 1940.
Preferences Salt of the Earth residents are rooted in their settled, traditional, and hardworking lifestyles. Independent and self-reliant, they take on small home improvement and remodeling projects themselves. They also spend a lot of time and money on their vegetable and flower gardens, owning the necessary tools and equipment to make them a success. Twenty eight percent of the households own three or more vehicles, making Salt of the Earth one of the top segments with this distinction. These rural households typically own or lease many vehicles including a truck. Many own a motorcycle. Overall, they prefer domestic vehicles to imports and handle the maintenance themselves. Most residents carry insurance policies to protect themselves and their families and invest in annuities, certificates of deposit, and U.S. savings bonds. Families often have two or more pets, either dogs or cats. Salt of the Earth residents enjoy dining out, generally at family restaurants such as Ponderosa, Big Boy, and Bob Evans Farms. However, baking is a favorite home activity. They enjoy fishing, hunting, target shooting, attending country music concerts and auto races, and flying kites. They read fishing and hunting magazines also. Their radio dials are often tuned to country music stations, but they also like to follow auto racing. Many households have a satellite dish. Favorite stations include CMT, Outdoor Life Network, and the Speed Channel. In addition to watching horse racing, auto racing, and truck and tractor pulls/mud racing on TV, a favorite weekly show is According to Jim. Families travel to vacation destinations by car; for overnight stays, they prefer a Super 8 motel.
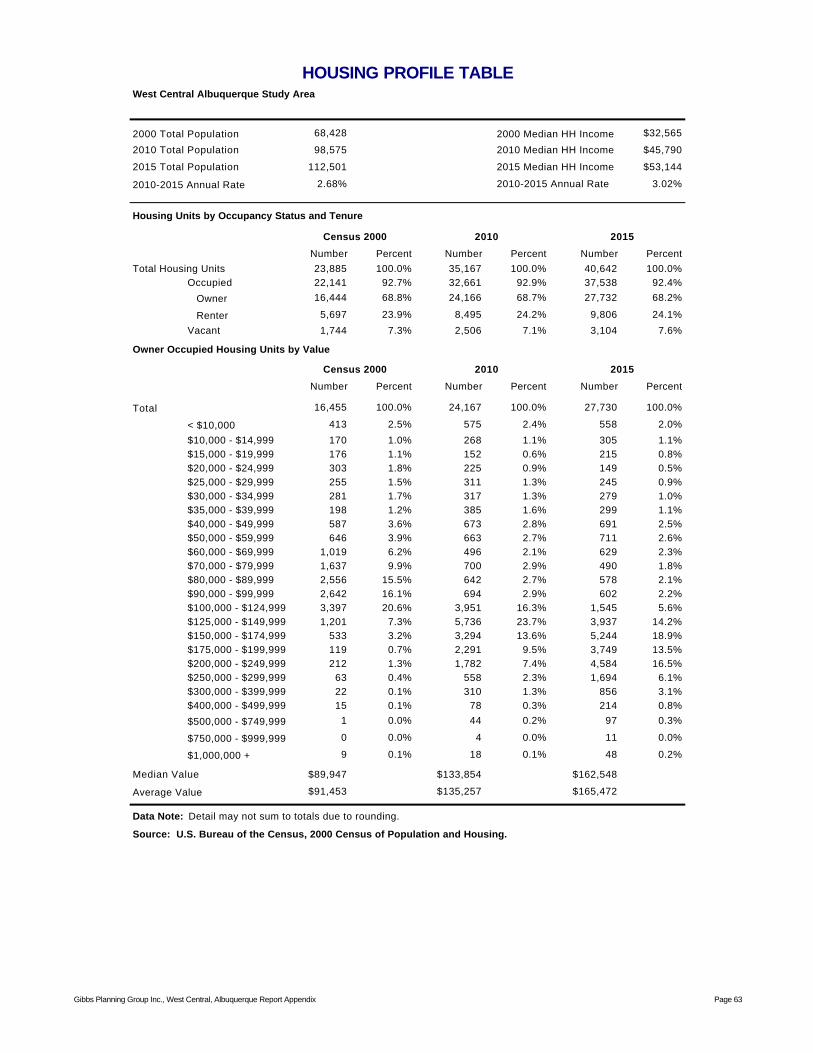
West Central Albuquerque Study Area
2000 Total Population 68,428 2000 Median HH Income $32,565
2010 Total Population 98,575 2010 Median HH Income $45,790
2015 Total Population 112,501 2015 Median HH Income $53,144
2010-2015 Annual Rate 2.68% 2010-2015 Annual Rate 3.02%
Housing Units by Occupancy Status and Tenure
Number Percent Number Percent Number PercentTotal Housing Units 23,885 100.0% 35,167 100.0% 40,642 100.0%
Occupied 22,141 92.7% 32,661 92.9% 37,538 92.4%
Owner 16,444 68.8% 24,166 68.7% 27,732 68.2%
Renter 5,697 23.9% 8,495 24.2% 9,806 24.1%
Vacant 1,744 7.3% 2,506 7.1% 3,104 7.6%
Owner Occupied Housing Units by Value
Number Percent Number Percent Number Percent
Total 16,455 100.0% 24,167 100.0% 27,730 100.0%
< $10,000 413 2.5% 575 2.4% 558 2.0%
$10,000 - $14,999 170 1.0% 268 1.1% 305 1.1%$15,000 - $19,999 176 1.1% 152 0.6% 215 0.8%$20,000 - $24,999 303 1.8% 225 0.9% 149 0.5%$25,000 - $29,999 255 1.5% 311 1.3% 245 0.9%$30,000 - $34,999 281 1.7% 317 1.3% 279 1.0%$35,000 - $39,999 198 1.2% 385 1.6% 299 1.1%$40,000 - $49,999 587 3.6% 673 2.8% 691 2.5%$50,000 - $59,999 646 3.9% 663 2.7% 711 2.6%$60,000 - $69,999 1,019 6.2% 496 2.1% 629 2.3%$70,000 - $79,999 1,637 9.9% 700 2.9% 490 1.8%$80,000 - $89,999 2,556 15.5% 642 2.7% 578 2.1%$90,000 - $99,999 2,642 16.1% 694 2.9% 602 2.2%$100,000 - $124,999 3,397 20.6% 3,951 16.3% 1,545 5.6%$125,000 - $149,999 1,201 7.3% 5,736 23.7% 3,937 14.2%$150,000 - $174,999 533 3.2% 3,294 13.6% 5,244 18.9%$175,000 - $199,999 119 0.7% 2,291 9.5% 3,749 13.5%$200,000 - $249,999 212 1.3% 1,782 7.4% 4,584 16.5%$250,000 - $299,999 63 0.4% 558 2.3% 1,694 6.1%$300,000 - $399,999 22 0.1% 310 1.3% 856 3.1%$400,000 - $499,999 15 0.1% 78 0.3% 214 0.8%
$500,000 - $749,999 1 0.0% 44 0.2% 97 0.3%
$750,000 - $999,999 0 0.0% 4 0.0% 11 0.0%
$1,000,000 + 9 0.1% 18 0.1% 48 0.2%
Median Value $89,947 $133,854 $162,548
Average Value $91,453 $135,257 $165,472
Source: U.S. Bureau of the Census, 2000 Census of Population and Housing.
Census 2000 2010 2015
HOUSING PROFILE TABLE
Data Note: Detail may not sum to totals due to rounding.
Census 2000 2010 2015
Gibbs Planning Group Inc., West Central, Albuquerque Report Appendix Page 63
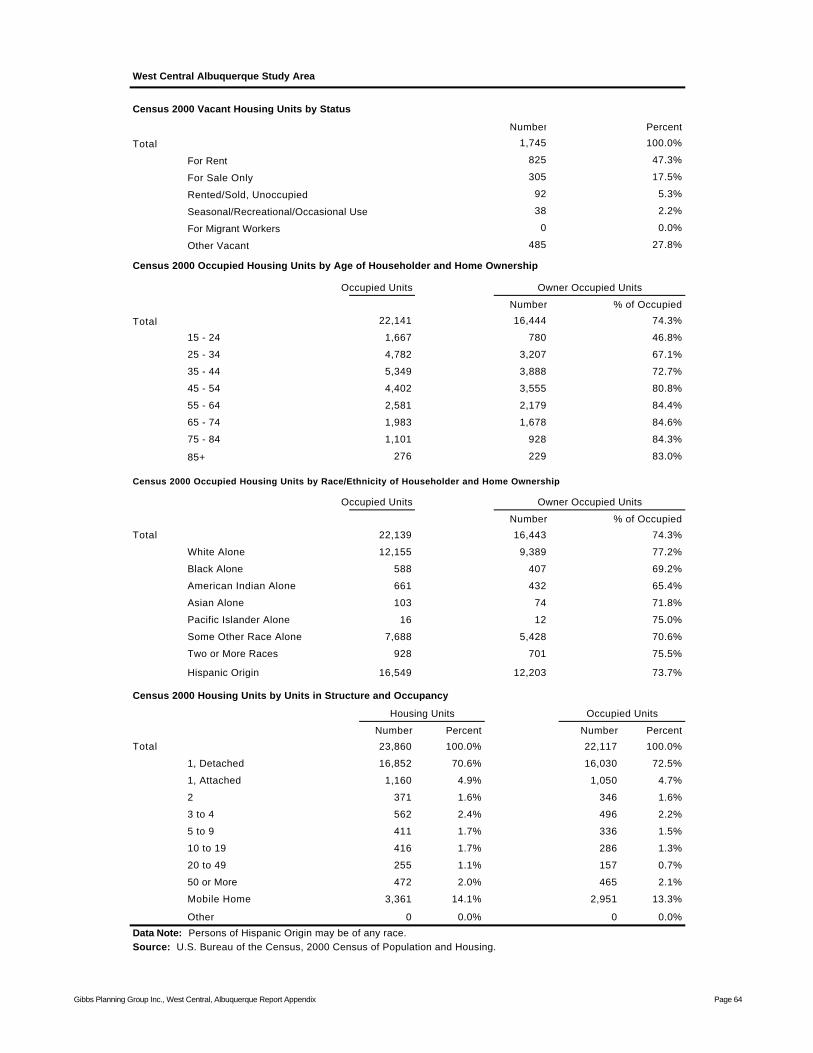
West Central Albuquerque Study Area
Census 2000 Vacant Housing Units by Status
Number Percent
Total 1,745 100.0%
For Rent 825 47.3%
For Sale Only 305 17.5%
Rented/Sold, Unoccupied 92 5.3%
Seasonal/Recreational/Occasional Use 38 2.2%
For Migrant Workers 0 0.0%
Other Vacant 485 27.8%
Census 2000 Occupied Housing Units by Age of Householder and Home Ownership
Occupied Units
Number % of Occupied
Total 22,141 16,444 74.3%
15 - 24 1,667 780 46.8%
25 - 34 4,782 3,207 67.1%
35 - 44 5,349 3,888 72.7%
45 - 54 4,402 3,555 80.8%
55 - 64 2,581 2,179 84.4%
65 - 74 1,983 1,678 84.6%
75 - 84 1,101 928 84.3%
85+ 276 229 83.0%
Census 2000 Occupied Housing Units by Race/Ethnicity of Householder and Home Ownership
Occupied Units
Number % of Occupied
Total 22,139 16,443 74.3%
White Alone 12,155 9,389 77.2%
Black Alone 588 407 69.2%
American Indian Alone 661 432 65.4%
Asian Alone 103 74 71.8%
Pacific Islander Alone 16 12 75.0%
Some Other Race Alone 7,688 5,428 70.6%
Two or More Races 928 701 75.5%
Hispanic Origin 16,549 12,203 73.7%
Census 2000 Housing Units by Units in Structure and Occupancy
Number Percent Number Percent
Total 23,860 100.0% 22,117 100.0%
1, Detached 16,852 70.6% 16,030 72.5%
1, Attached 1,160 4.9% 1,050 4.7%
2 371 1.6% 346 1.6%
3 to 4 562 2.4% 496 2.2%
5 to 9 411 1.7% 336 1.5%
10 to 19 416 1.7% 286 1.3%
20 to 49 255 1.1% 157 0.7%
50 or More 472 2.0% 465 2.1%
Mobile Home 3,361 14.1% 2,951 13.3%
Other 0 0.0% 0 0.0%
Data Note: Persons of Hispanic Origin may be of any race.Source: U.S. Bureau of the Census, 2000 Census of Population and Housing.
Housing Units Occupied Units
Owner Occupied Units
Owner Occupied Units
Gibbs Planning Group Inc., West Central, Albuquerque Report Appendix Page 64
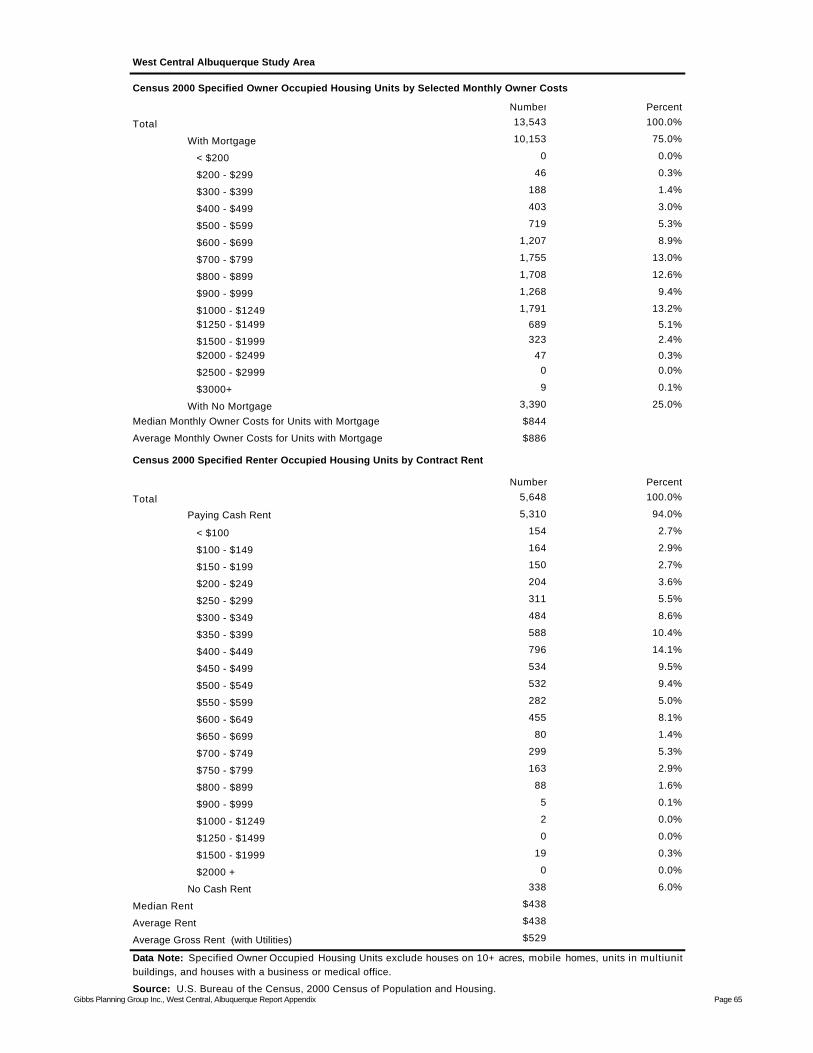
West Central Albuquerque Study Area
Census 2000 Specified Owner Occupied Housing Units by Selected Monthly Owner Costs
Number Percent
Total 13,543 100.0%
With Mortgage 10,153 75.0%
< $200 0 0.0%
$200 - $299 46 0.3%
$300 - $399 188 1.4%
$400 - $499 403 3.0%
$500 - $599 719 5.3%
$600 - $699 1,207 8.9%
$700 - $799 1,755 13.0%
$800 - $899 1,708 12.6%
$900 - $999 1,268 9.4%
$1000 - $1249 1,791 13.2%
$1250 - $1499 689 5.1%
$1500 - $1999 323 2.4%
$2000 - $2499 47 0.3%
$2500 - $2999 0 0.0%
$3000+ 9 0.1%
With No Mortgage 3,390 25.0%
Median Monthly Owner Costs for Units with Mortgage $844
Average Monthly Owner Costs for Units with Mortgage $886
Census 2000 Specified Renter Occupied Housing Units by Contract Rent
Number Percent
Total 5,648 100.0%
Paying Cash Rent 5,310 94.0%
< $100 154 2.7%
$100 - $149 164 2.9%
$150 - $199 150 2.7%
$200 - $249 204 3.6%
$250 - $299 311 5.5%
$300 - $349 484 8.6%
$350 - $399 588 10.4%
$400 - $449 796 14.1%
$450 - $499 534 9.5%
$500 - $549 532 9.4%
$550 - $599 282 5.0%
$600 - $649 455 8.1%
$650 - $699 80 1.4%
$700 - $749 299 5.3%
$750 - $799 163 2.9%
$800 - $899 88 1.6%
$900 - $999 5 0.1%
$1000 - $1249 2 0.0%
$1250 - $1499 0 0.0%
$1500 - $1999 19 0.3%
$2000 + 0 0.0%
No Cash Rent 338 6.0%
Median Rent $438
Average Rent $438
Average Gross Rent (with Utilities) $529
Source: U.S. Bureau of the Census, 2000 Census of Population and Housing.
Data Note: Specified Owner Occupied Housing Units exclude houses on 10+ acres, mobile homes, units in multiunitbuildings, and houses with a business or medical office.
Gibbs Planning Group Inc., West Central, Albuquerque Report Appendix Page 65