Embed Size (px)
Citation preview

Economic report
Retail Industry OutlookQuarterly report
Retail Sales
0.7%Retail sales rose by 0.7% in September, year-on-year, according to Retail Economics.
Confidence
-12Consumer confidence rose two points to -12 in September, GfK.
Unemployment
3.9%Unemployment stood at 3.9% in the three months to August, ONS.
Real Earnings
2.1%Real earnings rose 2.1% in September (regular pay) according to the ONS.
Inflation
1.7%Inflation rose 1.7% in September, year-on-year, according to the ONS.
What you get from our Retail Outlook reports
Key economic trends from the latest available data
A holistic view of the industry
Expert analysis to help inform your decisions
Identification of key risks and opportunities across the sectors
A balanced view on where the industry is headed
Weather data to help you identify behavioural trends
Covid-19 related insights to assist your forward planning
COVID-19 Service
We conduct extensive research and analysis on the impact of coronavirus (COVID-19) on the UK retail and leisure industry. Our service consists of frequent, timely analysis and updates in a variety of formats so you can absorb the information quickly in a way that best suits you.
What you get
1. Impact assessment reports for UK retail and leisure
These reports provide an in-depth analysis of the COVID-19 impact on the UK retail and leisure industry including consumer panel surveys, economics analysis, forecasts and other insights.
2. COVID-19 Quick Responses
Get the latest updates from retailers and the wider industry on the impact of COVID-19 as an when it happens -delivered directly to your inbox.
3. Consumer panel research
For the critical duration, we conduct fortnightly surveys using a panel of over 2,000 households to measure: 1) Behavioural shifts 2) Confidence 3) Sentiment These extensive surveys have proved to be a very accurate indicator of future trading vulnerabilities for the industry.
4. Weekly newsletter
Every week we produce a summary of all the ‘need-to-know facts and stats’ related to the impact of coronavirus on the retail and leisure industry broken down by sector (e.g. clothing & footwear, food, home and more) and by channel.
5. Economic chartbook
Produced monthly, a summary of all the critical macroeconomic data and trends in an easily digestible chartbook format. Ideal for identifying trends.
CLICK HERE TO EXPLORE SERVICE NOW
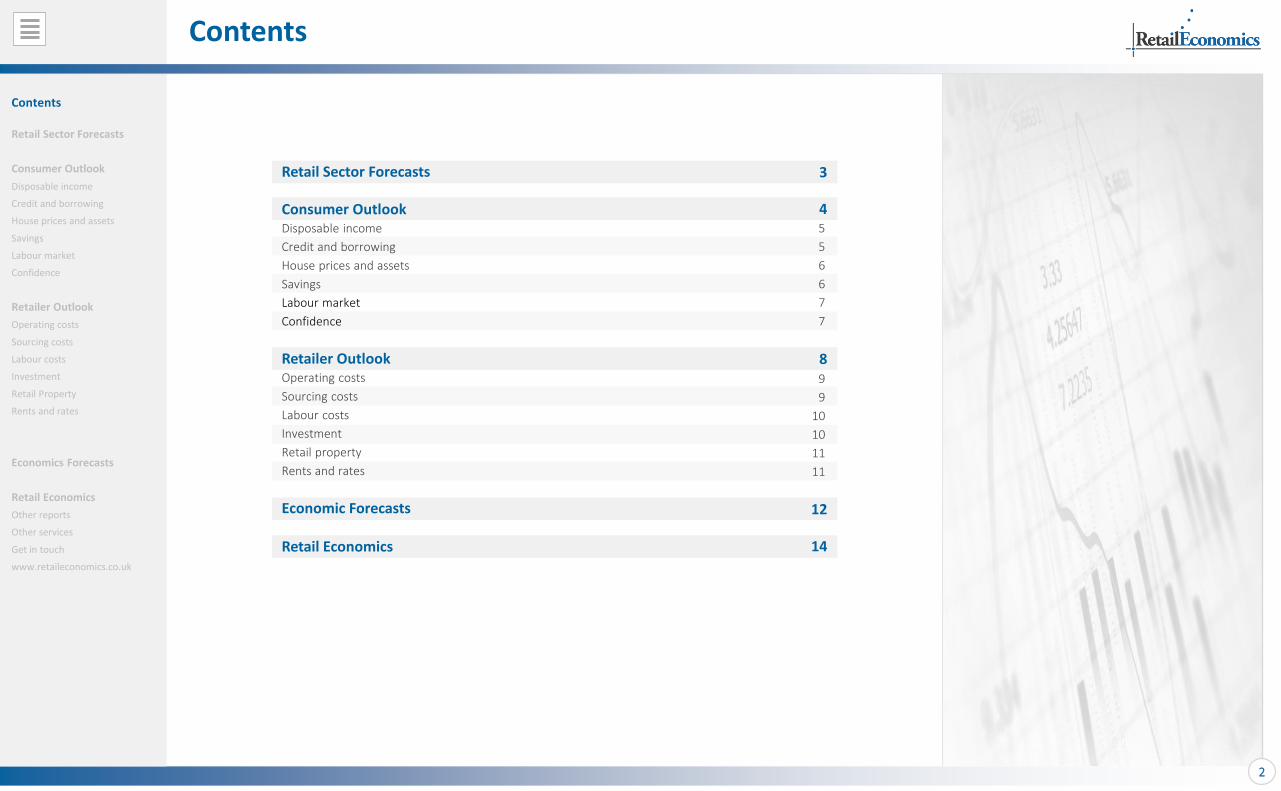
Contents
2
Contents
Retail Sector Forecasts
Consumer Outlook
Disposable income
Credit and borrowing
House prices and assets
Savings
Labour market
Confidence
Retailer Outlook
Operating costs
Sourcing costs
Labour costs
Investment
Retail Property
Rents and rates
Economics Forecasts
Retail Economics
Other reports
Other services
Get in touch
www.retaileconomics.co.uk
Retail Sector Forecasts
Consumer OutlookDisposable income
Credit and borrowing
House prices and assets
Savings
Labour market
Confidence
Retailer OutlookOperating costs
Sourcing costs
Labour costs
Investment
Retail property
Rents and rates
Economic Forecasts
Retail Economics
3
45
5
6
6
7
7
8
12
14
9
9
10
10
11
11
Retail Sector Forecasts
3
Sector Market Size Outlook Summary
Food & Grocery • £150.8 billion
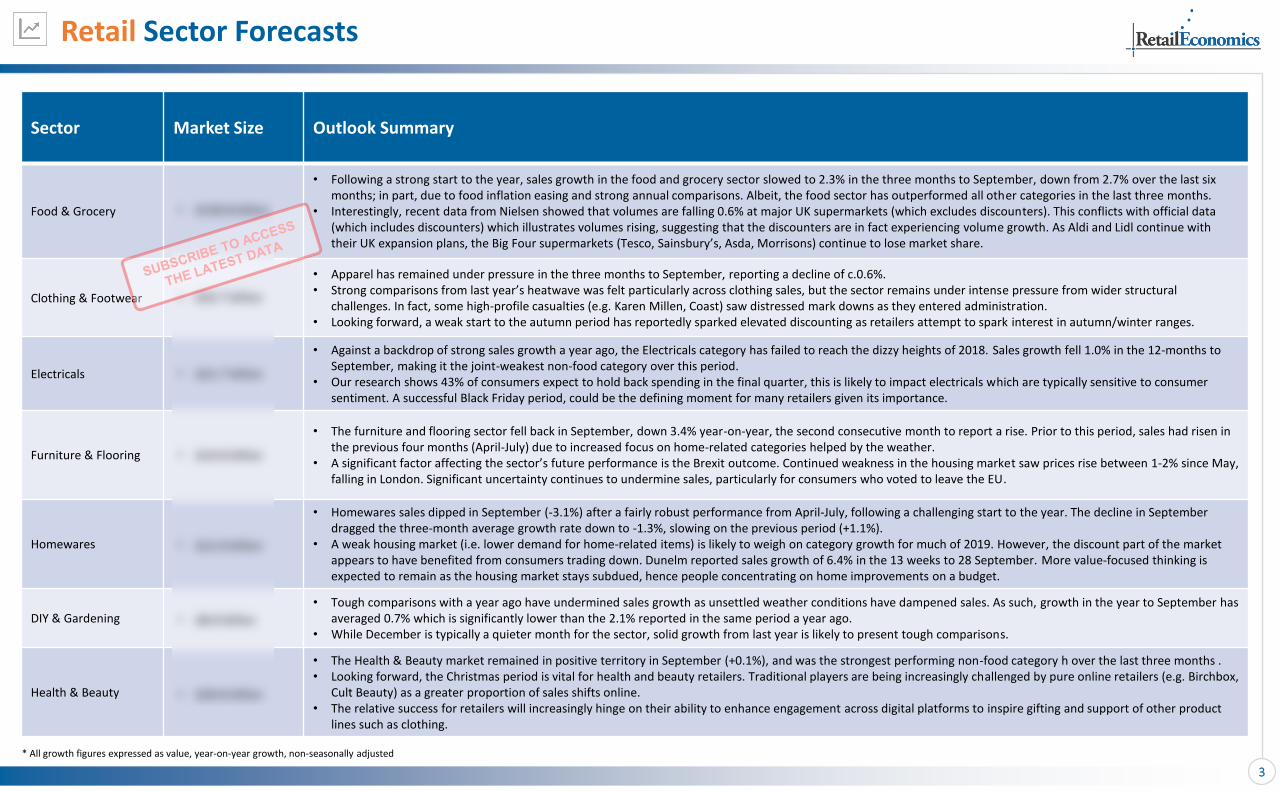
• Following a strong start to the year, sales growth in the food and grocery sector slowed to 2.3% in the three months to September, down from 2.7% over the last six months; in part, due to food inflation easing and strong annual comparisons. Albeit, the food sector has outperformed all other categories in the last three months.
• Interestingly, recent data from Nielsen showed that volumes are falling 0.6% at major UK supermarkets (which excludes discounters). This conflicts with official data (which includes discounters) which illustrates volumes rising, suggesting that the discounters are in fact experiencing volume growth. As Aldi and Lidl continue with their UK expansion plans, the Big Four supermarkets (Tesco, Sainsbury’s, Asda, Morrisons) continue to lose market share.
Clothing & Footwear • £53.7 billion
• Apparel has remained under pressure in the three months to September, reporting a decline of c.0.6%. • Strong comparisons from last year’s heatwave was felt particularly across clothing sales, but the sector remains under intense pressure from wider structural
challenges. In fact, some high-profile casualties (e.g. Karen Millen, Coast) saw distressed mark downs as they entered administration. • Looking forward, a weak start to the autumn period has reportedly sparked elevated discounting as retailers attempt to spark interest in autumn/winter ranges.
Electricals • £21.7 billion
• Against a backdrop of strong sales growth a year ago, the Electricals category has failed to reach the dizzy heights of 2018. Sales growth fell 1.0% in the 12-months to September, making it the joint-weakest non-food category over this period.
• Our research shows 43% of consumers expect to hold back spending in the final quarter, this is likely to impact electricals which are typically sensitive to consumer sentiment. A successful Black Friday period, could be the defining moment for many retailers given its importance.
Furniture & Flooring • £14.6 billion
• The furniture and flooring sector fell back in September, down 3.4% year-on-year, the second consecutive month to report a rise. Prior to this period, sales had risen in the previous four months (April-July) due to increased focus on home-related categories helped by the weather.
• A significant factor affecting the sector’s future performance is the Brexit outcome. Continued weakness in the housing market saw prices rise between 1-2% since May, falling in London. Significant uncertainty continues to undermine sales, particularly for consumers who voted to leave the EU.
Homewares • £12.0 billion
• Homewares sales dipped in September (-3.1%) after a fairly robust performance from April-July, following a challenging start to the year. The decline in September dragged the three-month average growth rate down to -1.3%, slowing on the previous period (+1.1%).
• A weak housing market (i.e. lower demand for home-related items) is likely to weigh on category growth for much of 2019. However, the discount part of the market appears to have benefited from consumers trading down. Dunelm reported sales growth of 6.4% in the 13 weeks to 28 September. More value-focused thinking is expected to remain as the housing market stays subdued, hence people concentrating on home improvements on a budget.
DIY & Gardening • £8.9 billion• Tough comparisons with a year ago have undermined sales growth as unsettled weather conditions have dampened sales. As such, growth in the year to September has
averaged 0.7% which is significantly lower than the 2.1% reported in the same period a year ago.• While December is typically a quieter month for the sector, solid growth from last year is likely to present tough comparisons.
Health & Beauty • £20.6 billion
• The Health & Beauty market remained in positive territory in September (+0.1%), and was the strongest performing non-food category h over the last three months . • Looking forward, the Christmas period is vital for health and beauty retailers. Traditional players are being increasingly challenged by pure online retailers (e.g. Birchbox,
Cult Beauty) as a greater proportion of sales shifts online. • The relative success for retailers will increasingly hinge on their ability to enhance engagement across digital platforms to inspire gifting and support of other product
lines such as clothing.
* All growth figures expressed as value, year-on-year growth, non-seasonally adjusted
Consumer Outlook
4
Measure Data Summary Description of measurePeriod covered
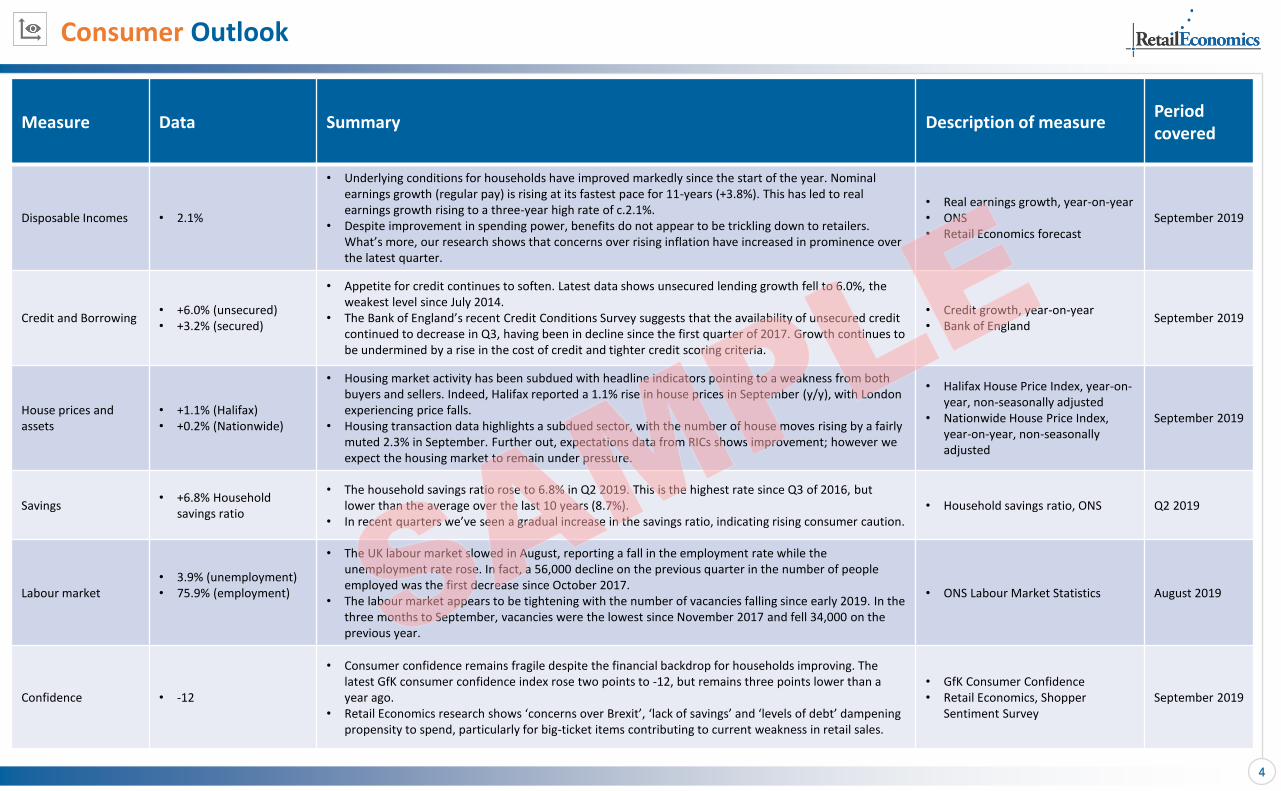
Disposable Incomes • 2.1%
• Underlying conditions for households have improved markedly since the start of the year. Nominal earnings growth (regular pay) is rising at its fastest pace for 11-years (+3.8%). This has led to real earnings growth rising to a three-year high rate of c.2.1%.
• Despite improvement in spending power, benefits do not appear to be trickling down to retailers. What’s more, our research shows that concerns over rising inflation have increased in prominence over the latest quarter.
• Real earnings growth, year-on-year• ONS• Retail Economics forecast
September 2019
Credit and Borrowing• +6.0% (unsecured)• +3.2% (secured)
• Appetite for credit continues to soften. Latest data shows unsecured lending growth fell to 6.0%, the weakest level since July 2014.
• The Bank of England’s recent Credit Conditions Survey suggests that the availability of unsecured credit continued to decrease in Q3, having been in decline since the first quarter of 2017. Growth continues to be undermined by a rise in the cost of credit and tighter credit scoring criteria.
• Credit growth, year-on-year• Bank of England
September 2019
House prices and assets
• +1.1% (Halifax)• +0.2% (Nationwide)
• Housing market activity has been subdued with headline indicators pointing to a weakness from both buyers and sellers. Indeed, Halifax reported a 1.1% rise in house prices in September (y/y), with London experiencing price falls.
• Housing transaction data highlights a subdued sector, with the number of house moves rising by a fairly muted 2.3% in September. Further out, expectations data from RICs shows improvement; however we expect the housing market to remain under pressure.
• Halifax House Price Index, year-on-year, non-seasonally adjusted
• Nationwide House Price Index, year-on-year, non-seasonally adjusted
September 2019
Savings• +6.8% Household
savings ratio
• The household savings ratio rose to 6.8% in Q2 2019. This is the highest rate since Q3 of 2016, but lower than the average over the last 10 years (8.7%).
• In recent quarters we’ve seen a gradual increase in the savings ratio, indicating rising consumer caution.• Household savings ratio, ONS Q2 2019
Labour market• 3.9% (unemployment)• 75.9% (employment)
• The UK labour market slowed in August, reporting a fall in the employment rate while the unemployment rate rose. In fact, a 56,000 decline on the previous quarter in the number of people employed was the first decrease since October 2017.
• The labour market appears to be tightening with the number of vacancies falling since early 2019. In the three months to September, vacancies were the lowest since November 2017 and fell 34,000 on the previous year.
• ONS Labour Market Statistics August 2019
Confidence • -12
• Consumer confidence remains fragile despite the financial backdrop for households improving. The latest GfK consumer confidence index rose two points to -12, but remains three points lower than a year ago.
• Retail Economics research shows ‘concerns over Brexit’, ‘lack of savings’ and ‘levels of debt’ dampening propensity to spend, particularly for big-ticket items contributing to current weakness in retail sales.
• GfK Consumer Confidence • Retail Economics, Shopper
Sentiment SurveySeptember 2019
Consumer Outlook
“The Bank of England’s recent Credit Conditions Survey suggests that the availability of unsecured credit continued to decrease in Q3 having been in decline since the first quarter of 2017”
Real Earnings
2.1%Real earnings growth reached 2.1% in
September 2019.
5
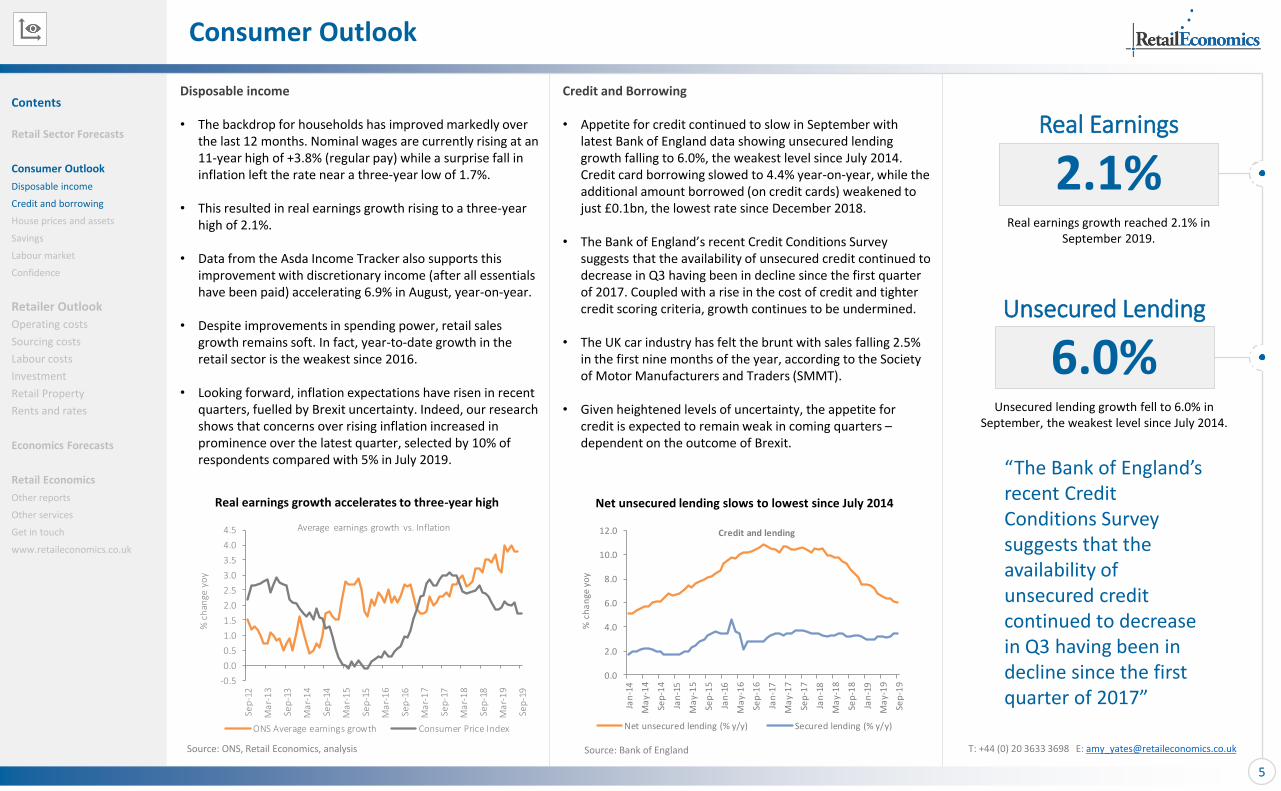
Disposable income
• The backdrop for households has improved markedly over the last 12 months. Nominal wages are currently rising at an 11-year high of +3.8% (regular pay) while a surprise fall in inflation left the rate near a three-year low of 1.7%.
• This resulted in real earnings growth rising to a three-year high of 2.1%.
• Data from the Asda Income Tracker also supports this improvement with discretionary income (after all essentials have been paid) accelerating 6.9% in August, year-on-year.
• Despite improvements in spending power, retail sales growth remains soft. In fact, year-to-date growth in the retail sector is the weakest since 2016.
• Looking forward, inflation expectations have risen in recent quarters, fuelled by Brexit uncertainty. Indeed, our research shows that concerns over rising inflation increased in prominence over the latest quarter, selected by 10% of respondents compared with 5% in July 2019.
Source: ONS, Retail Economics, analysis
Unsecured Lending
6.0%Unsecured lending growth fell to 6.0% in
September, the weakest level since July 2014.
T: +44 (0) 20 3633 3698 E: [email protected]
Credit and Borrowing
• Appetite for credit continued to slow in September with latest Bank of England data showing unsecured lending growth falling to 6.0%, the weakest level since July 2014. Credit card borrowing slowed to 4.4% year-on-year, while the additional amount borrowed (on credit cards) weakened to just £0.1bn, the lowest rate since December 2018.
• The Bank of England’s recent Credit Conditions Survey suggests that the availability of unsecured credit continued to decrease in Q3 having been in decline since the first quarter of 2017. Coupled with a rise in the cost of credit and tighter credit scoring criteria, growth continues to be undermined.
• The UK car industry has felt the brunt with sales falling 2.5% in the first nine months of the year, according to the Society of Motor Manufacturers and Traders (SMMT).
• Given heightened levels of uncertainty, the appetite for credit is expected to remain weak in coming quarters –dependent on the outcome of Brexit.
Source: Bank of England
Real earnings growth accelerates to three-year high
Contents
Retail Sector Forecasts
Consumer Outlook
Disposable income
Credit and borrowing
House prices and assets
Savings
Labour market
Confidence
Retailer Outlook
Operating costs
Sourcing costs
Labour costs
Investment
Retail Property
Rents and rates
Economics Forecasts
Retail Economics
Other reports
Other services
Get in touch
www.retaileconomics.co.uk
-0.5
0.0
0.5
1.0
1.5
2.0
2.5
3.0
3.5
4.0
4.5
Sep
-12
Ma
r-1
3
Sep
-13
Ma
r-1
4
Sep
-14
Ma
r-1
5
Sep
-15
Ma
r-1
6
Sep
-16
Ma
r-1
7
Sep
-17
Ma
r-1
8
Sep
-18
Ma
r-1
9
Sep
-19
% c
han
ge y
oy
Average earnings growth vs. Inflation
ONS Average earnings growth Consumer Price Index
Net unsecured lending slows to lowest since July 2014
0.0
2.0
4.0
6.0
8.0
10.0
12.0
Jan
-14
Ma
y-1
4
Sep
-14
Jan
-15
Ma
y-1
5
Sep
-15
Jan
-16
Ma
y-1
6
Sep
-16
Jan
-17
Ma
y-1
7
Sep
-17
Jan
-18
Ma
y-1
8
Sep
-18
Jan
-19
Ma
y-1
9
Sep
-19
% c
ha
nge
yo
y
Credit and lending
Net unsecured lending (% y/y) Secured lending (% y/y)

Consumer Outlook
“In recent quarters we have seen a gradual increase in the savings ratio which could be indicative of the increase in consumer caution”
House prices
1.1%The Halifax reported a rise in house prices of 1.1% in September 2019.
6
House prices and assets
• Activity in the housing market remains weak with ongoing political and economic uncertainty weighing on confidence. This has impacted annual house price growth, now at 1.1% falling to a six year low (Halifax); while the number of mortgage approvals resides at 65,919, little changed in the last three years.
• However, RICs data suggests that despite short-term indicators on price and sales expectations remaining in negative territory in September, the 12-month outlook is more positive with prices expected to rise at a national level.
• Nevertheless, continued weakness in the housing market could have knock-on impacts to other areas with home-related retail category sales reliant on robust housing market activity (to varying degrees). Our data is already showing sales growth decline for furniture and flooring, homewares and DIY. Also, the reluctance of consumers to make big-ticket purchases is supporting the value end of the market with ScS reporting a 4.2% uplift in sales in the year to July, significantly out growing the market.
Source: RICs
Savings ratio
6.8%The household savings ratio rose to
6.8% in Q2 2019.
T: +44 (0) 20 3633 3698 E: [email protected]
Savings
• The household savings ratio rose to 6.8% in Q2 2019. This is up on the previous quarter and the highest rate since Q4 2018.
• Interestingly, revisions to the series increased the savings ratio in the previous quarter from 4.4% to 6.2%, a sharp increase that is contrary to the previous trend.
• By historical standards, the current ratio remains below the 10-year average of 8.7%. As depicted in the chart below, from 2015 to 2017, the savings ratio was on a downwards trajectory as consumers were spending at the expense of their savings.
• Nevertheless, in recent quarters we have seen a gradual rise in the savings ratio which could be indicative of the increase in consumer caution. We expect this rise to continue with data from our latest Shopper Sentiment Survey reporting that 15% of consumers indicated they are likely to save more in the next three months, up from 13% in July.
Source: Bank of England
Contents
Retail Sector Forecasts
Consumer Outlook
Disposable income
Credit and borrowing
House prices and assets
Savings
Labour market
Confidence
Retailer Outlook
Operating costs
Sourcing costs
Labour costs
Investment
Retail Property
Rents and rates
Economics Forecasts
Retail Economics
Other reports
Other services
Get in touch
www.retaileconomics.co.uk
0
2
4
6
8
10
12
14
Q4
20
09
Q2
20
10
Q4
20
10
Q2
20
11
Q4
20
11
Q2
20
12
Q4
20
12
Q2
20
13
Q4
20
13
Q2
20
14
Q4
20
14
Q2
20
15
Q4
20
15
Q2
20
16
Q4
20
16
Q2
20
17
Q4
20
17
Q2
20
18
Q4
20
18
Q2
20
19
savi
ngs
rat
io (
%)
Households savings ratio
UK household savings ratio %
-40.0
-30.0
-20.0
-10.0
0.0
10.0
20.0
30.0
-50
-40
-30
-20
-10
0
10
20
30
Sep
-16
De
c-16
Ma
r-17
Jun
-17
Sep
-17
De
c-17
Ma
r-18
Jun
-18
Sep
-18
De
c-18
Ma
r-19
Jun
-19
Sep
-19 Net
ba
lan
ce -
sale
s ex
pec
tati
on
s
Net
ba
lan
ce -
pri
ce e
xpec
tati
on
s
RICS - Price and Sales expectations
UK RICS price expectations UK RICS sales expectations

Consumer Outlook
“Just 11% of consumers indicated they would spend more this Christmas compared with last, versus 34% who said they would spend less”
Unemployment
3.9%The unemployment rate rose to 3.9% in August, up 0.1 percentage points from
the previous month.
7
Labour market
• Recent UK labour market data showed signs of slowing with the number of people in employment falling 56,000 on the previous quarter, the first quarterly decrease in almost two years.
• This decline resulted in the unemployment rate edging up to 3.9% with the level rising by 22,000 to 1.3 million.
• The labour market appears to be tightening with the number of vacancies falling since early 2019. Latest data suggests that in the three months to September, vacancies were the lowest since November 2017 and fell 34,000 on the previous year.
• That said, consumer sentiment doesn’t appear to have been impacted by the recent loss of momentum in the labour market. Indeed, our recent Shopper Sentiment survey showed that ‘weaker job security’ was currently the least concerning issue for consumers, selected by just 6% of respondents, with worries about Brexit topping the list (42%).
Source: Retail Economics
Consumer caution
46%Of consumers suggested they would be more
cautious with their discretionary spending over the next three months.
T: +44 (0) 20 3633 3698 E: [email protected]
Confidence
• Despite an improvement in underlying financial conditions for households in recent months, consumer confidence has remained weak.
• Our own research conducted in October, suggests that Brexit remains the greatest concern for consumers (indicated by 42% of consumers), although this has slowed from a peak of 49% in January 2019. Other concerns were ‘lacking of savings’ (18%) and a ‘weaker economy’ (12%).
• Ongoing political and economic uncertainty has weakened consumers’ propensity to spend which does not bode well for retailers for the remainder of the year. Indeed, 43% of consumers suggested they would be more cautious with their discretionary spending over the next three months, with muted appetite for spending on Christmas also.
• Indeed, just 11% of consumers indicated they would spend more this Christmas compared with last, versus 34% who said they would spend less.
Source: Retail Economics, September 2019, sample=2,000
Unemployment rises on back of falling employment Are you planning to spend more this Christmas compared to last year?
Contents
Retail Sector Forecasts
Consumer Outlook
Disposable income
Credit and borrowing
House prices and assets
Savings
Labour market
Confidence
Retailer Outlook
Operating costs
Sourcing costs
Labour costs
Investment
Retail Property
Rents and rates
Economics Forecasts
Retail Economics
Other reports
Other services
Get in touch
www.retaileconomics.co.uk
5%
6%
55%
18%
16%
I expect to spend much more
I expect to spend slightlymore
I expect to spend about thesame
I expect to spend slightly less
I expect to spend much less
3.5
4.5
5.5
6.5
7.5
8.5
Au
g-1
0
Feb
-11
Au
g-1
1
Feb
-12
Au
g-1
2
Feb
-13
Au
g-1
3
Feb
-14
Au
g-1
4
Feb
-15
Au
g-1
5
Feb
-16
Au
g-1
6
Feb
-17
Au
g-1
7
Feb
-18
Au
g-1
8
Feb
-19
Au
g-1
9
Ra
te (
%)
unemployment rate (%)
Unemployment Rate %
Retailer Outlook
8
Measure Data Summary Description of measurePeriod covered
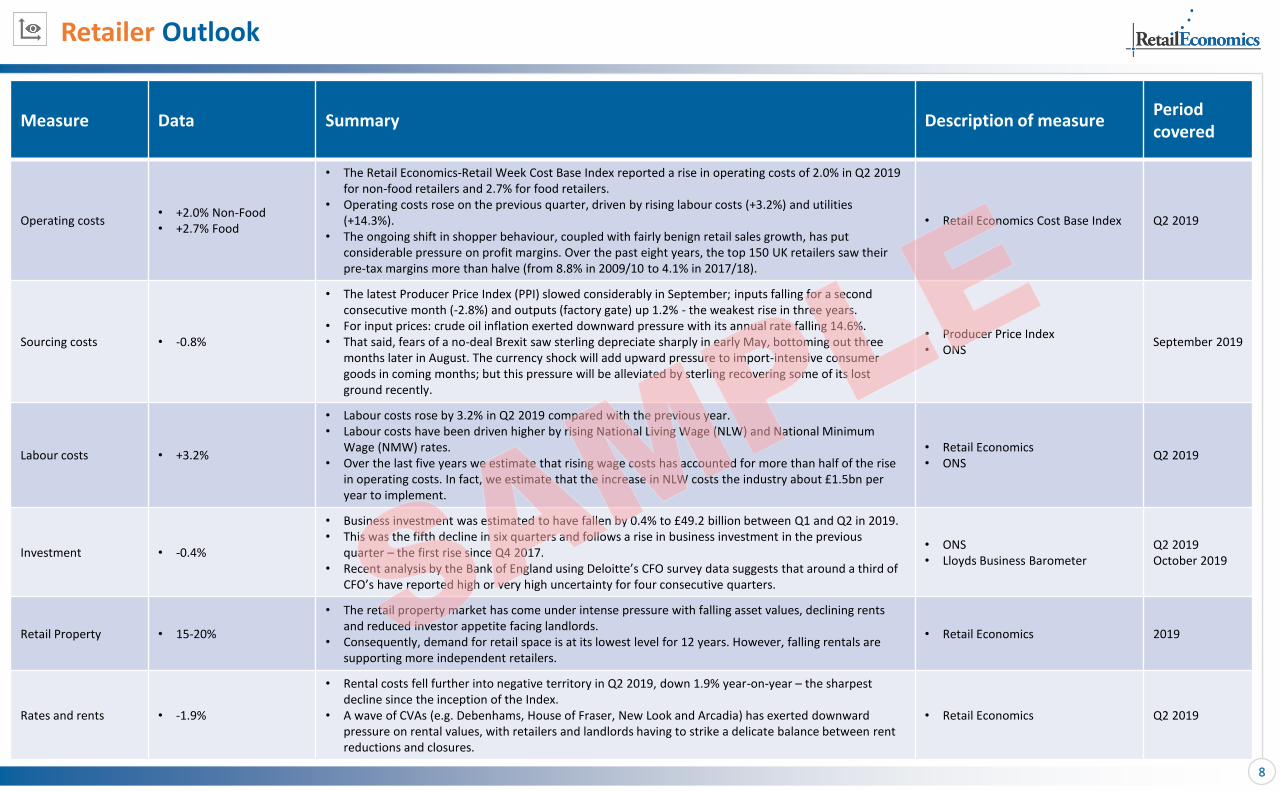
Operating costs• +2.0% Non-Food• +2.7% Food
• The Retail Economics-Retail Week Cost Base Index reported a rise in operating costs of 2.0% in Q2 2019 for non-food retailers and 2.7% for food retailers.
• Operating costs rose on the previous quarter, driven by rising labour costs (+3.2%) and utilities (+14.3%).
• The ongoing shift in shopper behaviour, coupled with fairly benign retail sales growth, has put considerable pressure on profit margins. Over the past eight years, the top 150 UK retailers saw their pre-tax margins more than halve (from 8.8% in 2009/10 to 4.1% in 2017/18).
• Retail Economics Cost Base Index Q2 2019
Sourcing costs • -0.8%
• The latest Producer Price Index (PPI) slowed considerably in September; inputs falling for a second consecutive month (-2.8%) and outputs (factory gate) up 1.2% - the weakest rise in three years.
• For input prices: crude oil inflation exerted downward pressure with its annual rate falling 14.6%. • That said, fears of a no-deal Brexit saw sterling depreciate sharply in early May, bottoming out three
months later in August. The currency shock will add upward pressure to import-intensive consumer goods in coming months; but this pressure will be alleviated by sterling recovering some of its lost ground recently.
• Producer Price Index• ONS
September 2019
Labour costs • +3.2%
• Labour costs rose by 3.2% in Q2 2019 compared with the previous year.• Labour costs have been driven higher by rising National Living Wage (NLW) and National Minimum
Wage (NMW) rates.• Over the last five years we estimate that rising wage costs has accounted for more than half of the rise
in operating costs. In fact, we estimate that the increase in NLW costs the industry about £1.5bn per year to implement.
• Retail Economics• ONS
Q2 2019
Investment • -0.4%
• Business investment was estimated to have fallen by 0.4% to £49.2 billion between Q1 and Q2 in 2019. • This was the fifth decline in six quarters and follows a rise in business investment in the previous
quarter – the first rise since Q4 2017.• Recent analysis by the Bank of England using Deloitte’s CFO survey data suggests that around a third of
CFO’s have reported high or very high uncertainty for four consecutive quarters.
• ONS• Lloyds Business Barometer
Q2 2019October 2019
Retail Property • 15-20%
• The retail property market has come under intense pressure with falling asset values, declining rents and reduced investor appetite facing landlords.
• Consequently, demand for retail space is at its lowest level for 12 years. However, falling rentals are supporting more independent retailers.
• Retail Economics 2019
Rates and rents • -1.9%
• Rental costs fell further into negative territory in Q2 2019, down 1.9% year-on-year – the sharpest decline since the inception of the Index.
• A wave of CVAs (e.g. Debenhams, House of Fraser, New Look and Arcadia) has exerted downward pressure on rental values, with retailers and landlords having to strike a delicate balance between rent reductions and closures.
• Retail Economics Q2 2019
Retailer Outlook
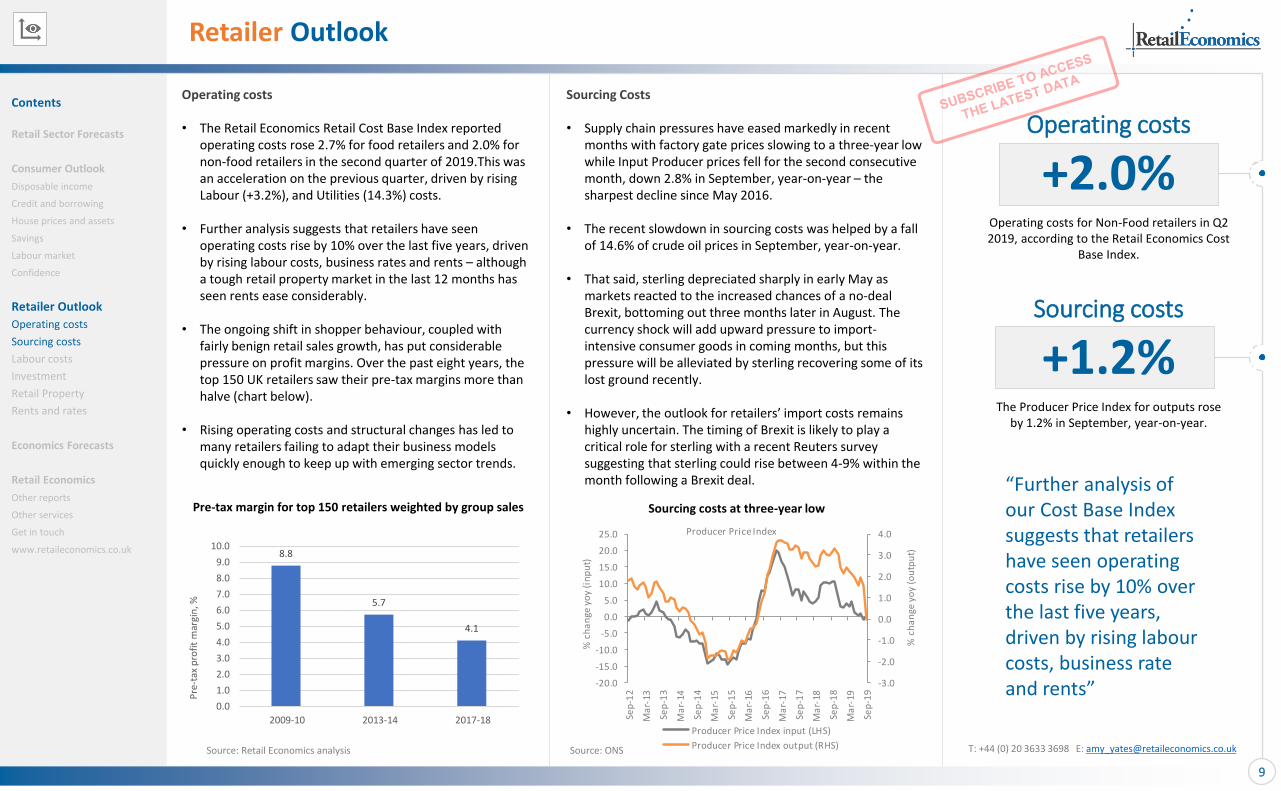
“Further analysis of our Cost Base Index suggests that retailers have seen operating costs rise by 10% over the last five years, driven by rising labour costs, business rate and rents”
Operating costs
+2.0%Operating costs for Non-Food retailers in Q2 2019, according to the Retail Economics Cost
Base Index.
9
Operating costs
• The Retail Economics Retail Cost Base Index reported operating costs rose 2.7% for food retailers and 2.0% for non-food retailers in the second quarter of 2019.This was an acceleration on the previous quarter, driven by rising Labour (+3.2%), and Utilities (14.3%) costs.
• Further analysis suggests that retailers have seen operating costs rise by 10% over the last five years, driven by rising labour costs, business rates and rents – although a tough retail property market in the last 12 months has seen rents ease considerably.
• The ongoing shift in shopper behaviour, coupled with fairly benign retail sales growth, has put considerable pressure on profit margins. Over the past eight years, the top 150 UK retailers saw their pre-tax margins more than halve (chart below).
• Rising operating costs and structural changes has led to many retailers failing to adapt their business models quickly enough to keep up with emerging sector trends.
Source: Retail Economics analysis
Sourcing costs
+1.2%The Producer Price Index for outputs rose
by 1.2% in September, year-on-year.
T: +44 (0) 20 3633 3698 E: [email protected]
Sourcing Costs
• Supply chain pressures have eased markedly in recent months with factory gate prices slowing to a three-year low while Input Producer prices fell for the second consecutive month, down 2.8% in September, year-on-year – the sharpest decline since May 2016.
• The recent slowdown in sourcing costs was helped by a fall of 14.6% of crude oil prices in September, year-on-year.
• That said, sterling depreciated sharply in early May as markets reacted to the increased chances of a no-deal Brexit, bottoming out three months later in August. The currency shock will add upward pressure to import-intensive consumer goods in coming months, but this pressure will be alleviated by sterling recovering some of its lost ground recently.
• However, the outlook for retailers’ import costs remains highly uncertain. The timing of Brexit is likely to play a critical role for sterling with a recent Reuters survey suggesting that sterling could rise between 4-9% within the month following a Brexit deal.
-3.0
-2.0
-1.0
0.0
1.0
2.0
3.0
4.0
-20.0
-15.0
-10.0
-5.0
0.0
5.0
10.0
15.0
20.0
25.0
Sep
-12
Ma
r-13
Sep
-13
Ma
r-14
Sep
-14
Ma
r-15
Sep
-15
Ma
r-16
Sep
-16
Ma
r-17
Sep
-17
Ma
r-18
Sep
-18
Ma
r-19
Sep
-19
% c
ha
nge
yo
y (o
utp
ut)
% c
ha
nge
yo
y (i
np
ut)
Producer Price Index
Producer Price Index input (LHS)
Producer Price Index output (RHS)
Pre-tax margin for top 150 retailers weighted by group sales
Contents
Retail Sector Forecasts
Consumer Outlook
Disposable income
Credit and borrowing
House prices and assets
Savings
Labour market
Confidence
Retailer Outlook
Operating costs
Sourcing costs
Labour costs
Investment
Retail Property
Rents and rates
Economics Forecasts
Retail Economics
Other reports
Other services
Get in touch
www.retaileconomics.co.uk
Sourcing costs at three-year low
8.8
5.7
4.1
0.0
1.0
2.0
3.0
4.0
5.0
6.0
7.0
8.0
9.0
10.0
2009-10 2013-14 2017-18
Pre
-tax
pro
fit
mar
gin
, %
Source: ONS
Retailer Outlook
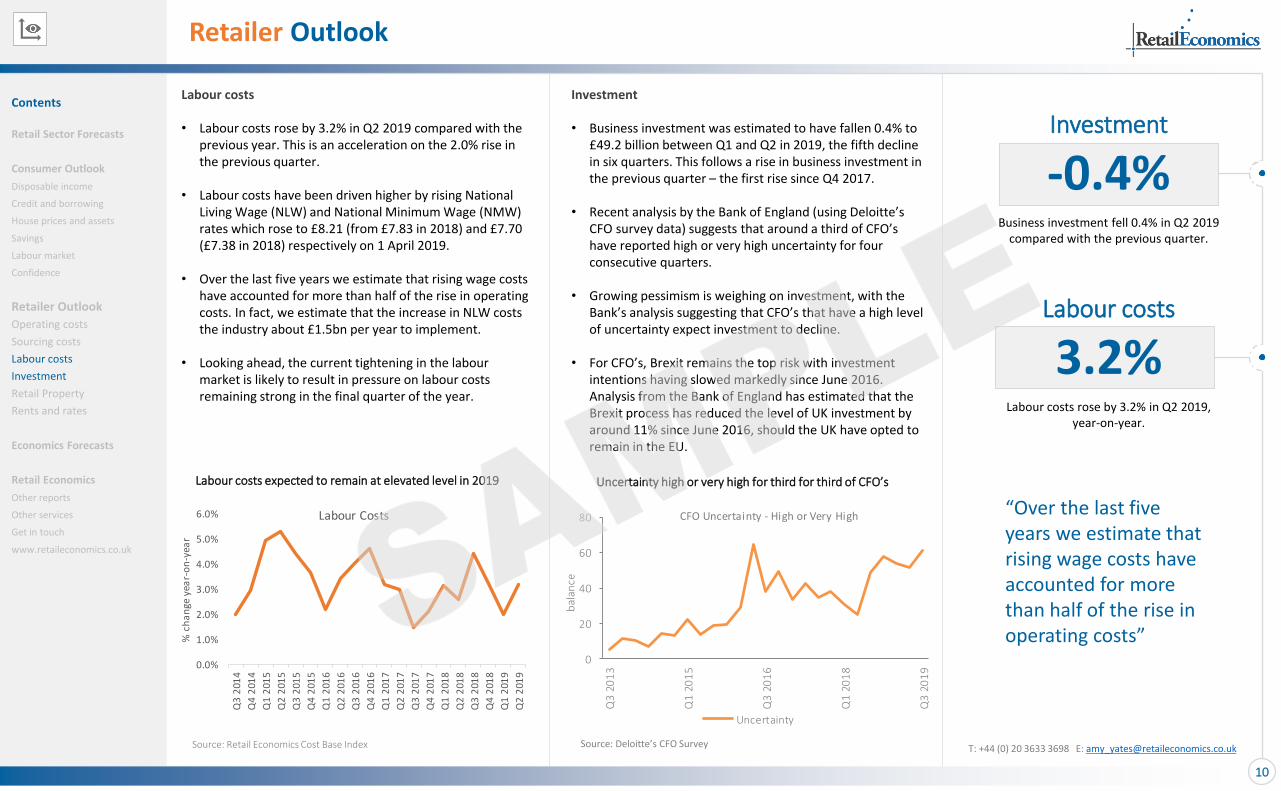
“Over the last five years we estimate that rising wage costs have accounted for more than half of the rise in operating costs”
Investment
-0.4%Business investment fell 0.4% in Q2 2019
compared with the previous quarter.
10
Labour costs
• Labour costs rose by 3.2% in Q2 2019 compared with the previous year. This is an acceleration on the 2.0% rise in the previous quarter.
• Labour costs have been driven higher by rising National Living Wage (NLW) and National Minimum Wage (NMW) rates which rose to £8.21 (from £7.83 in 2018) and £7.70 (£7.38 in 2018) respectively on 1 April 2019.
• Over the last five years we estimate that rising wage costs have accounted for more than half of the rise in operating costs. In fact, we estimate that the increase in NLW costs the industry about £1.5bn per year to implement.
• Looking ahead, the current tightening in the labour market is likely to result in pressure on labour costs remaining strong in the final quarter of the year.
Labour costs
3.2%Labour costs rose by 3.2% in Q2 2019,
year-on-year.
T: +44 (0) 20 3633 3698 E: [email protected]
Investment
• Business investment was estimated to have fallen 0.4% to £49.2 billion between Q1 and Q2 in 2019, the fifth decline in six quarters. This follows a rise in business investment in the previous quarter – the first rise since Q4 2017.
• Recent analysis by the Bank of England (using Deloitte’s CFO survey data) suggests that around a third of CFO’s have reported high or very high uncertainty for four consecutive quarters.
• Growing pessimism is weighing on investment, with the Bank’s analysis suggesting that CFO’s that have a high level of uncertainty expect investment to decline.
• For CFO’s, Brexit remains the top risk with investment intentions having slowed markedly since June 2016. Analysis from the Bank of England has estimated that the Brexit process has reduced the level of UK investment by around 11% since June 2016, should the UK have opted to remain in the EU.
Source: Retail Economics Cost Base Index
Labour costs expected to remain at elevated level in 2019
Contents
Retail Sector Forecasts
Consumer Outlook
Disposable income
Credit and borrowing
House prices and assets
Savings
Labour market
Confidence
Retailer Outlook
Operating costs
Sourcing costs
Labour costs
Investment
Retail Property
Rents and rates
Economics Forecasts
Retail Economics
Other reports
Other services
Get in touch
www.retaileconomics.co.uk
Source: Deloitte’s CFO Survey
Uncertainty high or very high for third for third of CFO’s
0
20
40
60
80
Q3
20
13
Q1
20
15
Q3
20
16
Q1
20
18
Q3
20
19
bal
ance
CFO Uncertainty - High or Very High
Uncertainty
0.0%
1.0%
2.0%
3.0%
4.0%
5.0%
6.0%
Q3
201
4
Q4
201
4
Q1
201
5
Q2
201
5
Q3
201
5
Q4
201
5
Q1
201
6
Q2
201
6
Q3
201
6
Q4
201
6
Q1
201
7
Q2
201
7
Q3
201
7
Q4
201
7
Q1
201
8
Q2
201
8
Q3
201
8
Q4
201
8
Q1
201
9
Q2
201
9
% c
ha
nge
yea
r-o
n-y
ear
Labour Costs
Retailer Outlook
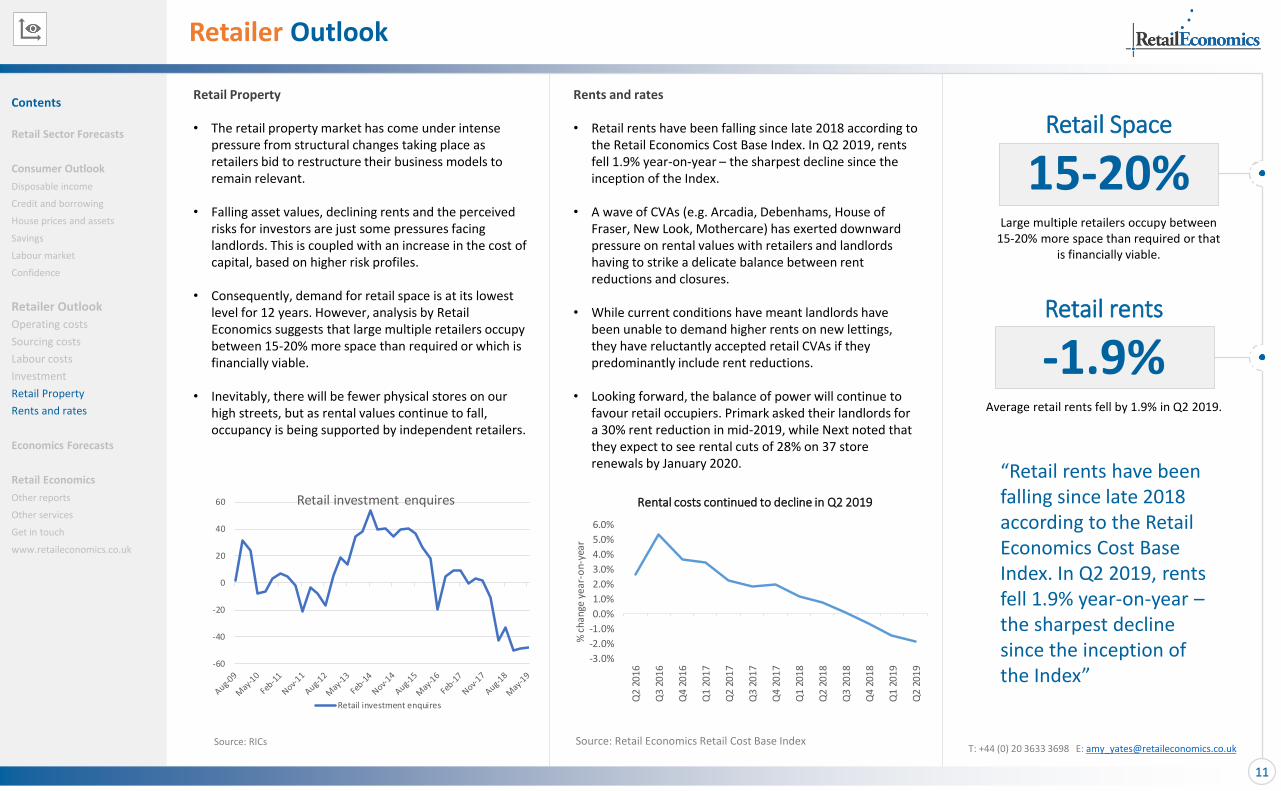
“Retail rents have been falling since late 2018 according to the Retail Economics Cost Base Index. In Q2 2019, rents fell 1.9% year-on-year –the sharpest decline since the inception of the Index”
Retail Space
15-20%Large multiple retailers occupy between
15-20% more space than required or that is financially viable.
11
Retail Property
• The retail property market has come under intense pressure from structural changes taking place as retailers bid to restructure their business models to remain relevant.
• Falling asset values, declining rents and the perceived risks for investors are just some pressures facing landlords. This is coupled with an increase in the cost of capital, based on higher risk profiles.
• Consequently, demand for retail space is at its lowest level for 12 years. However, analysis by Retail Economics suggests that large multiple retailers occupy between 15-20% more space than required or which is financially viable.
• Inevitably, there will be fewer physical stores on our high streets, but as rental values continue to fall, occupancy is being supported by independent retailers.
Retail rents
-1.9%Average retail rents fell by 1.9% in Q2 2019.
T: +44 (0) 20 3633 3698 E: [email protected]
Rents and rates
• Retail rents have been falling since late 2018 according to the Retail Economics Cost Base Index. In Q2 2019, rents fell 1.9% year-on-year – the sharpest decline since the inception of the Index.
• A wave of CVAs (e.g. Arcadia, Debenhams, House of Fraser, New Look, Mothercare) has exerted downward pressure on rental values with retailers and landlords having to strike a delicate balance between rent reductions and closures.
• While current conditions have meant landlords have been unable to demand higher rents on new lettings, they have reluctantly accepted retail CVAs if they predominantly include rent reductions.
• Looking forward, the balance of power will continue to favour retail occupiers. Primark asked their landlords for a 30% rent reduction in mid-2019, while Next noted that they expect to see rental cuts of 28% on 37 store renewals by January 2020.
Source: Retail Economics Retail Cost Base Index
Rental costs continued to decline in Q2 2019
Contents
Retail Sector Forecasts
Consumer Outlook
Disposable income
Credit and borrowing
House prices and assets
Savings
Labour market
Confidence
Retailer Outlook
Operating costs
Sourcing costs
Labour costs
Investment
Retail Property
Rents and rates
Economics Forecasts
Retail Economics
Other reports
Other services
Get in touch
www.retaileconomics.co.uk
-3.0%
-2.0%
-1.0%
0.0%
1.0%
2.0%
3.0%
4.0%
5.0%
6.0%
Q2
2016
Q3
2016
Q4
2016
Q1
2017
Q2
2017
Q3
2017
Q4
2017
Q1
2018
Q2
2018
Q3
2018
Q4
2018
Q1
2019
Q2
2019
% c
hang
e ye
ar-o
n-ye
ar
Source: RICs
-60
-40
-20
0
20
40
60 Retail investment enquires
Retail investment enquires
Economic forecasts
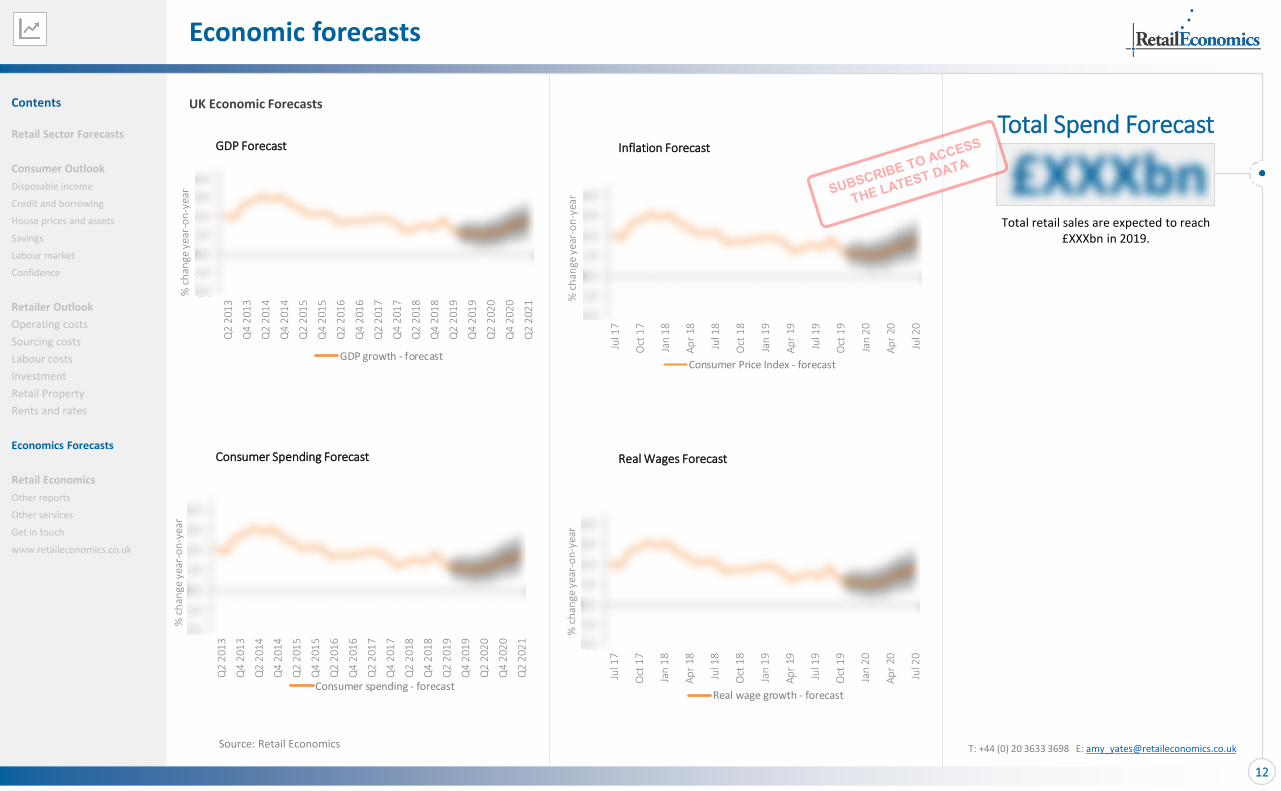
Total Spend Forecast
£XXXbnTotal retail sales are expected to reach
£XXXbn in 2019.
12
UK Economic Forecasts
T: +44 (0) 20 3633 3698 E: [email protected]
GDP Forecast Inflation Forecast
Consumer Spending Forecast Real Wages Forecast
Source: Retail Economics
Contents
Retail Sector Forecasts
Consumer Outlook
Disposable income
Credit and borrowing
House prices and assets
Savings
Labour market
Confidence
Retailer Outlook
Operating costs
Sourcing costs
Labour costs
Investment
Retail Property
Rents and rates
Economics Forecasts
Retail Economics
Other reports
Other services
Get in touch
www.retaileconomics.co.uk
-2.0
-1.0
0.0
1.0
2.0
3.0
4.0
Jul 1
7
Oct
17
Jan
18
Ap
r 18
Jul 1
8
Oct
18
Jan
19
Ap
r 19
Jul 1
9
Oct
19
Jan
20
Ap
r 20
Jul 2
0
% c
han
ge y
ear-
on
-yea
r
Real wage growth - forecast
-2.0
-1.0
0.0
1.0
2.0
3.0
4.0
Q2
201
3
Q4
201
3
Q2
201
4
Q4
201
4
Q2
201
5
Q4
201
5
Q2
201
6
Q4
201
6
Q2
201
7
Q4
201
7
Q2
201
8
Q4
201
8
Q2
201
9
Q4
201
9
Q2
202
0
Q4
202
0
Q2
202
1
% c
han
ge y
ear-
on
-yea
r
Consumer spending - forecast
-2.0
-1.0
0.0
1.0
2.0
3.0
4.0
Q2
201
3
Q4
201
3
Q2
201
4
Q4
201
4
Q2
201
5
Q4
201
5
Q2
201
6
Q4
201
6
Q2
201
7
Q4
201
7
Q2
201
8
Q4
201
8
Q2
201
9
Q4
201
9
Q2
202
0
Q4
202
0
Q2
202
1
% c
han
ge y
ear-
on
-yea
r
GDP growth - forecast
0.0
0.5
1.0
1.5
2.0
2.5
3.0
3.5
Jul 1
7
Oct
17
Jan
18
Ap
r 18
Jul 1
8
Oct
18
Jan
19
Ap
r 19
Jul 1
9
Oct
19
Jan
20
Ap
r 20
Jul 2
0
% c
han
ge y
ear-
on
-yea
r
Consumer Price Index - forecast

Monthly: covers a range of retail sales indices and category breakdowns including online retail sales, clothing and footwear, household goods, food, DIY and gardening, consumer electricals and more. More info >
UK Retail Sales
UK Online Retail
UK Retail Inflation
UK Consumer*
UK Retail Economic Briefing
UK Retail Industry Outlook*
Executive Report
DIY & Gardening
Health & Beauty
Furniture & Flooring
Clothing & Footwear
Food & Grocery
Electricals
Homewares
Monthly: covers a range of online retail sales indices and category breakdowns including online retail sales, online growth rates by sector, online penetration rates, forecasts and market size estimates. More info >
Monthly: covers a range of retail inflation indices and category breakdowns including food inflation, non-food inflation, clothing and footwear, household goods, food, DIY and gardening, consumer electricals, commodity prices, exchange rates and more. More info >
Quarterly: analyses a range of UK consumer spending indicators including housing market data, consumer confidence, consumer credit, household inflation, labour market statistics, wage growth, retail sales and more. More info >
Monthly: analyses a range of macroeconomic indicators including GDP, consumer spending, inflation, labour market, commodity prices, exchange rates, monetary indicators, credit and lending market data, house prices, mortgage data, retail sales and more. More info >
Quarterly: provides a forward-looking critical retail analysis. Predictive forecasts and insightful narrative draw upon our econometric models to help you identify the key risks and future opportunities to drive your strategic planning. More info >
Monthly: provides a succinct one-page summary ideal for senior management and meeting notes; concise need-to-know retail data for the month which includes a mix of the major economic indicators and retail metrics. More info >
Food & Grocery retail sales indexBespoke sector specific economic analysisFood online sales and penetration ratesMarket share dataFood inflation analysis and more. More info >
Clothing & Footwear retail sales indexBespoke sector specific economic analysisClothing online sales and penetration ratesConsumer trends for online shoppingSpend on clothing by region and more. More info >
Homewares retail sales indexBespoke sector specific economic analysisHomewares region spending dataAnalysis of key economic drivers such as house moves, personal finances etc.Weather data and more. More info >
Furniture & Flooring retail sales indexBespoke sector specific economic analysisConsumer trends for online shoppingAnalysis of key economic drivers such as consumer confidence, credit and lendingRegional footfall statistics and more. More info >
DIY & Gardening retail sales indexBespoke sector specific economic analysisDIY & Gardening region spending dataAnalysis of key economic drivers such as weather data, ‘improve not move’ trendsExecutive summary and more. More info >
Electricals retail sales indexBespoke sector specific economic analysisConsumer trends for online shoppingAnalysis of key economic drivers such as disposable income growth, product launches etc.Electricals inflation and more. More info >
Health & Beauty retail sales indexBespoke sector specific economic analysisHealth & Beauty shopper trends such as ‘lipstick effect’, own-brand cosmetics etc.Impact of digital and social mediaHousehold spend by region and more. More info >
COVID-19 Service
Shopper Sentiment Survey
Quick Response Service
Face-to-face presentation
Retail Cost Base Index
Tailored Reporting
Additional users
Get impact assessment reports for the UK retail and leisure industry to help identify threats“COVID-19 Quick Responses”, consumer panel research COVID-19 newsletters, economic chartbooks and more… info >
Keep a finger on the pulse of what’s driving UK consumer shopping behaviour. Identify the range of macroeconomic factors that influences household spending. Really understand your consumer base and the cost pressures they faceIdentify opportunities within your sector.
Get the latest need-to-know retail news straight to your inbox. Choose: 1) Economic updates — GDP, consumer spending, retail sales, wages, house prices, credit and more; or 2) Retailer results — key financial results and critical retailer news reported for around 50 listed retailers.
Hear our thought-provoking views and opinions at your conferences, seminars, company away-days or board meetingsGet the personal touch from senior staff members — Richard Lim (CEO) & Stephen Robertson (Chairman) being in popular demand.
Essential for improving your financial planning strategyGain a deeper understanding of your operating costs in order to manage risk. Learn how macroeconomic factors might affect your supply chain. Producer Price Index (inputs and outputs) data. Understand the impact of labour costs, business rates etc.
Get the precise data your looking for and accurately answer key retail questions. It cuts through the noise and enables us to deliver bespoke reporting tools which are relied on by executive teams to identify the need-to-know economic indicators and to interpret what they mean for your business.
Need more user accounts? No problem, this bolt-on allows you to add additional users so you can share insights directly within your team.
Economic Retail Reports Retail Sector Reports Subscription Bolt-On Services
Other reports and Services

We’re an authoritative voice… Trusted by many
Why use Retail Economics?
Head of Retail and Leisure
Retail Economics is more than a subscription. They provide insightful and thought-provoking economic and retail analysis.
“
Customer & Commercial Insight Director
Retail Economics provides the business with the latest socio-economic data that enables us to understand the latest factors impacting customer behaviour.
“
Business Manager
Retail Economics helps put in to context the volatile economic environment which adds significant value to our business.
“
Our services
CEO Presentations
Get the personal touch and interact face-to-face with the CEO Retail Economics (City AM Analyst of the Year 2019 nominee).
Secure an opportunity to hear our thought-provoking views and opinions at your conferences, seminars, company away-days or board meetings; both Richard Lim (CEO) and Stephen Robertson (Chairman) being in popular demand.
Media, PR & Comms
Maximise impact and media traction for your projects and campaigns using our extensive industry expertise and well-established networks.
Secure the attention your work deserves and achieve its intended impact. We assist and advise on: campaign creation and planning, media engagement, messaging, propositioning, events, trends, insight analysis, thought leadership and influencer targeting.
Thought Leadership Research
Be a prominent thought leader and command authority within your field by publishing thought leadership research.
Publishing cutting edge research on ahead-of-the-curve issues and trends affecting the industry is a proven method to command authority and raise profile. We plan and implement research, analyse results, identify key findings and generate reports with complete flexibility of input. This is a complete end-to-end service from research planning to campaign launch.
Subscription Service
Our subscription service is a completely tailored, holistic, retail intelligence package:
• Monthly economic reports • Monthly retail sector reports• Downloadable timeseries data • Help desk assistance • Quick response retail updates• Shopper sentiment surveys• COVID-19 Service content • Retail cost base index• Tailored reporting• Face-to-face presentations • Newsletters and more…
Economic modelling
Better understand how your key industry variables affect your organisation: demography, socio-economic profiles, regional, sector, policy, industry and skills etc.
Our economic consultancy team use industry standard practices for: forecasting, scenario analysis, data analytics, socio-demographic projections and economic impact modelling. We also undertake highly bespoke modelling for forecasting.
Advisory & Business planning
Accelerate and grow your business with intelligent planning, forecasting and risk management using our business advisory service.
We work with multiple retailers, institutional investors and government departments using robust data and expert advice on: business plans, propositioning, funding, marketing and strategy. We can also conduct market research for more informed planning.
Data & Benchmarking
Using industry standard methodology and best practices, we provide bespoke proprietary data and benchmarking services allowing you to accurately measure and monitor performance.
Avoid inaccurate estimates and ‘second guessing’ to assess your performance. Get the precise data and use robust economic models to accurately gauge your performance against tailored metrics.
Brexit advisory service
Our Brexit advisory service arms you with critical insights needed to limit your risk and ensure Brexit readiness and beyond.
Brexit is affecting many industries above and beyond retail. Our specialist Brexit advisors can help you navigate the policy implications, bringing clarity to your planning strategies and ensure you are best placed going forward.
COVID-19 Service
Better asses the impact of the coronavirus crisis; essential to inform critical decisions, mitigate risk and to plan ahead in such challenging times.
Keep abreast of the latest developments affecting the industry. Gauge consumer sentiment by sector and channel with proprietary data. Identify opportunities from the myriad of challenges facing the industry.
EXPLORE SUBSCRIPTIONS NOW
With our Subscription Service, you choose the monthly insight reports and services you need, we create a maximum value package for you. We offer:
Discover how our subscription service can improve your performance…

Retail Economics is an independent economics research consultancy focusing exclusivelyon the UK retail and consumer industry. Our subscription service empowers you with adeeper understanding of the key economic drivers supporting the UK retail industry,providing a competitive edge needed to make critical business and investment decisions.
Retail Economics4th Floor86-90 Paul StreetLondonEC2A 4NE
Get in touch
+44 (0)20 3633 3698
www.retaileconomics.co.uk
@retaileconomics
Disclaimer: The articles and opinions contained in this publication do not necessarily reflect the views of Retail Economics. WhilstRetail Economics endeavours to ensure that the information in this publication is accurate and that the articles contain nothingprejudicial to the position or reputation of any party, Retail Economics shall not be liable for any damages (including withoutlimitation, damages for loss of business or loss of profits) arising in contract, tort or otherwise from this publication or anyinformation contained in it, or from any action or decision as a result of reading this report.
(C) Retail Economics (2020). The contents of this report and those of all ancillary documents and preparatory materials are the soleproperty of Retail Economics and are not to be copied, modified, published, distributed or commercially exploited other than withthe express permission of Retail Economics. All rights reserved.