Embed Size (px)
Citation preview

Retail Sourcing Report Facts & Insight
Q4 2016
© 1995-2016 Copyright by CBX Software. All rights reserved.
1
FORWARD
RETAIL SOURCING REPORT
CBX Software’s Retail Sourcing Report provides research and analysis
aimed at informing global sourcing and buying decisions for retailers, brands
and other sourcing professionals. Each issue includes a snapshot of key
information impacting global sourcing, such as economic conditions in
sourcing countries, container shipping prices, currency exchange rates and
commodity costs. We also cover hot topics ourselves and include insight
from analysts and other experts.
If you like this content, please share:
LinkedIn, Facebook, Twitter
Americas +1.908.898.1880
Asia +852.2378.6300
EMEA +44.20.8133.0328
www.cbxsoftware.com
Statement of Indemnity: CBX Software recommends that any information provided in this report be
weighed against other sources and experts on the individual topics covered. As such, CBX Software bears no legal or financial responsibility for any potential harm or outcome which may result directly or indirectly from information provided in this report.

Q4 2016 Retail Sourcing Report
2 2
Content RETAIL SOURCING REPORT ............................................................................................................................ 0
FORWARD ..................................................................................................................................................... 1
PURCHASING MANAGER’S INDEX ............................................................................................................ 3
MAJOR ECONOMIC INDICATORS .............................................................................................................. 4
GLOBAL COMPETITIVENESS INDEX ......................................................................................................... 5
CHINA WAGE TREND SNAPSHOT .............................................................................................................. 6
GLOBAL LOW COST SOURCING COUNTRY WAGE SNAPSHOT ........................................................... 7
CONTAINER FREIGHT RATES FOR MAJOR ROUTES ............................................................................. 8
CURRENCY EXCHANGE RATES ................................................................................................................. 9
GLOBAL COMMODITY RATES .................................................................................................................. 10
CRUDE OIL ................................................................................................................................................. 10 RUBBER ..................................................................................................................................................... 10 METAL ........................................................................................................................................................ 10 WOOD ........................................................................................................................................................ 11 WOOL, HIDES, COTTON ............................................................................................................................... 11 PLASTICS AND FIBERS ................................................................................................................................. 12
QUALITY FOCUS ........................................................................................................................................ 12
KEY QUALITY KPIS ..................................................................................................................................... 12 QUALITY RELATED NEWS ............................................................................................................................ 13
SPECIAL FOCUS TOPIC ............................................................................................................................. 14
GLOBAL TRADE AT A CROSSROADS .............................................................................................................. 14
ABOUT CBX SOFTWARE ........................................................................................................................... 15

© 1995-2016 Copyright by CBX Software. All rights reserved.
3
Purchasing Manager’s Index
To help understand industry and economic conditions in a country, the PMI Index tracks variables such as
output, new orders, stock levels, employment and prices across private companies in the manufacturing,
construction, retail and service sectors.
A reading below 50 indicates contraction from the previous month, while a reading above 50 indicates
growth. Currently 22 countries and regions conduct the PMI survey and compilation, based on an
internationally standardized methodology. This update looks at a selection of emerging economies and key
sourcing countries, providing indicators for recent months (based on data provided by IHS Markit).
Analysis: Global manufacturing expanded at a moderate rate through Q3 with overall subdued growth in
the US and Asia. Downturns continued in some parts of Europe, South Korea, Turkey, Malaysia, Thailand,
Myanmar and Brazil. Some European countries such as Germany, Austria, the Netherlands and the UK
saw economic expansion along with the Czech Republic, Poland and Russia. Overall, global
manufacturing was in a low growth gear of between 1-2%.
Country Jul
2016 Aug 2016
Sep 2016
Summary of Indicators
Brazil 46.0 45.7 46.0 Brazil continued in recession mode with lowered production, employment and purchasing activity; new export orders were the lowest in 7 years.
China 49.9 50.0 50.1 China experienced a marginal increase in operating conditions into Q4, with some increase in demand, but employment declines continued.
Czech Republic
49.3 50.1 52.0 The Czech manufacturing sector experienced a recovery heading into Q4 with growth in new orders, employment and purchasing activity.
Egypt 48.9 47.0 46.3 Business conditions in Egypt worsened with declines in output and new work, job losses and inflation from a weak currency and a new VAT.
India 51.8 52.6 52.1 Indian manufacturing sustained an upturn going into Q4 with growth in output and purchasing and strong export orders despite inflation pressure.
Indonesia 48.4 50.4 50.9 Conditions at Indonesian manufacturers improved through Q3 with an increase in new orders both domestically and for export, despite inflation.
Malaysia 48.1 47.4 48.6 Malaysian manufacturing declined through Q3 and into Q4 with a contraction production and new orders and slowing export demand.
Mexico 50.6 50.9 51.9 Mexican manufacturing expanded moderately into September with output, new orders and employment rising at the fastest pace in four months.
Myanmar 49.2 47.2 48.1 The downturn continued in Myanmar’s manufacturing economy in Q3 with declines in output, new orders and employment and input price inflation.
Poland 50.3 51.5 52.2 Poland’s manufacturing continued to gain momentum into Q4 with growth in exports, output and new business as well as employment increases.
Russia 49.5 50.8 51.1 Russia experienced the sharpest rise in production in two years in September with a demand for new orders mostly driven domestically.
South Africa
49.9 49.8 50.7 PMI results signaled an upturn in the South African private sector with output expanding for the first time in a year and a half and stronger employment growth.
South Korea
50.1 48.6 47.6 Manufacturing conditions deteriorated sharply through Q3 and into Q4 in South Korea based on slow international demand and declining output.
Turkey 47.6 47.0 48.3 Turkey’s manufacturing downturn continued into Q4, despite some improvements, but output and new orders continued to decline.
Vietnam 51.9 52.2 52.9 Vietnam saw growth through Q3 with new orders, output, purchasing activity and employment all increasing, along with a rise in output prices.
Sources: IHS Markit Economics and Nikkei

Q4 2016 Retail Sourcing Report
4 4
Major Economic Indicators
This section looks at major economic indicators from key “low-cost” sourcing destinations, also pulling out
highlights and sourcing trends in these countries. Going into Q4, conditions in key low cost sourcing
destinations were mostly disappointing, with contraction in Cambodia, India, Indonesia, Pakistan and
Thailand. Vietnam was one of the few bright spots, with growing exports.
Selected highlights:
Bangladesh – Exports grew 8.4% in the first two months of the 2016/2017 fiscal year, to US$ 5.84 bln
Cambodia – US imports of cotton and manmade fibre apparel declined by 18.6% and 7.4% in 1H 2016
India –180 mln people went on strike in September, demanding a US$ 270 minimum monthly wage
Indonesia – Exports plunged 17% yoy to US$ 9.51 bln in July, the lowest July export value since 2009
Pakistan – Net FDI fell by 53% yoy on concerns over political uncertainty, security and energy shortages
Philippines – GDP grew 7% in Q2 2016, the highest growth since 2013, despite declining exports
Thailand – Exports contracted in Q2 to US$ 18.1 bln, partly on stronger exports heading into 2H 2016
Turkey – Exports recovered slightly in August after falling by 18.7% in July, partly due to a coup attempt
Vietnam – The National Wage Council agreed to increase min wage by 7.3% in 2017, effective Jan 2017
CPI (% yoy growth)
Mar 2016
April 2016
May 2016
June 2016
July 2016
Aug 2016
Bangladesh 5.7 5.6 5.5 5.5 5.4 5.4
Cambodia 2.0 2.8 3.1 - - -
India 4.8 5.5 5.8 5.8 - 5.1
Indonesia 4.4 3.6 3.3 3.5 3.2 -
Pakistan 3.9 4.2 3.2 3.2 - 3.6
Philippines 1.1 1.1 1.6 1.9 1.9 -
Thailand -0.5 0.1 0.5 0.4 0.1 -
Turkey 7.5 6.6 6.6 7.6 8.8 8.1
Vietnam 1.7 1.9 2.3 2.4 2.4 -
Exports (% yoy growth)
Mar 2016
April 2016
May 2016
June 2016
July 2016
Aug 2016
Bangladesh 9.2 11.8 6.5 16.7 -3.5 19.8
Cambodia 13.5 12.4 7.8 - - -
India -5.5 -6.7 -0.8 1.3 6.1 5.1
Indonesia -13.5 -12.7 -9.8 -4.4 -17.0 -
Pakistan -9.6 -13.4 -6.0 -8.7 -6.9 -9.4
Philippines -15.1 -4.1 -3.8 -11.4 - -
Thailand 1.3 -8.0 -4.4 -0.1 - -
Turkey 2.0 -10.4 9.3 7.9 -11.5 -
Vietnam 6.6 6.5 6.2 5.7 5.4 -
Imports (% yoy growth)
Mar 2016
April 2016
May 2016
June 2016
July 2016
Aug 2016
Bangladesh -1.6 0.2 9.6 3.7 3.8 -
Cambodia 14.0 11.5 16.6 - - -
India -21.6 -23.1 -13.2 -7.3 -19.0 -14.1
Indonesia -10.4 -14.6 -4.1 -7.4 -11.6 -
Pakistan 3.1 1.6 7.6 2.3 -6.2 13.9
Philippines 11.7 29.2 39.3 15.4 - -
Thailand -6.9 -14.9 0.5 -10.1 - -
Turkey -5.1 -11.9 -3.8 7.0 -19.7 -
Vietnam -4.0 -1.3 -1.7 -0.8 -1.2 -
Sources: Fung Group, Various Statistical Bureaus
© 1995-2016 Copyright by CBX Software. All rights reserved.
5
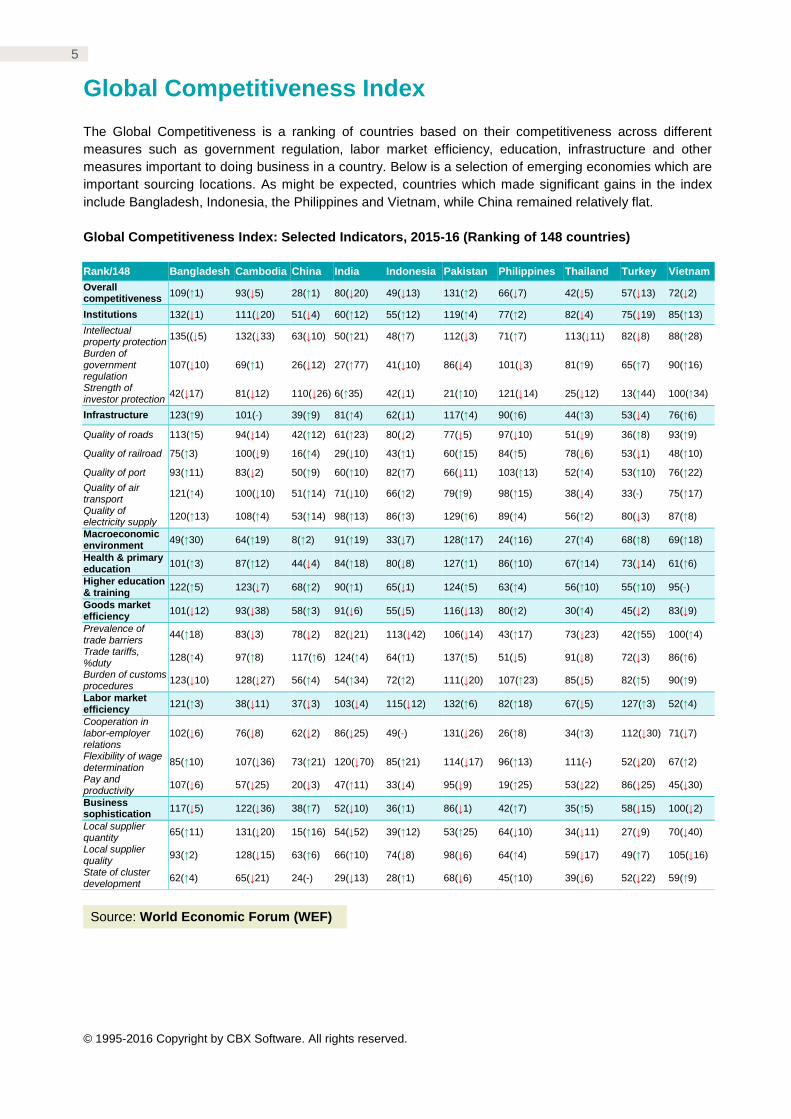
Global Competitiveness Index
The Global Competitiveness is a ranking of countries based on their competitiveness across different
measures such as government regulation, labor market efficiency, education, infrastructure and other
measures important to doing business in a country. Below is a selection of emerging economies which are
important sourcing locations. As might be expected, countries which made significant gains in the index
include Bangladesh, Indonesia, the Philippines and Vietnam, while China remained relatively flat.
Global Competitiveness Index: Selected Indicators, 2015-16 (Ranking of 148 countries)
Rank/148 Bangladesh Cambodia China India Indonesia Pakistan Philippines Thailand Turkey Vietnam
Overall competitiveness
109(↑1) 93(↓5) 28(↑1) 80(↓20) 49(↓13) 131(↑2) 66(↓7) 42(↓5) 57(↓13) 72(↓2)
Institutions 132(↓1) 111(↓20) 51(↓4) 60(↑12) 55(↑12) 119(↑4) 77(↑2) 82(↓4) 75(↓19) 85(↑13)
Intellectual property protection
135((↓5) 132(↓33) 63(↓10) 50(↑21) 48(↑7) 112(↓3) 71(↑7) 113(↓11) 82(↓8) 88(↑28)
Burden of government regulation
107(↓10) 69(↑1) 26(↓12) 27(↑77) 41(↓10) 86(↓4) 101(↓3) 81(↑9) 65(↑7) 90(↑16)
Strength of investor protection
42(↓17) 81(↓12) 110(↓26) 6(↑35) 42(↓1) 21(↑10) 121(↓14) 25(↓12) 13(↑44) 100(↑34)
Infrastructure 123(↑9) 101(-) 39(↑9) 81(↑4) 62(↓1) 117(↑4) 90(↑6) 44(↑3) 53(↓4) 76(↑6)
Quality of roads 113(↑5) 94(↓14) 42(↑12) 61(↑23) 80(↓2) 77(↓5) 97(↓10) 51(↓9) 36(↑8) 93(↑9)
Quality of railroad 75(↑3) 100(↓9) 16(↑4) 29(↓10) 43(↑1) 60(↑15) 84(↑5) 78(↓6) 53(↓1) 48(↑10)
Quality of port 93(↑11) 83(↓2) 50(↑9) 60(↑10) 82(↑7) 66(↓11) 103(↑13) 52(↑4) 53(↑10) 76(↑22)
Quality of air transport
121(↑4) 100(↓10) 51(↑14) 71(↓10) 66(↑2) 79(↑9) 98(↑15) 38(↓4) 33(-) 75(↑17)
Quality of electricity supply
120(↑13) 108(↑4) 53(↑14) 98(↑13) 86(↑3) 129(↑6) 89(↑4) 56(↑2) 80(↓3) 87(↑8)
Macroeconomic environment
49(↑30) 64(↑19) 8(↑2) 91(↑19) 33(↓7) 128(↑17) 24(↑16) 27(↑4) 68(↑8) 69(↑18)
Health & primary education
101(↑3) 87(↑12) 44(↓4) 84(↑18) 80(↓8) 127(↑1) 86(↑10) 67(↑14) 73(↓14) 61(↑6)
Higher education & training
122(↑5) 123(↓7) 68(↑2) 90(↑1) 65(↓1) 124(↑5) 63(↑4) 56(↑10) 55(↑10) 95(-)
Goods market efficiency
101(↓12) 93(↓38) 58(↑3) 91(↓6) 55(↓5) 116(↓13) 80(↑2) 30(↑4) 45(↓2) 83(↓9)
Prevalence of trade barriers
44(↑18) 83(↓3) 78(↓2) 82(↓21) 113(↓42) 106(↓14) 43(↑17) 73(↓23) 42(↑55) 100(↑4)
Trade tariffs, %duty
128(↑4) 97(↑8) 117(↑6) 124(↑4) 64(↑1) 137(↑5) 51(↓5) 91(↓8) 72(↓3) 86(↑6)
Burden of customs procedures
123(↓10) 128(↓27) 56(↑4) 54(↑34) 72(↑2) 111(↓20) 107(↑23) 85(↓5) 82(↑5) 90(↑9)
Labor market efficiency
121(↑3) 38(↓11) 37(↓3) 103(↓4) 115(↓12) 132(↑6) 82(↑18) 67(↓5) 127(↑3) 52(↑4)
Cooperation in labor-employer relations
102(↓6) 76(↓8) 62(↓2) 86(↓25) 49(-) 131(↓26) 26(↑8) 34(↑3) 112(↓30) 71(↓7)
Flexibility of wage determination
85(↑10) 107(↓36) 73(↑21) 120(↓70) 85(↑21) 114(↓17) 96(↑13) 111(-) 52(↓20) 67(↑2)
Pay and productivity
107(↓6) 57(↓25) 20(↓3) 47(↑11) 33(↓4) 95(↓9) 19(↑25) 53(↓22) 86(↓25) 45(↓30)
Business sophistication
117(↓5) 122(↓36) 38(↑7) 52(↓10) 36(↑1) 86(↓1) 42(↑7) 35(↑5) 58(↓15) 100(↓2)
Local supplier quantity
65(↑11) 131(↓20) 15(↑16) 54(↓52) 39(↑12) 53(↑25) 64(↓10) 34(↓11) 27(↓9) 70(↓40)
Local supplier quality
93(↑2) 128(↓15) 63(↑6) 66(↑10) 74(↓8) 98(↓6) 64(↑4) 59(↓17) 49(↑7) 105(↓16)
State of cluster development
62(↑4) 65(↓21) 24(-) 29(↓13) 28(↑1) 68(↓6) 45(↑10) 39(↓6) 52(↓22) 59(↑9)
Source: World Economic Forum (WEF)
Q4 2016 Retail Sourcing Report
6 6
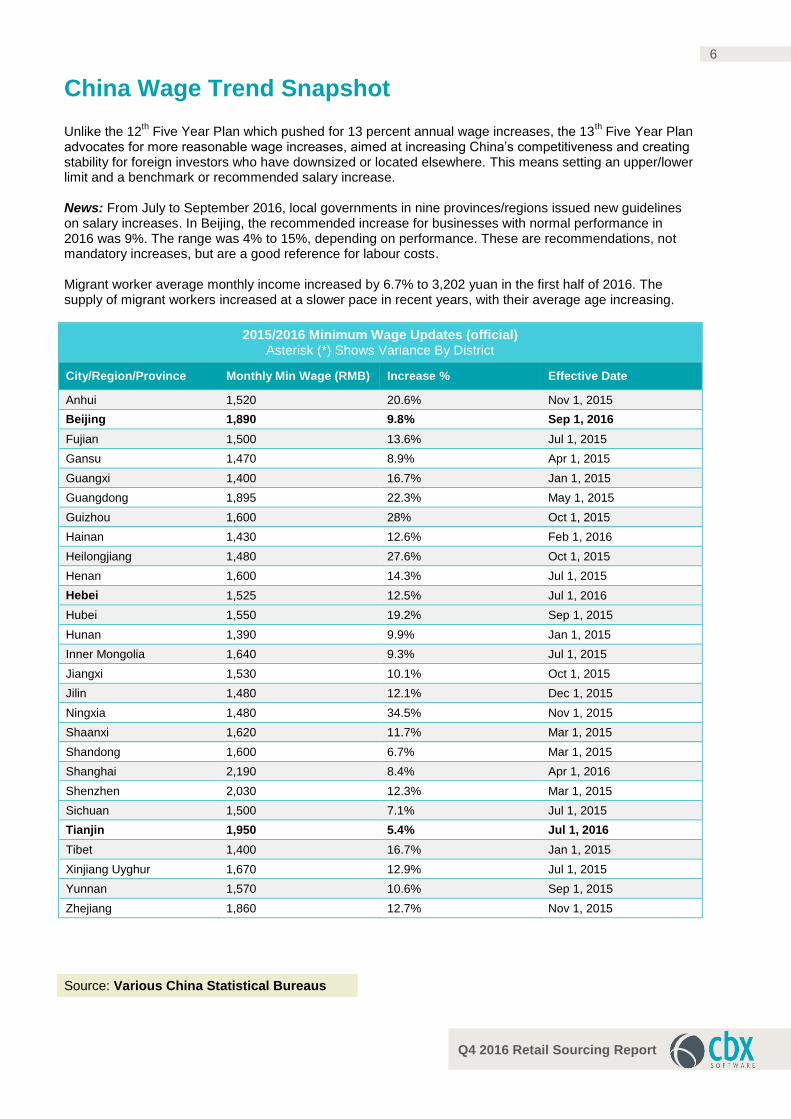
China Wage Trend Snapshot
Unlike the 12th Five Year Plan which pushed for 13 percent annual wage increases, the 13
th Five Year Plan
advocates for more reasonable wage increases, aimed at increasing China’s competitiveness and creating stability for foreign investors who have downsized or located elsewhere. This means setting an upper/lower limit and a benchmark or recommended salary increase. News: From July to September 2016, local governments in nine provinces/regions issued new guidelines on salary increases. In Beijing, the recommended increase for businesses with normal performance in 2016 was 9%. The range was 4% to 15%, depending on performance. These are recommendations, not mandatory increases, but are a good reference for labour costs. Migrant worker average monthly income increased by 6.7% to 3,202 yuan in the first half of 2016. The supply of migrant workers increased at a slower pace in recent years, with their average age increasing.
2015/2016 Minimum Wage Updates (official) Asterisk (*) Shows Variance By District
City/Region/Province Monthly Min Wage (RMB) Increase % Effective Date
Anhui 1,520 20.6% Nov 1, 2015
Beijing 1,890 9.8% Sep 1, 2016
Fujian 1,500 13.6% Jul 1, 2015
Gansu 1,470 8.9% Apr 1, 2015
Guangxi 1,400 16.7% Jan 1, 2015
Guangdong 1,895 22.3% May 1, 2015
Guizhou 1,600 28% Oct 1, 2015
Hainan 1,430 12.6% Feb 1, 2016
Heilongjiang 1,480 27.6% Oct 1, 2015
Henan 1,600 14.3% Jul 1, 2015
Hebei 1,525 12.5% Jul 1, 2016
Hubei 1,550 19.2% Sep 1, 2015
Hunan 1,390 9.9% Jan 1, 2015
Inner Mongolia 1,640 9.3% Jul 1, 2015
Jiangxi 1,530 10.1% Oct 1, 2015
Jilin 1,480 12.1% Dec 1, 2015
Ningxia 1,480 34.5% Nov 1, 2015
Shaanxi 1,620 11.7% Mar 1, 2015
Shandong 1,600 6.7% Mar 1, 2015
Shanghai 2,190 8.4% Apr 1, 2016
Shenzhen 2,030 12.3% Mar 1, 2015
Sichuan 1,500 7.1% Jul 1, 2015
Tianjin 1,950 5.4% Jul 1, 2016
Tibet 1,400 16.7% Jan 1, 2015
Xinjiang Uyghur 1,670 12.9% Jul 1, 2015
Yunnan 1,570 10.6% Sep 1, 2015
Zhejiang 1,860 12.7% Nov 1, 2015
Source: Various China Statistical Bureaus
© 1995-2016 Copyright by CBX Software. All rights reserved.
7
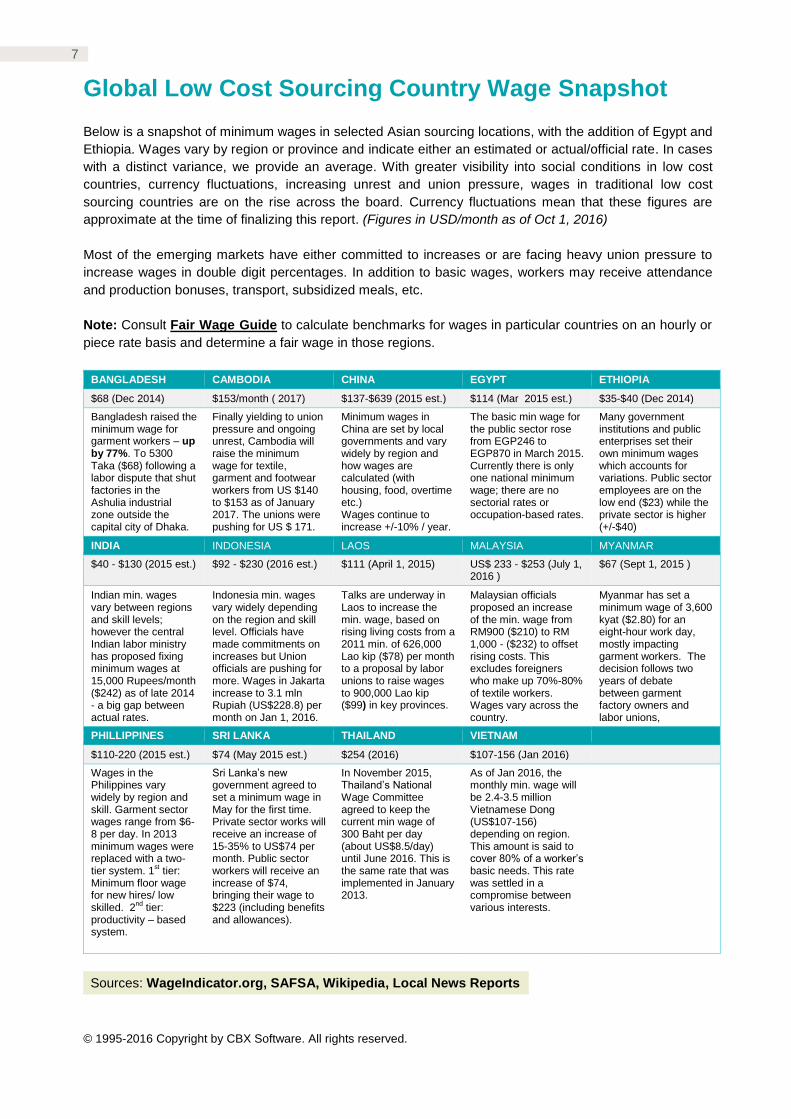
Global Low Cost Sourcing Country Wage Snapshot
Below is a snapshot of minimum wages in selected Asian sourcing locations, with the addition of Egypt and
Ethiopia. Wages vary by region or province and indicate either an estimated or actual/official rate. In cases
with a distinct variance, we provide an average. With greater visibility into social conditions in low cost
countries, currency fluctuations, increasing unrest and union pressure, wages in traditional low cost
sourcing countries are on the rise across the board. Currency fluctuations mean that these figures are
approximate at the time of finalizing this report. (Figures in USD/month as of Oct 1, 2016)
Most of the emerging markets have either committed to increases or are facing heavy union pressure to
increase wages in double digit percentages. In addition to basic wages, workers may receive attendance
and production bonuses, transport, subsidized meals, etc.
Note: Consult Fair Wage Guide to calculate benchmarks for wages in particular countries on an hourly or
piece rate basis and determine a fair wage in those regions.
BANGLADESH CAMBODIA CHINA EGYPT ETHIOPIA
$68 (Dec 2014) $153/month ( 2017) $137-$639 (2015 est.) $114 (Mar 2015 est.) $35-$40 (Dec 2014)
Bangladesh raised the minimum wage for garment workers – up by 77%. To 5300 Taka ($68) following a labor dispute that shut factories in the Ashulia industrial zone outside the capital city of Dhaka.
Finally yielding to union pressure and ongoing unrest, Cambodia will raise the minimum wage for textile, garment and footwear workers from US $140 to $153 as of January 2017. The unions were pushing for US $ 171.
Minimum wages in China are set by local governments and vary widely by region and how wages are calculated (with housing, food, overtime etc.) Wages continue to increase +/-10% / year.
The basic min wage for the public sector rose from EGP246 to EGP870 in March 2015. Currently there is only one national minimum wage; there are no sectorial rates or occupation-based rates.
Many government institutions and public enterprises set their own minimum wages which accounts for variations. Public sector employees are on the low end ($23) while the private sector is higher (+/-$40)
INDIA INDONESIA LAOS MALAYSIA MYANMAR
$40 - $130 (2015 est.) $92 - $230 (2016 est.) $111 (April 1, 2015) US$ 233 - $253 (July 1, 2016 )
$67 (Sept 1, 2015 )
Indian min. wages vary between regions and skill levels; however the central Indian labor ministry has proposed fixing minimum wages at 15,000 Rupees/month ($242) as of late 2014 - a big gap between actual rates.
Indonesia min. wages vary widely depending on the region and skill level. Officials have made commitments on increases but Union officials are pushing for more. Wages in Jakarta increase to 3.1 mln Rupiah (US$228.8) per month on Jan 1, 2016.
Talks are underway in Laos to increase the min. wage, based on rising living costs from a 2011 min. of 626,000 Lao kip ($78) per month to a proposal by labor unions to raise wages to 900,000 Lao kip ($99) in key provinces.
Malaysian officials proposed an increase of the min. wage from RM900 ($210) to RM 1,000 - ($232) to offset rising costs. This excludes foreigners who make up 70%-80% of textile workers. Wages vary across the country.
Myanmar has set a minimum wage of 3,600 kyat ($2.80) for an eight-hour work day, mostly impacting garment workers. The decision follows two years of debate between garment factory owners and labor unions,
PHILLIPPINES SRI LANKA THAILAND VIETNAM
$110-220 (2015 est.) $74 (May 2015 est.) $254 (2016) $107-156 (Jan 2016)
Wages in the Philippines vary widely by region and skill. Garment sector wages range from $6-8 per day. In 2013 minimum wages were replaced with a two-tier system. 1
st tier:
Minimum floor wage for new hires/ low skilled. 2
nd tier:
productivity – based system.
Sri Lanka’s new government agreed to set a minimum wage in May for the first time. Private sector works will receive an increase of 15-35% to US$74 per month. Public sector workers will receive an increase of $74, bringing their wage to $223 (including benefits and allowances).
In November 2015, Thailand’s National Wage Committee agreed to keep the current min wage of 300 Baht per day (about US$8.5/day) until June 2016. This is the same rate that was implemented in January 2013.
As of Jan 2016, the monthly min. wage will be 2.4-3.5 million Vietnamese Dong (US$107-156) depending on region. This amount is said to cover 80% of a worker’s basic needs. This rate was settled in a compromise between various interests.
Sources: WageIndicator.org, SAFSA, Wikipedia, Local News Reports

Q4 2016 Retail Sourcing Report
8 8
Container Freight Rates for Major Routes
The charts below are supplied by Xeneta, the leading global benchmarking and market intelligence
platform for containerized ocean freight. Data in the platform consists of 17+MN contracted rates for 60+K
port-port pairs, provided by global shippers and freight forwarders from SMBs to large enterprises in a
variety of industries. All indices are reported in USD per Twenty Foot Container (TEU). We report on
historical and forward looking rates for representative Asia-Europe and Asia-U.S. routes.
Analysis: The big recent news in container shipping is the failure of Hanjin shipping, the 7th largest
shipping company, which highlights the challenges of the global shipping trade. Ships and cargo were
stranded and delays in winter holiday cargo are expected. With ongoing overcapacity and global trade
slowing to a less than 2% increase, analysts report an uncertain outlook for the global shipping trade in the
next 12-18 months. Rates on key Asia-European trade lanes and Asia-North America trade lanes
increased through Q3, but most of these increases were driven by the carriers rather than the market.
Chart Source: www.xeneta.com
Hong Kong - Hamburg
Market Average (20’ Container) Jan 1, 2016 =US$776 Jun 30, 2016 = US$608
Shanghai - Antwerp
Market Average (20’ Container) Jan 1, 2016 =US$781 Jun 30, 2016 = US$650
Shanghai - Rotterdam
Market Average (20’ Container) Jan 1, 2016 =US$749 Jun 30, 2016 = US$626
Shanghai – Los Angeles
Market Average (20’ Container) Jan 1, 2016 =US$1,429 Sep 30, 2016 = US$1,209

© 1995-2016 Copyright by CBX Software. All rights reserved.
9
Currency Exchange Rates
Following are exchange rates and indicators for major currencies commonly factored into global sourcing costing estimations. Key monetary themes for the second half of 2016 are growth and policy divergency risks in the US and Eurozone economies. The US has seen strengthened economic activity going into Q4, which is resulting in some USD appreciation. Tighter monetary policy in the US contrasts with loose monetary policy in the Eurozone which should drive the Euro lower. The Chinese RMB has seen broad weakening through 2H 2016, based on a weaker economy, with some monetary easing. EUR / USD (6 month fluctuation)
EUR / RMB (6 month fluctuation)
USD / RMB (6 month fluctuation)
Sources: oanda.com, xe.com, News/Analyst Reports
The USD has made moderate gains on the EUR in Q3. Heading into Q4, the US economy has gained momentum with low borrowing costs and employment gains, in contrast to a sluggish Eurozone economy.
EUR/USD - Rate
2 years 1.27
1 year 1.11
6 months 1.14
3 months 1.10
30 days 1.12
Despite some Eurozone economic uncertainty, the Euro has continued to make gains against the RMB through Q3 and into Q4. The RMB’s inclusion in the IMF’s SDR basket took effect from October 1, 2016, impacting EUR/RMB rates to some extent.
EUR/RMB - Rate
2 years 7.81
1 year 7.17
6 months 7.36
3 months 7.39
30 days 7.46
Chinese GDP continues to decelerate gradually with some monetary easing to be implemented to offset the slowdown, which is impacting the currency against the USD. A relatively strong US economy is contributing to RMB weakness against the USD.
USD/RMB - Rate
2 years 6.13
1 year 6.34
6 months 6.46
3 months 6.68
30 days 6.67

Q4 2016 Retail Sourcing Report
10 10
Global Commodity Rates
Overall commodity prices have fallen around 6% since July. Low oil prices continue to be fueled by a
supply glut with OPEC countries trying to restrict production. Experts predict that oil supply will flatten
somewhat by early next year, driving higher oil prices by next summer. Metal prices strengthened on the
back of nickel and zinc strength. Cotton and fiber prices remained low based on strong supply levels and
weak demand from China and other markets.
Crude Oil
Rubber
Metal
20
40
60Oil US$ per barrel
DatedBrent,lightblend 38API
Dubai,medium, fobDubai Fateh32 API
West TexasIntermedia40 API,MidlandTexas
40
50
60
70
80
90
Rubber, Singapore Commodity Exchange, No. 3 Rubber Smoked Sheets, US cents per pound
0
1000
2000
3000
0
5000
10000
15000
20000
Metals US$ per metric ton
Tin Aluminum Iron Copper
Nickel Zinc Lead
Following a surge in rubber prices in Q3, prices flattened out somewhat. Positive signals are fueling reports that the natural rubber market may move into a deficit in Q4 and into 2017.
Low oil prices continued to be driven in part by a supply glut of roughly 1 million barrels per day. OPEC members are trying to manage the situation and have come up with a tentative agreement to regulate production volumes to 32.5-33.0 Mbpd. This cut would not happen until December.
Metals prices gained through Q3 and into Q4 partly through strong nickel and zinc prices. Copper prices have remained flat. Spot prices for hard choking coal, a key input for steel manufacturing peaked in September based on Beijing’s reduction in coal mine working hours.

© 1995-2016 Copyright by CBX Software. All rights reserved.
11
Wood
Wool, Hides, Cotton
Cotton prices trended lower late in Q3 due to an increase in world production, which is expected to keep prices down into 2017. Prices hit a 9 month high in July before stabilizing in August. China’s announcement that they are extending auctions of additional supply indicated a willingness to maintain price stability. Wool prices are expected to trend up based on strong demand and healthy supply, despite lower overall numbers of sheep.
0
100
200
300
400
500
600
700
800
900
1000
Wood US$ per cubic meter
Soft logs
Hard logs
Hard Sawn
Soft Sawn
850
900
950
1000
1050
1100
1150
Wool, Coarse, Australian Wool Exchange, US cents per kg
900
950
1000
1050
1100
1150
1200
Wool, fine, Australian Wool Exchange, US cents / kilogram
60
65
70
75
80
Hides, Heavy native steers, wholesale dealer's price, fob Shipping Point, US cents / pound
50
60
70
80
90
Cotton 'A Index', Middling 1-3/32 inch staple, CIF Liverpool, US cents / lb

Q4 2016 Retail Sourcing Report
12 12
Plastics and Fibers
A selection of plastic related prices is provided below. These are calculated from offer prices in the
Plasticker Material Exchange, which provide an indication of trends.
Analysis: Plastic and synthetic fiber prices trended down through the summer period partly due to a
seasonal slowdown but also due to low oil prices which is a key raw material. Softer demand from China is
also contributing to a trend of low prices.
Sources of above commodity prices: IMF data, Index Mundi, Plasticker
Quality Focus
This report frequently covers quality control and quality assurance issues. We sometimes partner with
industry experts who provide us with relevant data. For this issue we have relied on quality related
information from Asia Inspection (AI), a quality control and compliance service provider.
Key Quality KPIs
0.20
0.40
0.60
0.80
1.00
1.20
Plastics & Fibers, Regrind/ Flakes (Euros/kg)
Nylon
Polyester
ABS
PVC
PP
PS
© 1995-2016 Copyright by CBX Software. All rights reserved.
13
Quality Related News
Highlights from quality related news stories include increased pressure on Chinese manufacturing,
increased focus on electronics manufacturing and ongoing quality issues in Bangladesh.
China Faces Pressure from Asian Exporters
Recent AI figures show that India, Indonesia or Thailand all
outperformed China for inspections and audits by year-to-
date growth (with respective growths of +80%, +40% and
+14%). While EURATEX research shows that the increasing
pressure from SAARC and ASEAN countries is responsible
for the decline of China's market share in the EU imports of
clothing and textile, Chinese footwear manufacturers
perceive Vietnam as one of the biggest threats for their US
exports. AI data indicates Vietnam's footwear inspections
increased by 49% year-over-year.
China is still set on maintaining its leadership in other industries: AI figures show a strong upward trend in
demand for China inspections for such segments as electrical and electronic items (+18% in 2016 year-to-
date) and especially printing and packaging, where product inspections surged by 48%.
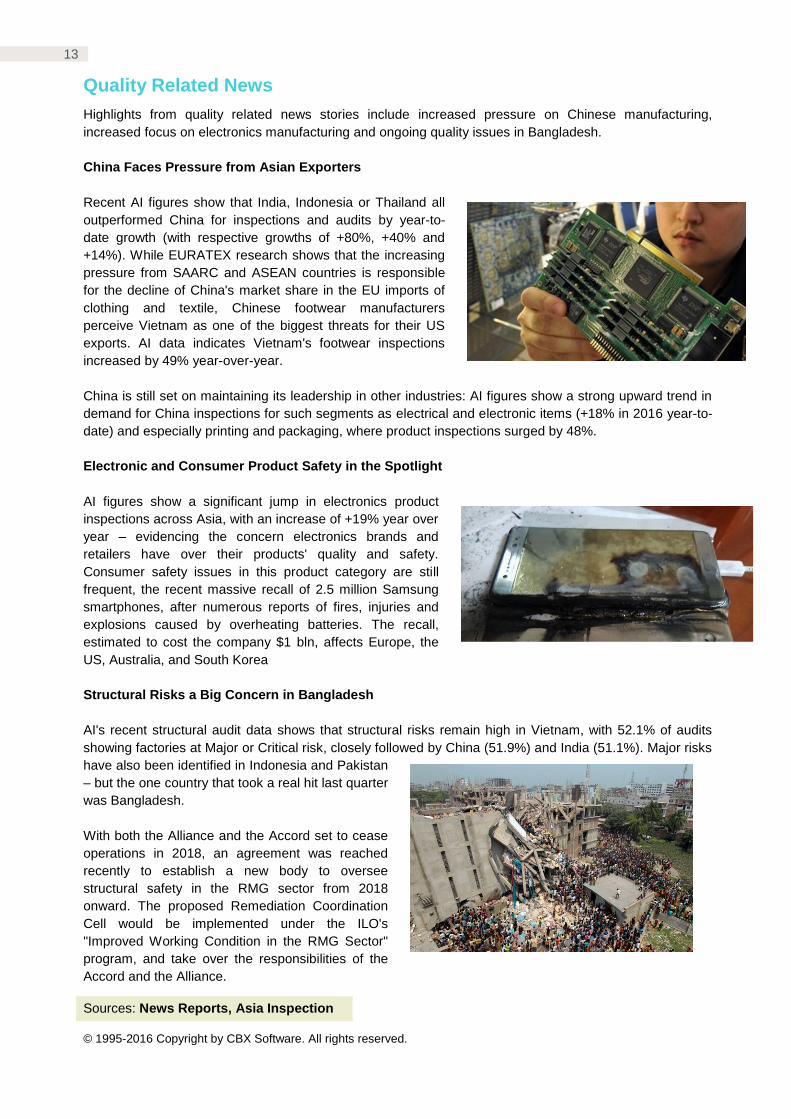
Electronic and Consumer Product Safety in the Spotlight
AI figures show a significant jump in electronics product
inspections across Asia, with an increase of +19% year over
year – evidencing the concern electronics brands and
retailers have over their products' quality and safety.
Consumer safety issues in this product category are still
frequent, the recent massive recall of 2.5 million Samsung
smartphones, after numerous reports of fires, injuries and
explosions caused by overheating batteries. The recall,
estimated to cost the company $1 bln, affects Europe, the
US, Australia, and South Korea
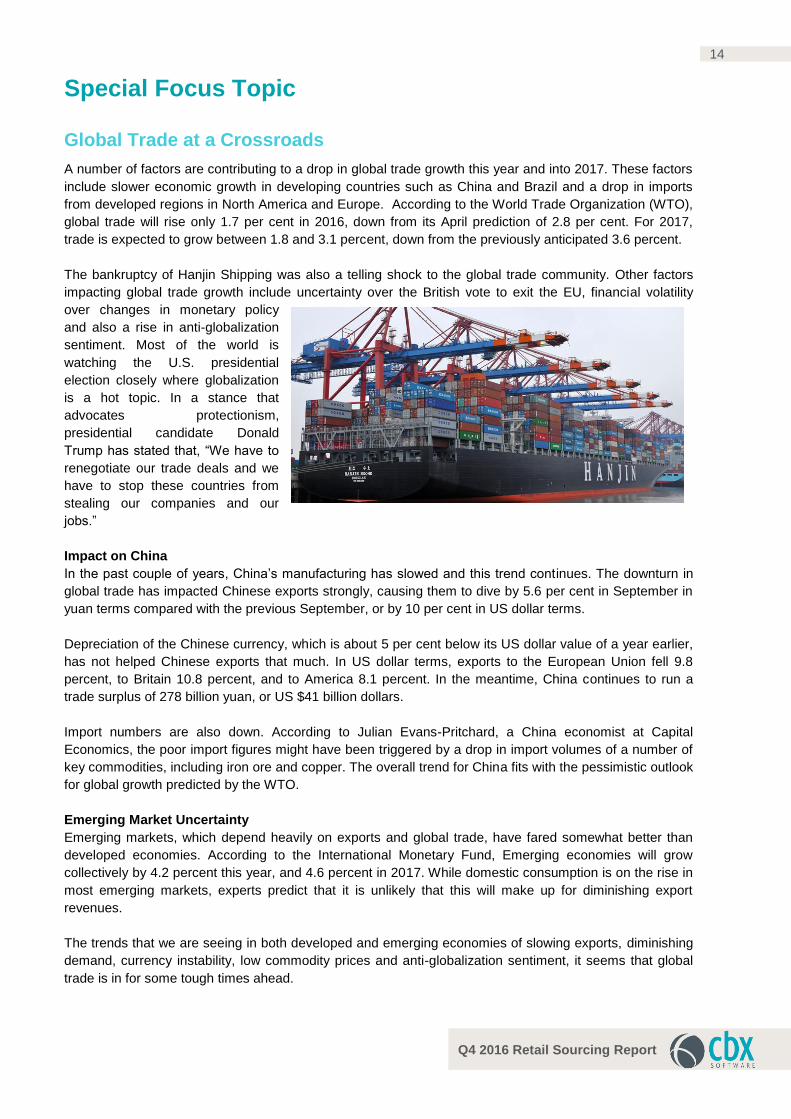
Structural Risks a Big Concern in Bangladesh
AI's recent structural audit data shows that structural risks remain high in Vietnam, with 52.1% of audits
showing factories at Major or Critical risk, closely followed by China (51.9%) and India (51.1%). Major risks
have also been identified in Indonesia and Pakistan
– but the one country that took a real hit last quarter
was Bangladesh.
With both the Alliance and the Accord set to cease
operations in 2018, an agreement was reached
recently to establish a new body to oversee
structural safety in the RMG sector from 2018
onward. The proposed Remediation Coordination
Cell would be implemented under the ILO's
"Improved Working Condition in the RMG Sector"
program, and take over the responsibilities of the
Accord and the Alliance.
Sources: News Reports, Asia Inspection
Q4 2016 Retail Sourcing Report
14 14
Special Focus Topic
Global Trade at a Crossroads
A number of factors are contributing to a drop in global trade growth this year and into 2017. These factors
include slower economic growth in developing countries such as China and Brazil and a drop in imports
from developed regions in North America and Europe. According to the World Trade Organization (WTO),
global trade will rise only 1.7 per cent in 2016, down from its April prediction of 2.8 per cent. For 2017,
trade is expected to grow between 1.8 and 3.1 percent, down from the previously anticipated 3.6 percent.
The bankruptcy of Hanjin Shipping was also a telling shock to the global trade community. Other factors
impacting global trade growth include uncertainty over the British vote to exit the EU, financial volatility
over changes in monetary policy
and also a rise in anti-globalization
sentiment. Most of the world is
watching the U.S. presidential
election closely where globalization
is a hot topic. In a stance that
advocates protectionism,
presidential candidate Donald
Trump has stated that, “We have to
renegotiate our trade deals and we
have to stop these countries from
stealing our companies and our
jobs.”
Impact on China
In the past couple of years, China’s manufacturing has slowed and this trend continues. The downturn in
global trade has impacted Chinese exports strongly, causing them to dive by 5.6 per cent in September in
yuan terms compared with the previous September, or by 10 per cent in US dollar terms.
Depreciation of the Chinese currency, which is about 5 per cent below its US dollar value of a year earlier,
has not helped Chinese exports that much. In US dollar terms, exports to the European Union fell 9.8
percent, to Britain 10.8 percent, and to America 8.1 percent. In the meantime, China continues to run a
trade surplus of 278 billion yuan, or US $41 billion dollars.
Import numbers are also down. According to Julian Evans-Pritchard, a China economist at Capital
Economics, the poor import figures might have been triggered by a drop in import volumes of a number of
key commodities, including iron ore and copper. The overall trend for China fits with the pessimistic outlook
for global growth predicted by the WTO.
Emerging Market Uncertainty
Emerging markets, which depend heavily on exports and global trade, have fared somewhat better than
developed economies. According to the International Monetary Fund, Emerging economies will grow
collectively by 4.2 percent this year, and 4.6 percent in 2017. While domestic consumption is on the rise in
most emerging markets, experts predict that it is unlikely that this will make up for diminishing export
revenues.
The trends that we are seeing in both developed and emerging economies of slowing exports, diminishing
demand, currency instability, low commodity prices and anti-globalization sentiment, it seems that global
trade is in for some tough times ahead.

© 1995-2016 Copyright by CBX Software. All rights reserved.
15
This exclusive event brings together over 100 sourcing executives at leading retailers and brands to learn and exchange ideas on the most pressing issues in retail global sourcing today.
Topics Include: Strategies for Optimizing your Sourcing Operations, Private Label Sourcing Done
Right, Effective Quality Control, Leveraging Technology for Global Sourcing and more.
Past Attendees Include: Alliance Boots, Berghaus, Dollar General, El Corte Ingles, Marks &
Spencer, MGB Metro, Pets at Home, Poundland, Target, Tchibo – and many more.
Register Now! (qualified attendees only)
About CBX Software
CBX Software has simplified the business of global sourcing; transforming traditional
methodologies into fast, friction free supply chains through our real-time cloud based Total
Sourcing Management Platform (TSM). We help retailers, brands and manufacturers manage
and empower the supply chain from plan to pay - one intelligent collaboration solution for an
enterprise to plan, spec, source, assure quality, order, make, inspect, ship and pay. Over 20,000
users in more than 30 countries rely on CBX, including: Target, Safeway, Kmart, Charming
Shoppes and others.
Americas +1.908.898.1880 Asia +852.2378.6300 EMEA +44.20.8133.0328
www.cbxsoftware.com
Click below to learn more about how CBX Software can help!
Request a Callback Request a Demonstration
Don’t miss the 9th Edition of CBX Global Sourcing Day
on November 17, 2016