Embed Size (px)
Citation preview

Retailer Pricing Strategies for Differentiated Products:
The Case of Bagged Salads and Lettuce
Selected Paper prepared for presentation at the American Agricultural Economics
Association Annual Meeting, Providence, Rhode Island, July 24-27, 2005
136487
Lan Li
Richard J. Sexton
Department of Agricultural and Resource Economics
University of California Davis
May 2005
Lan Li is a Ph.D. candidate and Richard J. Sexton is a professor in the Department of Agricultural and Resource Economics, University of California, Davis. Copyright 2005 by Lan Li and Richard J. Sexton. All rights reserved. Readers may make verbatim copies of this document for non-commercial purposes by any means, provided that this copyright notice appears on all such copies.
1
Contact Information: Lan Li: Email: [email protected] Richard J. Sexton: Email: [email protected] Mailing Address: Department of Agricultural and Resource Economics One Shields Avenue University of California, Davis Davis, CA 95616 U.S.A.

2
I Introduction
The food retail market is characterized by a large degree of price dispersion instead of the
“law of one price”. Empirical studies, such as Pesendorfer (2002), Sexton, Zhang, and
Chalfant (SZC, 2003), and Hosken and Reiffen (2004a, 2004b), document a remarkable
degree of cross-sectional price dispersion among food retailers within a SMSA and
intertemporal price variations for a given retailer. However, variations in retail prices
seem loosely related to changes in wholesale prices (MacDonald, 2000; Chevalier,
Kashyap, and Rossi, 2003; SZC, 2003; Hosken and Reiffen, 2004a, 2004b). The isolation
of retail price setting from cost factors is magnified by temporary price reductions, which
are a very important aspect of retail pricing (Hosken and Reiffen, 2004a). Empirical
evidence suggests that temporary price reductions mainly reflect changes in the retail
margins (i.e., sales) rather than changes in costs (MacDonald, 2000; Chevalier, Kashyap,
and Rossi, 2003; SZC, 2003; Hosken and Reiffen, 2004a, 2004b). Theories, such as those
developed by Salop and Stiglitz (1977, 1982), Varian (1980), Sobel (1984), Lal and
Matutes (1994), and Hosken and Reiffen (2001, 2004b), explain retail price dispersion
and the sale phenomenon as the result of retailers being able to price discriminate.
However, many important aspects of retail pricing still remain unexplained (Hosken and
Reiffen, 2004a).
The primary goal of this paper is to study retailer pricing behavior, in particular
temporary price reductions and sales, for differentiated products. It is a common
observation that only a small fraction of numerous goods carried by retailers are offered
at low “sale” prices each week, and those selected items tend to change from time to time.
Hosken and Reiffen (2004a) find that the typical grocery product has a “regular” price,

3
and that most deviations from the regular price are downward and short-lived. They also
show that temporary price reductions account for 20 to 50 percent of annual variations in
retail prices for most grocery items. Prior studies suggest that temporary price reductions
are attributable to retailer sale strategies, which result in decreases in margins rather than
decreases in costs (MacDonald, 2000; Chevalier, Kashyap, and Rossi, 2003; SZC, 2003;
Hosken and Reiffen, 2004a, 2004b). We define a sale as a special form of temporary
price reduction, when the retail margin for a product decreases when the retailer reduces
the product’s price. 1,2
In differentiated product markets, a product category usually comprises a number
of substitute subcategories and/or brands. Empirical evidence suggests that retailer
pricing behavior differs across brands within a product category (Agrawal, 1996; SZC,
2003; Hosken and Reiffen, 2004b). We study retailer pricing behavior for bagged salads.
Driven by consumers’ demand for convenience, variety, and quality, the bagged salad
market has become highly differentiated. The bagged salad market consists of four
subcategories, and three major national brands and private labels. Calvin et al. (2001)
report that 55 firms sold 197 bagged salad items in mainstream supermarkets in 1993,
with total sales of $197 million. In 1999, 54 firms sold 459 items, with sales of $1.3
billion. SZC (2003) show that retailers set prices of different brands differently for
iceberg-based bagged salads, and there is no evidence of coordination among retailers in
setting prices. Their empirical evidence also suggests a nearly complete absence of a
1 We define that sales occur only when retail prices decrease. This excludes the cases where the retail price of a product remains unchanged when its purchasing price increases, or where the increase in the retail price of a product is less than the increase in its purchasing price. 2 Studies, such as Hosken and Reiffen (2001, 2004a, 2004b) and Pesendorfer (2002), consider temporary price reductions the same as sales. They define that a temporary price reduction or a sale occurs when the retail price of a product is more than 10 or 20 percent off its regular price.

4
relationship between the farm-level price for iceberg lettuce and retail prices for iceberg-
based bagged salads.
Models, such as those developed by Lal and Matutes (1994), Agrawal (1996), Lal
and Villas-Boas (1998), and Hosken and Reiffen (2001, 2004b), explain the sale
phenomenon as the result of retailer strategic behavior (e.g., retailer strategies to price
discriminate). We draw empirical implications from various theories of retailer sale
strategies, in particular those for differentiated products, and trade practices in the bagged
salad market. One of the questions we will analyze is the extent to which temporary price
reductions are the result of changes in the retail margins, rather than changes in costs.
Factors that potentially explain temporary price reductions will be examined. In particular,
cost variations are distinguished from other factors associated with retailer sale strategies,
such as product popularity and retail competition. We look into the frequency and the
depth of temporary price reductions and sales using retailer scanner data provided by
Information Resource Inc. (IRI).
Prospective contributions of the present study are the following: First, most
empirical studies on retailer pricing behavior, such as Giulietti and Waterson (1997),
Chevalier, Kashyap, and Rossi (2003), and Hosken and Reiffen (2001, 2004a, 2004b),
have emphasized broad product categories. Retailer pricing behavior for differentiated
products, the focus of the present study, has heretofore received little attention. Second,
although various studies have reached the conclusion that temporary price reductions and
sales are important aspects of retailer pricing behavior, few have formally modeled
retailers’ decisions on temporary price reductions and/or sales. Third, retailer pricing
behavior for storable goods has been widely analyzed, but behavior for perishable

5
products has been little explored, and understanding retailer pricing strategies for these
products has particular interest to agricultural producers.
In the following section, we summarize empirical implications from various
theories of retailer sale strategies and trade practices in the bagged salad market. The
empirical framework is presented in section two, followed by discussion of the data in the
last section.
II Empirical Implications from Retailer Pricing Theories and Industry Trade
Practices
Attempts have been made in the marketing and economics literature to explain the sale
phenomenon. First, Lal and Matutes (1994) and Hosken and Reiffen (2004b) predict that
the products that are more popular are more likely to be on sale than other products. The
more popular products are interpreted as those with higher demands (Lal and Matutes,
1994; Chevalier, Kashyap, and Rossi, 2003; Hosken and Reiffen, 2004b). Lal and
Matutes (1994) develop a model to analyze the optimal pricing and advertising policies
by multiproduct retailers. They focus on the markets where demands for different
products are independent of each other but are linked through consumers’ one-stop
shopping. Lal and Matutes suggest that holding the number of advertised products fixed,
the items appealing to a broad range of consumers are more likely to be on sale and
advertised in order to attract consumers into the store. Hosken and Reiffen (2004b)
extend Lal and Matutes’ analysis by introducing three products, two of them substitutes,
and the third with demand independent of the other two. They define that the more
popular products are those with higher market shares. Hosken and Reiffen predict that
6
there should be considerable variations in the sale frequency within a group of substitute
products, and the more popular items are on sale more frequently. MacDonald (2000),
Chevalier, Kashyap, and Rossi (2003), and Hosken and Reiffen (2004b) study retailer
pricing behavior for broad product categories. They find that retail prices are lowest
during periods of peak demand, which supports Lal and Matutes’ prediction about the
positive relationship between product popularity and its probability of being on sale.
Hosken and Reiffen (2004b) further show that within a product category, the sale
probabilities for substitute products are positively correlated to the market shares of the
products.
Second, retail competition and retailers’ characteristics are potentially important
factors that influence retailers’ sale decisions. In the models of Lal and Matutes (1994)
and Hosken and Reiffen (2004b), retailers’ motivation to conduct sales and advertising is
that retailers compete with each other for consumers’ store patronage. Lal and Villas-
Boas (1998) study retailer price promotions and manufacturer trade deals in the markets
where retailers maximize profits of a product category that comprises multiple brands.
First, the model implies that competition between retailers is the fundamental driver for
retailer sale strategies. The model indicates that the primary goal of price reductions by
retailers is to attract consumers who travel around stores seeking the best deals (store
switchers) rather than consumers who switch between brands (brand switchers). Second,
the authors conclude that promotions across brands are not independent. When price
promotions are applied, promotions across brands can be either positively correlated, i.e.,
retailers conduct deep or light price promotions for all the brands in the category, or
negatively correlated, i.e., retailers always heavily promote one brand at one time. The

7
market structure determines the promotion pattern. 3 In the case where consumers’
shopping decision is dominated by choice in stores rather than choice in brands (i.e.,
there are no consumers who travel around stores to buy the preferred brand at the lowest
price), retailers cut price of one brand at one time, and the promoted brand is the lowest
priced brand. We can expect that this situation is plausible for bagged salads. Moreover,
Lal and Rao (1997) and Boatwright, Dhar, and Rossi (2004) suggest that retailers’
characteristics, such as Hi-Lo-Pricing or Every-Day-Low-Pricing store formats, are
important factors that explain retailer pricing strategies.
Third, substitution patterns between brands may affect retailers’ sale decisions.
Lal and Villas-Boas (1998) did not model the differences in brands (the brands in their
model are symmetric), e.g., the stronger brand that has a higher consumer loyalty requires
smaller discounts to attract the loyal consumers of the weaker brand to switch than the
weaker brand does (Raju, Srinivasan, and Lal, 1990; Agrawal, 1996). However, we can
expect that substitution patterns between brands, and/or the differences in the degree of
loyalty across brands could have an impact on retailers’ sale decisions. Agrawal (1996)
shows that a monopoly retailer promotes the stronger brand more often but provides a
smaller price discount for it compared to the weaker brand. In contrast, Lal and Villas-
Boas (1998) predict that retailers do not conduct price discounts in the absence of retail
competition. It is not easy to obtain an appropriate and consistent measurement for the
“strength” of different brands. Instead, we will study retailer pricing strategies for
national brands and private labels by assuming that national brands are stronger relative
to private labels. Narasimhan (1988), Raju, Srinivasan, and Lal (1990), Rao (1991), and
3 The market structure is determined by the relative sizes of the various market segments in terms of loyalty to manufacturers, retailers, or manufacturer-retailer pairs.

8
Agrawal (1996) predict that retailers are least motivated to conduct price promotions for
private labels and tend to keep them at stable low prices.
Fourth, demand and cost variations that potentially explain temporary price
reductions will be analyzed, in particular demand and supply seasonality and changes in
the farm-level prices for lettuce. Lettuce production and shipments are concentrated in
California and Arizona. Nearly all the lettuce consumed in the U.S. is produced
domestically. Nearly 97 percent of lettuce was produced in California and Arizona during
1992 and 1999 on average. All the leading bagged salad manufacturers have processing
plants in California. Further, California-based shippers constitute virtually the entire
population of lettuce shippers that supply the domestic U.S. market (Glaser, Thompson,
and Handy, 2001). Therefore, we can examine the effects of changes in lettuce prices at
the farm level on changes in the prices for lettuce and bagged salads at the retail level.
Further, we will investigate whether and how retailer pricing behavior varies for lettuce,
and national brands and private labels of bagged salads. Glaser, Thompson, and Handy
(2001) suggest that trade practices between shippers and retailers for bagged salads have
effectively muted the transmission of seasonal supply shocks from the farm level to the
retail level compared to lettuce. Moreover, the length and characteristics of marketing
channels differ between lettuce and bagged salads and between national brands and
private labels of bagged salads. These differences could influence retailer pricing
strategies for these products.

9
III Retailer Pricing Behavior for Bagged Salads and Lettuce
1. The data
Our empirical analysis is based on the retailer scanner data provided by Information
Resources Inc. (IRI) and the shipping-point price information available from the USDA
Federal-State Market News Service (F-SMNS). The retailer scanner data include weekly
data on varieties of head lettuce and bagged salads for twenty retail accounts in six U.S.
cities from January 1998 through December 1999. A retail account is defined as a
particular market-retailer combination, e.g., retailer 1 in Chicago. Bagged salads are
organized by universal product classification (UPC) codes, and head lettuce products are
recorded by price lookup (PLU) codes. For each account and each UPC or PLU code, IRI
provided weekly volume and dollar sales, retail prices, and the number of stores within
the chain selling the product in the city.
Bagged salads consist of traditional iceberg-based salads, various salad blends
featuring a combination of lettuce types, salad kits containing both fresh-cut salads and
salad dressing, and organic salads. Iceberg-based salads and salad blends are included in
our study.4 We analyze three major national brands—Dole, Fresh Express, and Ready
Pac, and private labels, which accounted for more than 90 percent of the market share in
1999 according to Calvin et al. (2001) and our data. An unbranded product, fresh cut
salads carried by two retail accounts, is considered. It accounted for over 70 percent of
stores sales. Lettuce, iceberg, romaine, red leaf and green leaf, are also included in our
analysis. Lettuce will provide helpful comparison, in that lettuce is relatively
4 Salad kits are not analyzed in the study for the following reasons. Products in the salad kit category changed frequently during the study period, which incurred series issues of missing values. Furthermore, product description of many UPC codes of salad kits are missing and cannot be found. Therefore, it is difficult to deal with such codes without basic information, such as size and ingredients.

10
homogenous and close to the raw agricultural product compared to bagged salads, and
trade practices between shippers and retailers and retailer pricing strategies are different
between lettuce and bagged salads (Glaser, Thompson, and Handy, 2001; SZC, 2003).
The weekly shipping point prices on varieties of lettuce are obtained from USDA
F-SMNS. Price information on five major varieties, iceberg, romaine, red lead, green leaf,
and Boston lettuce, are used to capture the changes in retail purchasing costs. We do not
have information on purchasing prices at the retail level, which are confidential and may
differ across retailer due to the specific contracts between retailers and grower/shippers.
Glaser, Thompson, and Handy (2001) and crop profile information from the USDA
Regional IPM Centers Information System suggest that majority of lettuce are sold
through contracts rather than in terminal wholesale markets.5 In addition, lettuce is highly
perishable. It typically takes three to six days for lettuce to be harvested in the field to be
on shelves in supermarkets in the U.S. according the crop profiles. Shipping-point prices
represent open (spot) market sales by first handlers on product of generally good quality
and condition unless otherwise stated.6 The truck rates remained quite stable during the
study period according the information from USDA Agricultural Marketing Service
(AMS). Therefore, shipping-point price could capture changes in the retail purchasing
costs.
We construct shipping-point price series for each one of retail products in our
analysis. There are 49 UPC codes for bagged salads, and 4 PLU codes for lettuce. In
particular, the average shipping-point prices of lettuce are according to product
5 The crop profiles for varieties of lettuce are available from http://www.ipmcenters.org/cropprofiles. 6 Shipping-point prices may include promotional allowances or other incentives. No consideration is given to after-sale adjustments unless otherwise stated. Brokerage fees paid by the shipper are included in the price reported.

11
ingredients. California produces approximately 72 percent of the iceberg lettuce and 81
percent of leaf lettuce (including romaine, red leaf, green leaf, and Boston lettuce) grown
in U.S. California and Arizona account for approximately 98 percent of iceberg
production and 97 percent leaf lettuce production in U.S. Production in Arizona occurs
primarily between late December and early March, when production in California is low.
Arizona provides as much as 85 percent of the lettuce for U.S. markets during the winter
months. Thus, price information on lettuce shipped from Arizona is used during the
winter months, and price information on lettuce shipping from California is used during
the rest of the year. Particular timing differ across different varieties of lettuce.
2. Characteristics of retailer pricing behavior for bagged salads and lettuce
Table 1 reports the overview statistics of retail prices and shipping-point prices by
category and brand. Prices are measured by $/unit for bagged salads, and $/head for head
lettuce both at retail and shipping-point level. For iceberg-based bagged (IBB) salads,
mean prices for Dole and Fresh Express are close and at a higher level compared with
those for Ready Pack, private labels, and fresh-cut IBB salads. Retail prices for three
national brands vary to larger extent relative to those for private labels and fresh-cut IBB
salads. Fresh-cut IBB salads have the least variations in bagged salad category. Statistics
for fresh-cut IBB salads are similar to those for iceberg head lettuce. Retail prices of
salad blends for national brands are less variable than those for private labels. There are
more variations in retail prices for IBB salads than those for salad blends. Volume shares
of IBB salads account for 78 percent of bagged salads (salad kits are excluded) according
to our data. This may suggest that the price variability of IBB salads is attributable to
retailers’ sales strategies, i.e., putting production with high demand on sales to attract

12
customers into the store (Lal and Matutues, 1994; Hosken and Reiffen, 2001, 2004b).
Furthermore, retail prices for private label and fresh-cut IBB salads have a lower mean
and variance than those for national brands. This may support the prediction by
Narasimhan(1988), etc, which predicts that retailers would set price for private labels at
lower stable level.
Lettuce prices at the shipping point account only 15 to 27 percent of retail prices.
The four statistics of retail prices for lettuce and fresh-cut IBB salads are approximately
proportionate to the four statistics of shipping-point prices for lettuce. This may suggest
that retail prices for fresh-cut IBB salads and lettuce move with shipping-point prices for
lettuce.
Table 2 reports the number of observations within certain categories, the
percentage of observations at, above, and below the annual mode. It also reports the
number of observations that were above (below) annual modal price by 10 or 20 percent.
An annual mode is computed for every one UPC or PUL code carried by each retailer for
each year. Twenty-three to forty-five percent of time, retail prices for salads are at their
annual modes (expect for fresh-cut IBB salads, and private label salad blends. If retail
prices are away from their mode, they tend to go downward by 53 to 85 percent of time.
In particular, the variation that retail prices are off annual model prices by 20 percent,
accounts for 10 to 69 percent of annual retail price variation. On the contrary, shipping-
point prices are not at their annual prices most of the time. When they are away from the
annual modal prices, they changes to both directions more symmetrically. We define a
temporary price reduction occurs when retail price of a product is below it annual modal
price by at least 10 or 20 percent.

13
The last column of lower panel in table 2 reports the volume sales of each
category in total salad volume sales. Although lettuce has larger shares than bagged
salads, retail prices remain more stable than retail price for bagged salads. For IBB salads,
brands that have higher market shares tend to more temporary price reduction. However,
private labels with the smallest market shares of salad blends have the most frequent
temporary price reductions.
The patterns of temporary price reductions are further illustrated in Figure 1,
where four panels display histograms for retail price indices and shipping-point prices.
The definition of retail price indices is defined by the ratio of retail price over it annual
modal prices, followed by Hosken and Reiffen (2004a). The general information remains,
a) retail prices are at annual modal prices to a large extent, b) retail prices for bagged
salads have tendency to decrease, c) national brands engage in more price variations
(downward) in more popular product categories, while brands with smaller market shares
more likely to conduct price reductions for the less popular products.
The above discussion is based on product categories. Sexton, Zhang, and Chalfant
(2003) show that there is a large degree of retail price heterogeneity for IBB salads across
retailers within a market area. Table 3 reports summary statistics of retail prices for IBB
salads at UPC level and retail prices for lettuce in Los Angeles. The product category and
the market chosen represent the general pattern of retailer pricing behavior revealed for
other products and in other markets. First, retailers differentiate themselves via product
choice. Notice that none of the retailers have the same set of brands and product lines.
The means and standard deviations are close for the same product sold at different retail
accounts. Therefore, we further examine the correlations of the same price series
14
presented n table 3. Table 4 reports the correlations of retail prices between brands and
between retail stores, the correlations of retail prices between bagged salads, lettuce, and
the correlations between retail prices and shipping-point prices. The shaded numbers are
the correlations between retail prices of the products sold by the same retailer. The
bolded numbers are the correlations between retail prices of the same brand, or the same
size. Retail prices for bagged salads are less correlated with other prices series, such as
retail prices of other IBB product sold by the same retailer, retail prices of the same
product sold by other retailers, retail prices of the same brand or same size, lettuce prices,
and shipping-point prices. Surprisingly, sixteen out of twenty-six price correlations
between retail prices for bagged salad and shipping-point prices are negative. However,
in the lower panel of table 4, it shows that retail prices for lettuce are higher correlated
with each, and they are positively correlated with shipping-point prices to considerable
extent.
IV Empirical Models
We apply both a retailer pricing model and models for retailers’ sales decision to examine
both changes in mean levels of retail prices, and changes in variability of retail prices. A
retail pricing model is applied to examine how cost variations and common shocks affect
retail prices. Retailers’ decisions on temporary price reductions will be modeled in terms
of product choice (i.e., which product to offer a discount) and the depth of price discounts
(i.e., how much to discount). Sources that may explain retail price variability are
decomposed into one associated with retailer sale strategies and the other related to cost
variations.

15
1. A retailer pricing model
Let product i belong to subcategory s and brand b, and account a denote a city-chain pair,
e.g., Los Angeles-Albertsons. Retailer prices are postulated as a function of shipping-
point prices, seasonal shocks, unobserved retailer and city-specific characteristics, and
unobserved brand, categorical, or idiosyncratic product characteristics. A retailer pricing
model can be written as
(1) iattitiaiat wp εβααα ++++= ,2
where piat is the price of product i sold at retail account at week. Each retail account-
product combination comprises a price series. There are 375 price series in the sample,
and each one of them has more than 60 observations during 1998—1999 (104
observations in total). wi,t denotes the weekly shipping-point prices for corresponding
lettuce products and bagged salad items at the retail level. εiat is the error terms, which are
assumed to be heterskedastic with mean zero and different variance for each price series.
Further, we allow cluster at the market level and allow the error terms of price series with
in the same market area to be correlated. αs and βs are the parameters to be estimated. αa
is a vector of account fixed effects. αi is a vector of dummies for product at UPC level,
which can be decomposed to broader brand and subcategorical representation. αt is a
vector of time-related control variables including yearly, monthly, and holiday dummies.
16
We further examine the seasonal patterns of shipping-point prices by estimate
shipping point prices as a linear function of time-related dummy variables. This helps to
understand the seasonal patterns (if any) of retail prices.
2. Retailers’ choice for temporary price reductions
A logit model for the probability of temporary price reductions/sales is applied to analyze
retailers’ decisions on temporary price reductions/sales with respect to product choice.
Retailers’ decision on which product to offer a discount/sale fits naturally into discrete
choice models that describe decision makers’ choices among alternatives. Consider a
pooled estimation for the probability of temporary price reductions for all the retailers in
all the cities Account a’s decision on offering product i a temporary price reduction in
week t can be described by
(2) iatticityitiaiat eFOBPopularityI +++++= ,2,1 γγηηη
where Iiat equal to one indicates that account a conducts a price discount for product i in
week t, otherwise Iiat equal to zero. Popularityi,city denotes the market share of product i
in a given city. The market shares are calculated as the share of volume sales of product i
with respective to volume sales of salads including bagged salads and lettuce for each
quarter. The original measurements are units, i.e., bags for bagged salads, and heads for
lettuce at both retail and shipping-point levels. Unit sales are converted to volume sales
by pounds according to the product description for bagged salads, and according to
packing rules (data description) for lettuce by USDA –SMNS. The error term has the
same structure assumed in the retailer pricing model, except that we assume its
distribution is extreme value by logit.
The following discussion is applied for both retailer pricing models and the model

17
for retailers’ sales decision. First, consider retailers’ decisions on temporary price
reductions in response to demand and cost variations. Seasonality is introduced by
monthly and holiday dummies to account for seasonal demand and supply shocks. The
farm-level prices for lettuce and their lags are also included, considering the possible
lagged response of retail prices to changes in the farm-level prices. If temporary price
reductions reflect changes in costs, or changes in the farm-level prices effectively pass
through to retailers, we expect β3 to be negative implying the probability of temporary
price reductions is higher when the farm-level prices for lettuce are lower. Otherwise, we
suggest that temporary price reductions do not reflect decreases in costs.
Second, if the sale probability is positively correlated to product popularity as
predicted by Lal and Matutes (1994) and Hosken and Reiffen (2004b), we expect
monthly dummies in summer and holiday dummies to be positive.7 Sales comprise a
subset of temporary price reductions. Therefore, the probability of temporary price
reductions is higher when the sale probability is higher. If the probability of temporary
price reductions is not related to cost variations, and it is higher during periods of peak
demand, we suggest that temporary price reductions reflect changes in the retail margins,
i.e., retailer sale strategies, rather than changes in costs.
Third, a second regression can be conducted to estimate group-specific β3 for
lettuce (β3,l), and private labels (β3,p) and national brands (β3,n) of bagged salads by
leaving out a brand specialized in organic salads (Earthbound Farm). If β3,l and/or β3,p are
negative, and β3,n is not significant different from zero; or if all of the three parameters
are negative, and β3,l and/or β3,p are significantly larger in absolute value terms than β3,n,
7 Demands for bagged salads were high during May and September, and peaked in May and/or August in five of the six cities according to our data.
18
we suggest that changes in the farm-level prices for lettuce contribute more to temporary
price reductions for lettuce and/or private-labels of bagged salads than those for national
brands of bagged salads.
Further, we will look into other factors that explain temporary price reductions as
the result of retailer sale strategies. First, if a product’s sale probability is higher when the
product is more popular as predicated by Lal and Matutes (1994) and Hosken and Reiffen
(2004b), we expect β1 to be positive. Second, another regression will be applied to obtain
group-specific β1 for lettuce (β1,l), and private labels (β1,p) and national brands (β1,n) of
bagged salads. We expect β1,n to be positive, and the dummy variable for private labels to
be negative. Narasimhan (1988), Raju, Srinivasan, and Lal (1990), Rao (1991), and
Agrawal (1996) predict that retailers are least motivated to conduct price promotions for
private labels compared to national brands. Therefore, the unobserved characteristics of
private labels except for their market shares are expected to have negative effects on their
sale probability. Further, β1,l is expected to be positive and larger than β1,n, since lettuce is
more popular than bagged salads according to the data.8 Otherwise, we would expect that
other factors, such as the differences in product and market channel characteristics, might
explain the difference in retailer pricing strategies between lettuce and bagged salads.
The theoretical literature on price promotions [e.g., Varian (1980), Lal and
Matutes (1994), Lal and Villas-Boas (1998), and Hosken and Reiffen (2001, 2004b)]
emphasizes competition between retailers as the fundamental driver of sales. However,
these theories do not provide explicit implications for the relationship between the degree
of competitiveness in the retail market and the sale probability. Both the Herfinahl index
8 SZC (2003) find that retail prices for iceberg lettuce have smaller variance than retail prices for iceberg-based bagged salads, and some stores tend to maintain very stable lettuce prices.

19
and its squared term are included to capture the first- and second-order effects of retail
competition. Further, the chain size of each account and account fixed effects are
included to capture the observed and unobserved account characteristics. We expect the
coefficients of account characteristics to be significantly different from zero, implying
that retailers’ characteristics have significant effects on retailer pricing strategies.
3. Depth of temporary price reductions
Retailers’ decisions on temporary price reductions about how much to discount can be
evaluated by the following regression
iatiat vZP +=∆ 'θ , where riaiatiat PPP −=∆ (3)
Given product i is offered a temporary price reduction in week t, iatP∆ is the
difference between the retail price of product i at account a in week t ( iatP ), and its
regular price ( riaP ). Explanatory variables, Z, are similar to those included in the models
of retailers’ decisions on temporary price reductions/sales with respect to product choice.
θ denotes the parameters to be estimated.
V Results
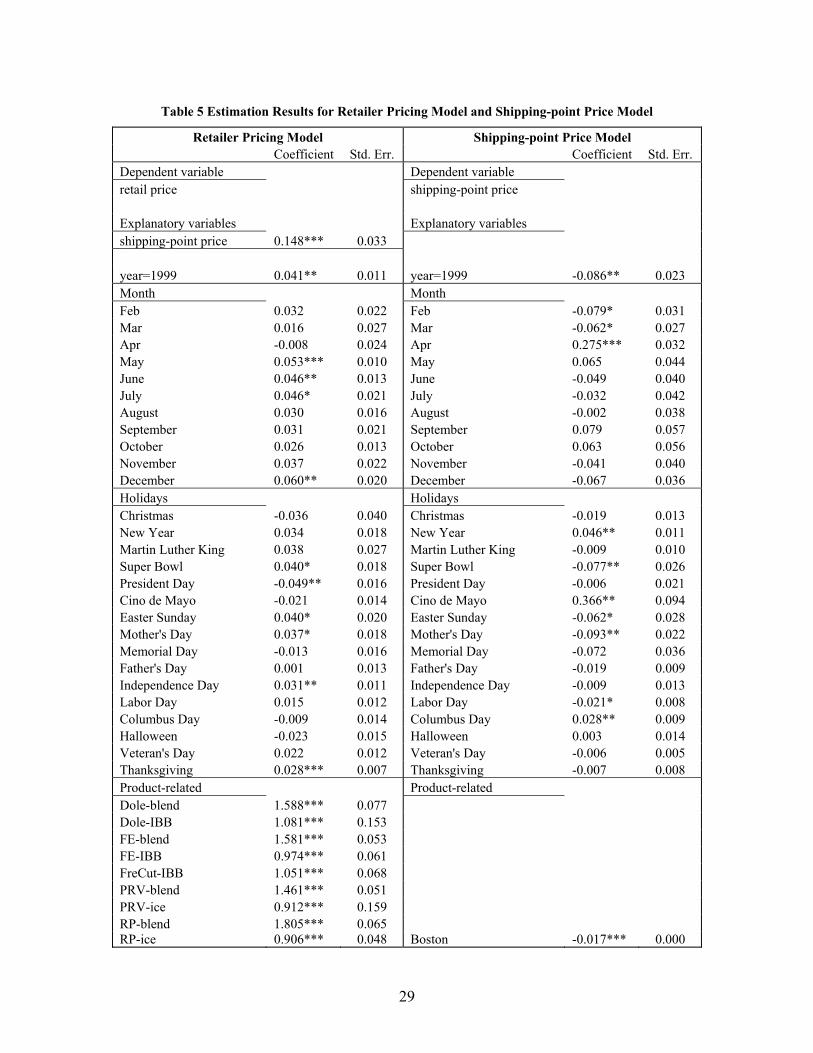
Table 5 reports the estimation results from retailer pricing model and shipping-point price
model. The models explain 58 percent of variations in retail prices, and 42 percent of
variations in shipping-point prices. Shipping-point prices explain 14.8 percent changes in
retail prices of salad products at 99 percent significance level. Compared to the base
month—January, retail prices of salad items are significantly higher during May and July,
and in December. However, shipping-point prices for lettuce are lower during the same
20
months except in May compared to shipping-point prices in January, although none of the
coefficients for these four months are statistically significant. On the other hand, retail
prices in February and March (April) are not significantly different from those in January,
although shipping-point prices are lower (higher) than those in January at 90 (99) percent
significance level. Therefore, the estimates suggest that retail prices either do not respond
to changes in shipping-point prices or move in the opposite direction of shipping-point
prices.
Estimated coefficients for six out of eighteen holiday and national events are
statistically significant, and five of them are positive. There are six holiday dummies
statistically significant in the shipping-point price estimation, and four of them are
negative. This may explained by the fact that these negative coefficients occur during the
production peak season. Hence, estimated coefficients for monthly and holiday dummy
variables do not support the predictions of Lal and Matutes (1994), Hosken and Reffein
(2001, 2004b), and are not consistent with findings by Chevalier, Kashyap, and Rossi,
(2003).
The category and brand characteristics show that IBB salads have significantly
lower mean than salad blends by pair-wise F tests. The omitted group is red leaf lettuce.
Retail prices are measured by $/bag. Since most salad blend items have smaller
sizes(mostly 5oz, 8oz, 12oz) than IBB salads (mostly 12 oz, 16 oz, 32 oz). The unit prices
for bagged salads are much higher than those for IBB salads when taking sizes into
consideration. Tests of joint equality of brand-category variables are rejected for both
IBB salads and salad blends (F(4, 5) = 614.64, p-value=0.000 for salad blends; F(4, 5) =
215.66, p-value=0.000 for IBB salads). Pair-wise tests for equality of retail prices of

21
private labels, Ready Pac, and fresh-cut IBB salads, which are lower compared to Dole
and Fresh Express, do not strong support the hypothesis that private label and/or fresh-cut
IBB salads have lower price levels than national brands.9
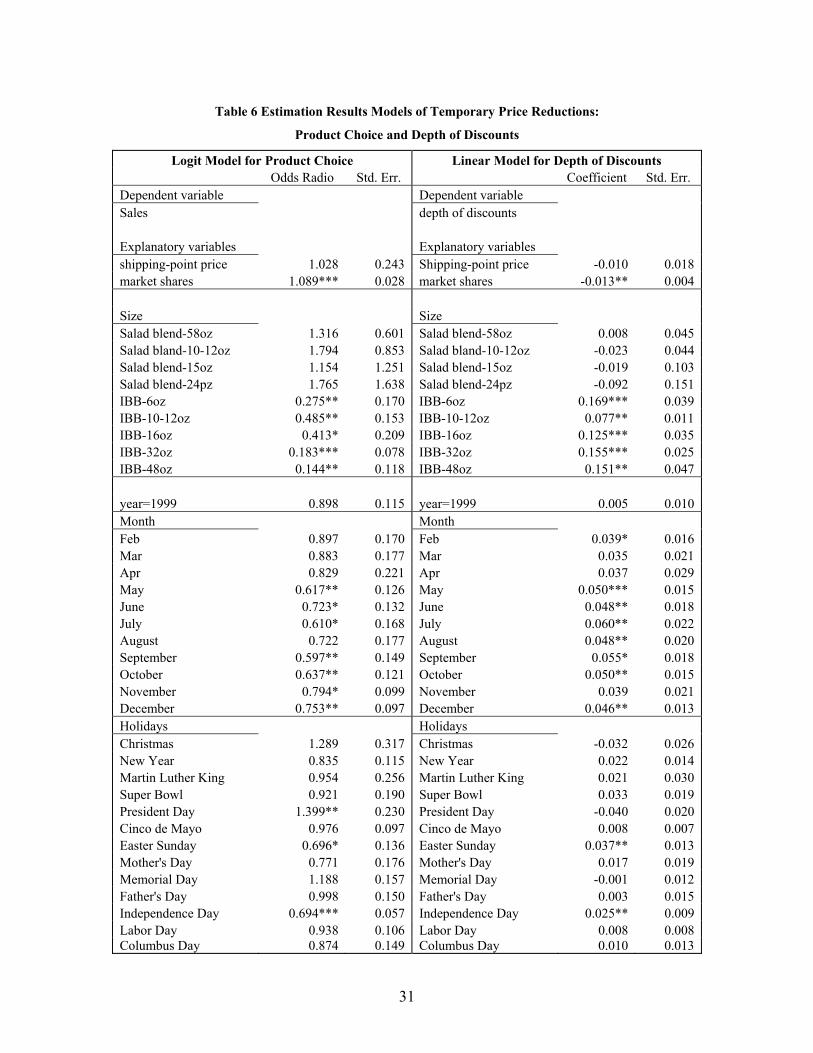
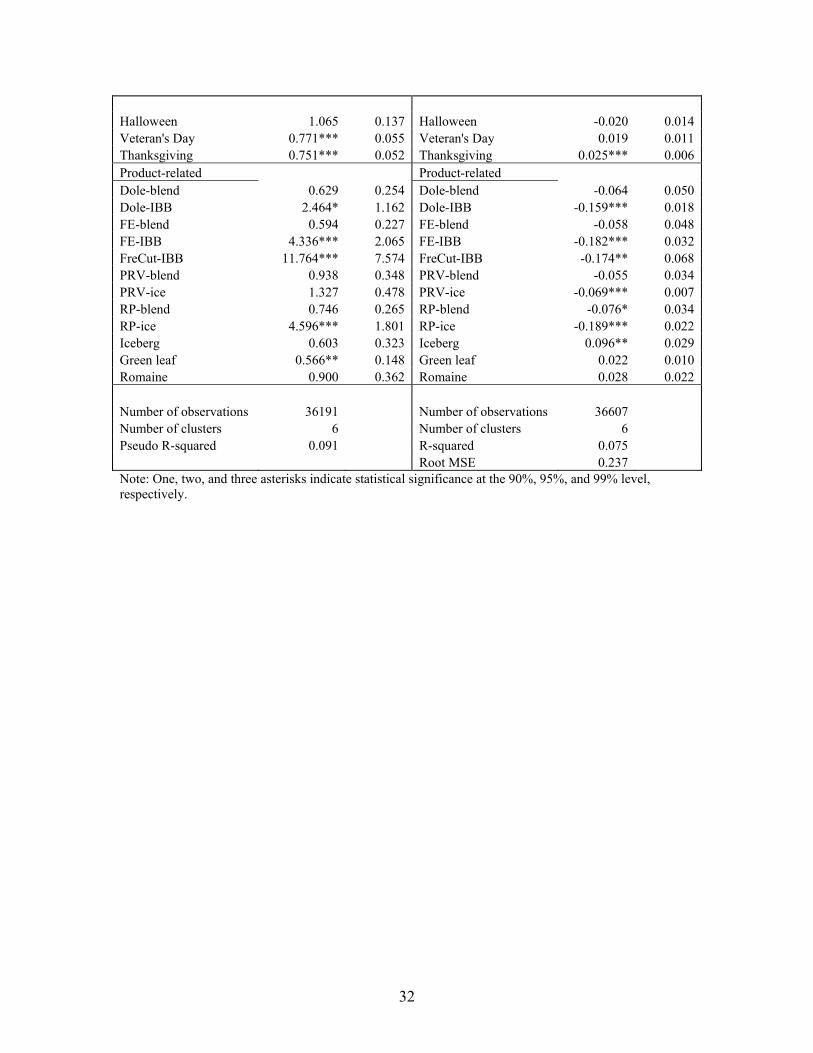
Table 6 reports estimation results for a Logit model for retailers’ sales decision on
product choice (on the left), and estimation results of a linear model for retailers’ sales
decision on the depth of discounts. In particular, odds ratio are reported for Logit
estimates. Shipping-point prices do not statistically significant effects on product choice
decision. However, once a product is chosen as a sale item, the discounts are lighter when
shipping-point prices are lower. Product popularity has statistically significantly
positively effects on retailers’ sales decision on product choice and statistically negative
effects on the extent of sales. In particular, 1.1 percent increase in market shares of a
product increases the probability of putting the product on sale by one percent.
The size of a salad blend item does not matter much to retailers’ sales decision,
since salad blend items are usually differentiated by their contents. However, the size of
IBB salads is an important factor explaining retailers’ sales decision. The most popular
sizes of IBB salads are medium-sizes, e.g., 12 oz and 16 oz IBB salad. The medium-size
IBB salads are more frequently on sales compared with other sized items, while with
mild price cuts. On contrary, IBB items with smaller or large sizes are put on sale less
often then medium-size IBB items, but they received large discounts once they are on
sale.
The probability of sales practices is higher during May and July, September to
December. Furthermore, sales during these months are also accompanied by deeper
9 Test results are: Ready Pac vs. private label: F( 1, 5)= 0.01, p-value=0.929; Ready Pac vs. fresh-cut: F(1,5)=12.76, p-value=0.0001; private label vs. fresh-cut: F(1,5) =0.81, p-value= 0.409.

22
discounts. Recall that retail prices are significantly higher during the May and July in our
retailer pricing model. This suggests that retailers may response to decrease in purchasing
prices of lettuce during seasonal production peaks by increase price variability via sales
practice, rather than adjust mean levels of retail prices. President Day, Veteran’s Day,
Easter Sunday, Independence Day, and Thanksgiving Day are associated with
significantly higher sales probability of salad items, the latter three holidays also receive
significantly larger discounts.
The IBB salad items are more likely to be on sales for all brands compared to
salad blend items, although the depth of discounts is smaller. On the other hand, iceberg
lettuce that has the largest shares of salad sales, is not more likely to be the sale item. If
iceberg lettuce is on sales, the price cuts are significantly higher.
Although there are many interesting empirical findings in the logit model for
retailers’ sales decision on product choice, the models only explains less than tenth (R-
squared is 0.091 for the Logit model, and is 0.075 for the linear model) of retailers’ sales
behavior in terms of product choice. There are more of retailers’ pricing behavior to be
understood.

23
Reference
Agrawal, Deepak (1996) “Effect of Brand Loyalty on Advertising and Trade Promotions: A Game Theoretic Analysis with Empirical Evidence,” Marketing Science, 15(1): 86-108.
Bliss, Christopher (1988) “A Theory of Retail Pricing,” Journal of Industrial Economics,
36(4): 375-391. Boatwright, Peter; Sanjay Dhar; and Peter Rossi (2004) “The Role of Retail Competition
and Account Retail Strategy as Drivers of Promotional Sensitivity,” Quantitative Marketing and Economics, 2(2): 169–190.
Calvin, Linda; and Roberta Cook et al. (2001) “U.S. Fresh Fruit and Vegetable
Marketing: Emerging Trade Practices, Trends, and Issues,” Economic Research Service, U.S. Department of Agriculture, Agricultural Economic Report No. 795.
Chevalier, Judith; Anil Kashyap; and Peter Rossi (2003) “Why Don’t Prices Rise During
Periods of Peak Demand? Evidence from Scanner Data,” American Economics Review, 93(1): 15-37.
Giulietti, Monica; and Michael Waterson (1997) “Multiproduct Firms’ Pricing Behavior
in the Italian Grocery Trade,” Review of Industrial Organization, 12(5-6): 817-832. Glaser, Lewrene; Gary Thompson; and Charles Handy (2001) “Recent Changes in
Marketing and Trade Practices in the U.S. Lettuce and Fresh-Cut Vegetable Industries,” Economic Research Service, U.S. Department of Agriculture, Agriculture Information Bulletin No. 767.
Hosken, Daniel; and David Reiffen (2001) “Multiproduct Retailers and the Sale
Phenomenon,” Agribusiness, 17(1): 115-137. Hosken, Daniel; and David Reiffen (2004a) “Patterns of Retail Price Variation,” The
RAND Journal of Economics, 35(1): 128-146. Hosken, Daniel; and David Reiffen (2004b) “How Retailers Determine Which Products
Should Go on Sale: Evidence from Store-Level Data,” Journal of Consumer Policy, 27(2): 141-177.
Lal, Rajiv; and Carmen Matutes (1994) “Retail Pricing and Advertising Strategies,”
Journal of Business, 67(3): 345-370. Lal, Rajiv; and Ram Rao (1997) “Supermarket Competition: The Case of Every Day Low
Pricing,” Marketing Science, 16(1): 60-80.

24
Lal, Rajiv; and Miguel Villas-Boas (1998) “Price Promotions and Trade Deals with Multiproduct Retailers,” Management Science, 44(7): 935-949.
MacDonald, James (2000) “Demand, Information, and Competition: Why Do Food
Prices Fall at Seasonal Demand Peaks?” Journal of Industrial Economics, 48 (1): 27-45.
Narasimhan, Chakravarthi (1988) “Competitive Promotional Strategies,” Journal of
Business, 61(4): 427-449. Pesendorfer, Martin (2002) “Retail Sales: A Study of Pricing Behavior in Supermarkets,”
Journal of Business, 75(1): 33-66. Raju, Jagmohan; V. Srinivasan; and Rajiv Lal (1990) “The Effects of Brand Loyalty on
Competitive Price Promotional Strategies,” Management Science, 36(3): 276-304. Rao, Ram (1991) “Pricing and Promotions in Asymmetric Duopolies,” Marketing
Science, 10(2): 131-144. Salop, Steven; and Joseph Stiglitz (1977) “Bargains and Ripoffs: A Model of
Monopolistically Competitive Price Dispersion,” Review of Economic Studies, 41(3): 493-510.
Salop, Steven; and Joseph Stiglitz (1982) “The Theory of Sales: A Simple Model of
Equilibrium Price Dispersion with Identical Agents,” American Economics Review, 72(5): 1121-1130.
Sexton, Richard; Mingxia Zhang; and James Chalfant (2003) “Grocery Retailer Behavior
in the Procurement and Sale of Perishable Fresh Produce Commodities,” Economic Research Service, U.S. Department of Agriculture, Contractors and Cooperators Report No. 2.
Sobel, Joel (1984) “The Timing of Sales,” Review of Economic Studies, 51(3): 353-368. Varian, Hal (1980) “A Model of Sales,” American Economic Review, 70(4): 651-659.

25
Table 1 Summary Statistics for Salad Retail Prices by Brand and Subcategories
(Prices are measured by $/unit for bagged salad, and $/head for lettuce) Subcategory Brand Mean St.d Range P75-P50 Bagged salads Iceberg-based salads Dole 2.19 0.72 3.18 1.00 Fresh Express 2.18 0.90 4.61 1.28 Ready Pac 2.01 0.89 3.40 1.20 Private Labels 2.00 0.62 2.26 1.10 Fresh-cut 2.03 0.22 1.11 0.31 Salad blends Dole 2.69 0.35 3.00 0.40 Fresh Express 2.79 0.37 3.02 0.30 Ready Pac 2.89 0.25 1.82 0.03 Private Labels 2.62 0.60 2.98 0.48 Lettuce Iceberg lettuce - 1.14 0.20 1.64 0.30 Leaf lettuce - 1.32 0.44 2.51 0.50 Shipping-point prices Iceberg lettuce - 0.24 0.11 0.54 0.10 Leaf lettuce - 0.20 0.20 1.47 0.20

26
Table 2 Price Variations of Bagged Salads and Lettuce
Percentage of observations Subcategory Brand # of obs =mode >mode <mode Bagged salads Iceberg-based salads Dole 3492 22.48 13.34 72.68 Fresh Express 4583 28.37 17.61 60.07 Ready Pac 1028 39.59 25.1 53.7 Private Labels 729 24.42 11.8 63.79 Fresh-cut 208 1.92 98.08 Salad blends Dole 7368 24.12 13.55 68.28 Fresh Express 7329 45.27 21.12 55.49 Ready Pac 3303 42.87 8.81 53.19 Private Labels 3027 13.02 6.44 85.73 Lettuce Iceberg lettuce - 1556 20.57 36.44 42.99 Leaf lettuce - 4648 27.43 33.24 39.33 Shipping-point prices Iceberg lettuce - 104 5.77 30.77 63.46 Leaf lettuce - 416 10.58 47.6 41.83 >mode, by <mode, by volume Subcategory Brand 10% 20% 10% 20% shares Bagged salads Iceberg-based salads Dole 2.81 1.12 13.29 8.99 9.83 Fresh Express 5.96 3.82 18.39 10.3 6.74 Ready Pac 5.06 2.33 8.07 7.39 4.48 Private Labels 2.47 0.14 10.84 8.09 1.39 Fresh-cut 67.79 27.4 8.35 Salad blends Dole 6.73 5.48 13.44 8.47 2.09 Fresh Express 3.34 0.22 11.87 8.6 3.09 Ready Pac 1.48 11.35 7.69 2.11 Private Labels 0.56 20.48 10.11 1.36 Lettuce Iceberg lettuce - 15.17 11.25 16.58 8.8 38.37 Leaf lettuce - 17.04 11.79 11.81 7.12 22.06 Shipping-point prices Iceberg lettuce - 19.23 12.5 57.69 44.23 Leaf lettuce - 39.66 31.25 31.25 24.28 Note: Bagged salads and head lettuce are sold by units by retailers. We convert unit sales to volume sales measured by pounds according to production description and suggestions from crop profiles provided by USDA.

27
Table 3 Summary Statistics for Retail Prices in Los Angeles
(Prices are measured by $/unit for bagged salad, and $/head for lettuce) Brand subcategory measure mean St.d range p75-p59 Retailer 1 bagged salad Dole IBB 12oz/unit 1.81 0.27 1.05 0.40 Fresh-cut IBB 32oz/unit 2.08 0.17 0.82 0.27 lettuce iceberg head 1.08 0.23 1.64 0.18 romaine head 1.09 0.32 1.91 0.03 Retailer 2 bagged salad Dole IBB 12oz/unit 1.96 0.10 0.50 0.01 Dole IBB 16oz/unit 1.63 0.15 0.70 0.02 Dole IBB 32oz/unit 2.38 0.20 0.55 0.02 lettuce iceberg head 0.95 0.15 1.01 0.05 romaine head 1.02 0.19 1.29 0.02 Retailer 3 bagged salad Dole IBB 12oz/unit 2.02 0.15 0.72 0.00 Dole IBB 16oz/unit 1.58 0.11 0.40 0.20 Dole IBB 32oz/unit 2.69 0.01 0.12 0.00 Ready Pac IBB 12oz/unit 1.78 0.25 0.52 0.50 Ready Pac IBB 16oz/unit 1.59 0.10 0.40 0.20 Ready Pac IBB 32oz/unit 2.64 0.17 0.71 0.01 lettuce iceberg head 1.03 0.18 0.97 0.03 romaine head 1.08 0.23 1.18 0.01 Retailer 4 bagged salad Ready Pac IBB 16oz/unit 1.63 0.12 0.78 0.20 Ready Pac IBB 32oz/unit 2.67 0.12 0.79 0.00 lettuce iceberg head 1.03 0.20 0.93 0.02 romaine head 1.07 0.27 1.70 0.06 Shipping-point iceberg head 0.24 0.11 0.54 0.10 romaine head 0.28 0.21 1.37 0.14

28
Table 4 Price Correlations in Los Angeles
Retailer Ret. 1 Ret. 2 Ret. 3 Ret. 4 Brand Dole FreCut Dole Dole Dole Dole Dole Dole RP RP RP RP RP Size 12 32 12 16 32 12 16 32 12 16 32 16 32 1-DO-12 1.00 1-FC-32 0.31 1.00 2-DO-12 0.05 -0.02 1.00 2-DO-16 0.19 0.03 0.80 1.00 2-DO-32 0.37 0.21 0.23 0.43 1.00 3-DO -12 0.15 -0.12 0.08 0.06 -0.18 1.00 3- DO -16 0.26 0.17 0.09 0.25 0.51 -0.28 1.00 3- DO -32 0.09 -0.08 -0.10 -0.11 -0.17 0.10 -0.08 1.00 3-RP-12 -0.08 -0.18 -0.03 -0.25 -0.45 0.25 -0.78 0.04 1.00 3-RP-16 0.25 0.21 0.11 0.28 0.56 -0.31 0.94 -0.12 -0.80 1.00 3-RP-32 0.21 0.09 -0.07 -0.05 -0.14 0.07 0.14 -0.03 -0.23 0.16 1.00 4-RP-16 0.19 0.08 0.07 0.24 0.64 -0.17 0.34 -0.03 -0.25 0.37 -0.14 1.00 4-RP-32 -0.16 0.04 -0.02 -0.09 -0.22 0.06 -0.28 -0.02 0.29 -0.27 -0.04 -0.19 1.00 1-iceberg -0.10 0.02 0.04 -0.01 -0.36 -0.08 -0.46 0.01 0.24 -0.34 0.10 -0.33 0.10 1-romaine -0.17 -0.11 -0.13 -0.14 -0.50 0.32 -0.42 0.15 0.34 -0.39 0.13 -0.37 0.08 2-iceberg -0.05 0.19 -0.12 -0.01 -0.23 -0.12 -0.21 0.01 0.13 -0.07 0.10 -0.21 0.10 2-romaine -0.14 0.10 -0.45 -0.23 -0.38 0.17 -0.31 0.08 0.23 -0.25 0.06 -0.34 0.06 3-iceberg -0.20 -0.04 -0.19 -0.16 -0.54 0.02 -0.42 0.09 0.30 -0.34 0.07 -0.41 0.14 3-romaine -0.27 -0.14 -0.19 -0.16 -0.65 0.28 -0.39 0.19 0.31 -0.41 0.12 -0.46 0.06 shipping-point iceberg -0.07 0.06 -0.11 -0.06 -0.21 -0.08 -0.31 -0.02 0.11 -0.29 0.12 -0.10 0.04 romaine -0.24 -0.09 -0.09 -0.07 -0.42 0.03 -0.19 0.12 0.06 -0.21 0.17 -0.25 0.00
Ret.1 Ret.2 Ret.3 shipping point iceberg romaine iceberg romaine iceberg romaine iceberg romaine lettuce 1-iceberg 1.00 1-romaine 0.65 1.00 2-iceberg 0.60 0.62 1.00 2-romaine 0.53 0.70 0.75 1.00 3-iceberg 0.76 0.86 0.72 0.74 1.00 3-romaine 0.55 0.87 0.56 0.72 0.85 1.00 shipping-point iceberg 0.59 0.45 0.36 0.32 0.45 0.37 1.00 romaine 0.55 0.75 0.46 0.47 0.70 0.68 0.58 1.00
29
Table 5 Estimation Results for Retailer Pricing Model and Shipping-point Price Model
Retailer Pricing Model Shipping-point Price Model Coefficient Std. Err. Coefficient Std. Err.
Dependent variable Dependent variable retail price shipping-point price Explanatory variables Explanatory variables shipping-point price 0.148*** 0.033 year=1999 0.041** 0.011 year=1999 -0.086** 0.023 Month Month Feb 0.032 0.022 Feb -0.079* 0.031 Mar 0.016 0.027 Mar -0.062* 0.027 Apr -0.008 0.024 Apr 0.275*** 0.032 May 0.053*** 0.010 May 0.065 0.044 June 0.046** 0.013 June -0.049 0.040 July 0.046* 0.021 July -0.032 0.042 August 0.030 0.016 August -0.002 0.038 September 0.031 0.021 September 0.079 0.057 October 0.026 0.013 October 0.063 0.056 November 0.037 0.022 November -0.041 0.040 December 0.060** 0.020 December -0.067 0.036 Holidays Holidays Christmas -0.036 0.040 Christmas -0.019 0.013 New Year 0.034 0.018 New Year 0.046** 0.011 Martin Luther King 0.038 0.027 Martin Luther King -0.009 0.010 Super Bowl 0.040* 0.018 Super Bowl -0.077** 0.026 President Day -0.049** 0.016 President Day -0.006 0.021 Cino de Mayo -0.021 0.014 Cino de Mayo 0.366** 0.094 Easter Sunday 0.040* 0.020 Easter Sunday -0.062* 0.028 Mother's Day 0.037* 0.018 Mother's Day -0.093** 0.022 Memorial Day -0.013 0.016 Memorial Day -0.072 0.036 Father's Day 0.001 0.013 Father's Day -0.019 0.009 Independence Day 0.031** 0.011 Independence Day -0.009 0.013 Labor Day 0.015 0.012 Labor Day -0.021* 0.008 Columbus Day -0.009 0.014 Columbus Day 0.028** 0.009 Halloween -0.023 0.015 Halloween 0.003 0.014 Veteran's Day 0.022 0.012 Veteran's Day -0.006 0.005 Thanksgiving 0.028*** 0.007 Thanksgiving -0.007 0.008 Product-related Product-related Dole-blend 1.588*** 0.077 Dole-IBB 1.081*** 0.153 FE-blend 1.581*** 0.053 FE-IBB 0.974*** 0.061 FreCut-IBB 1.051*** 0.068 PRV-blend 1.461*** 0.051 PRV-ice 0.912*** 0.159 RP-blend 1.805*** 0.065 RP-ice 0.906*** 0.048 Boston -0.017*** 0.000
30
iceberg -0.096* 0.046 iceberg -0.045*** 0.000 romaine 0.016 0.016 romaine omitted green leaf -0.002 0.001 green leaf -0.021*** 0.000 red leaf Omitted red leaf -0.034*** 0.000 constant 1.188*** 0.078 constant 0.312 0.044 Number of observations 36607 Number of observations 520 Number of clusters 6 Number of clusters 5 R-squared 0.583 R-squared 0.417 Root MSE 0.508 Root MSE 0.138 Note: One, two, and three asterisks indicate statistical significance at the 90%, 95%, and 99% level, respectively.
31
Table 6 Estimation Results Models of Temporary Price Reductions:
Product Choice and Depth of Discounts
Logit Model for Product Choice Linear Model for Depth of Discounts Odds Radio Std. Err. Coefficient Std. Err.
Dependent variable Dependent variable Sales depth of discounts Explanatory variables Explanatory variables shipping-point price 1.028 0.243 Shipping-point price -0.010 0.018 market shares 1.089*** 0.028 market shares -0.013** 0.004 Size Size Salad blend-58oz 1.316 0.601 Salad blend-58oz 0.008 0.045 Salad bland-10-12oz 1.794 0.853 Salad bland-10-12oz -0.023 0.044 Salad blend-15oz 1.154 1.251 Salad blend-15oz -0.019 0.103 Salad blend-24pz 1.765 1.638 Salad blend-24pz -0.092 0.151 IBB-6oz 0.275** 0.170 IBB-6oz 0.169*** 0.039 IBB-10-12oz 0.485** 0.153 IBB-10-12oz 0.077** 0.011 IBB-16oz 0.413* 0.209 IBB-16oz 0.125*** 0.035 IBB-32oz 0.183*** 0.078 IBB-32oz 0.155*** 0.025 IBB-48oz 0.144** 0.118 IBB-48oz 0.151** 0.047 year=1999 0.898 0.115 year=1999 0.005 0.010 Month Month Feb 0.897 0.170 Feb 0.039* 0.016 Mar 0.883 0.177 Mar 0.035 0.021 Apr 0.829 0.221 Apr 0.037 0.029 May 0.617** 0.126 May 0.050*** 0.015 June 0.723* 0.132 June 0.048** 0.018 July 0.610* 0.168 July 0.060** 0.022 August 0.722 0.177 August 0.048** 0.020 September 0.597** 0.149 September 0.055* 0.018 October 0.637** 0.121 October 0.050** 0.015 November 0.794* 0.099 November 0.039 0.021 December 0.753** 0.097 December 0.046** 0.013 Holidays Holidays Christmas 1.289 0.317 Christmas -0.032 0.026 New Year 0.835 0.115 New Year 0.022 0.014 Martin Luther King 0.954 0.256 Martin Luther King 0.021 0.030 Super Bowl 0.921 0.190 Super Bowl 0.033 0.019 President Day 1.399** 0.230 President Day -0.040 0.020 Cinco de Mayo 0.976 0.097 Cinco de Mayo 0.008 0.007 Easter Sunday 0.696* 0.136 Easter Sunday 0.037** 0.013 Mother's Day 0.771 0.176 Mother's Day 0.017 0.019 Memorial Day 1.188 0.157 Memorial Day -0.001 0.012 Father's Day 0.998 0.150 Father's Day 0.003 0.015 Independence Day 0.694*** 0.057 Independence Day 0.025** 0.009 Labor Day 0.938 0.106 Labor Day 0.008 0.008 Columbus Day 0.874 0.149 Columbus Day 0.010 0.013
32
Halloween 1.065 0.137 Halloween -0.020 0.014 Veteran's Day 0.771*** 0.055 Veteran's Day 0.019 0.011 Thanksgiving 0.751*** 0.052 Thanksgiving 0.025*** 0.006 Product-related Product-related Dole-blend 0.629 0.254 Dole-blend -0.064 0.050 Dole-IBB 2.464* 1.162 Dole-IBB -0.159*** 0.018 FE-blend 0.594 0.227 FE-blend -0.058 0.048 FE-IBB 4.336*** 2.065 FE-IBB -0.182*** 0.032 FreCut-IBB 11.764*** 7.574 FreCut-IBB -0.174** 0.068 PRV-blend 0.938 0.348 PRV-blend -0.055 0.034 PRV-ice 1.327 0.478 PRV-ice -0.069*** 0.007 RP-blend 0.746 0.265 RP-blend -0.076* 0.034 RP-ice 4.596*** 1.801 RP-ice -0.189*** 0.022 Iceberg 0.603 0.323 Iceberg 0.096** 0.029 Green leaf 0.566** 0.148 Green leaf 0.022 0.010 Romaine 0.900 0.362 Romaine 0.028 0.022 Number of observations 36191 Number of observations 36607 Number of clusters 6 Number of clusters 6 Pseudo R-squared 0.091 R-squared 0.075 Root MSE 0.237 Note: One, two, and three asterisks indicate statistical significance at the 90%, 95%, and 99% level, respectively.

33
Figure 1 Histograms for Retail Price Indices and Shipping-point Prices
Panel (a) Iceberg-based bagged salads
Dole Fresh Express
010
2030
Den
sity
0.40 0.60 0.80 1.00 1.20 1.40Price Index
05
1015
2025
Den
sity
0.50 1.00 1.50 2.00Price Index
Ready Pac Private Labels
020
4060
Den
sity
0.40 0.60 0.80 1.00 1.20 1.40Price Index
010
2030
4050
Den
sity
0.40 0.60 0.80 1.00 1.20 1.40Price Index
Fresh Cut
02
46
8D
ensi
ty
0.50 0.60 0.70 0.80 0.90 1.00Price Index

34
Panel (b) Salad Blends
Dole Fresh Express
010
2030
Den
sity
0.00 0.50 1.00 1.50Price Index
010
2030
40D
ensi
ty
0.40 0.60 0.80 1.00 1.20Price Index
Ready Pac Private Labels
010
2030
4050
Den
sity
0.40 0.60 0.80 1.00 1.20Price Index
05
1015
2025
Den
sity
0.40 0.60 0.80 1.00 1.20Price Index

35
Panel (c) Lettuce at retail accounts
Head Lettuce Leaf Lettuce
05
1015
20D
ensi
ty
0.50 1.00 1.50 2.00Price Index
05
1015
Den
sity
0.50 1.00 1.50 2.00 2.50 3.00Price Index
Panel (d) Shipping-point price for lettuce
Head Lettuce Leaf Lettuce
0.5
11.
52
Den
sity
0.00 0.50 1.00 1.50 2.00 2.50Price Index
0.5
11.
52
Den
sity
0.00 2.00 4.00 6.00 8.00Price Index


![Pricing and advertising decisions in a dominant-retailer ...scientiairanica.sharif.edu/article_4535_722999d93fa822a...decisions of all the channel members. Mokhlesian and Zegordi [21]](https://img.pdfslide.net/doc/110x75/5fe4d72f511cff43b50bdd14/pricing-and-advertising-decisions-in-a-dominant-retailer-decisions-of-all.jpg)