Embed Size (px)
Citation preview

Institut de Recerca en Economia Aplicada Regional i Pública Document de Treball 2016/09 1/25 pág.
Research Institute of Applied Economics Working Paper 2016/09 1/25 pág.
“Retaking a course in Economics: Innovative methodologies to simulate academic performance in large groups”
Abio G & Alcañiz M & Gómez-Puig M & Rubert G & Serrano M & Stoyanova A
& Vilalta-Bufí M
4
WEBSITE: www.ub.edu/irea/ • CONTACT: [email protected]
The Research Institute of Applied Economics (IREA) in Barcelona was founded in 2005, as a research
institute in applied economics. Three consolidated research groups make up the institute: AQR, RISK
and GiM, and a large number of members are involved in the Institute. IREA focuses on four priority
lines of investigation: (i) the quantitative study of regional and urban economic activity and analysis of
regional and local economic policies, (ii) study of public economic activity in markets, particularly in the
fields of empirical evaluation of privatization, the regulation and competition in the markets of public
services using state of industrial economy, (iii) risk analysis in finance and insurance, and (iv) the
development of micro and macro econometrics applied for the analysis of economic activity, particularly
for quantitative evaluation of public policies.
IREA Working Papers often represent preliminary work and are circulated to encourage discussion.
Citation of such a paper should account for its provisional character. For that reason, IREA Working
Papers may not be reproduced or distributed without the written consent of the author. A revised version
may be available directly from the author.
Any opinions expressed here are those of the author(s) and not those of IREA. Research published in
this series may include views on policy, but the institute itself takes no institutional policy positions.
Abstract
Students who have to retake courses at university are often not only low-
achieving, but also unmotivated and lacking self-confidence. These
problems may be accentuated in large groups of repeater students. In this
context, the implementation of new teaching approaches to cater for their
needs is a priority. This paper reports the experience of a teaching strategy
based on the implementation of flipped classroom, team-based learning, and
frequent testing methodologies in large groups of students retaking a
subject. The study was carried out during the academic years 2013/14 and
2014/15 at the Faculty of Economy and Business, University of Barcelona
(Spain). The results reflect a significant increase in the motivation and
academic performance of these students, and validate the application of this
strategy in large groups.
JEL classification: A20; A22
Keywords: Teaching innovation; flipped classroom; team based learning; frequent testing; large
groups; retake subjects; economics.
Gemma Abió: Department of Economics, Faculty of Economics and Business, University of Barcelona ,Spain. E-mail: [email protected]. Manuela Alcáñiz: Risckcenter Research group–IREA. Av. Diagonal 696; 08034 Barcelona ,Spain. E-mail: malcañ[email protected] Marta Gómez-Puig: Risckcenter Research group–IREA. Av. Diagonal 696; 08034 Barcelona ,Spain. E-mail: [email protected] Glòria Rubert: Department of Economics, Faculty of Economics and Business, University of Barcelona ,Spain. E-mail: [email protected] Mónica Serrano: Department of Economics, Faculty of Economics and Business, University of Barcelona ,Spain. E-mail: [email protected] Alexandrina Stoyanova: Department of Economics, Faculty of Economics and Business, University of Barcelona ,Spain. E-mail: [email protected] Montserrat Vilalta-Bufí: Department of Economics, Faculty of Economics and Business, University of Barcelona ,Spain. E-mail: [email protected] Acknowledgements
This paper is based upon work supported by the University of Barcelona under grant number 2014PID_UB/031.

1
1. Introduction
Since the adoption of innovative techniques which facilitate the engagement of students in
active learning, university teaching has frequently diverged from the traditional master class
schema. The introduction of these methodologies changes the focus of study and promotes
students’ active participation in the learning process. This is especially necessary in the case of
students with a history of poor academic performance – for example, students retaking a subject
on their degree.
Academic underperformance has significant costs. In addition to the monetary outlay required
to reenroll, it may have a psychological impact in the form of disappointment and avoidable
stress. There are social costs as well: public universities are partly financed by public resources,
and students’ achievements are the returns to this public investment. Therefore, developing
strategies to avoid failure is a desirable step, as is any policy aiming to increase teaching quality.
Some low-achieving students have a poor knowledge background which hampers their learning
process, while others lack the skills and learning habits required to perform successfully in
education (Kruger and Dunning, 1999; Pennebaker et al., 2013). So it is especially important
to design active learning techniques that also help low-achieving students to develop effective
learning habits.
Several accounts report larger gains in student learning when using more interactive class
formats than when using the traditional lectures. For instance, Deslauriers et al. (2011) show
that even when the master class was delivered by a highly regarded and expert professor, the
students’ benefits in terms of learning were lower than in a more interactive context, even when
the latter was led by a post-doctoral student with far less teaching experience. Baepler (2014)
showed that lecture time can be reduced with the introduction of active learning sessions
without worsening student results. Furthermore, Park and Choi (2014) performed an experiment
2
to prove the existence of “golden” and “shadow” zones in the classroom that discriminate
students’ learning experiences depending on their seating positions. They found that, unlike the
traditional classroom, the active learning classroom does not produce this positional
discrimination. Indeed, students perceive the environment as more inspirational, especially in
regard to active class participation, while students with higher academic achievement show a
greater tendency to share information and to create new ideas in an interactive classroom format
than in a traditional one.
In this context, Flipped Classroom (FC) and Team Based Learning (TBL) stand out as leading
active learning methodologies. FC is a pedagogical strategy that focuses on the importance of
the use of class time for the construction of knowledge rather than the transmission of
information. In this way, it reverses the traditional educational arrangement: students prepare
content and concepts before the class time, and the classroom is transformed into a dynamic
space where the instructor guides the students through an interactive learning environment. The
beginning of the FC can be traced to the 1990s (King, 1993; Mazur, 1997; Crouch and Mazur,
2001) and it became popular during the 2000s (Bergmann and Sams, 2012). Although many
experiences support the success of the FC (McLaughlin, 2013; Missildine et al., 2013; Wilson,
2013), the empirical evidence of its effectiveness remains limited. In general, studies highlight
the improved achievements of the students, their stronger participation, the improvement of
attitudes toward learning and teaching, and a greater satisfaction of teachers involved in the
model (Lage et al., 2000; Berrett, 2012; Strayer, 2012; Chung, 2014; and Prieto et al., 2014).
In the TBL methodology, master classes play a minor role and they are substituted by activities
devoted to interactions between small groups of students, who reinforce not only their
knowledge and learning processes (Nordberg, 2008; Shah, 2013; Opdecam et al., 2014), but
their interpersonal communication skills as well (Michaelsen et al., 2004). A “cooperative
learning” strategy, therefore, enhances the interconnection between students who, through their

3
involvement in a common project, achieve better academic performance (Yamarik, 2007),
increase their self-esteem, and foster their spirit of teamwork (Millis et al. 1998).
Besides these two active learning methodologies, another instrument that helps students to
develop their learning habits is Frequent Testing (FT). Roediger et al. (2011) discuss the
benefits of testing, which go beyond mere assessment. Quizzes allow students to identify the
gaps in their knowledge, provide professors with feedback on the learning progress and, most
importantly, improve learning. Pennebaker et al. (2013) identified some of the benefits of
frequent testing as their immediate feedback spillover to other concurrent and subsequent
subjects and an improvement in students’ learning habits. Moreover, within testing activities,
teamwork has shown to increase the engagement of students and to enhance the productive
learning behaviors of both low- and high-achieving students (Hong and Pham, 2013).
Although the idea to substitute lecture time by active learning activities was originally designed
for small groups, Jackson and Prosser (1989) already advocated the implementation of new
learning techniques in large groups. In fact, Knight and Wood (2005) found that introducing
student participation and cooperative problem-solving during class time in large biology groups
increases student performance. As yet, however, there is not much evidence of the benefits that
a more interactive classroom format may produce in groups with a large number of students.
In an attempt to fill this gap, this paper presents the results of our experience of implementing
these three methodologies – FC, TBL and FT – with students in the Groups of Intensive Study
(GIS) at the University of Barcelona, Spain. The GIS are special groups designed by the
university for students retaking a subject. These groups comprise more than 100 students who
are not only low-achieving students with a weak knowledge of the subject but are often
unmotivated and lacking self-confidence. In this context, the incorporation of the FC, TBL and
FT methodologies to motivate and organize students’ work at both individual and team level
has represented a breakthrough and has achieved with significant student learning gains.
4
The study was carried out during the academic years 2013/14 and 2014/15 in four subjects in
the Economics degree at the University of Barcelona (Spain): Microeconomics of the Business
Administration Bachelor Degree (BA); and Introduction to Economics, Microeconomics I, and
Microeconomics II of the Economics Bachelor Degree (ECO). The results show a significant
increase in the motivation and academic performance of these students and suggest that this
educational strategy may be helpful in the teaching of many other subjects.
The paper is organized as follows. In Section 2, we describe the context of the experience,
providing some institutional background and a detailed explanation of the GIS. Section 3
presents the methodology proposed for improving the academic achievements of GIS students.
Results are reported in section 4, which also includes the outcomes of a survey administered to
the participating students. Finally, section 5 concludes.
2. Background
2.1. The University of Barcelona
The University of Barcelona is one of Spain’s oldest universities. It was founded in 1450, and
today it is the largest university in the region of Catalonia (Spain), catering to the needs of more
than 45,000 undergraduate students and delivering a comprehensive range of higher education
courses. The Faculty of Economics and Business, the largest in Catalonia with around 10,000
students, offers undergraduate degrees in Economics, Business Administration, International
Business, Sociology, and Statistics. All the subjects on these degrees are taught in semesters
corresponding to 15 academic weeks. In all degrees, the learning load of each subject equates
to 6 European Credit Transfer System (ECTS) credits, a standard measure adopted by the
universities in the European Higher Education Area (for the student, one ECTS credit equates
to 25 hours of work). Regular groups are scheduled in the morning (from 8:30 to 13:30) or
afternoon/evening (from 16:30 to 21:00). For a regular subject of 150 hours, 60 hours are
5
devoted to face-to-face activities, 40 hours to supervised work, and 50 hours to independent
learning. Although the standard assessment system is based on continuous supervision of
learning progress, students always have the option of sitting only the final exam.
2.2. The Groups of Intensive Study (GIS)
As students retaking a subject already followed lectures the previous year, they usually attend
fewer classes than new enrolments. They are usually low-achieving students with poor study
habits and frustrating academic experiences. All these conditions may have a considerable
effect on their motivation and self-confidence, and thus have a negative impact on their
educational attainment.
In the 2011/12 academic year, the University of Barcelona introduced the GIS in order to
respond to these students’ needs. The main purposes were to encourage class attendance and to
improve learning performance. Like the regular groups, the GIS bear six ECTS credits.
However, there are fewer face-to-face educational activities: two hours per week instead of
four. This structure represents an increase in both the work supervised by the lecturer, who has
to prepare further materials for these groups, and in the autonomous learning required of the
student. GIS are scheduled in the midday slot (one day a week from 14:00 to 16:00) so that
retaking students can attend both GIS classes and those of the other subjects in the current
academic year that they take in a regular group. GIS were also designed to contain fewer on-
site activities in order to reduce the absenteeism rate.
At the beginning of the GIS program, the methodologies applied were similar to those of the
regular groups, but the lectures were given faster or the teacher explained only a part of the
subject’s contents. The assessment system was also similar to that of the other groups: that is,
students could choose between continuous or single assessments.
6
Despite the efforts, during the 2011/12 and 2012/13 academic years results were disappointing:
the attendance at face-to-face activities, the percentage of students who sat the exam and the
proportion of students who passed the course was usually lower than in the regular groups.
There were several possible reasons. First, the lecturer could hardly incentivize and evaluate
the autonomous learning if students did not participate in the face-to-face activities or decided
not to follow the continuous assessment system. Second, the GIS required the retaking students
to carry out large amounts of autonomous work. Another possible reason might also be related
to the characteristics of the students who enroll in the GIS. As these students had not passed the
course in the previous academic year, they are not a representative sample of the general
population of students and are more likely to have difficulties with their studies.
Our experience with these students showed that they might have a lower capacity for analysis
and synthesis, a lesser ability to organize their work and to manage time, and less motivation
to pass the subject. This led us to implement a new teaching strategy to better address these
students’ needs and to help them move ahead successfully.
3. Teaching strategy
To improve the learning performance of students in the GIS, we proposed a strategy based on
the joint implementation of the FC, TBL and FT methodologies. During the second semester of
2013/14 and throughout the 2014/15 academic year, we carried out a trial experiment in four
subjects – Microeconomics (BA), Introduction to Economics (ECO), Microeconomics I (ECO),
and Microeconomics II (ECO) – to test the results of these methodologies and to improve the
strategy design for future implementations.
The main goals of this methodology are, on the one hand, to stimulate students' autonomous
work before each session; and, on the other, to invigorate the sessions, creating an interactive
working environment in the classroom. As a result, a continuous and more efficient learning of

7
the subject and a better acquisition of competences are expected. Teamwork and interaction
between students is one of the core elements of the strategy. By working together, students
develop a large number of skills: the capacity of analysis and synthesis, time management, oral
communication, the ability to negotiate, leadership, knowledge transfer or achievement
motivation, among others. This methodology also increases students’ awareness of the progress
in their aptitudes and knowledge, because they receive feedback on their performance in each
session and get into a learning routine. Therefore, this method improves students’ academic
skills and may well have a knock-on effect on their performance in the rest of subjects in their
degree.
3.1. Description of the methodology
Before the first session, students received an e-mail explaining the new methodology that will
be followed during the course. The method and the grading system was also described in detail
during the first day of classes and students were encouraged to ask questions. Any doubts they
had were resolved by the lecturer. Students were allowed to choose between the two options of
the single assessment system, i.e., sitting only a final exam, or continuous assessment following
the new methodology based on FC, TBL and FT. Students who chose continuous assessment
were grouped into teams of three or four, which were maintained until the end of the course.
Class attendance was mandatory for the students who chose the new methodology. Depending
on the number of topics or units in each subject and the length of the semester (usually 15 weeks
per semester), a number of two-hour weekly sessions were devoted to each topic or unit,
including theoretical and practical classes. This schedule was made available to all students via
the subject’s digital platform, and they were also informed in advance of the material they were
expected to prepare for each session.

8
Theoretical sessions always started with a FC activity: students had to answer an individual
multiple-choice quiz of 10 questions based on the material that they had prepared in advance
for the session. This lasted for around 15-25 minutes. The lecturer collected individual answers
for evaluation. Immediately afterwards, the TBL activity started: students formed their teams
and together they solved the same 10 multiple-choice questions. This exercise obliged students
to discuss the questions and to reach a consensus with their colleagues on the right answer. Each
team had to deliver a single solution to the quiz to the lecturer after another 15-25 minutes.
Then, the lecturer wrote the answers on the board and responded to all the doubts and questions
that might arise. The remaining time of the session (around 30-40 minutes) was devoted to an
explanation of the topic’s more complex theoretical concepts. Practical sessions consisted of
the resolution in teams of applied exercises in the classroom. Together, each team had to solve
numerical and graphical problems related to the topic. In order to encourage participation in the
team work and further increase students’ motivation, we developed the “extra points” strategy,
which consisted of giving an additional point in the grades of the students belonging to the first
team that resolved a proposed problem and presented and explained the solution on the board
to the rest of the class (see Table 1 below). Although this was not the primary objective of our
strategy, the presentation of the solutions on the board can also be considered as an important
part of developing and improving students’ presentation skills.
The flexibility of the methodology allowed the structure of the sessions to be adapted to the
specific characteristics of each subject. Thus, in some GIS the theoretical and practical classes
were combined in a two-hour session, devoting one hour to each part; while in others, a single
theoretical or practical class is developed in a two-hour session, with the same structure
described above. In both cases, students devoted the same total number of hours to both
activities. Besides these two variants, the structure of the theoretical sessions was also applied
to solve exercises; in this case, students had to solve an exercise first individually and then in
9
teams. After each session, students received feedback on their performance (both individual
and team). Finally, during the last week of the course students were asked to fill in self-
assessment and co-assessment questionnaires in which they evaluated their own work and that
of their teammates. Students were informed about these questionnaires at the beginning of the
course and the importance of commitment to the team with regard to their own individual
performance was stressed in order to encourage active participation in teamwork and to prevent
free-riding behaviors.
3.2. Grading system
The assessment and learning activities in GIS are designed to help students to successfully
follow the subject, meet the learning objectives, and demonstrate their progress. Each grading
activity is directly related to one or more learning objectives and reflects the novel elements
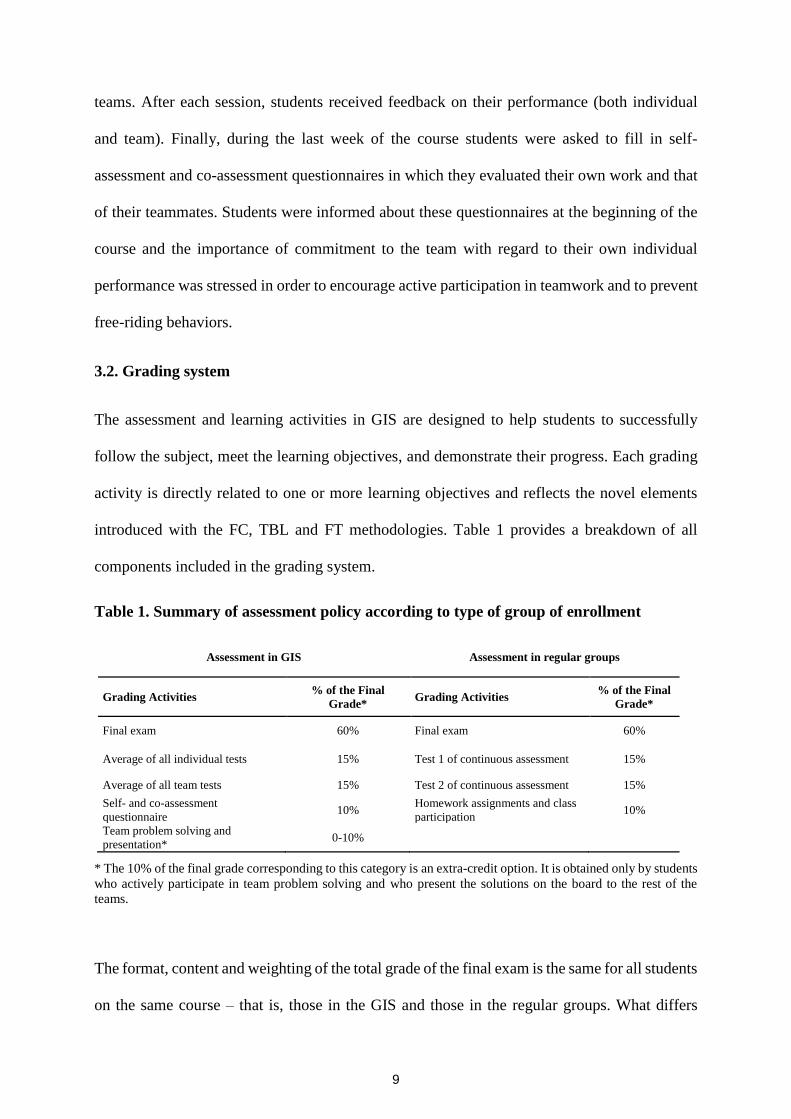
introduced with the FC, TBL and FT methodologies. Table 1 provides a breakdown of all
components included in the grading system.
Table 1. Summary of assessment policy according to type of group of enrollment
Assessment in GIS Assessment in regular groups
Grading Activities % of the Final
Grade* Grading Activities
% of the Final
Grade*
Final exam 60% Final exam 60%
Average of all individual tests 15% Test 1 of continuous assessment 15%
Average of all team tests 15% Test 2 of continuous assessment 15%
Self- and co-assessment
questionnaire 10%
Homework assignments and class
participation 10%
Team problem solving and
presentation* 0-10%
* The 10% of the final grade corresponding to this category is an extra-credit option. It is obtained only by students
who actively participate in team problem solving and who present the solutions on the board to the rest of the
teams.
The format, content and weighting of the total grade of the final exam is the same for all students
on the same course – that is, those in the GIS and those in the regular groups. What differs

10
between students enrolled in GIS and in regular groups is the format and type of the continuous
assessment activities but not their overall weighting in the final grade (40%). The weighting of
the final exam is 100% for students who chose the single assessment, i.e. sitting only for a final
exam.
A closer look at the two continuous assessment schemes reveals that the activities in the GIS
aim to stimulate autonomous learning before class and to foster active participation during the
two-hour weekly sessions, whereas the two tests of the continuous assessment in regular groups
are performed after the explanation of the corresponding topics or units.
4. Results and discussion
A total number of 610 students enrolled in one of the selected GIS in the different subjects on
the ECO and BA degrees during the 2013/14 and 2014/15 academic years. All had attended
regular classes in the subject over the past 1 to 3 years, and all had failed. Of the 610 students,
476 (78%) decided to follow the new methodology; this percentage ranging from 63.6% to
92.2% depending on the group. The remaining 22% of all enrolled students chose the alternative
assessment option of sitting only for a final exam. Although they were also encouraged to attend
classes and to take the weekly multiple-choice quizzes, most of them did not. Results for the
610 students are presented below.
4.1. Overall student performance in the GIS with the new methodology
There were major differences in performance between the students in the GIS following the
new methodology, i.e., the continuous assessment based on FC, TBL and FT, and those who
chose to sit only the final exam, i.e., the single assessment. Figure 1 shows the percentage of
students who attended the final exam according to type of assessment methodology. The
average no-show rate in GIS was 17.5%. However, this rate was more than five times higher

11
among students who had opted for the single assessment (47.8%) than among those who
followed the new methodology (9.0%).
Figure 1. Percentages* of GIS students who showed up/did not show up for the final exam, by type
of assessment.
* Over the total number of students enrolled in GIS by type of assessment. GIS=Groups of Intensive Study.
Among GIS students who attended the final exam, academic performance also differed
depending on the type of assessment system followed. Figure 2 shows that the ratio of students
who successfully passed the final exam was 2.3 times higher among those students who chose
continuous assessment and, hence, the new teaching methodology.
Figure 2. Percentages* of GIS students who passed or failed the final exam, by type of assessment.
* Over the total number of students enrolled in GIS who took the final exam by type of assessment. GIS=Groups of
Intensive Study.
The better performance of those students following continuous assessment may simply be the
result of the decision of the most diligent students to opt for this type of evaluation. A
comparison between GIS groups before and after the implementation of the new teaching
methodology would be a better way to analyze the effect of this methodology on students’
91,0%
52,2%
9,0%
47,8%
0%
20%
40%
60%
80%
100%
Continuous assessment(FC+TBL+FT
methodology)
Single assessment
Showed up
Did not show up
69.5%
30.0%30.5%
70.0%
0%
10%
20%
30%
40%
50%
60%
70%
80%
Continuous assessment(FC+TBL+FT methodology)
Single assessment
Passed
Failed

12
performance. Figure 3 shows the percentage of students who passed the subject, distinguishing
between standard groups and GIS, as well as the academic years. The first two columns refer
to the 2011/12 and 2012/13 academic years, before the introduction of the new methodology,
and the last two columns correspond to 2013/14 and 2014/15, when the new strategy was in
place. The results show that the introduction of the new methodology raised pass rates among
GIS students by nearly 50% (from 46.9 to 68.1%) while in the standard groups the pass rate
actually fell slightly. These findings suggest that it is the new methodology in the GIS that is
behind the improvement.
Figure 3. Percentages* of students who passed the subject, by type of enrollment.
* Over the total number of students who took the final exam. GIS=Groups of Intensive Study
All these results suggest that the combined learning strategy based on FC, TBL and FT with
students who have previously failed the subject has great potential: it stimulates autonomous
learning and increases students’ abilities for collaborative learning, which consequently leads
to better academic performance.
4.2. Results from the self-administered survey
In order to assess the students’ opinions about the new teaching strategy, we asked them to take
an online survey as part of the coursework. The completion of the survey questionnaire was not
mandatory, but if completed it accounted for up to 10% of the final grade (see Table 1). The
66.1%61.1%
46.9%
68.1%
0%
10%
20%
30%
40%
50%
60%
70%
80%
Before FC+TBL+FT methodologywas implemented in GIS
After FC+TBL+FT methodologywas implemented in GIS
Passed in regular groups Passed in GIS

13
survey contained self-assessment questions as well as joint assessment questions related to the
involvement of other members of the student’s team. A limited space for a short evaluation of
the new methodology was also provided. Three out of four students of those who followed the
new methodology (357 out of 476) completed the questionnaire.
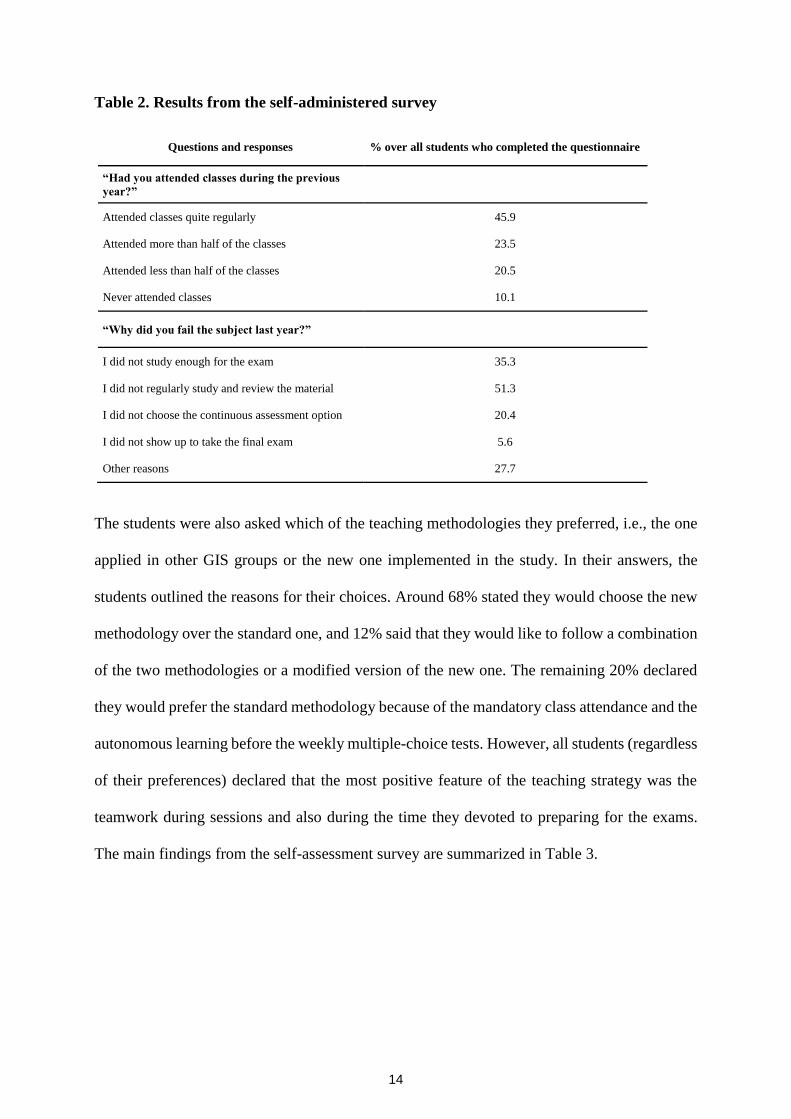
Firstly, the students were asked whether they had regularly attended classes during the previous
year, when they had failed the subject. The answers to this question are presented in Table 2
(upper panel). Almost 70% attended more than half of the classes or they had attended classes
quite regularly.
Secondly, students were asked to think about why they had failed the subject the previous year.
Multiple responses were allowed (see Table 2, lower panel). More than half of students reported
not studying regularly and 35% reported that they did not sufficiently prepare for the exam.
Around one fifth of students considered that they could have done better had they chosen
continuous assessment. A few did not take the final exam. Below 30% of students mentioned
other reasons such as being in poor health for a significant part of the term, lack of motivation,
learning difficulties, and so on. The results show that, for a significant proportion of students,
these negative factors can be addressed to a certain extent with the new teaching strategy
implemented in the GIS. In particular, the new methodology helps students to study regularly,
encouraging them to review the material before each class and to prepare better for the final
exam.
14
Table 2. Results from the self-administered survey
Questions and responses % over all students who completed the questionnaire
“Had you attended classes during the previous
year?”
Attended classes quite regularly 45.9
Attended more than half of the classes 23.5
Attended less than half of the classes 20.5
Never attended classes 10.1
“Why did you fail the subject last year?”
I did not study enough for the exam 35.3
I did not regularly study and review the material 51.3
I did not choose the continuous assessment option 20.4
I did not show up to take the final exam 5.6
Other reasons 27.7
The students were also asked which of the teaching methodologies they preferred, i.e., the one
applied in other GIS groups or the new one implemented in the study. In their answers, the
students outlined the reasons for their choices. Around 68% stated they would choose the new
methodology over the standard one, and 12% said that they would like to follow a combination
of the two methodologies or a modified version of the new one. The remaining 20% declared
they would prefer the standard methodology because of the mandatory class attendance and the
autonomous learning before the weekly multiple-choice tests. However, all students (regardless
of their preferences) declared that the most positive feature of the teaching strategy was the
teamwork during sessions and also during the time they devoted to preparing for the exams.
The main findings from the self-assessment survey are summarized in Table 3.

15
Table 3. Results from the self-assessment questionnaire
Questions Mean value* Std. dev.
I actively participated in the team work 5.2 0.96
I had a good relationship with the other members of my team 5.7 0.75
I spent enough time studying the subject 4.1 1.03
I worked autonomously in order to achieve the objectives of the course (reviewing the
material, reading the manual, solving problems, etc.) 4.2 1.17
I actively participated in classroom activities and discussions 3.4 1.50
I used to pay attention in class 4.8 1.01
I had the right attitude during classes (paid attention, do not disturb classmates, etc.) 5.3 0.87
I am satisfied with my progress in the subject 4.2 1.23
I found the new methodology very helpful to learn the subject and it helped me to successfully
complete the course 4.3 1.49
I prefer the new methodology to the standard one used in other GIS courses 4.3 1.81
I think that the new methodology has made me study regularly and work harder during the
term compared to other GIS courses 4.4 1.71
The new methodology has made me attend classes on a regular bases compared to other GIS
courses 5.0 1.48
Note: * A six-point scale ranging from “totally disagree” (1) to “totally agree” (6) was used to collect the data from the self-
assessment survey.
Tables 2 and 3 show that the new teaching strategy helped students to fulfill the learning
objectives of the subject and to pass the exam. They were also more motivated to attend classes,
study regularly, and review the course material. The weakest point was participation in the
class, with an average evaluation of 3.4.
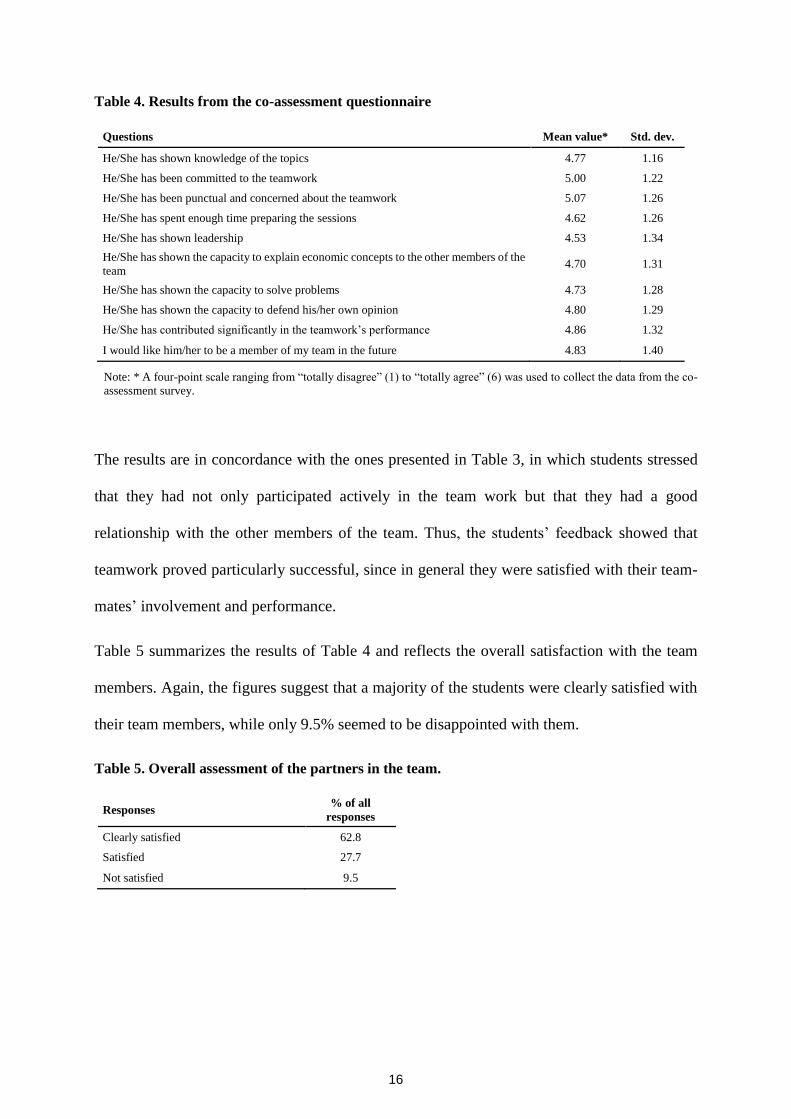
4.3. Evaluation of teamwork and of team members’ involvement
The online survey also included a section on team performance assessment, in which students
had the opportunity to evaluate their teammates’ efforts. They were asked several questions
concerning commitment, interest, understanding and contributions to the teamwork of each
member, ranking each partner’s skills. Table 4 shows the results for each question.
16
Table 4. Results from the co-assessment questionnaire
Questions Mean value* Std. dev.
He/She has shown knowledge of the topics 4.77 1.16
He/She has been committed to the teamwork 5.00 1.22
He/She has been punctual and concerned about the teamwork 5.07 1.26
He/She has spent enough time preparing the sessions 4.62 1.26
He/She has shown leadership 4.53 1.34
He/She has shown the capacity to explain economic concepts to the other members of the
team 4.70 1.31
He/She has shown the capacity to solve problems 4.73 1.28
He/She has shown the capacity to defend his/her own opinion 4.80 1.29
He/She has contributed significantly in the teamwork’s performance 4.86 1.32
I would like him/her to be a member of my team in the future 4.83 1.40
Note: * A four-point scale ranging from “totally disagree” (1) to “totally agree” (6) was used to collect the data from the co-
assessment survey.
The results are in concordance with the ones presented in Table 3, in which students stressed
that they had not only participated actively in the team work but that they had a good
relationship with the other members of the team. Thus, the students’ feedback showed that
teamwork proved particularly successful, since in general they were satisfied with their team-
mates’ involvement and performance.
Table 5 summarizes the results of Table 4 and reflects the overall satisfaction with the team
members. Again, the figures suggest that a majority of the students were clearly satisfied with
their team members, while only 9.5% seemed to be disappointed with them.
Table 5. Overall assessment of the partners in the team.
Responses % of all
responses
Clearly satisfied 62.8
Satisfied 27.7
Not satisfied 9.5
17
5. Conclusions
This educational innovation study combines three methodologies for improving the learning
experience in large groups of retake students: the FC, the TBL and the FT. The results suggest
that students benefit from the guided autonomous study, the continuous feedback they receive,
and the teamwork, which combined to allow a better understanding of the concepts involved.
The gains are reflected in the increase in the percentage of students who sat the final exam and
in the higher pass rate in GIS, thus changing the earlier tendency found in GIS and regular
groups. As in Bryson and Hand (2007), the subjects’ higher engagement and sense of
responsibility increased their motivation to learn. Moreover, the new methodology was widely
accepted by students. This point is especially significant if we take into account that the large
size of the groups might have been seen as a hindrance. Although in general students seemed
not to welcome the autonomous work, they valued the teamwork and the collaborative learning
very highly.
In addition, the strategy was shown to help students improve their attitudes towards studying
and their academic performance. The introduction of active learning techniques helps students
not just to succeed in a particular subject but to develop a set of skills that enhance their
preparation both for further education and for future employment. Moreover, group discussions
and active learning facilitate the development of teamwork, communication, leadership and
social skills – all of them attributes that are highly valued in the labor market (Kuhn and
Weinberger 2005, Heckman et al 2006, Borghans et al 2014).
This study describes a scenario in which an innovative methodology based on a combination of
FC, TBL and FT produced rewarding, enriching results. The method is particularly useful when
students come to the course with an adverse academic experience and have to study in large
groups with only very reduced face-to-face contact with the lecturer. In line with Yamarik
(2007) and Roach (2014), the improvements in their academic performance reflected in their
18
test grades, and the satisfaction they report, argue in favor of the use of these learning techniques
in economics education.
Although the study was carried out with groups of economics students repeating subjects, its
success suggests that it may be beneficial in other subject areas and also in groups of students
taking a subject for the first time.

19
References
Baepler, P. 2014. It's not about seat time: Blending, flipping, and efficiency in active learning
classrooms. Computers and Education 78, 227-236.
Bergmann, J., and Sams, A. 2012. Flip your classroom: Reach every student in every class
every day. Washington, D.C.: International Society for Technology in Education.
Berrett, D. 2012. How ‘flipping’ the classroom can improve the traditional lecture. The
Chronicle of Higher Education. http://chronicle.com/article/How-Flipping-the-
Classroom/130857/
Borghans, L., Ter Weel, B., and Weinberg, B.A. 2014. People skills and the labor-market
outcomes of underrepresented groups. Industrial & Labor Relations Review 67 (2), 287-334.
Bryson, C., and Hand, L. 2007. The role of engagement in inspiring teaching and learning,
Innovations in Education and Teaching International 44, 349–362.
Chung, K. 2014. Professors ‘flip’ classrooms, enhance learning. Daily Tar Heel. Retrieved.
http://www.dailytarheel.com/article/2014/01/flipped-classrooms-0108
Crouch, C., and Mazur, E. 2001. Peer Instruction: Ten Years of Experience and Results,
American Journal of Physics 69, 970-977.
Deslauriers, L., Schelew, E., and Wieman, C. 2011. Improved Learning in a Large-Enrollment
Physics Class. Science 332, 862-864.
Heckman, J.J., Stixrud, J., and Urzua, S. 2006. The effects of cognitive and noncognitive
abilitites on labor market outcomes and social behavior. Journal of Labor Economics 24(3),
411-482.
Hong, T., and Pham, T. 2013. Using group projects as a strategy to increase cooperation among
low- and high-achieving students. Higher Education Research and Development 32, 993-1006.
Jackson, M.W., and Prosser, M.T. 1989. Less lecturing, more learning. Studies in Higher
Education 14, 55-68.
King, A. 1993. From sage on the stage to guide on the side. College teaching 41, 30-35.
Knight, J. K., and Wood, W. B. 2005. Teaching More by Lecturing Less. Cell Biology
Education 4, 298-310.
20
Kruger, J., and Dunning, D. 1999. Unskilled and unaware of it: How difficulties in recognizing
one’s own incompetence lead to inflated self-assessments. Journal of Personality & Social
Psycology 77, 1121–1134.
Kuhn, P., and Weinberger, C. 2005. Leadership skills and wages. Journal of Labor Economics
23(3), 395-436.
Lage, M.J., Platt, G.J., and Treglia, M. 2000. Inverting the classroom: A gateway to creating
an inclusive learning environment. The Journal of Economic Education 31, 30-43.
Mazur, E. 1997. Peer Instruction: A User's Manual Series in Educational Innovation. Prentice
Hall, Upper Saddle River, NJ.
McLaughlin, J.C. 2013. Pharmacy student engagement, performance, and perception in a
flipped satellite classroom. American Journal of Pharmaceutical Education 77, 1-8.
Michaelsen, L.K., Knight, A.B., and Fink, L.D. 2004. Team-Based Learning: A Transformative
Use of Small Groups in College Teaching. Sterling, Va. Stylus.
Millis, B.J., and Cottell, P.G. 1998. Cooperative Learning for Higher Education Faculty.
Phoenix, Ariz. Oryx Press.
Missildine, K., Fountain, R., Summers, L., and Gosselin, K. 2013. Flipping the classroom to
improve student performance and satisfaction. Journal of Nursing Education 52, 597- 599.
Nordberg, D. 2008. Group projects: More learning? Less fair? A conundrum in assessing
postgraduate business education. Assessment & Evaluation in Higher Education 33, 481–492.
Opdecam, E., Everaert, P., and Van Keer, H. 2014. Preferences for Team Learning and Lecture-
Based Learning Among First-Year Undergraduate Accounting Students. Research in Higher
Education 55, 400-432.
Park, E.L., and Choi, B.K. 2014. Transformation of classroom spaces: traditional versus active
learning classroom in colleges. Higher Education 68, 749-771.
Pennebaker, J.W., Gosling, S.D., Ferrell, J.D. 2013. Daily Online Testing in Large Classes:
Boosting College Performance while Reducing Achievement Gaps. PloS ONE 8, 11, e79774.
Prieto, A.;, Díaz, D., Montserrat, J., Reyes, E. 2014. Experiencias de aplicación de estrategias
de gamificación a entornos de aprendizaje universitario. ReVisión, 7.
21
Roach, T. 2014. Student perceptions toward flipped learning: New methods to increase
interaction and active learning in economics. International Review of Economics Education 17,
74–84.
Roediger, H.L. III, Putnam, A.L., Smith, M.A. 2011. Ten benefits of testing and their
applications to educational practice. Edited by: Mestre, J.P., Ross, B.H. Psychology of
Learning and Motivation: Cognition in Education Book Series: Psychology of Learning and
Motivation, Volume: 55 Pages: 1-36.
Shah, S.Z.A. 2013. The use of group activities in developing personal transferable skills.
Innovations in Education and Teaching International 50, 297-307.
Strayer, J. 2012. How learning in an inverted classroom influences cooperation, innovation and
task orientation. Learning Environments 15, 171-193.
Wilson, S.G. 2013. The flipped classroom: A method to address the challenges of an
undergraduate statistics course. Teaching of Psychology 40, 193-199.
Yamarik, S. 2007. Does cooperative learning improve student learning outcomes? Journal of
Economic Education 38, 259-277.

Institut de Recerca en Economia Aplicada Regional i Pública Document de Treball 2014/17, pàg. 5 Research Institute of Applied Economics Working Paper 2014/17, pag. 5