Embed Size (px)
Citation preview
Retention of Riverine Sedimentand Nutrient Loads by Coastal Plain
Floodplains
Gregory B. Noe* and Cliff R. Hupp
U.S. Geological Survey, 430 National Center, Reston, Virginia 20192, USA
ABSTRACT
Despite the frequent citation of wetlands as effec-
tive regulators of water quality, few quantitative
estimates exist for their cumulative retention of the
annual river loads of nutrients or sediments. Here
we report measurements of sediment accretion and
associated carbon, nitrogen, and phosphorus accu-
mulation as sedimentation over feldspar marker
horizons placed on floodplains of the non-tidal,
freshwater Coastal Plain reaches of seven rivers in
the Chesapeake Bay watershed, USA. We then
scale these accumulation rates to the entire extent
of non-tidal floodplain in the Coastal Plain of each
river, defined as riparian area extending from the
Fall Line to the upper limit of tidal influence, and
compare them to annual river loads. Floodplains
accumulated a very large amount of material
compared to their annual river loads of sediment
(median among rivers = 119%), nitrogen (24%),
and phosphorus (59%). Systems with larger
floodplain areas and longer floodplain inundation
retained greater proportions of riverine loads of
nitrogen and phosphorus, but systems with larger
riverine loads retained a smaller proportion of that
load on floodplains. Although the source and long-
term fate of deposited sediment and associated
nutrients are uncertain, these fluxes represent the
interception of large amounts of material that
otherwise could have been exported downstream.
Coastal Plain floodplain ecosystems are important
regulators of sediment, carbon, and nutrient
transport in watersheds of the Chesapeake Bay.
Key words: floodplain; sediment; nitrogen;
phosphorus; retention; wetland; river.
INTRODUCTION
Floodplains and other riparian features are known
to be important locations for sediment storage in
fluvial systems (Phillips 1989; Steiger and others
2003). Large amounts of sediment eroded from
post-colonial agriculture in the US, and its associ-
ated nutrients, are thought to be stored in stream
valleys (Meade 1982; Walters and Merritts 2008).
The in-stream processes that entrain, transport, and
store the sediment retained in stream valleys are
important for understanding material transport in
watersheds, as suggested by the inability of upland
erosion rate estimates to predict current sediment
yields in the mid-Atlantic region of the US (Boomer
and others 2008). Although the literature contains
abundant references to the buffering function of
riparian areas (sediment and nutrient trapping
from upland flow), particularly in headwaters (for
example, National Research Council 2002), much
less literature has been devoted to the retention
function of floodplain ecosystems (trapping from
flood flow).
Received 8 December 2008; accepted 6 April 2009;
published online 22 May 2009
Authors Contributions C.H. designed and implemented the sampling
network. G.N. performed the chemical analyses of sediment, statistical
analyses, and the scaling and retention analyses. G.N. wrote the article
and both authors discussed the results and edited the manuscript.
*Corresponding author; e-mail: [email protected]
Ecosystems (2009) 12: 728–746DOI: 10.1007/s10021-009-9253-5
� 2009 Government Employee: United States Geological Survey, Department of the Interior
728
The storage of sediment in floodplains has con-
sequences for the retention and cycling of nutrients
and contaminants. Sedimentation has been appre-
ciated as an important flux for phosphorus (P) in
wetlands (Johnston 1991). Although denitrifica-
tion has received considerable attention among
nitrogen (N) fluxes in floodplains, there is less
recognition of the potentially large magnitude of N
sedimentation fluxes (Olde Venterink and others
2006). Noe and Hupp (2005) reported high rates of
P as well as carbon (C) and N accumulation asso-
ciated with floodplain sedimentation along Coastal
Plain rivers. Large amounts of radioisotopes and
trace metals also accumulate in association with
sedimentation in floodplains (Hupp and others
1993; Malmon and others 2002).
Few quantitative estimates exist for the retention
of river loads by floodplains at the scale of catch-
ments or large river reaches. Here we provide
estimates for plot-scale sediment and sediment-
associated C, N, and P accumulation rates in
Coastal Plain floodplains located in the Chesapeake
Bay watershed, USA. Plot-scale accumulation rates
were first reported for three rivers in Noe and Hupp
(2005); in this study we report rates for an addi-
tional four rivers. For these seven rivers, we then
scale rates from individual plots to the entire extent
of floodplain along their freshwater, non-tidal
Coastal Plain reaches. Finally, we compare flood-
plain trapping to river loads to calculate the percent
retention of river sediment, N, and P loads by
floodplains. We expected that rivers with larger
floodplain area (size of sink), longer floodplain
inundation (river to floodplain exchange), and
larger river loads (size of source) had greater pro-
portions of their loads retained by floodplains.
METHODS
Site Description
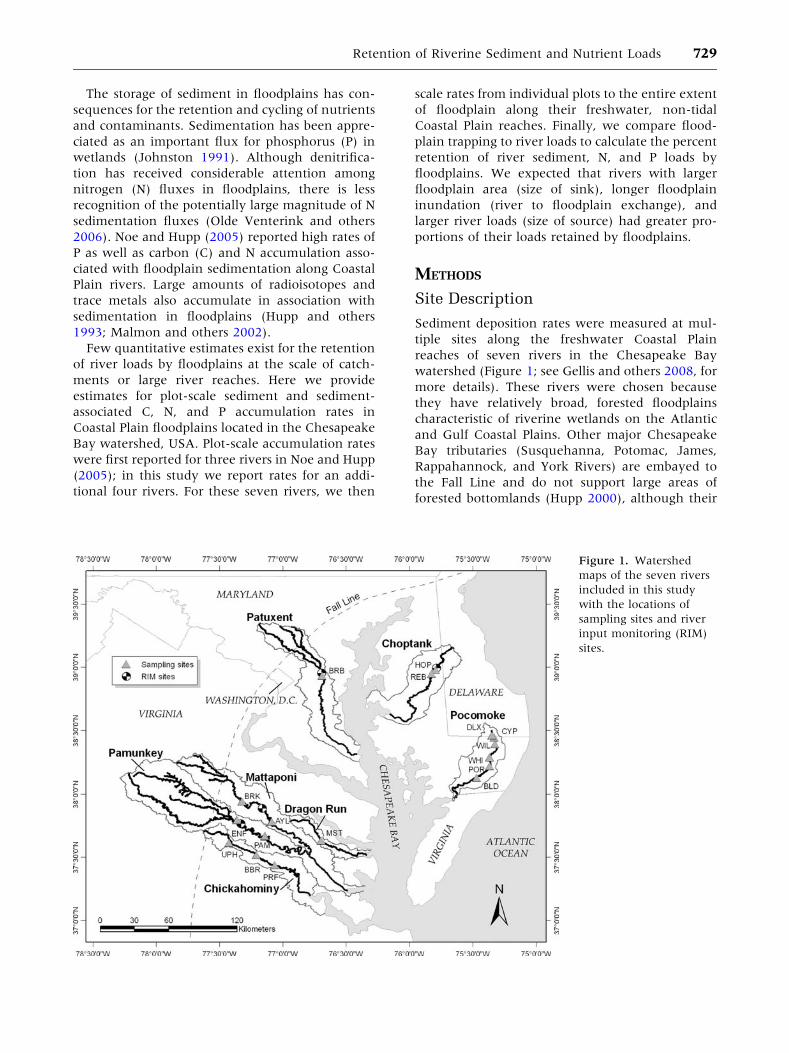
Sediment deposition rates were measured at mul-
tiple sites along the freshwater Coastal Plain
reaches of seven rivers in the Chesapeake Bay
watershed (Figure 1; see Gellis and others 2008, for
more details). These rivers were chosen because
they have relatively broad, forested floodplains
characteristic of riverine wetlands on the Atlantic
and Gulf Coastal Plains. Other major Chesapeake
Bay tributaries (Susquehanna, Potomac, James,
Rappahannock, and York Rivers) are embayed to
the Fall Line and do not support large areas of
forested bottomlands (Hupp 2000), although their
Figure 1. Watershed
maps of the seven rivers
included in this study
with the locations of
sampling sites and river
input monitoring (RIM)
sites.
Retention of Riverine Sediment and Nutrient Loads 729
tributaries may have well-developed floodplains.
Study sites (1–6 sites per river) were selected to be
relatively easily accessed by road, support contig-
uous mature bottomland forest, generally experi-
ence hydroperiods typical of Coastal Plain rivers,
and have minimal tidal influence at the most
downstream site. Multiple floodplain transects
(typically three) were established at each study site,
oriented perpendicular to the river and separated
by 50–100 m, beginning on the channel edge
(usually a natural levee) and continuing for a few
hundred meters into the low backswamp area.
Each transect typically had 4–6 monitoring plots
where periodic measurements were made of sedi-
ment accretion rate and sediment texture and
composition. This sampling design systematically
encompassed all typical floodplain micro-topo-
graphic and vegetation features present at each
floodplain site.
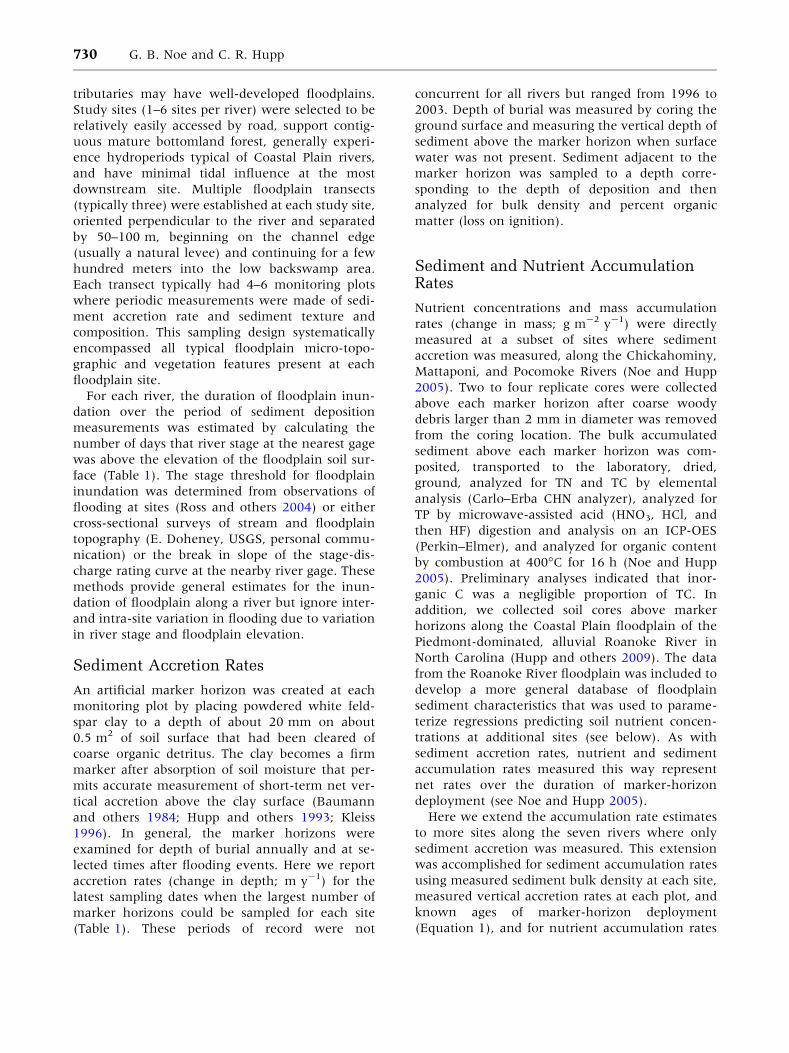
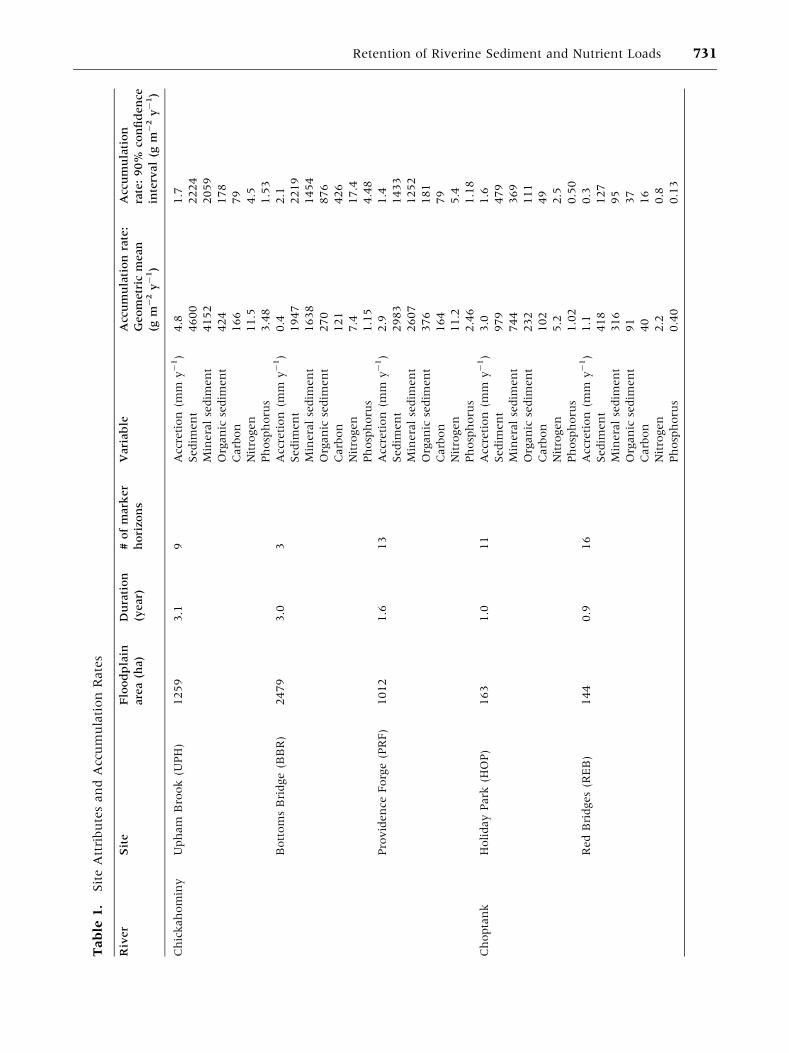
For each river, the duration of floodplain inun-
dation over the period of sediment deposition
measurements was estimated by calculating the
number of days that river stage at the nearest gage
was above the elevation of the floodplain soil sur-
face (Table 1). The stage threshold for floodplain
inundation was determined from observations of
flooding at sites (Ross and others 2004) or either
cross-sectional surveys of stream and floodplain
topography (E. Doheney, USGS, personal commu-
nication) or the break in slope of the stage-dis-
charge rating curve at the nearby river gage. These
methods provide general estimates for the inun-
dation of floodplain along a river but ignore inter-
and intra-site variation in flooding due to variation
in river stage and floodplain elevation.
Sediment Accretion Rates
An artificial marker horizon was created at each
monitoring plot by placing powdered white feld-
spar clay to a depth of about 20 mm on about
0.5 m2 of soil surface that had been cleared of
coarse organic detritus. The clay becomes a firm
marker after absorption of soil moisture that per-
mits accurate measurement of short-term net ver-
tical accretion above the clay surface (Baumann
and others 1984; Hupp and others 1993; Kleiss
1996). In general, the marker horizons were
examined for depth of burial annually and at se-
lected times after flooding events. Here we report
accretion rates (change in depth; m y-1) for the
latest sampling dates when the largest number of
marker horizons could be sampled for each site
(Table 1). These periods of record were not
concurrent for all rivers but ranged from 1996 to
2003. Depth of burial was measured by coring the
ground surface and measuring the vertical depth of
sediment above the marker horizon when surface
water was not present. Sediment adjacent to the
marker horizon was sampled to a depth corre-
sponding to the depth of deposition and then
analyzed for bulk density and percent organic
matter (loss on ignition).
Sediment and Nutrient AccumulationRates
Nutrient concentrations and mass accumulation
rates (change in mass; g m-2 y-1) were directly
measured at a subset of sites where sediment
accretion was measured, along the Chickahominy,
Mattaponi, and Pocomoke Rivers (Noe and Hupp
2005). Two to four replicate cores were collected
above each marker horizon after coarse woody
debris larger than 2 mm in diameter was removed
from the coring location. The bulk accumulated
sediment above each marker horizon was com-
posited, transported to the laboratory, dried,
ground, analyzed for TN and TC by elemental
analysis (Carlo–Erba CHN analyzer), analyzed for
TP by microwave-assisted acid (HNO3, HCl, and
then HF) digestion and analysis on an ICP-OES
(Perkin–Elmer), and analyzed for organic content
by combustion at 400�C for 16 h (Noe and Hupp
2005). Preliminary analyses indicated that inor-
ganic C was a negligible proportion of TC. In
addition, we collected soil cores above marker
horizons along the Coastal Plain floodplain of the
Piedmont-dominated, alluvial Roanoke River in
North Carolina (Hupp and others 2009). The data
from the Roanoke River floodplain was included to
develop a more general database of floodplain
sediment characteristics that was used to parame-
terize regressions predicting soil nutrient concen-
trations at additional sites (see below). As with
sediment accretion rates, nutrient and sediment
accumulation rates measured this way represent
net rates over the duration of marker-horizon
deployment (see Noe and Hupp 2005).
Here we extend the accumulation rate estimates
to more sites along the seven rivers where only
sediment accretion was measured. This extension
was accomplished for sediment accumulation rates
using measured sediment bulk density at each site,
measured vertical accretion rates at each plot, and
known ages of marker-horizon deployment
(Equation 1), and for nutrient accumulation rates
730 G. B. Noe and C. R. Hupp
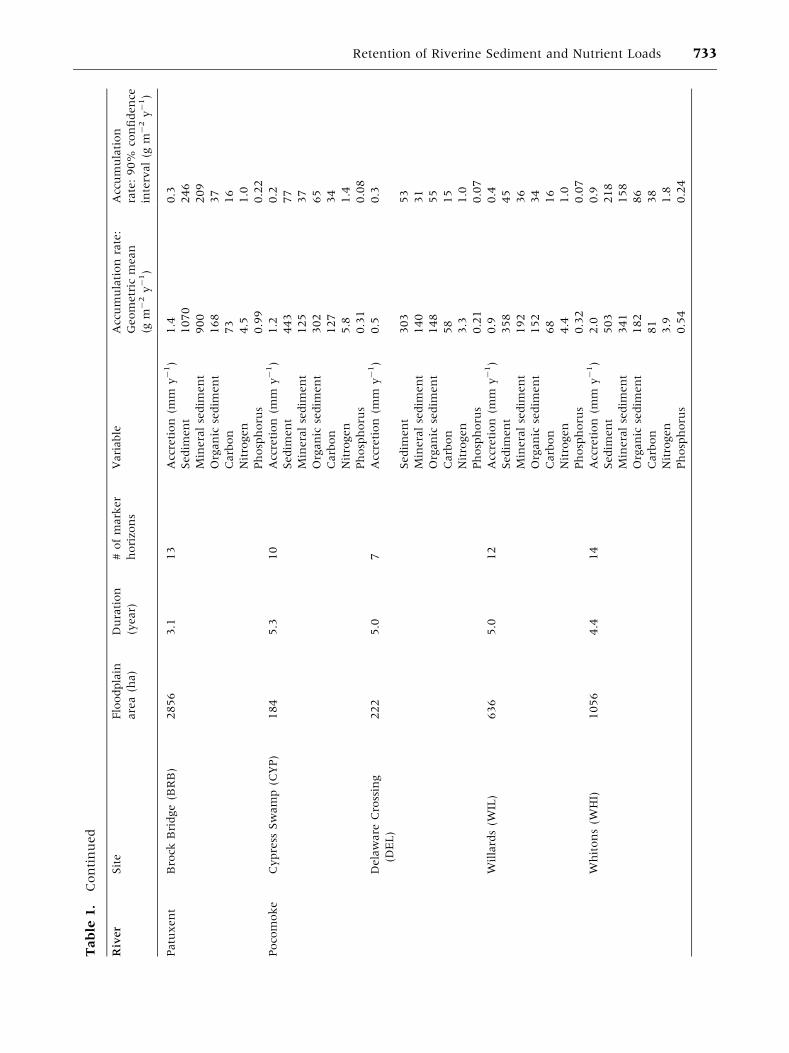
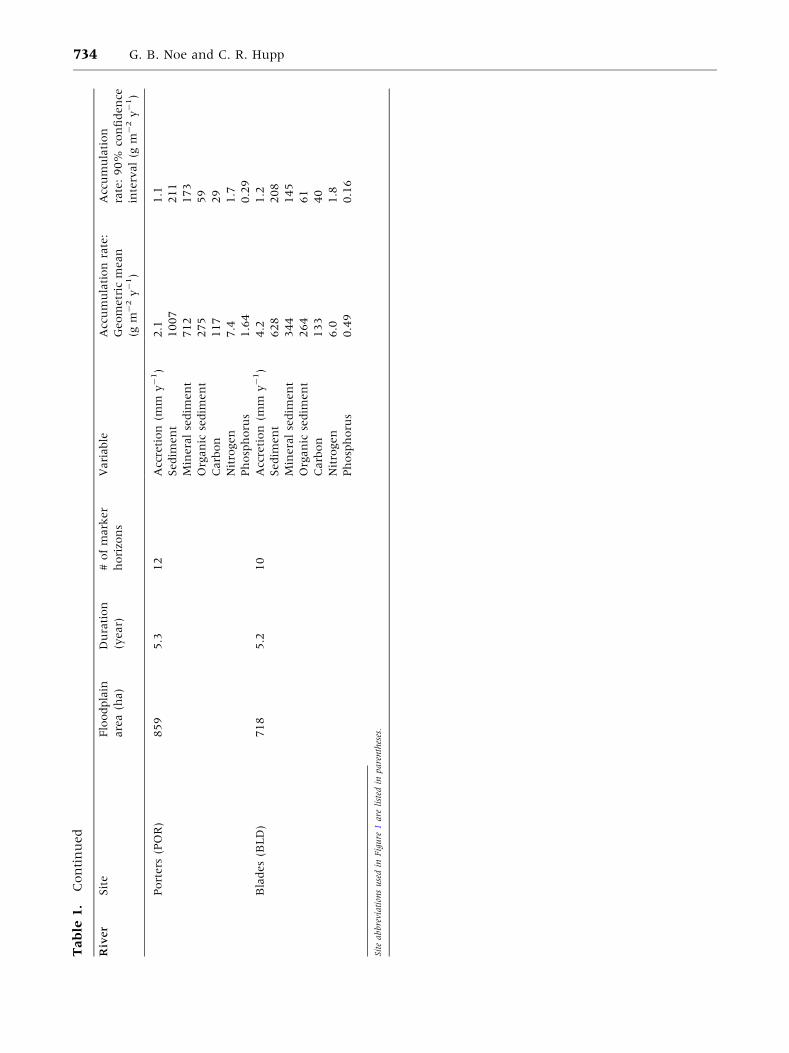
Tab
le1.
Sit
eA
ttri
bu
tes
an
dA
ccu
mu
lati
on
Rate
s
Riv
er
Sit
eF
lood
pla
in
are
a(h
a)
Du
rati
on
(year)
#of
mark
er
hori
zon
s
Vari
ab
leA
ccu
mu
lati
on
rate
:
Geom
etr
icm
ean
(gm
-2
y-
1)
Acc
um
ula
tion
rate
:90%
con
fid
en
ce
inte
rval
(gm
-2
y-
1)
Ch
ickah
om
iny
Uph
am
Bro
ok
(UPH
)1259
3.1
9A
ccre
tion
(mm
y-
1)
4.8
1.7
Sedim
en
t4600
2224
Min
era
lse
dim
en
t4152
2059
Org
an
icse
dim
en
t424
178
Carb
on
166
79
Nit
rogen
11.5
4.5
Ph
osp
horu
s3.4
81.5
3
Bott
om
sB
ridge
(BB
R)
2479
3.0
3A
ccre
tion
(mm
y-
1)
0.4
2.1
Sedim
en
t1947
2219
Min
era
lse
dim
en
t1638
1454
Org
an
icse
dim
en
t270
876
Carb
on
121
426
Nit
rogen
7.4
17.4
Ph
osp
horu
s1.1
54.4
8
Pro
vid
en
ceForg
e(P
RF)
1012
1.6
13
Acc
reti
on
(mm
y-
1)
2.9
1.4
Sedim
en
t2983
1433
Min
era
lse
dim
en
t2607
1252
Org
an
icse
dim
en
t376
181
Carb
on
164
79
Nit
rogen
11.2
5.4
Ph
osp
horu
s2.4
61.1
8
Ch
opta
nk
Holi
day
Park
(HO
P)
163
1.0
11
Acc
reti
on
(mm
y-
1)
3.0
1.6
Sedim
en
t979
479
Min
era
lse
dim
en
t744
369
Org
an
icse
dim
en
t232
111
Carb
on
102
49
Nit
rogen
5.2
2.5
Ph
osp
horu
s1.0
20.5
0
Red
Bri
dges
(RE
B)
144
0.9
16
Acc
reti
on
(mm
y-
1)
1.1
0.3
Sedim
en
t418
127
Min
era
lse
dim
en
t316
95
Org
an
icse
dim
en
t91
37
Carb
on
40
16
Nit
rogen
2.2
0.8
Ph
osp
horu
s0.4
00.1
3
Retention of Riverine Sediment and Nutrient Loads 731
Tab
le1.
Con
tin
ued
Riv
er
Sit
eFlo
odpla
in
are
a(h
a)
Du
rati
on
(year)
#of
mark
er
hori
zon
s
Vari
able
Acc
um
ula
tion
rate
:
Geom
etr
icm
ean
(gm
-2
y-
1)
Acc
um
ula
tion
rate
:90%
con
fiden
ce
inte
rval
(gm
-2
y-
1)
Dra
gon
Ru
nM
asc
ot
(MST)
1707
2.3
13
Acc
reti
on
(mm
y-
1)
3.0
1.8
Sedim
en
t2069
1258
Min
era
lse
dim
en
t1861
1135
Org
an
icse
dim
en
t206
123
Carb
on
89
53
Nit
rogen
7.0
4.2
Ph
osp
horu
s1.4
30.8
6
Matt
apon
iB
urk
es
Bri
dge
(BR
K)
1154
6.3
9A
ccre
tion
(mm
y-
1)
1.8
1.1
Sedim
en
t705
292
Min
era
lse
dim
en
t542
280
Org
an
icse
dim
en
t124
52
Carb
on
59
27
Nit
rogen
3.4
1.4
Ph
osp
horu
s0.3
70.1
4
Ayle
tt(A
YL)
977
2.3
11
Acc
reti
on
(mm
y-
1)
3.7
0.9
Sedim
en
t2409
581
Min
era
lse
dim
en
t1854
447
Org
an
icse
dim
en
t555
134
Carb
on
244
59
Nit
rogen
12.6
3.0
Ph
osp
horu
s1.3
90.3
4
Pam
un
key
En
gel
Farm
(EN
F)
843
1.0
15
Acc
reti
on
(mm
y-
1)
1.5
0.5
Sedim
en
t698
226
Min
era
lse
dim
en
t592
191
Org
an
icse
dim
en
t105
34
Carb
on
46
15
Nit
rogen
2.8
0.9
Ph
osp
horu
s0.6
40.2
1
Pam
pati
ke
(PA
M)
825
2.4
8A
ccre
tion
(mm
y-
1)
4.0
2.0
Sedim
en
t1511
754
Min
era
lse
dim
en
t1289
681
Org
an
icse
dim
en
t200
83
Carb
on
87
36
Nit
rogen
5.9
2.6
Ph
osp
horu
s1.2
00.4
9
732 G. B. Noe and C. R. Hupp
Tab
le1.
Con
tin
ued
Riv
er
Sit
eFlo
odpla
in
are
a(h
a)
Du
rati
on
(year)
#of
mark
er
hori
zon
s
Vari
able
Acc
um
ula
tion
rate
:
Geom
etr
icm
ean
(gm
-2
y-
1)
Acc
um
ula
tion
rate
:90%
con
fiden
ce
inte
rval
(gm
-2
y-
1)
Patu
xen
tB
rock
Bri
dge
(BR
B)
2856
3.1
13
Acc
reti
on
(mm
y-
1)
1.4
0.3
Sedim
en
t1070
246
Min
era
lse
dim
en
t900
209
Org
an
icse
dim
en
t168
37
Carb
on
73
16
Nit
rogen
4.5
1.0
Ph
osp
horu
s0.9
90.2
2
Poco
moke
Cypre
ssSw
am
p(C
YP)
184
5.3
10
Acc
reti
on
(mm
y-
1)
1.2
0.2
Sedim
en
t443
77
Min
era
lse
dim
en
t125
37
Org
an
icse
dim
en
t302
65
Carb
on
127
34
Nit
rogen
5.8
1.4
Ph
osp
horu
s0.3
10.0
8
Dela
ware
Cro
ssin
g
(DE
L)
222
5.0
7A
ccre
tion
(mm
y-
1)
0.5
0.3
Sedim
en
t303
53
Min
era
lse
dim
en
t140
31
Org
an
icse
dim
en
t148
55
Carb
on
58
15
Nit
rogen
3.3
1.0
Ph
osp
horu
s0.2
10.0
7
Wil
lard
s(W
IL)
636
5.0
12
Acc
reti
on
(mm
y-
1)
0.9
0.4
Sedim
en
t358
45
Min
era
lse
dim
en
t192
36
Org
an
icse
dim
en
t152
34
Carb
on
68
16
Nit
rogen
4.4
1.0
Ph
osp
horu
s0.3
20.0
7
Wh
iton
s(W
HI)
1056
4.4
14
Acc
reti
on
(mm
y-
1)
2.0
0.9
Sedim
en
t503
218
Min
era
lse
dim
en
t341
158
Org
an
icse
dim
en
t182
86
Carb
on
81
38
Nit
rogen
3.9
1.8
Ph
osp
horu
s0.5
40.2
4
Retention of Riverine Sediment and Nutrient Loads 733
Tab
le1.
Con
tin
ued
Riv
er
Sit
eFlo
odpla
in
are
a(h
a)
Du
rati
on
(year)
#of
mark
er
hori
zon
s
Vari
able
Acc
um
ula
tion
rate
:
Geom
etr
icm
ean
(gm
-2
y-
1)
Acc
um
ula
tion
rate
:90%
con
fiden
ce
inte
rval
(gm
-2
y-
1)
Port
ers
(PO
R)
859
5.3
12
Acc
reti
on
(mm
y-
1)
2.1
1.1
Sedim
en
t1007
211
Min
era
lse
dim
en
t712
173
Org
an
icse
dim
en
t275
59
Carb
on
117
29
Nit
rogen
7.4
1.7
Ph
osp
horu
s1.6
40.2
9
Bla
des
(BLD
)718
5.2
10
Acc
reti
on
(mm
y-
1)
4.2
1.2
Sedim
en
t628
208
Min
era
lse
dim
en
t344
145
Org
an
icse
dim
en
t264
61
Carb
on
133
40
Nit
rogen
6.0
1.8
Ph
osp
horu
s0.4
90.1
6
Sit
eabbre
viati
ons
use
din
Fig
ure
1are
list
edin
pare
nth
eses
.
734 G. B. Noe and C. R. Hupp
using sediment accumulation rates and predicted
sediment C, N, or P concentrations (Equation 2):
Sediment accumulation rate ¼ðaccretion; m y�1Þ � ðbulk density; g m�3Þ�ðage; yÞ ¼ g m�2 y�1 ð1Þ
Nutrient accumulation rate ¼ðsediment accumulation rate; g m�2 y�1Þ� ðpredicted C, N, or P concentration; g g�1Þ¼ g m�2 y�1 ð2Þ
We parameterized regressions to predict sedi-
ment TC, TN, and TP from sediment organic matter
concentration using log-transformed data from the
four rivers where this information was directly
measured (n = 96 marker horizons from the Chic-
kahominy, Mattaponi, Pocomoke, and Roanoke
Rivers). We then used these regressions to predict
C, N, and P concentrations in sediments from sites
that have not been analyzed for nutrients but had
measured organic matter concentrations. Directly
measured sediment and nutrient accumulation
rates (n = 72), when available, were used in pref-
erence to rates estimated from accretion rates
(n = 114). For each floodplain site, the geometric
mean and an estimate of uncertainty (±90% con-
fidence limits (CL)) were calculated for sediment
accretion and for sediment, C, N, and P accumu-
lation rates. Because these statistics were calculated
from measurements at the multiple marker hori-
zons within each site, they encompass the hy-
drogeomorphic and vegetation variation inherent
in these floodplain ecosystems.
Scaling
Estimates were made of the floodplain area of the
non-tidal Coastal Plain reach of each river, defined
as the riparian area extending from the Fall Line to
the upper limit of tidal influence. The limit of tidal
influence was assumed to be 1 km below the most
downstream sampling location on each river. The
Patuxent and Choptank Rivers each had one site
located downstream from the sites included in this
study, located near the limit of tidal influence,
which could not be included in this study due to
the lack of sediment organic content and bulk
density information. Accretion rates at this most
downstream Patuxent River site were twice those
measured at the single Patuxent River floodplain
site included here (Gellis and others 2008), result-
ing in an underestimation of sediment and nutrient
accumulation rates for the Patuxent River flood-
plain in this study. Site-scale estimates of floodplain
mean accumulation rates were then extrapolated
to the entire non-tidal, freshwater Coastal Plain
reach of each river using these estimates of flood-
plain area.
Topographic maps (USGS 1:24,000) and digital
mapping software (Garmin Mapsource) were used
to determine floodplain length and width. For riv-
ers with more than one floodplain site, the river
was divided into segments defined by channel
midpoints between sites. Length of floodplain for
each river segment was measured as thalweg dis-
tance. The width of each floodplain segment was
estimated as the mean of 10 measurement transects
per segment. Floodplain width on both sides of the
river was defined from the river bank to the base of
the valley slope when it was clearly defined by 5 or
10 ft contour lines or up to the edge of the wetland
delineated by the cartographers. Floodplain-width
estimates were narrowed when a road or structure
would limit hydrologic connectivity with back-
swamps. The product of the site accumulation rate
and segment floodplain area for each site was
summed for each river to generate floodplain
trapping (g y-1) for each parameter (sediment, C,
N, and P). This summation was done independently
for mean, +90% CL, and -90% CL accumulation
rates, with the confidence intervals representing
the variation expected along that river as extrapo-
lated from the depositional variation within each
floodplain site.
River Loads
Riverine loads (g y-1) of sediment, total N, and
total P are measured near the Fall Line of the larger
rivers in the Chesapeake Bay watershed, including
the Mattaponi, Pamunkey, and Patuxent Rivers, as
well as above the limit of tidal influence on the
Choptank River, as part of the USGS River Input
Monitoring Program (RIM; Langland and others
2006). Annual loads of sediment, but not nutrients,
were also measured on the Pocomoke River at the
Willards site (Gellis and others 2008). The locations
of these river load measurements are upstream or
nearby the most upstream of the floodplain sites
along each river, with the exception of the two
most upstream sites along the Pocomoke River
which are disconnected from the river (Noe and
Hupp 2005) and the most upstream site along the
Mattaponi River (Figure 1). The annual loads for
each of these rivers were averaged over the years
spanning the dates of marker-horizon installation
Retention of Riverine Sediment and Nutrient Loads 735
and final measurement of sediment deposition.
Annual loads of sediment were not measured on
the Chickahominy and Dragon Run Rivers. Aver-
age annual TN and TP loads for the Chickahominy,
Dragon Run, and Pocomoke Rivers were estimated
for their Coastal Plain reaches from output of the
steady-state SPARROW watershed model (Alex-
ander and others 2008).
Retention
Because river loads were primarily estimated at
locations upstream of the floodplain reaches, per-
cent retention of the annual riverine load by
floodplains was calculated as the total floodplain
trapping rate along a river divided by the annual
load of that river. We also provide alternative
retention estimates calculated as floodplain trap-
ping divided by the sum of river load and flood-
plain trapping, which underestimates retention in
this study because each of the seven rivers had
floodplains located downstream of the river load
estimate. Retention was calculated for sediment,
TN, and TP using geometric mean, +90% CL, and
-90% CL accumulation rates. The relative
importance of river floodplain area, floodplain
inundation, and river load for controlling riverine
floodplain retention of sediment, TN, and TP was
evaluated using Pearson product-moment corre-
lations on log–log transformed data. Because
floodplain area and river load are used to calculate
percent retention, the statistics are spurious but
the correlation coefficients represent a test of the
sensitivity of each term in determining percent
retention.
RESULTS
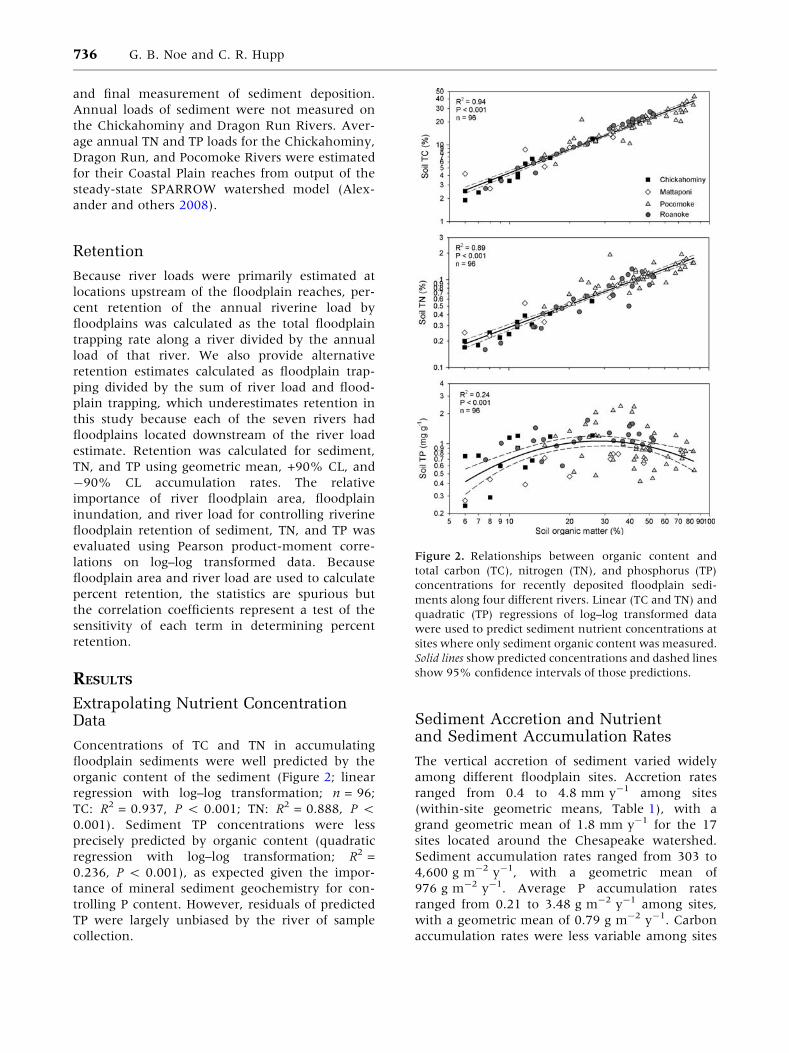
Extrapolating Nutrient ConcentrationData
Concentrations of TC and TN in accumulating
floodplain sediments were well predicted by the
organic content of the sediment (Figure 2; linear
regression with log–log transformation; n = 96;
TC: R2 = 0.937, P < 0.001; TN: R2 = 0.888, P <
0.001). Sediment TP concentrations were less
precisely predicted by organic content (quadratic
regression with log–log transformation; R2 =
0.236, P < 0.001), as expected given the impor-
tance of mineral sediment geochemistry for con-
trolling P content. However, residuals of predicted
TP were largely unbiased by the river of sample
collection.
Sediment Accretion and Nutrientand Sediment Accumulation Rates
The vertical accretion of sediment varied widely
among different floodplain sites. Accretion rates
ranged from 0.4 to 4.8 mm y-1 among sites
(within-site geometric means, Table 1), with a
grand geometric mean of 1.8 mm y-1 for the 17
sites located around the Chesapeake watershed.
Sediment accumulation rates ranged from 303 to
4,600 g m-2 y-1, with a geometric mean of
976 g m-2 y-1. Average P accumulation rates
ranged from 0.21 to 3.48 g m-2 y-1 among sites,
with a geometric mean of 0.79 g m-2 y-1. Carbon
accumulation rates were less variable among sites
Figure 2. Relationships between organic content and
total carbon (TC), nitrogen (TN), and phosphorus (TP)
concentrations for recently deposited floodplain sedi-
ments along four different rivers. Linear (TC and TN) and
quadratic (TP) regressions of log–log transformed data
were used to predict sediment nutrient concentrations at
sites where only sediment organic content was measured.
Solid lines show predicted concentrations and dashed lines
show 95% confidence intervals of those predictions.
736 G. B. Noe and C. R. Hupp
than sediment accumulation rates, ranging from 40
to 244 g m-2 y-1, with a geometric mean of
93 g m-2 y-1. Similarly, N accumulation rates
were relatively less variable among sites, ranging
from 2.2 to 12.6 g m-2 y-1, with a geometric mean
of 5.5 g m-2 y-1. In addition to the variation in
accretion and accumulation rates among the 17
sites, variation within individual floodplain sites
was sometimes large as shown by the 90% confi-
dence intervals of each rate (Table 1).
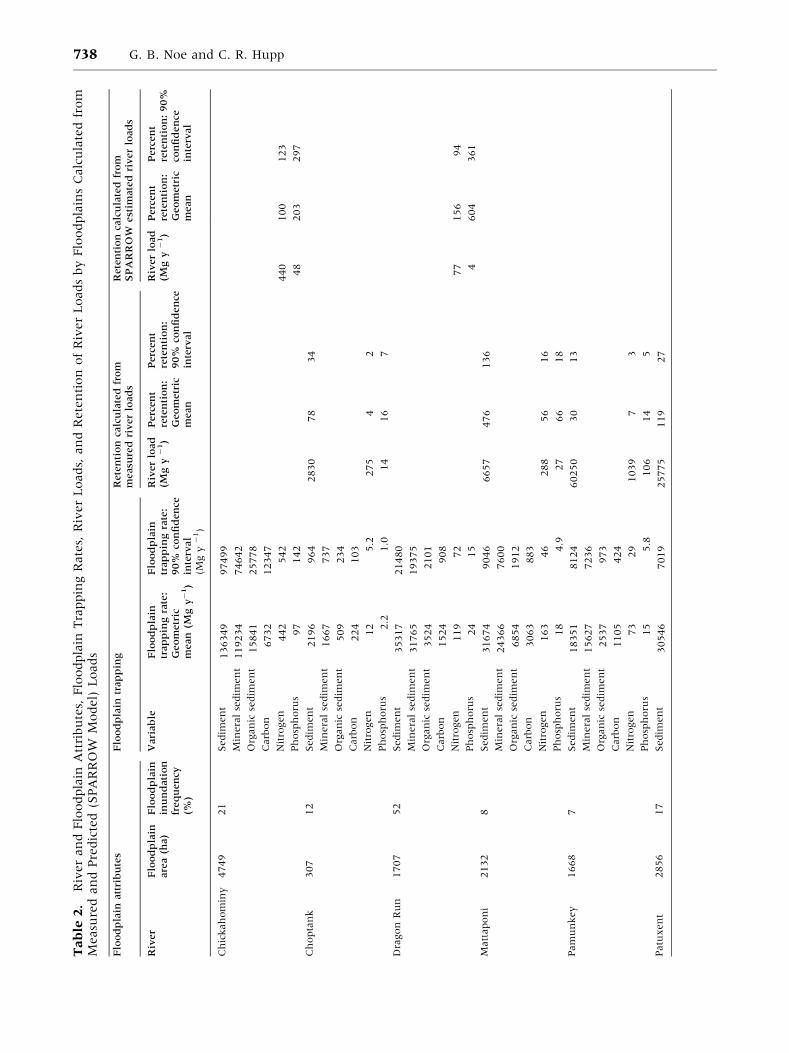
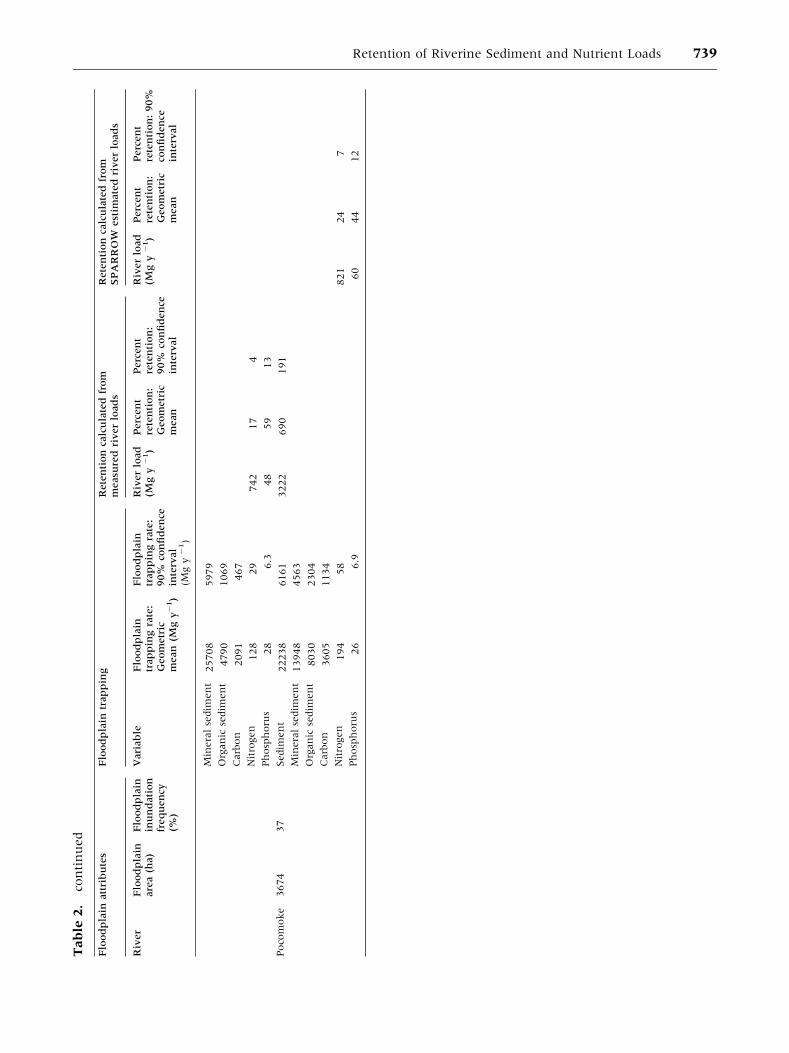
Scaling these sediment and nutrient accumula-
tion rates to the entire non-tidal Coastal Plain reach
of each river was calculated using floodplain area
along each river. Floodplain area along the Coastal
Plain reaches ranged from 307 to 4,749 ha among
rivers (Table 2). Floodplain inundation was esti-
mated to occur from 7 to 52% of the days during
the period of measurement in each river. Mean
annual cumulative sediment trapping on flood-
plains ranged from 2.2 to 136 Gg y-1 among riv-
ers, C trapping ranged from 224 to 6732 Mg y-1, N
trapping ranged from 11.7 to 442 Mg y-1, and P
trapping ranged from 2.2 to 97.2 Mg y-1.
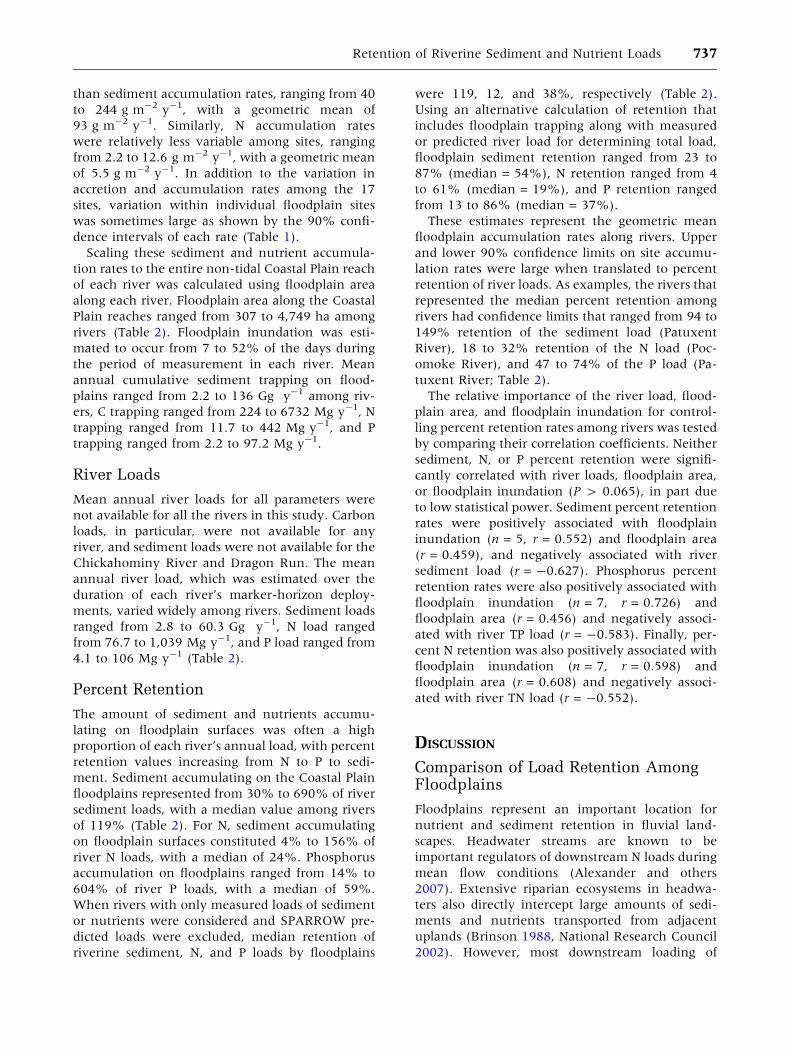
River Loads
Mean annual river loads for all parameters were
not available for all the rivers in this study. Carbon
loads, in particular, were not available for any
river, and sediment loads were not available for the
Chickahominy River and Dragon Run. The mean
annual river load, which was estimated over the
duration of each river’s marker-horizon deploy-
ments, varied widely among rivers. Sediment loads
ranged from 2.8 to 60.3 Gg y-1, N load ranged
from 76.7 to 1,039 Mg y-1, and P load ranged from
4.1 to 106 Mg y-1 (Table 2).
Percent Retention
The amount of sediment and nutrients accumu-
lating on floodplain surfaces was often a high
proportion of each river’s annual load, with percent
retention values increasing from N to P to sedi-
ment. Sediment accumulating on the Coastal Plain
floodplains represented from 30% to 690% of river
sediment loads, with a median value among rivers
of 119% (Table 2). For N, sediment accumulating
on floodplain surfaces constituted 4% to 156% of
river N loads, with a median of 24%. Phosphorus
accumulation on floodplains ranged from 14% to
604% of river P loads, with a median of 59%.
When rivers with only measured loads of sediment
or nutrients were considered and SPARROW pre-
dicted loads were excluded, median retention of
riverine sediment, N, and P loads by floodplains
were 119, 12, and 38%, respectively (Table 2).
Using an alternative calculation of retention that
includes floodplain trapping along with measured
or predicted river load for determining total load,
floodplain sediment retention ranged from 23 to
87% (median = 54%), N retention ranged from 4
to 61% (median = 19%), and P retention ranged
from 13 to 86% (median = 37%).
These estimates represent the geometric mean
floodplain accumulation rates along rivers. Upper
and lower 90% confidence limits on site accumu-
lation rates were large when translated to percent
retention of river loads. As examples, the rivers that
represented the median percent retention among
rivers had confidence limits that ranged from 94 to
149% retention of the sediment load (Patuxent
River), 18 to 32% retention of the N load (Poc-
omoke River), and 47 to 74% of the P load (Pa-
tuxent River; Table 2).
The relative importance of the river load, flood-
plain area, and floodplain inundation for control-
ling percent retention rates among rivers was tested
by comparing their correlation coefficients. Neither
sediment, N, or P percent retention were signifi-
cantly correlated with river loads, floodplain area,
or floodplain inundation (P > 0.065), in part due
to low statistical power. Sediment percent retention
rates were positively associated with floodplain
inundation (n = 5, r = 0.552) and floodplain area
(r = 0.459), and negatively associated with river
sediment load (r = -0.627). Phosphorus percent
retention rates were also positively associated with
floodplain inundation (n = 7, r = 0.726) and
floodplain area (r = 0.456) and negatively associ-
ated with river TP load (r = -0.583). Finally, per-
cent N retention was also positively associated with
floodplain inundation (n = 7, r = 0.598) and
floodplain area (r = 0.608) and negatively associ-
ated with river TN load (r = -0.552).
DISCUSSION
Comparison of Load Retention AmongFloodplains
Floodplains represent an important location for
nutrient and sediment retention in fluvial land-
scapes. Headwater streams are known to be
important regulators of downstream N loads during
mean flow conditions (Alexander and others
2007). Extensive riparian ecosystems in headwa-
ters also directly intercept large amounts of sedi-
ments and nutrients transported from adjacent
uplands (Brinson 1988, National Research Council
2002). However, most downstream loading of
Retention of Riverine Sediment and Nutrient Loads 737
Tab
le2.
Riv
er
an
dFlo
odpla
inA
ttri
bu
tes,
Flo
odpla
inTra
ppin
gR
ate
s,R
iver
Loads,
an
dR
ete
nti
on
of
Riv
er
Loads
by
Flo
odpla
ins
Calc
ula
ted
from
Measu
red
an
dPre
dic
ted
(SPA
RR
OW
Model)
Loads
Flo
od
pla
inatt
rib
ute
sF
lood
pla
intr
ap
pin
gR
ete
nti
on
calc
ula
ted
from
measu
red
river
load
sR
ete
nti
on
calc
ula
ted
from
SP
AR
RO
West
imate
dri
ver
load
s
Riv
er
Flo
od
pla
inare
a(h
a)
Flo
od
pla
inin
un
dati
on
freq
uen
cy(%
)
Vari
ab
leF
lood
pla
intr
ap
pin
gra
te:
Geom
etr
icm
ean
(Mg
y-
1)
Flo
od
pla
intr
ap
pin
gra
te:
90%
con
fid
en
cein
terv
al
(Mg
y-
1)
Riv
er
load
(Mg
y-
1)
Perc
en
tre
ten
tion
:G
eom
etr
icm
ean
Perc
en
tre
ten
tion
:90%
con
fid
en
cein
terv
al
Riv
er
load
(Mg
y-
1)
Perc
en
tre
ten
tion
:G
eom
etr
icm
ean
Perc
en
tre
ten
tion
:90%
con
fid
en
cein
terv
al
Ch
ickah
om
iny
4749
21
Sedim
en
t136349
97499
Min
era
lse
dim
en
t119234
74642
Org
an
icse
dim
en
t15841
25778
Carb
on
6732
12347
Nit
rogen
442
542
440
100
123
Ph
osp
horu
s97
142
48
203
297
Ch
opta
nk
307
12
Sedim
en
t2196
964
2830
78
34
Min
era
lse
dim
en
t1667
737
Org
an
icse
dim
en
t509
234
Carb
on
224
103
Nit
rogen
12
5.2
275
42
Ph
osp
horu
s2.2
1.0
14
16
7
Dra
gon
Ru
n1707
52
Sedim
en
t35317
21480
Min
era
lse
dim
en
t31765
19375
Org
an
icse
dim
en
t3524
2101
Carb
on
1524
908
Nit
rogen
119
72
77
156
94
Ph
osp
horu
s24
15
4604
361
Matt
apon
i2132
8Sedim
en
t31674
9046
6657
476
136
Min
era
lse
dim
en
t24366
7600
Org
an
icse
dim
en
t6854
1912
Carb
on
3063
883
Nit
rogen
163
46
288
56
16
Ph
osp
horu
s18
4.9
27
66
18
Pam
un
key
1668
7Sedim
en
t18351
8124
60250
30
13
Min
era
lse
dim
en
t15627
7236
Org
an
icse
dim
en
t2537
973
Carb
on
1105
424
Nit
rogen
73
29
1039
73
Ph
osp
horu
s15
5.8
106
14
5
Patu
xen
t2856
17
Sedim
en
t30546
7019
25775
119
27
738 G. B. Noe and C. R. Hupp
Tab
le2.
con
tin
ued
Flo
od
pla
inatt
rib
ute
sF
lood
pla
intr
ap
pin
gR
ete
nti
on
calc
ula
ted
from
measu
red
river
load
sR
ete
nti
on
calc
ula
ted
from
SP
AR
RO
West
imate
dri
ver
load
s
Riv
er
Flo
od
pla
inare
a(h
a)
Flo
od
pla
inin
un
dati
on
freq
uen
cy(%
)
Vari
ab
leF
lood
pla
intr
ap
pin
gra
te:
Geom
etr
icm
ean
(Mg
y-
1)
Flo
od
pla
intr
ap
pin
gra
te:
90%
con
fid
en
cein
terv
al
(Mg
y-
1)
Riv
er
load
(Mg
y-
1)
Perc
en
tre
ten
tion
:G
eom
etr
icm
ean
Perc
en
tre
ten
tion
:90%
con
fid
en
cein
terv
al
Riv
er
load
(Mg
y-
1)
Perc
en
tre
ten
tion
:G
eom
etr
icm
ean
Perc
en
tre
ten
tion
:90%
con
fid
en
cein
terv
al
Min
era
lse
dim
en
t25708
5979
Org
an
icse
dim
en
t4790
1069
Carb
on
2091
467
Nit
rogen
128
29
742
17
4
Ph
osp
horu
s28
6.3
48
59
13
Poco
moke
3674
37
Sedim
en
t22238
6161
3222
690
191
Min
era
lse
dim
en
t13948
4563
Org
an
icse
dim
en
t8030
2304
Carb
on
3605
1134
Nit
rogen
194
58
821
24
7
Ph
osp
horu
s26
6.9
60
44
12
Retention of Riverine Sediment and Nutrient Loads 739
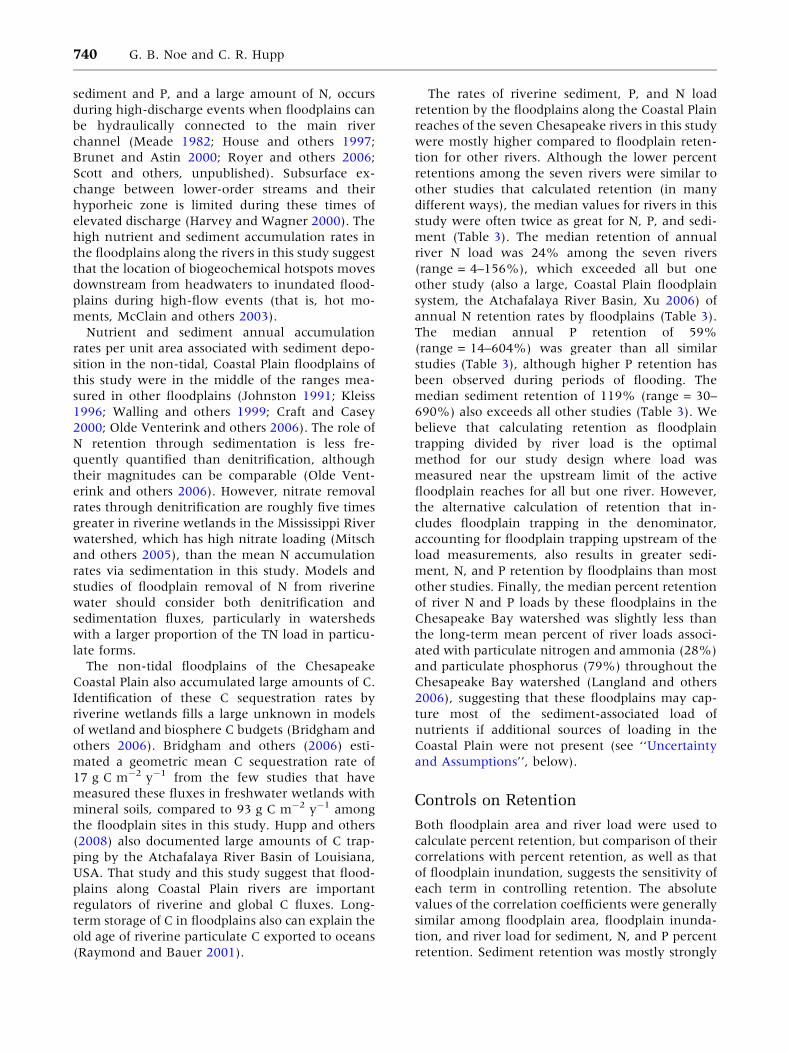
sediment and P, and a large amount of N, occurs
during high-discharge events when floodplains can
be hydraulically connected to the main river
channel (Meade 1982; House and others 1997;
Brunet and Astin 2000; Royer and others 2006;
Scott and others, unpublished). Subsurface ex-
change between lower-order streams and their
hyporheic zone is limited during these times of
elevated discharge (Harvey and Wagner 2000). The
high nutrient and sediment accumulation rates in
the floodplains along the rivers in this study suggest
that the location of biogeochemical hotspots moves
downstream from headwaters to inundated flood-
plains during high-flow events (that is, hot mo-
ments, McClain and others 2003).
Nutrient and sediment annual accumulation
rates per unit area associated with sediment depo-
sition in the non-tidal, Coastal Plain floodplains of
this study were in the middle of the ranges mea-
sured in other floodplains (Johnston 1991; Kleiss
1996; Walling and others 1999; Craft and Casey
2000; Olde Venterink and others 2006). The role of
N retention through sedimentation is less fre-
quently quantified than denitrification, although
their magnitudes can be comparable (Olde Vent-
erink and others 2006). However, nitrate removal
rates through denitrification are roughly five times
greater in riverine wetlands in the Mississippi River
watershed, which has high nitrate loading (Mitsch
and others 2005), than the mean N accumulation
rates via sedimentation in this study. Models and
studies of floodplain removal of N from riverine
water should consider both denitrification and
sedimentation fluxes, particularly in watersheds
with a larger proportion of the TN load in particu-
late forms.
The non-tidal floodplains of the Chesapeake
Coastal Plain also accumulated large amounts of C.
Identification of these C sequestration rates by
riverine wetlands fills a large unknown in models
of wetland and biosphere C budgets (Bridgham and
others 2006). Bridgham and others (2006) esti-
mated a geometric mean C sequestration rate of
17 g C m-2 y-1 from the few studies that have
measured these fluxes in freshwater wetlands with
mineral soils, compared to 93 g C m-2 y-1 among
the floodplain sites in this study. Hupp and others
(2008) also documented large amounts of C trap-
ping by the Atchafalaya River Basin of Louisiana,
USA. That study and this study suggest that flood-
plains along Coastal Plain rivers are important
regulators of riverine and global C fluxes. Long-
term storage of C in floodplains also can explain the
old age of riverine particulate C exported to oceans
(Raymond and Bauer 2001).
The rates of riverine sediment, P, and N load
retention by the floodplains along the Coastal Plain
reaches of the seven Chesapeake rivers in this study
were mostly higher compared to floodplain reten-
tion for other rivers. Although the lower percent
retentions among the seven rivers were similar to
other studies that calculated retention (in many
different ways), the median values for rivers in this
study were often twice as great for N, P, and sedi-
ment (Table 3). The median retention of annual
river N load was 24% among the seven rivers
(range = 4–156%), which exceeded all but one
other study (also a large, Coastal Plain floodplain
system, the Atchafalaya River Basin, Xu 2006) of
annual N retention rates by floodplains (Table 3).
The median annual P retention of 59%
(range = 14–604%) was greater than all similar
studies (Table 3), although higher P retention has
been observed during periods of flooding. The
median sediment retention of 119% (range = 30–
690%) also exceeds all other studies (Table 3). We
believe that calculating retention as floodplain
trapping divided by river load is the optimal
method for our study design where load was
measured near the upstream limit of the active
floodplain reaches for all but one river. However,
the alternative calculation of retention that in-
cludes floodplain trapping in the denominator,
accounting for floodplain trapping upstream of the
load measurements, also results in greater sedi-
ment, N, and P retention by floodplains than most
other studies. Finally, the median percent retention
of river N and P loads by these floodplains in the
Chesapeake Bay watershed was slightly less than
the long-term mean percent of river loads associ-
ated with particulate nitrogen and ammonia (28%)
and particulate phosphorus (79%) throughout the
Chesapeake Bay watershed (Langland and others
2006), suggesting that these floodplains may cap-
ture most of the sediment-associated load of
nutrients if additional sources of loading in the
Coastal Plain were not present (see ‘‘Uncertainty
and Assumptions’’, below).
Controls on Retention
Both floodplain area and river load were used to
calculate percent retention, but comparison of their
correlations with percent retention, as well as that
of floodplain inundation, suggests the sensitivity of
each term in controlling retention. The absolute
values of the correlation coefficients were generally
similar among floodplain area, floodplain inunda-
tion, and river load for sediment, N, and P percent
retention. Sediment retention was mostly strongly
740 G. B. Noe and C. R. Hupp

Tab
le3.
Stu
die
sth
at
have
Measu
red
Perc
en
tR
ete
nti
on
of
the
An
nu
alR
iver
Loads
of
Su
spen
ded
Sedim
en
t(S
S),
Ph
osp
horu
s(P
),an
dN
itro
gen
(N)
by
Flo
odpla
ins
Refe
ren
ceM
easu
red
flu
xM
eth
od
Sp
ati
al
scale
(flood
pla
inare
a
or
reach
len
gth
)
%S
S%
P%
N
Th
isst
udy:
media
n(r
an
ge)
Sedim
en
tdeposi
tion
Sca
lin
gu
pR
each
:21
km
2(3
–47
km
2)
119
(30–690)
59
(4–156)
22
(14–604)
Wall
ing
an
doth
ers
1998
Sedim
en
tdeposi
tion
Sca
lin
gu
pW
ate
rsh
ed
(28
an
d10
km
2)
39,
49
Wall
ing
an
doth
ers
1999
Sedim
en
tdeposi
tion
Sca
lin
gu
pW
ate
rsh
ed
40
Wall
ing
an
dQ
uin
e1993
Sedim
en
tdeposi
tion
Sca
lin
gu
pW
ate
rsh
ed
23
Ph
illi
ps
1989
Sedim
en
tdeposi
tion
Sca
lin
gu
pW
ate
rsh
ed
23–93
Ph
illi
ps
an
doth
ers
2007
Sedim
en
tdeposi
tion
Sca
lin
gu
pW
ate
rsh
ed
(82
km
2)
2–5
Ric
hard
son
an
doth
ers
2004
Den
itri
fica
tion
Sca
lin
gu
pR
each
(82
km
2)
7(N
O3
-)
van
der
Lee
an
doth
ers
2004
Sedim
en
tdeposi
tion
+den
itri
fica
tion
Sca
lin
gu
pR
each
(76
an
d46
km
)5–18
1–3
Kle
iss
1996
Sedim
en
tdeposi
tion
Sca
lin
gu
pR
each
(78
km
2)
16
Ric
hard
son
an
doth
ers
2004
Load
chan
ge
Mass
bala
nce
Reach
(82
km
2)
20
(NO
3-
)
Bru
net
an
dA
stin
2000
Load
chan
ge
Mass
bala
nce
Reach
(25
km
)19
-5
-15
Xu
2006
Load
chan
ge
Mass
bala
nce
Reach
(4,6
78
km
2)
27
(TK
N)
Eld
er
1985
Load
chan
ge
Mass
bala
nce
Reach
(145
km
)-
10
-2
Kle
iss
1996
Load
chan
ge
Mass
bala
nce
Reach
(49
km
)6–22
Stu
die
sare
cate
gori
zed
by
mea
sure
men
tflu
xes,
extr
apol
ati
onm
eth
od,
an
dsp
ati
al
scale
s.
Retention of Riverine Sediment and Nutrient Loads 741
associated with river sediment load, whereas P
retention was most strongly associated with flood-
plain inundation, and N retention with floodplain
area. However, percent retention of sediment, N,
and P were each positively related to floodplain
area and floodplain inundation but negatively re-
lated to river loads. Rivers with larger material
sinks (more floodplain area) had greater propor-
tional interception of riverine loads by floodplains
than average. The larger floodplain areas likely
decreased velocity and increased hydraulic resi-
dence times of floodwaters before re-entering the
main channel, resulting in more floodplain depo-
sition. In addition, rivers with floodplains that were
inundated more often (greater connectivity) had
greater proportional retention of river loads, likely
due to greater opportunity for material transport
from river to floodplain. In contrast, rivers with
larger material sources (larger river loads) had less
proportional interception of those riverine loads by
floodplains than average. Larger river loads of
sediment and nutrients were not compensated for
by greater floodplain retention, suggesting an up-
ward limit on the ability of floodplains to intercept
and store sediment and nutrients at a watershed
scale. Relatively larger river loads apparently by-
pass floodplains thereby limiting their capacity to
retain larger proportions of those river loads, per-
haps due to limitations on the amount of river
water exchanged with floodplains. Alternatively,
larger river loads may be associated with propor-
tionally greater dissolved nutrient fractions that are
less associated with removal by net sedimentation
on floodplains. Nonetheless, the total mass of
material trapped on floodplains increased with
greater river loading rates.
Hydrologic connectivity between river and
floodplain controls organic matter and nutrient
exchange and retention by floodplains (Tockner
and others 1999). The Coastal Plain reaches of the
rivers in this study have more opportunity for
floodplain-channel interactions than higher gradi-
ent systems. Bankfull discharge occurs roughly 7–8
times more frequently in Coastal Plain rivers
compared to other Piedmont or mountain rivers
(Sweet and Geratz 2003). Floodplains in this study
were inundated from 7 to 52% of the days over
their period of measurement, with a median of
17% among rivers (Table 1). In addition, the broad
valleys of Coastal Plain rivers have large areas of
floodplain that slow water velocity and have a high
potential for settling of suspended sediment (Phil-
lips 1989; Hupp 2000). The long residence time of
floodwaters relative to biogeochemical uptake rates
can result in near-complete removal of nutrients
from floodplain waters, resulting in limitation of
material retention in Coastal Plain floodplains by
channel-floodplain exchange (for example, N;
Scott and others, unpublished). Sediment accu-
mulation rates in floodplains also are greater in
lower reaches compared to other locations in
watersheds (Walling and others 1998). The seven
rivers in this study also had smaller annual river
loads of sediment and nutrients compared to other
studies that have quantified retention through
sedimentation (Kleiss 1996; Walling and others
1999; van der Lee and others 2004; Phillips and
others 2007). In summary, the relatively high rates
of sediment and sediment-associated nutrient
retention in the distal, Coastal Plain reaches of the
rivers in our study were likely due to their hy-
drogeomorphic setting supporting high channel–
floodplain connectivity, large floodplain area, slow
water velocity, and small river loads.
Uncertainty and Assumptions
Percent retention estimates sometimes exceeded
100%, especially for sediment, indicating that the
retention estimates must be biased upwards com-
pared to true floodplain retention of river loads.
Several issues related to scaling our measurements
from plots to reaches add uncertainty to our esti-
mates of retention. First, we could not achieve a
random selection of sites for measurements al-
though sites were typical of Coastal Plain flood-
plains in the Chesapeake Bay watershed. Some
rivers were sampled at only a limited number of
sites. However, multiple transects and marker-
horizons were placed within sites using a stratified
random strategy that limited bias due to plot
selection but encompassed the heterogeneity of the
floodplains. We used this spatial variation in hy-
drogeomorphology and vegetation within sites to
estimate uncertainty in accumulation rates and the
resulting scaled retention estimates. The 90%
confidence intervals of percent retention were
typically less than half of the magnitude of the
mean estimate (Table 2). Second, the area of
floodplain that actively exchanged water with the
main channel may not have been accurately
determined by our mapping, but we believe we
achieved a reasonable estimation of floodplain area
relative to the scope of the present paper. Third, the
rates of nutrient and sediment retention apply only
to the time periods and durations (1–6 years) of
marker horizon deployment in this study, although
we used river load estimates that were concurrent
with marker horizon deployments. Fourth, error
was introduced by predicting soil nutrient con-
742 G. B. Noe and C. R. Hupp

centrations from soil organic content at some sites
where it was not directly measured, especially for P
which was not as well predicted as N. Other
uncertainties relate to the permanency of the
storage of accumulated sediment and sediment-
associated nutrients on floodplains, and the sources
of sediment deposited on floodplains.
River Loads
The measurements of sediment and nutrient loads
used in this analysis were made near the Fall Line
of the rivers, largely above the Coastal Plain
reaches where sedimentation was quantified. Loads
are not measured downstream from our study
reaches in the Coastal Plain. Any loading of sedi-
ment or nutrients from local streams or bed and
bank erosion located in the Coastal Plain was not
included, which suggests that our estimates of
loading may be too low and that our estimates of
floodplain retention may be too high. Uncertainty
in the monitored loads was greater for suspended
sediment than for nutrients; for example, the 95%
confidence interval of the annual loads of TSS, TN,
and TP in the Mattaponi River during 1997 water
year were 7.44 ± 1.28 Gg y-1, 338 ± 17 Mg y-1,
and 31.5 ± 2.5 Mg y-1, respectively (Langland and
others 2006). Some rivers did not have empirical
measurements of nutrient loads, in which case we
used outputs from the steady-state USGS SPAR-
ROW watershed model. The SPARROW model has
prediction errors of 55% for TN and 76% for TP
loads (Alexander and others 2008). The discrep-
ancies in load estimates were sometimes large for
rivers where both monitored and modeled loads
were available. For example, the mean annual load
for the Mattaponi River predicted by the SPAR-
ROW model is 624 Mg y-1 for TN and 46 Mg y-1
for TP (R. Alexander, USGS, unpublished data),
compared to the monitored loads of 288 and
27 Mg y-1 of TN and TP, respectively, over the
duration of marker-horizon deployments in this
study (Langland and others 2006, Table 2). The
very high retention rates of N and P in the Dragon
Run and Chickahominy River floodplains may be
due to underestimation of their actual river loads
by the SPARROW model.
Riverine Source of Material
We assumed that the material deposited on flood-
plain surfaces was derived from the river. Owens
and Walling (2002) demonstrated that most mod-
ern sediment deposited on floodplains was ulti-
mately derived from upland topsoils, but channel
banks were also significant. Deposited sediment
may also be derived from re-suspension of
upstream floodplain material as well as channel
beds; retention time on floodplains is notoriously
difficult to estimate. Riparian zones are known to
be effective traps for sediment and nutrients
transported directly from uplands (National Re-
search Council 2002). Although agriculture is
common in the adjacent uplands of the mid-
Atlantic Coastal Plain, the wide floodplain valleys
of the rivers in this study are unlikely to receive a
large proportion of deposited sediment derived
from upland erosion.
Organic sediment is more likely derived from
autochthonous sources than mineral sediment in
floodplains. Average litterfall rates (Clawson and
others 2001) and leaf decomposition rates (Lockaby
and Walbridge 1998) in forested wetlands of the
southeastern United States would result in the
accumulation of 100 g m-2 y-1 of refractory or-
ganic sediment over the average 3.0 years of an-
nual deposition increments for marker-horizon
deployments in this study. This autochthonous
production and decomposition of organic sediment
is half the amount of organic sediment accumula-
tion typically observed on floodplains in this study
(median = 206 g m-2 y-1), although one site had
organic accumulation rates less than 100 g m-2 y-1.
Although the export of organic matter from flood-
plains is thought to provide a large energy subsidy
to river channel food webs (Junk and others 1989),
these estimates suggest that more than half of the
organic matter deposited in these floodplains comes
from the river. In other words, these floodplains are
net importers of organic matter from the rivers. In
addition to litterfall fluxes, atmospheric deposition
could be a source of deposited nutrients. However,
mean bulk atmospheric deposition of P in the
Chesapeake region (0.04 g m-2 y-1, Jordan and
others 1995) and N in the watersheds of the seven
rivers (1.18 g m-2 y-1, USEPA Watershed Deposi-
tion Tool 1.4.10: National Atmospheric Deposition
Program 2008) was small compared to their
respective sediment depositional fluxes on flood-
plains. Regardless of the ultimate and proximate
source of mineral and organic sediments and
nutrients accumulating on floodplains, these fluxes
represent retention of watershed loads that even-
tually would have been transported downstream,
and therefore represent load interception.
Sediment Erosion
We assume that sediment deposited on these
floodplains represents semi-permanent trapping.
However, floodplains are geomorphically active
Retention of Riverine Sediment and Nutrient Loads 743
environments with large amounts of sediment
entrainment, transport, and deposition (Meade
1982). In our study, only 6–15% of the feldspar
marker-horizons were eroded (Noe and Hupp
2005). Rates of channel migration and sediment
reworking on the floodplain are also slow in the
Coastal Plain of the Chesapeake Bay watershed
(Hupp 2000). The alluvial floodplains of Coastal
Plain rivers are often locations of great amounts of
sediment storage due to the low slope and stream
power below the Fall Line (Phillips and Slattery
2006). The residence time of floodplain sediments
often exceeds 50 years (Meade 1982; Malmon and
others 2002; Phillips and others 2007). Therefore,
most sediment deposited at our study sites likely
will remain in place over time scales relevant to
human management of water quality. Elsewhere,
in higher gradient systems, sediment deposition on
floodplains can be balanced by sediment erosion
through bank erosion (Arp and Cooper 2004;
Schenk and Hupp, in press).
Nutrient Mineralization or Release
After deposition on floodplain soils, sediment-
bound nutrients may undergo diagenesis that could
result in export of N and P back to the main
channel of the river. However, a biogeochemical
bottleneck in these processes is the rate of organic
N and P mineralization, but accurate in situ rates
for wetland soils are unavailable. Laboratory assays
indicate that less than 10% of wetland soil organic
N or P pools are able to be mineralized (Bridgham
and others 1998), suggesting that most particulate
organic N and P deposited on floodplain surfaces is
retained in its solid organic form. If deposited or-
ganic N was mineralized, the fluctuating hydrology
and dynamic redox of floodplain soils is conducive
to the enhancement of coupled N transformations
that eventually result in denitrification (Reddy and
Patrick 1984; Baldwin and Mitchell 2000). Alter-
natively, nitrate produced through mineralization
and nitrification could be transported along
hydrologic flowpaths back into flowing waters and
exported downstream (Bechtold and others 2003).
Deposited organic P also undergoes mineralization
to orthophosphate, which can also desorb from
mineral sediment under low redox conditions
(Wetzel 1999). The orthophosphate produced by
both reactions could either resorb to oxidized sed-
iments or be exported along hydrologic flowpaths
back to the river (Surridge and others 2007). An
alternative pathway for inorganic N or P produced
through mineralization is biotic uptake, followed
by senescence and redeposition of organic nutrients
to floodplain soils (for example, litterfall), resulting
in continued storage and recycling of N and P.
CONCLUSIONS
Non-tidal floodplains along Coastal Plain reaches of
seven rivers in the Chesapeake Bay watershed had
high rates of sediment and sediment-associated
nutrient accumulation relative to their river loads.
These sediment depositional fluxes represent a high
percent retention of N, P, C, and sediment trans-
ported by Coastal Plain rivers. Some uncertainty
exists for scaling from plots to watersheds and for
the permanency and sources of the deposited
material on floodplains; further study would be
required to resolve these issues. However, the
material retained on floodplains still represents a
decrease in loading to downstream systems even if
the source of material depositing on floodplains is
not from the river (that is, riparian buffering in-
stead of riparian retention fluxes). Their high
accumulation rates relative to river loads indicate
that Coastal Plain floodplains have a quantitatively
large role in intercepting and storing watershed
material loads. Therefore, efforts to limit down-
stream sediment and nutrient loading to estuaries
and coastal waters should ensure the function of
floodplains is maintained or enhanced.
ACKNOWLEDGMENTS
This study was funded by the Chesapeake Bay
Priority Ecosystem Science Program, the National
Research Program, and the Hydrologic Networks
and Analysis Program of the USGS. The authors
would like to thank Dan Kroes, Tommy Donelson,
Josh Ewell, and Hana Sanei for assistance in the
field; Kathy Conko, Mike Doughten, and Jimmy
Bae for help in the laboratory; Ed Schenk for esti-
mating floodplain areas and inundation; Allen
Gellis for providing sediment load data; Rich
Alexander for providing SPARROW predictions;
Lauren McPhillips for generating the map; and Rich
Alexander, Charlie Demas, Dorothy Tepper, Des
Walling, and two anonymous reviewers for com-
ments on drafts of the manuscript. Any use of
trade, product, or firm names is for descriptive
purposes only and does not imply endorsement of
the US Government.
REFERENCES
Alexander RB, Boyer EW, Smith RA, Schwarz GE, Moore RB.
2007. The role of headwater streams in downstream water
quality. J Am Water Resour Assoc 43:41–59.
744 G. B. Noe and C. R. Hupp
Alexander RB, Smith RA, Schwarz GE, Boyer EW, Nolan JV,
Brakebill JW. 2008. Differences in phosphorus and nitrogen
delivery to The Gulf of Mexico from the Mississippi River
basin. Environ Sci Technol 42:822–30.
Arp CA, Cooper DJ. 2004. Analysis of sediment retention in
western riverine wetlands: The Yampa River watershed, Col-
orado, USA. Environ Manage 33:318–30.
Baldwin DS, Mitchell AM. 2000. The effects of drying and re-
flooding on the sediment and soil nutrient dynamics of low-
land river-floodplain systems: a synthesis. Regul River Res
Manage 16:457–67.
Baumann RH, Day JW Jr, Miller CA. 1984. Mississippi deltaic
wetland survival: sedimentation versus coastal submergence.
Science 224:1093–5.
Bechtold JS, Edwards RT, Naiman RJ. 2003. Biotic versus
hydrologic control over seasonal nitrate leaching in a flood-
plain forest. Biogeochemistry 63:53–72.
Boomer KB, Weller DE, Jordan TE. 2008. Empirical models
based on the universal soil loss equation fail to predict sedi-
ment discharges from Chesapeake Bay catchments. J Environ
Qual 37:78–89.
Bridgham SD, Megonigal JP, Keller JK, Bliss NB, Trettin C. 2006.
The carbon balance of North American wetlands. Wetlands
26:889–916.
Bridgham SD, Updegraff K, Pastor J. 1998. Carbon, nitrogen, and
phosphorus mineralization in northern wetlands. Ecology
79:1545–61.
Brinson MM. 1988. Strategies for assessing the cumulative ef-
fects of wetland alteration on water quality. Environ Manage
12:655–62.
Brunet RC, Astin KB. 2000. A 12-month sediment and nutrient
budget in a floodplain reach of the River Adour, Southwest
France. Regul River Res Manage 16:267–77.
Clawson RG, Lockaby BG, Rummer B. 2001. Changes in pro-
duction and nutrient cycling across a wetness gradient within
a floodplain forest. Ecosystems 4:126–38.
Craft CB, Casey WP. 2000. Sediment and nutrient accumulation
in floodplain and depressional freshwater wetlands of Georgia,
USA. Wetlands 20:323–32.
Elder JF. 1985. Nitrogen and phosphorus speciation and flux in a
large Florida river wetland system. Water Resour Res 21:724–
32.
Gellis AC, Hupp CR, Pavich MJ, Landwehr JM, Banks WSL,
Hubbard BE, Langland MJ, Ritchie JC, Reuter JM. 2008.
Sources, transport, and storage of sediment at selected sites in
the Chesapeake Bay Watershed. U.S. Geological Survey Sci-
entific Investigations Report 2008-5186.
Harvey JW, Wagner BJ. 2000. Quantifying hydrologic interac-
tions between streams and their subsurface hyporheic zones.
In: Jones JA, Mulholland PJ, Eds. Streams and ground waters.
San Diego: Academic Press. p 3–44.
House WA, Leach D, Warwick MS, Whitton BA, Pattinson SN,
Ryland G, Pinder A, Ingram J, Lishman JP, Smith SM, Rigg E,
Denison FH. 1997. Nutrient transport in the Humber rivers.
Sci Total Environ 194–195:303–20.
Hupp CR. 2000. Hydrology, geomorphology and vegetation of
Coastal Plain rivers in the south-eastern USA. Hydrol Process
14:2991–3010.
Hupp CR, Woodside MD, Yanosky TM. 1993. Sediment and trace
element trapping in a forested wetland, Chickahominy River,
Virginia. Wetlands 13:95–104.
Hupp CR, Demas CR, Kroes DE, Day RH, Doyle TW. 2008. Re-
cent sedimentation patterns within the central Atchafalaya
Basin, Louisiana. Wetlands 28:125–40.
Hupp CR, Pierce A, Noe GB. 2009. Floodplain geomorphic pro-
cesses, sedimentation, and ecological impacts of hydrologic
alteration along Coastal Plain rivers, USA. Wetlands 29:413–
29.
Johnston CA. 1991. Sediment and nutrient retention by fresh-
water wetlands: effects on surface water quality. Crit Rev
Environ Control 21:491–565.
Jordan TE, Correll DL, Weller DE, Goff NM. 1995. Temporal
variation in precipitation chemistry on the shore of Chesa-
peake Bay. Water Air Soil Pollut 83:263–84.
Junk WJ, Bailey PB, Sparks RE. 1989. The flood pulse concept in
river-floodplain systems. Can Spl Publ Fish Aquat Sci
106:110–27.
Kleiss BA. 1996. Sediment retention in a bottomland hardwood
wetland in eastern Arkansas. Wetlands 16:321–33.
Langland MJ, Raffensperger JP, Moyer DL, Landwehr JM, Sch-
warz GE. 2006. Changes in streamflow and water quality in
selected nontidal basins in the Chesapeake Bay watershed,
1985–2004. Reston, VA: USGS SIR-2006-5178.
Lockaby BG, Walbridge MR. 1998. Biogeochemistry. In: Messina
MG, Conner WH, Eds. Southern forested wetlands—ecology
and management. Boca Raton: Lewis Publishers. p 149–72.
Malmon DV, Dunne T, Reneau SL. 2002. Predicting the fate of
sediment and pollutants in river floodplains. Environ Sci
Technol 36:2026–32.
McClain ME, Boyer EW, Dent CL, Gergel SE, Grimm NB,
Groffman PM, Hart SC, Harvey JW, Johnston CA, Mayorga E,
McDowell WH, Pinay G. 2003. Biogeochemical hot spots and
hot moments at the interface of terrestrial and aquatic eco-
systems. Ecosystems 6:301–12.
Meade RH. 1982. Sources, sinks, and storage of river sediment in
the Atlantic drainage of the United States. J Geol 90:235–52.
Mitsch WJ, Day JW, Zhang L, Lane R. 2005. Nitrate–nitrogen
retention in wetlands in the Mississippi River basin. Ecol Eng
24:267–78.
National Atmospheric Deposition Program (NRSP-3). 2008.
NADP Program Office, Illinois State Water Survey, 2204
Griffith Dr., Champaign, IL 61820.
National Research Council. 2002. Riparian areas: functions and
strategies for management. Washington, DC: National Acad-
emy Press.
Noe GB, Hupp CR. 2005. Carbon, nitrogen, and phosphorus
accumulation in floodplains of Atlantic coastal plain rivers,
USA. Ecol Appl 15:1178–90.
Olde Venterink H, Vermaat JE, Pronk M, Wiegman F, Van der
Lee GEM, Van den Hoorn MW, Higler LWG, Verhoeven JTA.
2006. Importance of sediment deposition and denitrification
for nutrient retention in floodplain wetlands. Appl Veg Sci
9:163–74.
Owens PN, Walling DE. 2002. Changes in sediment sources and
floodplain deposition rates in the catchment of the River
Tweed, Scotland, over the last 100 years: the impact of climate
and land use change. Earth Surf Proc Land 27:423–30.
Phillips JD. 1989. Fluvial sediment storage in wetlands. Water
Resour Bull 25:867–73.
Phillips JD, Slattery MC. 2006. Sediment storage, sea level, and
sediment delivery to the ocean by coastal plain rivers. Prog
Phys Geogr 30:513–30.
Retention of Riverine Sediment and Nutrient Loads 745
Phillips JD, Marden M, Gomez B. 2007. Residence time of
alluvium in an aggrading fluvial system. Earth Surf Proc Land
32:307–16.
Raymond PA, Bauer JE. 2001. Riverine export of aged terrestrial
organic matter to the North Atlantic Ocean. Nature 409:497–
500.
Reddy KR, Patrick WH. 1984. Nitrogen transformations and loss
in flooded soils and sediment. CRC Crit Rev Environ Control
13:273–309.
Richardson WB, Strauss EA, Bartsch LA, Monroe EM, Cava-
naugh JC, Vingum L, Soballe DM. 2004. Denitrification in the
Upper Mississippi River: rates, controls, and contribution to
nitrate flux. Can J Fish Aquat Sci 61:1102–12.
Ross KM, Hupp CR, Howard AD. 2004. Sedimentation in
floodplains of selected tributaries of the Chesapeake Bay. In:
Bennett S, Simon A, Eds. Riparian vegetation and fluvial
geomorphology. Washington, DC: American Geophysical
Union. p 187–208.
Royer TV, David MG, Gentry LE. 2006. Timing of riverine export
of nitrate and phosphorus from agricultural watersheds in
Illinois: implications for reducing nutrient loading to the
Mississippi River. Environ Sci Technol 40:4126–31.
Schenk ER, Hupp CR. Legacy effects of colonial millponds on
modern floodplain sedimentation, bank erosion, and channel
morphology, Mid Atlantic Region, USA. J Am Water Resour
Assoc (in press).
Scott DT, Harvey JW, Noe GB. Combined effect of hydrologic
connectivity and floodplain nitrogen processing on removal of
nitrogen from a 5th order southeastern US river. J Geophys
Res Biogeosci (unpublished).
Steiger J, Gurnell AM, Goodson JM. 2003. Quantifying and
characterizing contemporary riparian sedimentation. River
Res Appl 19:335–52.
Surridge BWJ, Heathwaite AL, Baird AJ. 2007. The release of
phosphorus to porewater and surface water from river ripar-
ian sediments. J Environ Qual 36:1534–44.
Sweet WV, Geratz JW. 2003. Bankfull hydraulic geometry
relationships and recurrence intervals for North Carolina’s
coastal plain. J Am Water Resour Assoc 39:861–71.
Tockner K, Pennetzdorfer D, Reiner N, Schiemer F, Ward JV.
1999. Hydrological connectivity and the exchange of organic
matter and nutrients in a dynamic river-floodplain system
(Danube, Austria). Freshw Biol 41:521–35.
van der Lee GEM, Olde Venterink H, Asselman NEM. 2004.
Nutrient retention in floodplains of the Rhine distributaries in
the Netherlands. River Res Appl 20:315–25.
Walling DE, Quine TA. 1993. Using Chernobyl-derived fallout
radionuclides to investigate the role of downstream convey-
ance losses in the suspended sediment budget of the River
Severn, United Kingdom. Phys Geogr 14:239–53.
Walling DE, Owens PN, Leeks GJL. 1998. The role of channel
and floodplain storage in the suspended sediment budget of
the River Ouse, Yorkshire, UK. Geomorphology 22:225–42.
Walling DE, Owens PN, Leeks GJL. 1999. Rates of contemporary
overbank sedimentation and sediment storage on the flood-
plains of the main channel systems of the Yorkshire Ouse and
River Tweed, UK. Hydrol Process 13:993–1009.
Walter RC, Merritts DJ. 2008. Natural streams and the legacy of
water-powered mills. Science 319:299–304.
Wetzel RG. 1999. Organic phosphorus mineralization in soils
and sediments. In: Reddy KR, O’Connor GA, Schelske CL, Eds.
Phosphorous biogeochemistry in subtropical ecosystems. Boca
Raton: Lewis Publishers. p 225–48.
Xu YJ. 2006. Organic nitrogen retention in the Atchafalaya River
Swamp. Hydrobiologia 560:133–43.
746 G. B. Noe and C. R. Hupp