Embed Size (px)
Citation preview
1
RETHINKING ASEANDISPELLING 8 MYTHS ABOUT CONSUMER MARKETSJULY 2017
Copyright © 2017 The Nielsen Company (US), LLC. Confidential and proprietary. Do not distribute.
2
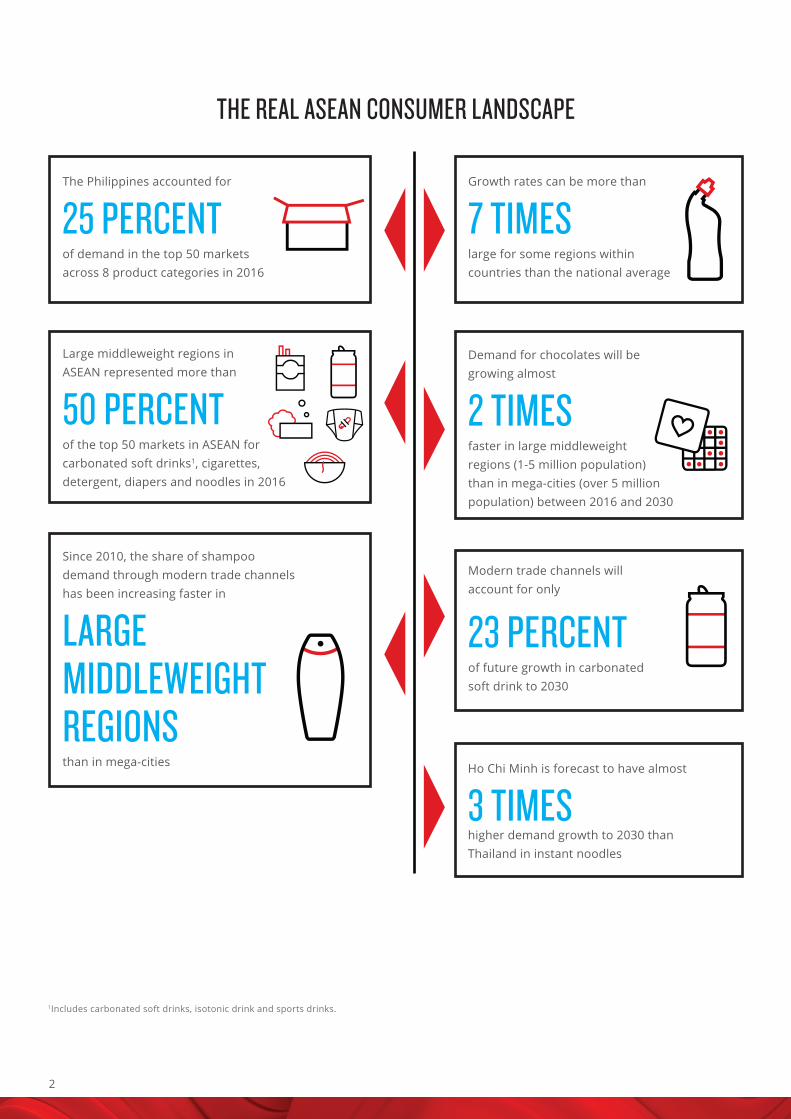
THE REAL ASEAN CONSUMER LANDSCAPE
Growth rates can be more than
7 TIMES large for some regions within countries than the national average
Demand for chocolates will be growing almost
2 TIMES faster in large middleweight regions (1-5 million population) than in mega-cities (over 5 million population) between 2016 and 2030
Modern trade channels will account for only
23 PERCENTof future growth in carbonated soft drink to 2030
The Philippines accounted for
25 PERCENT of demand in the top 50 markets across 8 product categories in 2016
Large middleweight regions in ASEAN represented more than
50 PERCENT of the top 50 markets in ASEAN for carbonated soft drinks1, cigarettes, detergent, diapers and noodles in 2016
Since 2010, the share of shampoo demand through modern trade channels has been increasing faster in
LARGE MIDDLEWEIGHT REGIONS than in mega-cities
1Includes carbonated soft drinks, isotonic drink and sports drinks.
Ho Chi Minh is forecast to have almost
3 TIMES higher demand growth to 2030 than Thailand in instant noodles
3Copyright © 2017 The Nielsen Company (US), LLC. Confidential and proprietary. Do not distribute.
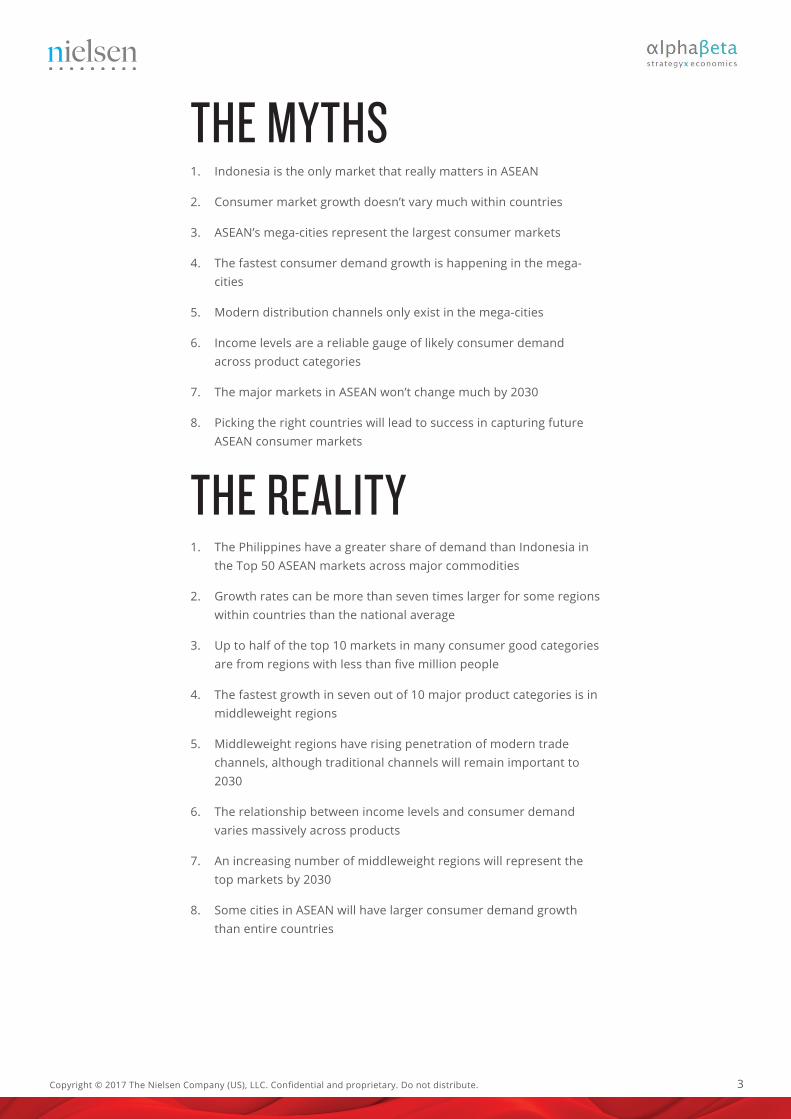
THE MYTHS1. Indonesia is the only market that really matters in ASEAN
2. Consumer market growth doesn’t vary much within countries
3. ASEAN’s mega-cities represent the largest consumer markets
4. The fastest consumer demand growth is happening in the mega-cities
5. Modern distribution channels only exist in the mega-cities
6. Income levels are a reliable gauge of likely consumer demandacross product categories
7. The major markets in ASEAN won’t change much by 2030
8. Picking the right countries will lead to success in capturing futureASEAN consumer markets
THE REALITY1. The Philippines have a greater share of demand than Indonesia in
the Top 50 ASEAN markets across major commodities
2. Growth rates can be more than seven times larger for some regionswithin countries than the national average
3. Up to half of the top 10 markets in many consumer good categoriesare from regions with less than five million people
4. The fastest growth in seven out of 10 major product categories is inmiddleweight regions
5. Middleweight regions have rising penetration of modern tradechannels, although traditional channels will remain important to2030
6. The relationship between income levels and consumer demandvaries massively across products
7. An increasing number of middleweight regions will represent thetop markets by 2030
8. Some cities in ASEAN will have larger consumer demand growththan entire countries
4
OVERVIEWThe Association of Southeast Asian Nations (ASEAN) is a coalition of 10 diverse nations: Brunei, Cambodia, Indonesia, Laos, Malaysia, Myanmar, the Philippines, Singapore, Thailand, and Vietnam. ASEAN has enjoyed remarkable economic progress in recent years. Viewed as a single entity, the region would rank as the sixth-largest economy in the world, and the second largest destination for Foreign Direct Investment (FDI). Given a young population, the economic benefits from increased regional integration, the potential gain from digital technologies, and a rapidly urbanizing population, the future prospects for ASEAN are strong. However, despite the current economic importance of ASEAN and these positive economic tailwinds, surprisingly little is known about the many cities and regions that comprise this archipelago. The 625 million people of ASEAN represent a multitude of ethnicities, languages, and religions.
To shed light on the real ASEAN, AlphaBeta (a leading economic strategy firm) and Nielsen (a global performance measurement company), have worked together to conduct detailed economic analysis to understand the current and future potential consumer demand for over 700 cities and regions within the seven largest economies of ASEAN: Indonesia, Malaysia, Myanmar, Philippines, Singapore, Thailand and Vietnam. Our analysis covered 10 of the most popular consumer product categories: chocolate, instant noodles, soft drink1, beer, cigarettes, shampoo, laundry detergent, baby diapers, facial moisturizer, and vitamins.
The results are surprising and even seasoned ASEAN business leaders may need to reset their intuition about what is happening with consumer demand in ASEAN. Think you know ASEAN? Think again.
1Includes carbonated soft drinks, isotonic drink and sports drinks.

5Copyright © 2017 The Nielsen Company (US), LLC. Confidential and proprietary. Do not distribute.
METHODOLOGYConsumer demand is generally estimated at the national level. Yet increasingly, a more granular view of demand is required to identify the substantial differences in growth rates of regions within countries. To understand the consumer demand prospects of regions within ASEAN, we adopted a three-step approach:
Step 1: Understand the relationship between product demand and economic data
AlphaBeta has a detailed economic database for 1,021 regions within the 10 ASEAN Member States. This database is constructed based on a range of data sources, including local government economic statistics and macroeconomic data from the International Monetary Fund and the World Bank, and validated with AlphaBeta analysis to ensure the robustness of the results. This data was combined with Nielsen consumer demand data for 10 product categories (chocolate, instant noodles, soft drink1, beer, cigarettes, shampoo, detergent, baby diapers, facial moisturizer, and vitamins) in seven ASEAN Member States (Indonesia, Malaysia, Myanmar, Philippines, Singapore, Thailand, and Vietnam). The Nielsen data was originally available for 35 regions within these countries. The Nielsen data was extrapolated to proxy for non-measured channels by product category and market. The relationship between this consumer demand and the economic data (known as the “product adoption curve”) was analyzed, including examining the relationship between product demand for the 10 categories and different GDP and consumption measures (e.g., purchasing power parity which adjusts for local price levels versus exchange-rate converted measures). Product adoption curves were then constructed for each of the 10 product categories, allowing for country-specific effects which could impact demand at different income levels.
Step 2: Break down Nielsen’s regional product data into more granular, sub-regional splits
Using the historical sub-regional economic data in the AlphaBeta ASEAN database and these product adoption curves, estimates of demand for each of the 10 product categories were estimated for between 524-747 regions (depending on the product category) in the seven ASEAN Member States.
Step 3: Forecast future sub-regional demand growth
The AlphaBeta ASEAN database has forecasted sub-regional consumption and GDP data to 2030, which draws upon historical sub-regional growth trajectories, which are then adjusted for the future forecasted macroeconomic changes at the country level (from the International Monetary Fund). The sub-regional forecasts are further
1Includes carbonated soft drinks, isotonic drink and sports drinks.

6
adjusted based on expert input in instances where past growth does not give a reliable forecast of the future for certain sub-regions (e.g., past growth was driven by a short-term natural resource boom). These economic forecasts were then combined with the product adoption curves estimated in Step 1 to produce forecasts of consumer demand for the 10 product categories in the regions. This data is updated quarterly as new economic data and Nielsen product data becomes available.
7Copyright © 2017 The Nielsen Company (US), LLC. Confidential and proprietary. Do not distribute.
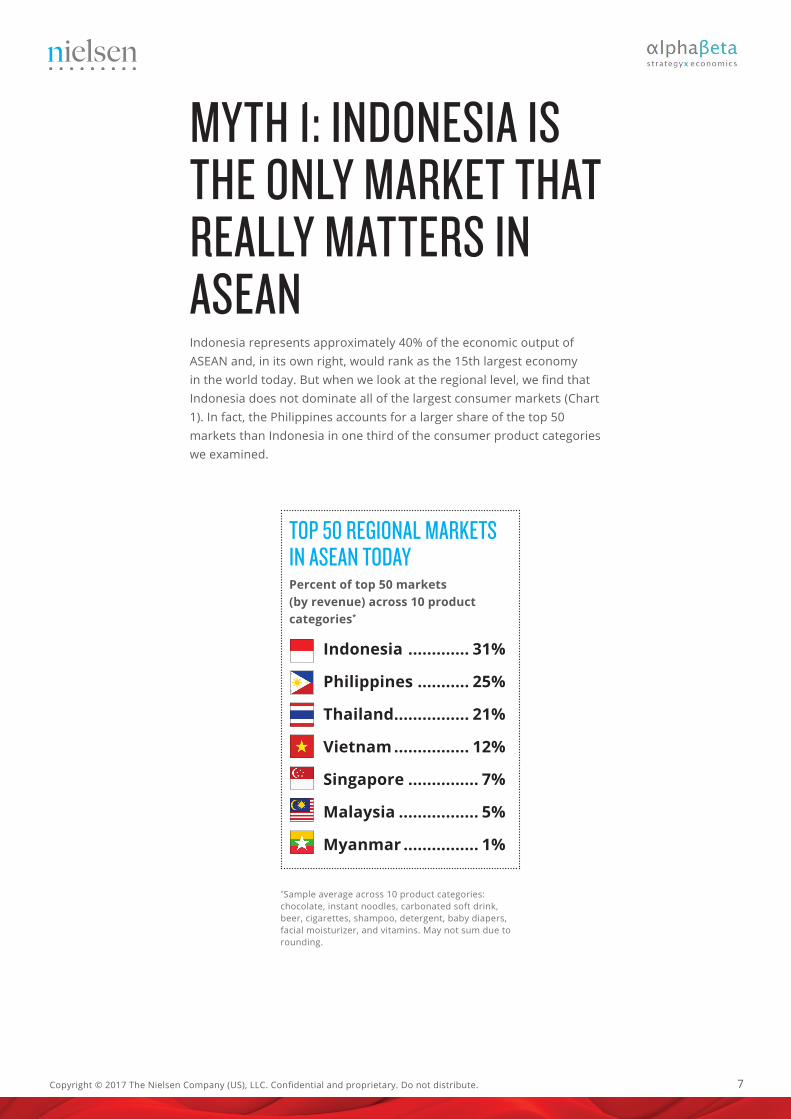
MYTH 1: INDONESIA IS THE ONLY MARKET THAT REALLY MATTERS IN ASEANIndonesia represents approximately 40% of the economic output of ASEAN and, in its own right, would rank as the 15th largest economy in the world today. But when we look at the regional level, we find that Indonesia does not dominate all of the largest consumer markets (Chart 1). In fact, the Philippines accounts for a larger share of the top 50 markets than Indonesia in one third of the consumer product categories we examined.
TOP 50 REGIONAL MARKETS IN ASEAN TODAYPercent of top 50 markets (by revenue) across 10 product categories*
Indonesia ............. 31%
Philippines ........... 25%
Thailand ................ 21%
Vietnam ................ 12%
Singapore ............... 7%
Malaysia ................. 5%
Myanmar ................ 1%
*Sample average across 10 product categories:chocolate, instant noodles, carbonated soft drink, beer, cigarettes, shampoo, detergent, baby diapers, facial moisturizer, and vitamins. May not sum due to rounding.
8
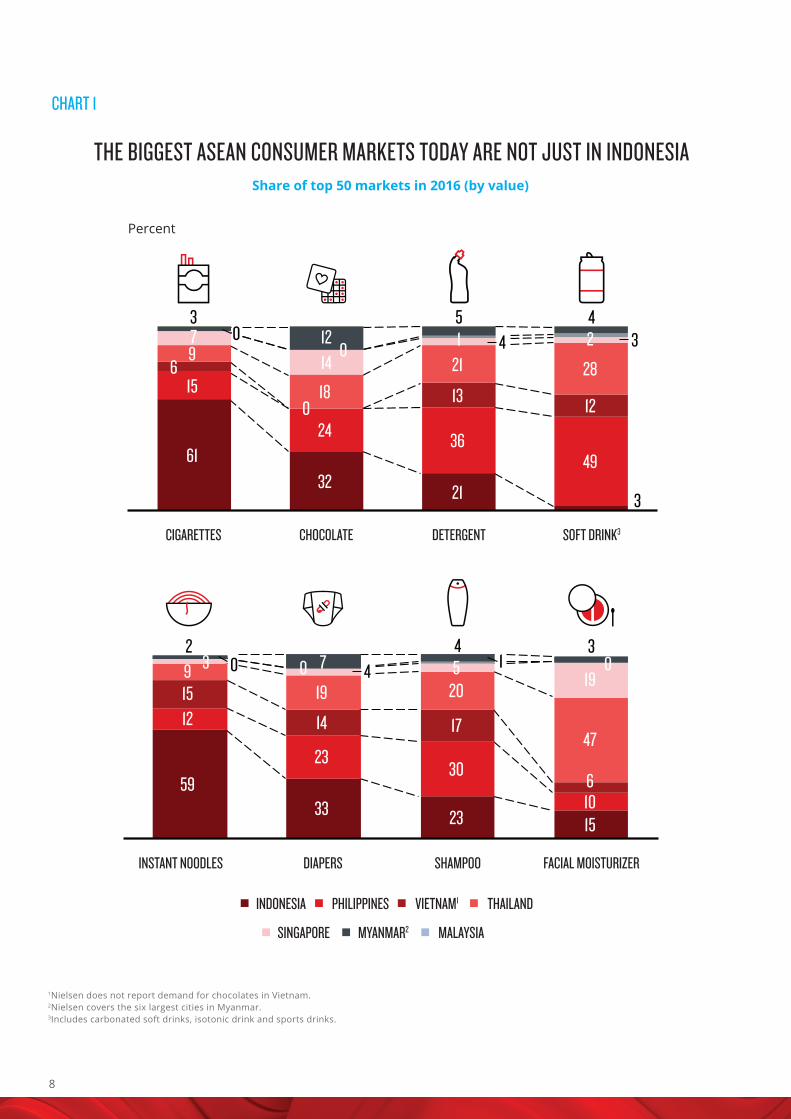
CHART 1
1Nielsen does not report demand for chocolates in Vietnam.2Nielsen covers the six largest cities in Myanmar.3Includes carbonated soft drinks, isotonic drink and sports drinks.
THE BIGGEST ASEAN CONSUMER MARKETS TODAY ARE NOT JUST IN INDONESIAShare of top 50 markets in 2016 (by value)
Percent
SOFT DRINK3
MALAYSIA
INDONESIA PHILIPPINES VIETNAM1 THAILAND
SINGAPORE MYANMAR2
CIGARETTES CHOCOLATE DETERGENT
FACIAL MOISTURIZERINSTANT NOODLES DIAPERS SHAMPOO
6 9
4
49
12
3
28
2 21 1
32
13
0
0 18
14
5
0 12
24
15
4
21
36
3 7
61
3
19 12 15 9 02
59
4 3
23
14
19 7
4
33
20
30
23
35
10 6
15
17
1 0
47
0
9Copyright © 2017 The Nielsen Company (US), LLC. Confidential and proprietary. Do not distribute.
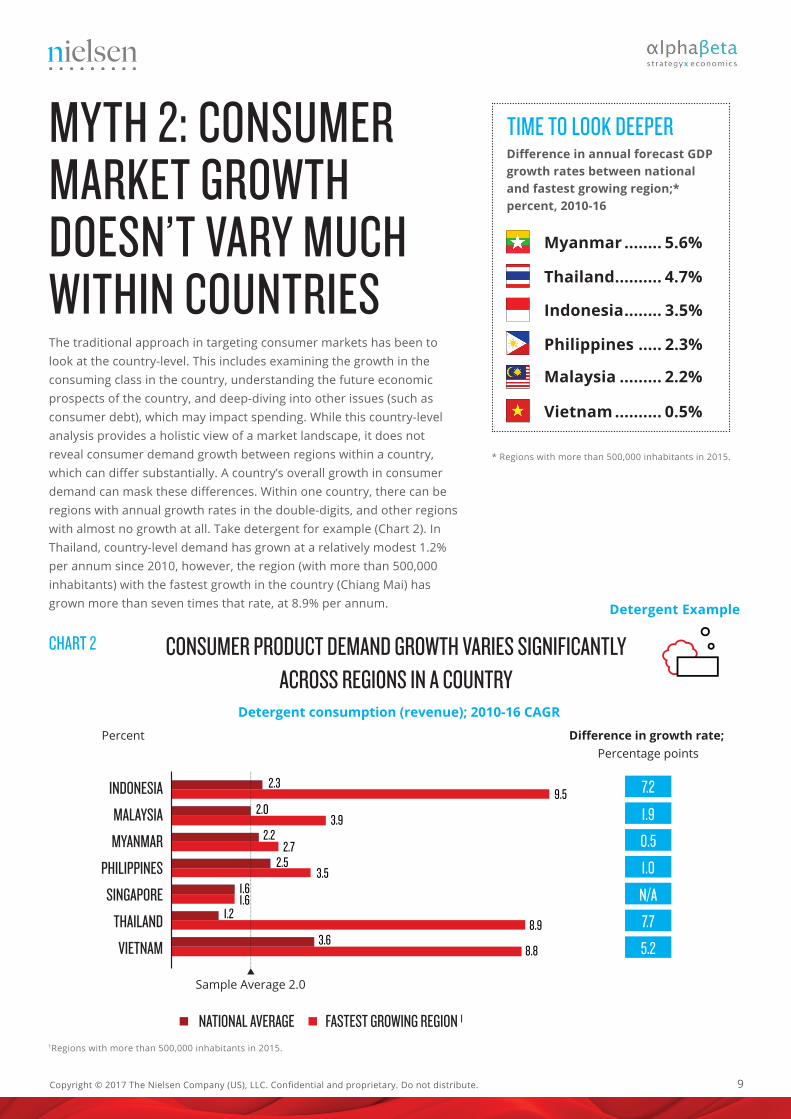
MYTH 2: CONSUMER MARKET GROWTH DOESN’T VARY MUCH WITHIN COUNTRIESThe traditional approach in targeting consumer markets has been to look at the country-level. This includes examining the growth in the consuming class in the country, understanding the future economic prospects of the country, and deep-diving into other issues (such as consumer debt), which may impact spending. While this country-level analysis provides a holistic view of a market landscape, it does not reveal consumer demand growth between regions within a country, which can differ substantially. A country’s overall growth in consumer demand can mask these differences. Within one country, there can be regions with annual growth rates in the double-digits, and other regions with almost no growth at all. Take detergent for example (Chart 2). In Thailand, country-level demand has grown at a relatively modest 1.2% per annum since 2010, however, the region (with more than 500,000 inhabitants) with the fastest growth in the country (Chiang Mai) has grown more than seven times that rate, at 8.9% per annum.
CHART 2
TIME TO LOOK DEEPERDifference in annual forecast GDP growth rates between national and fastest growing region;* percent, 2010-16
Myanmar ........ 5.6%
Thailand .......... 4.7%
Indonesia ........ 3.5%
Philippines ..... 2.3%
Malaysia ......... 2.2%
Vietnam .......... 0.5%
* Regions with more than 500,000 inhabitants in 2015.
Detergent consumption (revenue); 2010-16 CAGR
CONSUMER PRODUCT DEMAND GROWTH VARIES SIGNIFICANTLY ACROSS REGIONS IN A COUNTRY
MALAYSIA
INDONESIA
PHILIPPINES
VIETNAM
THAILAND
SINGAPORE
MYANMAR
NATIONAL AVERAGE FASTEST GROWING REGION
Difference in growth rate; Percentage points
Percent
Sample Average 2.0
7.2
1.9
0.5
1.0
N/A
7.7
5.2
1
2.3
2.0
2.2
2.5
1.6
1.2
3.6
3.9
9.5
2.7
3.5
1.6
8.9
8.8
1Regions with more than 500,000 inhabitants in 2015.
Detergent Example

10
THE POWER OF THE LARGE MIDDLEWEIGHTSShare of demand in top 50 markets originating from large middleweight regions in 2016*
*Large middleweight regions are defined as regions with a population of more than 1 million and less than 5 million inhabitants in 2015.1Includes carbonated soft drinks, isotonic drink and sports drinks.
MYTH 3: ASEAN’S MEGA-CITIES REPRESENT THE LARGEST CONSUMER MARKETSWhen most companies and investors think of ASEAN, they typically think of mega-cities such as Jakarta, Manila and Bangkok. While these mega-cities (which have a population of more than five million) are indeed important consumer markets, they do not dominate consumer demand. In fact, for many product categories, middleweight regions (with a population between 500,000 and five million) are important markets for consumer demand (Chart 3). Take facial moisturizer as an example. While Bangkok and Singapore are the two largest markets, less well-known markets such as Nakhon Ratchasima, Chonburi, and Rayong (all in Thailand) are also among the top 10 markets in ASEAN.
Noodles ...............60%
Soft drink1 ...........56%
Cigarettes ............55%
Diapers ................53%
Detergent ............52%
Shampoo .............47%
Beer ......................44%
Vitamins ..............43%
Chocolate ............41%
Moisturizer ..........30%
THE BIGGEST ASEAN CONSUMER MARKETS TODAY ARE NOT JUST IN THE MEGA-CITIES
CHART 3
ASEAN sub-regions ranked by consumption (revenue) in 2016
Selected Categories
Ranking Beer Soft drink3 Chocolates Cigarettes Moisturizer
1 Bangkok Manila Manila Jakarta Bangkok
2 Singapore Bangkok Singapore Bangkok Singapore
3 Ho Chi Minh City Ho Chi Minh City Bangkok Singapore Jakarta
4 Hanoi + Ha Tay Cebu Jakarta Manila Manila
5 Nakhon Ratchasima Singapore Kuala Lumpur Ho Chi Minh City Ho Chi Minh City
6 Dong Nai Kuala Lumpur Bandung Kota Karawang Kab Nakhon Ratchasima
7 Chiang Mai Jakarta Surabaya Kota Kuala Lumpur Chonburi
8 Da Nang Cavite Karawang Kab Bogor Kab Kuala Lumpur
9 Nghe An Negros Occidental Bekasi Kab Bandung Kota Rayong
10 Binh Duong Hanoi + Ha Tay Petaling Surabaya Kota Hanoi + Ha Tay
Mega-cities1 Middleweights2
1Regions with a population of more than 5 million inhabitants in 2015.2Regions with a population of more than 500,00 and less than 5 million inhabitants in 2015.3Includes carbonated soft drinks, isotonic drinks and sport drinks.

11Copyright © 2017 The Nielsen Company (US), LLC. Confidential and proprietary. Do not distribute.
MYTH 4: THE FASTEST CONSUMER DEMAND GROWTH IS HAPPENING IN THE MEGA-CITIESIt is often assumed that the fastest consumer demand growth is happening in the mega-cities of ASEAN. Even since 2010, this was not the case for five of the 10 product categories examined. In the future, it will definitely not be the case. Across seven of the product categories examined, the fastest growth is likely to happen in either small (500,000 to one million people) or large (one to five million people) middleweight regions. Take chocolates as an example, large middleweight regions will experience the fastest growth rate to 2030.
CHART 4
IN WHICH REGIONS IS PRODUCT DEMAND LIKELY TO GROW FASTER?Fastest forecast growth per product category; 2016-30*
*See exhibit 4 for definitions.
Large Middleweights
Large Middleweights
Large Middleweights
Large Middleweights
Mega-cities
Small regions
Large Middleweights
Mega-cities
Large Middleweights
Large Middleweights
LARGE MIDDLEWEIGHTS WILL BECOME THE FASTEST GROWING GROUP FOR CHOCOLATESCompound annual growth rate of chocolate demand1 (based on revenue); percent
2010-2016Population size
MEGA-CITIES5 million and above
LARGE MIDDLEWEIGHTS 1 million—5 million
SMALL MIDDLEWEIGHTS 500,000—1 million
SMALL REGIONS300,000—500,000
RURAL REGIONSBelow 300,000
TOTAL
2016-2030
# of regions2016
Share of consumption 2016 (US$)
2.64.4 31%5
16%140
9%323
37%122
7%116
706
4.14.2
4.33.9
4.03.8
4.14.3
5.14.5
Chocolates Example
12
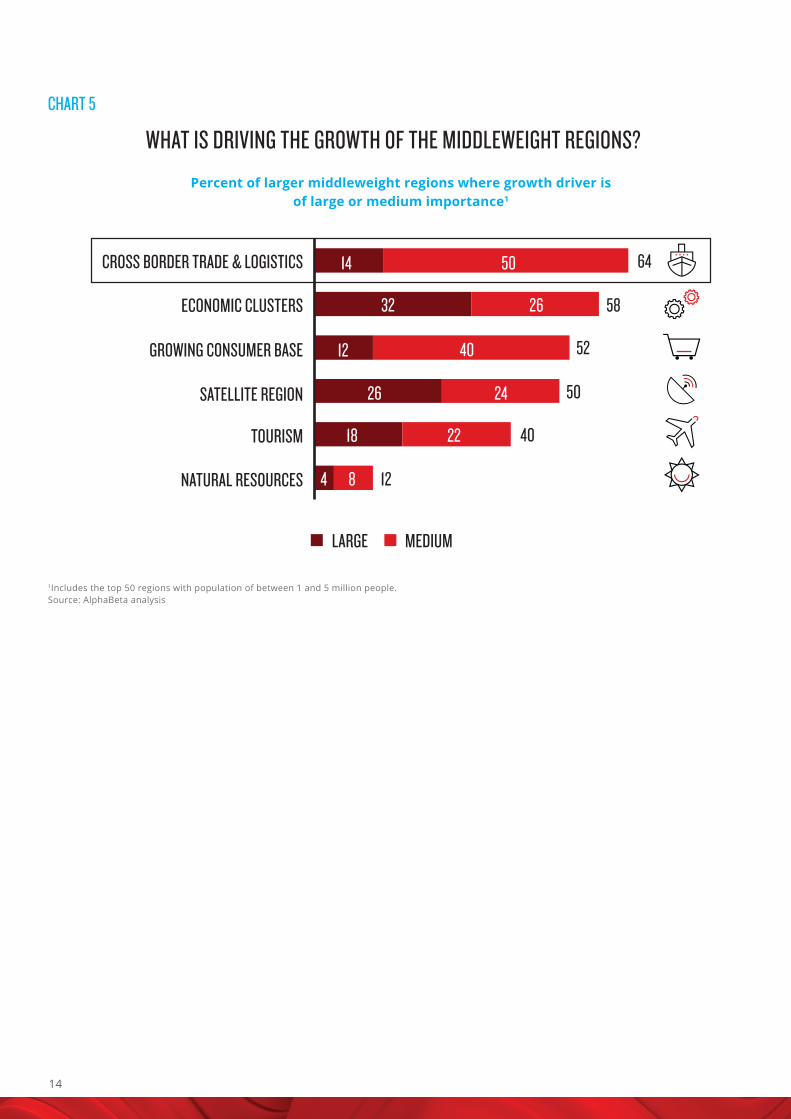
WHAT IS DRIVING THE GROWTH OF THESE MIDDLEWEIGHT REGIONS?Understanding the forces driving growth in middleweight regions is important in understanding past growth as well as identifying sustainability of those growth trajectories. For example, in some regions, past growth has been driven by a natural resource boom, which may not be replicable in the future.
Within ASEAN’s large middleweight regions there are six main drivers of growth:
1. Cross-border trade and logistics. Given its proximity to India, China, and Japan, ASEAN is well positioned to benefit from all types of global flows and by 2025, more than half of the world’s consuming class will live within a five-hour flight of Myanmar*. Further supporting this growth are factors such as the ASEAN Economic Community (AEC) with its emphasis on promoting the free flow of goods, services, and investment among ASEAN Member States, and major trade deals with other countries outside ASEAN. The large middleweight regions which have benefited most are those on major maritime or land transit routes such as Cebu in the Philippines and Johor in Malaysia, as well as regions that benefit from cross-border trade, such as Khon Kaen and Chiang Rai in northern Thailand.
2. Economic clusters. Export Processing Zones (EPZs), SpecialEconomic Zones (SEZ), and Business Processing Outsourcing (BPO)areas have been established across ASEAN. Beyond the Philippines,which has achieved significant growth in BPO, other economicclusters have also been supporting sub-regional growth in ASEAN,including the Batam Free Trade Zone (Singapore-Indonesia), theSouthern Regional Industrial Estate (Thailand), the Tanjung EmasExport Processing Zone (Indonesia), the Port Klang Free Zone(Malaysia), the Thilawa Special Economic Zone (Myanmar), and theThan Thuan Export Processing Zone (Vietnam).
3. Satellite regions. As the mega-cities of ASEAN become increasingly congested and the cost of living rises, nearby regions which are in a commutable distance from these mega-cities are benefiting. These regions, known as satellite regions, include the likes of Bekasi and Tangerang in Indonesia, and Cavite and Bulacan in the Philippines.
4. Natural resources. ASEAN is rich in natural resources. In termsof resource endowments, ASEAN ranks amongst the highest inthe world for the production of numerous energy, mineral andagricultural commodities, and additionally has large fresh-waterreserves. The commodity super-cycle, supported by the rise ofChina, has led to rapid demand for natural resources and createda large tailwind of growth for many resource-rich regions. Someof the largest beneficiaries of the resources boom are small

13Copyright © 2017 The Nielsen Company (US), LLC. Confidential and proprietary. Do not distribute.
middleweight regions (such as Pekanbaru and Balikpapan in Indonesia), although there have been large middleweight regions such as Makassar where natural resources have also been important for supporting growth and consumption.
5. Tourism. The growth in the consuming class in ASEAN and otherparts of Asia has fuelled tourism in the region. Tourism growth inASEAN is being further supported by the entrance of a number oflow-cost airlines such as Lion Air, AirAsia, and Tiger Airways and bythe gradual but ongoing removal of visa requirements for short-term travel by ASEAN citizens in member states. Roughly 44% oftourist arrivals in ASEAN are from other ASEAN member states,and the total number of intra-ASEAN tourists has been growing ata rapid 8% per annum since 2011. The World Travel and TourismCouncil (WTTC) forecasts the tourism sector in Southeast Asiacould grow to over $200 billion by 2025, almost double today’slevels2. Many large middleweight regions have benefited from thesetourism trends, including in Indonesia (e.g., Yogyakarta, Bandung),and Myanmar (e.g., Yangon, Mandalay).
6. Growing consumer base. A final driver is related to a growinglocal consumer base. Many regions in ASEAN have benefitedfrom urbanization which has driven not only increases in totalpopulation, but also supported growth by leveraging economies ofscale. The productivity of a city with 200,000 people is, on average,3- 8% higher than one with 100,000 residents.3
In many sub-regions, a combination of these drivers were important for the historical growth trajectory. Overall, the most important drivers were cross-border trade and logistics, economic clusters and a growing consumer base (Chart 5). Notably, these drivers are likely to be more sustainable going forward than other drivers such as natural resources, given the current state of the commodity cycle.
1Defined as households with more than US$7,500 in annual income (in 2005 purchasing power parity terms).2Travel & Tourism Economic Impact 2015: Southeast Asia, World Travel and Tourism Council, 2015.3 Stuart S. Rosenthal and William C. Strange, “Evidence on the nature and sources of agglomeration economies,” in Handbook of urban and regional economics, 1st ed., volume 4, J. V. Henderson and J. F. Thisse, eds., Elsevier, 2004.
14
CHART 5
WHAT IS DRIVING THE GROWTH OF THE MIDDLEWEIGHT REGIONS?
1Includes the top 50 regions with population of between 1 and 5 million people.Source: AlphaBeta analysis
Percent of larger middleweight regions where growth driver is of large or medium importance1
CROSS BORDER TRADE & LOGISTICS
ECONOMIC CLUSTERS
GROWING CONSUMER BASE
SATELLITE REGION
TOURISM
NATURAL RESOURCES
LARGE MEDIUM
12
40
50
52
58
64
84
2218
24
4012
14
26
2632
50
15Copyright © 2017 The Nielsen Company (US), LLC. Confidential and proprietary. Do not distribute.
CHART 6
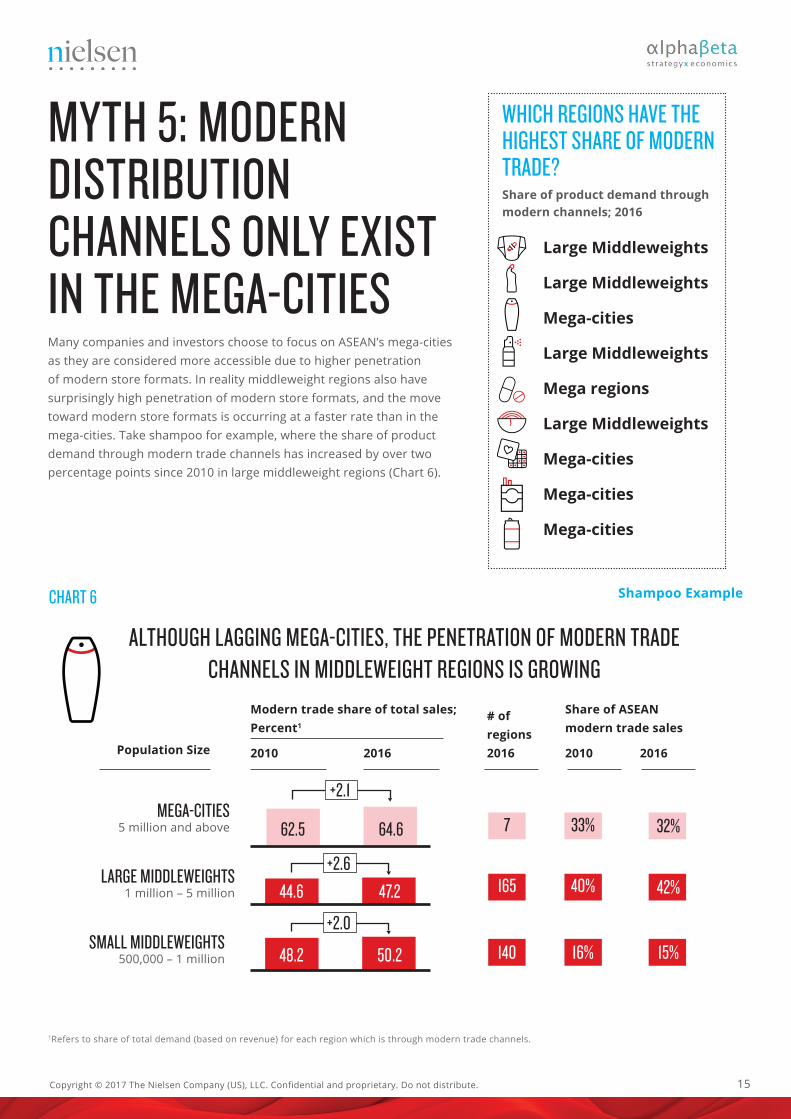
MYTH 5: MODERN DISTRIBUTION CHANNELS ONLY EXIST IN THE MEGA-CITIESMany companies and investors choose to focus on ASEAN’s mega-cities as they are considered more accessible due to higher penetration of modern store formats. In reality middleweight regions also have surprisingly high penetration of modern store formats, and the move toward modern store formats is occurring at a faster rate than in the mega-cities. Take shampoo for example, where the share of product demand through modern trade channels has increased by over two percentage points since 2010 in large middleweight regions (Chart 6).
WHICH REGIONS HAVE THE HIGHEST SHARE OF MODERN TRADE?Share of product demand through modern channels; 2016
Large Middleweights
Large Middleweights
Mega-cities
Large Middleweights
Mega regions
Large Middleweights
Mega-cities
Mega-cities
Mega-cities
ALTHOUGH LAGGING MEGA-CITIES, THE PENETRATION OF MODERN TRADE CHANNELS IN MIDDLEWEIGHT REGIONS IS GROWING
MEGA-CITIES5 million and above
LARGE MIDDLEWEIGHTS 1 million – 5 million
SMALL MIDDLEWEIGHTS 500,000 – 1 million
Modern trade share of total sales; Percent1
2010Population Size 2016 2010 2016
# of regions2016
Share of ASEAN modern trade sales
32%33%7
42%40%165
15%16%140
62.5
44.6
48.2
64.6
47.2
50.2
+2.6
+2.1
+2.0
1Refers to share of total demand (based on revenue) for each region which is through modern trade channels.
Shampoo Example
16
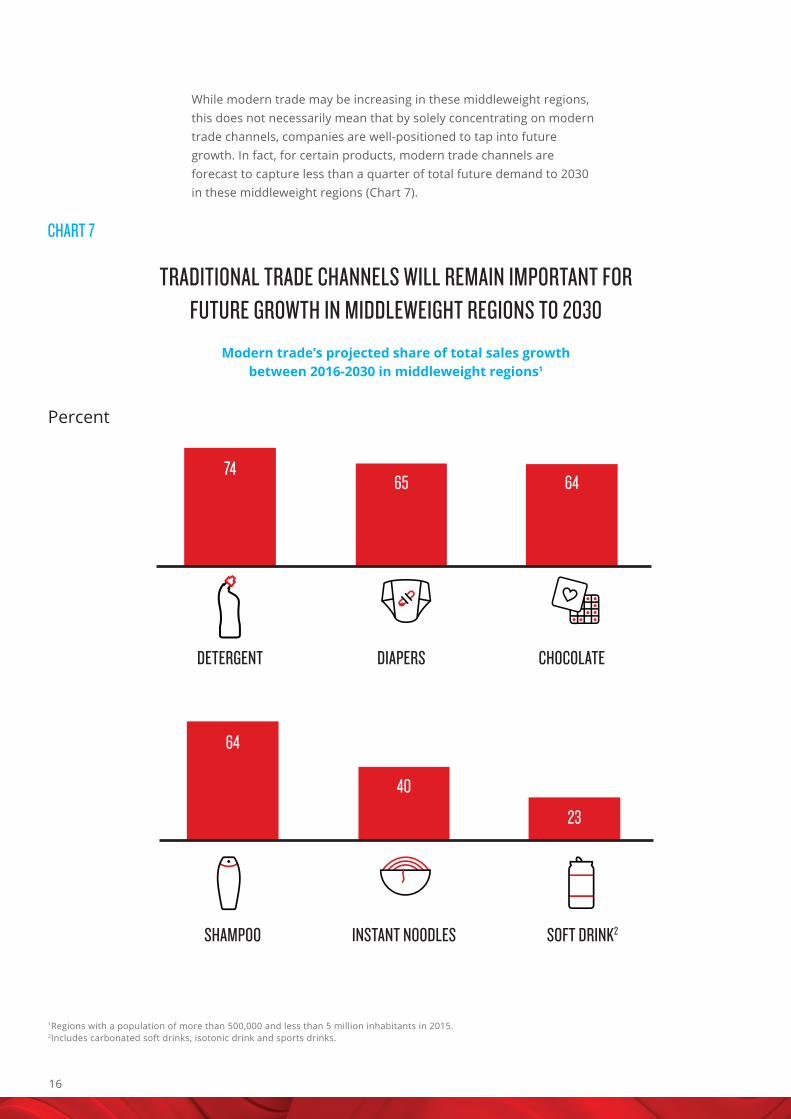
While modern trade may be increasing in these middleweight regions, this does not necessarily mean that by solely concentrating on modern trade channels, companies are well-positioned to tap into future growth. In fact, for certain products, modern trade channels are forecast to capture less than a quarter of total future demand to 2030 in these middleweight regions (Chart 7).
CHART 7
TRADITIONAL TRADE CHANNELS WILL REMAIN IMPORTANT FOR FUTURE GROWTH IN MIDDLEWEIGHT REGIONS TO 2030
Modern trade’s projected share of total sales growth between 2016-2030 in middleweight regions1
1Regions with a population of more than 500,000 and less than 5 million inhabitants in 2015.2Includes carbonated soft drinks, isotonic drink and sports drinks.
DETERGENT
SHAMPOO
DIAPERS
INSTANT NOODLES
CHOCOLATE
SOFT DRINK2
74
64
65
40
64
23
Percent

17Copyright © 2017 The Nielsen Company (US), LLC. Confidential and proprietary. Do not distribute.
UNDERSTANDING DISTRIBUTION CHANNELS IN ASEANDistribution networks are typically broken down into “modern” and “traditional” forms of trade channels and within the latter category, a further disaggregation is usually made between “on-premise” and “off-premise” forms of trade channels. Modern retail includes convenience stores (e.g., Indomaret, 7-eleven), department stores (e.g., Matahari and Sogo), hypermarkets (e.g., Carrefour, Makro), supermarkets (e.g., CP Foods), and specialty stores (e.g., Ace Hardware). Traditional off-premise channels include wet markets (where live animals are sold), street stalls (e.g., “warungs”), and individually owned shops. Traditional on-premise channels include restaurants, bars, cafes and school canteens.
Definitions of trade channels can vary somewhat across countries, particularly in terms of what is defined as modern versus traditional retail trade. An aligned set of definitions was used linked to data availability across countries (Chart 8).
CHART 8
BREAKDOWN OF TRADE CHANNELS
Total trade
TraditionalModern
Convenience stores/ petrol
stations
Hyper/ supermarkets
Other modern stores (e.g., Pharmacies, department
stores, specialty stores)
Traditional grocery stores
On-premiseOther traditional (e.g.,
wet markets, street stalls,
and individually owned shops)

18
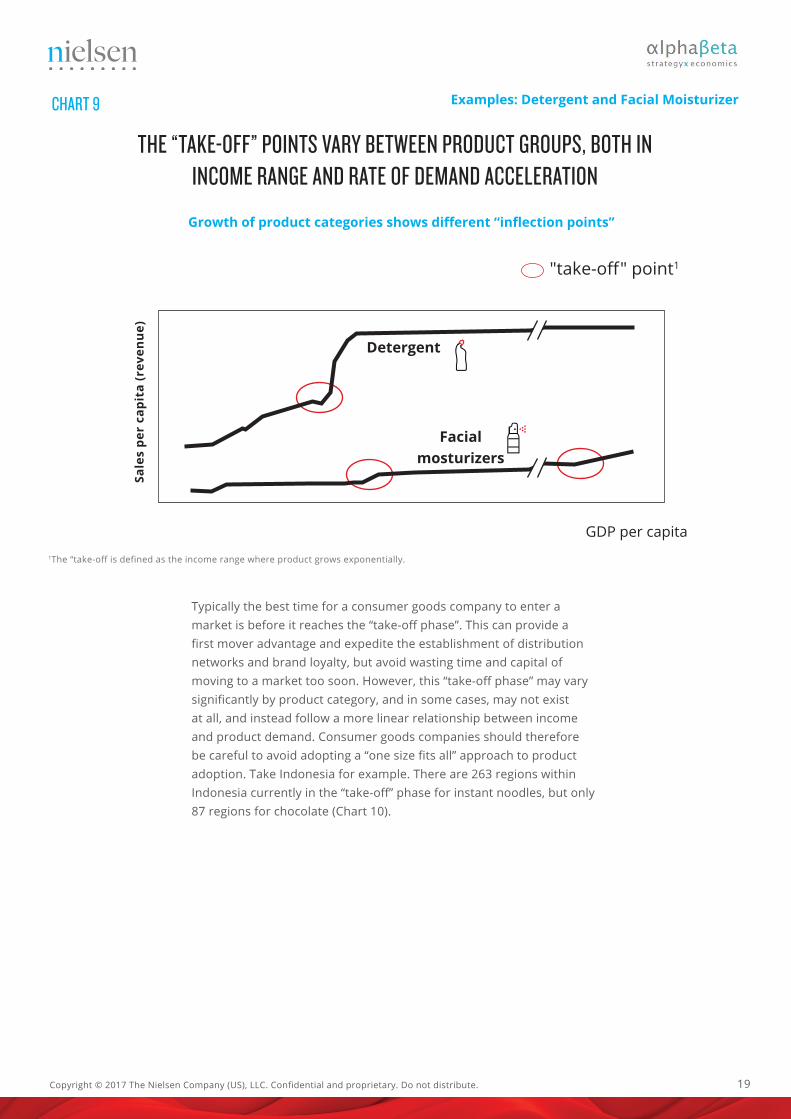
MYTH 6: INCOME LEVELS ARE A RELIABLE GAUGE OF LIKELY CONSUMER DEMAND ACROSS PRODUCT CATEGORIESConsumer goods companies often think about the relationship between income and product adoption following an “S-curve”. It begins flat, with incomes growing but no significant change in product demand as the product is still likely unaffordable for a large share of the local population. This phase is known as the “warm-up phase”. After this point, once incomes have risen sufficiently, there is strong growth in consumer demand, with growth outpacing the growth in incomes. This is known as the “take-off” phase, and is typically the most exciting for consumer goods companies. Finally, the product adoption curve begins to once again flatten out as product demand becomes largely saturated. This is known as the “cooldown phase”.
In ASEAN the shape of the product adoption curve varies significantly by product category. Some categories, such as detergent, closely resemble the typical S-curve, whereas others, like facial moisturizer, do not follow this pattern (Chart 9). This is important because the shape of the adoption curve has fundamental implications for business strategy.
THINK YOU KNOW WHEN DEMAND IS ABOUT TO TAKE OFF?Income per capita where product demand grows significantly faster than income growth; US$ (current exchange rates)
...........................$3,000
...........................$2,500
...........................$2,000
...........................$2,000
...........................$1,000
...........................$1,000
...........................$1,000
.............................None
.............................None
.............................None
19Copyright © 2017 The Nielsen Company (US), LLC. Confidential and proprietary. Do not distribute.
CHART 9
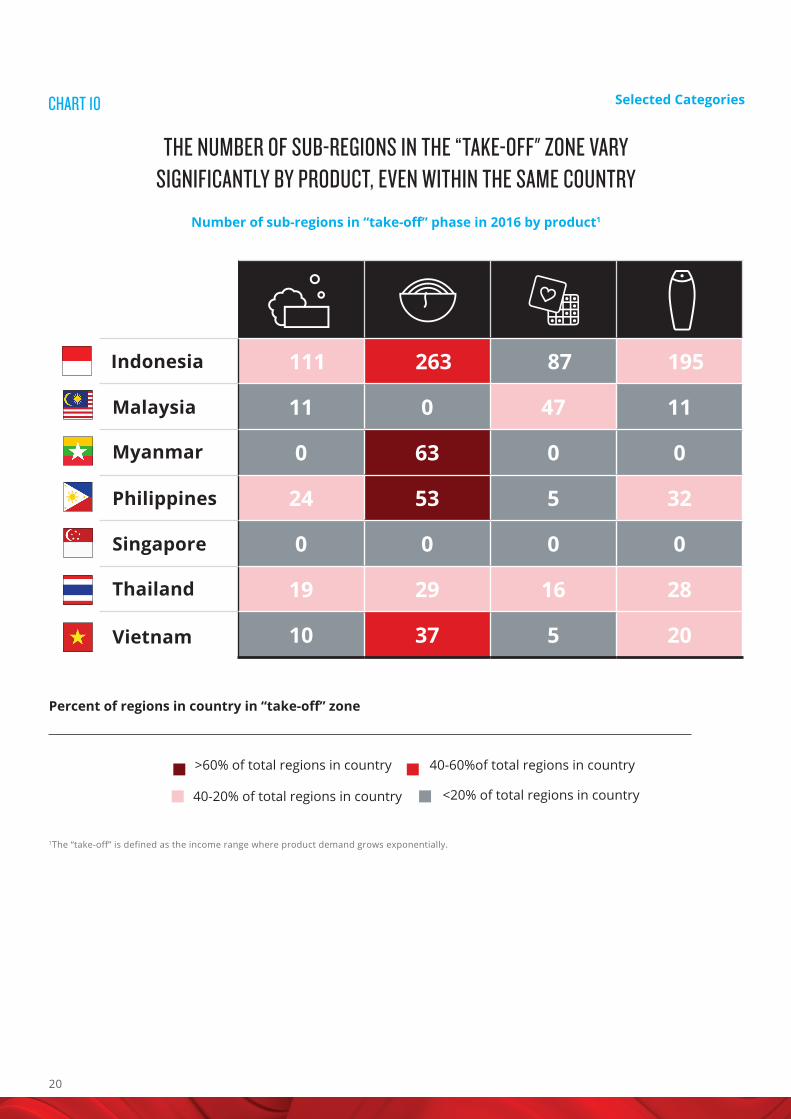
Typically the best time for a consumer goods company to enter a market is before it reaches the “take-off phase”. This can provide a first mover advantage and expedite the establishment of distribution networks and brand loyalty, but avoid wasting time and capital of moving to a market too soon. However, this “take-off phase” may vary significantly by product category, and in some cases, may not exist at all, and instead follow a more linear relationship between income and product demand. Consumer goods companies should therefore be careful to avoid adopting a “one size fits all” approach to product adoption. Take Indonesia for example. There are 263 regions within Indonesia currently in the “take-off” phase for instant noodles, but only 87 regions for chocolate (Chart 10).
THE “TAKE-OFF” POINTS VARY BETWEEN PRODUCT GROUPS, BOTH IN INCOME RANGE AND RATE OF DEMAND ACCELERATION
Growth of product categories shows different “inflection points”
Examples: Detergent and Facial Moisturizer
"take-off" point1
GDP per capita
Facial mosturizers
Detergent
1The “take-off is defined as the income range where product grows exponentially.
Sale
s pe
r ca
pita
(rev
enu
e)
20
CHART 10
THE NUMBER OF SUB-REGIONS IN THE “TAKE-OFF" ZONE VARY SIGNIFICANTLY BY PRODUCT, EVEN WITHIN THE SAME COUNTRY
Number of sub-regions in “take-off” phase in 2016 by product1
Percent of regions in country in “take-off” zone
>60% of total regions in country 40-60%of total regions in country
40-20% of total regions in country
1The “take-off” is defined as the income range where product demand grows exponentially.
<20% of total regions in country
Selected Categories
Indonesia 111 263 87 195
Malaysia 11 0 47 11
Myanmar 0 63 0 0
Philippines 24 53 5 32
Singapore 0 0 0 0
Thailand 19 29 16 28
Vietnam 10 37 5 20
21Copyright © 2017 The Nielsen Company (US), LLC. Confidential and proprietary. Do not distribute.
21
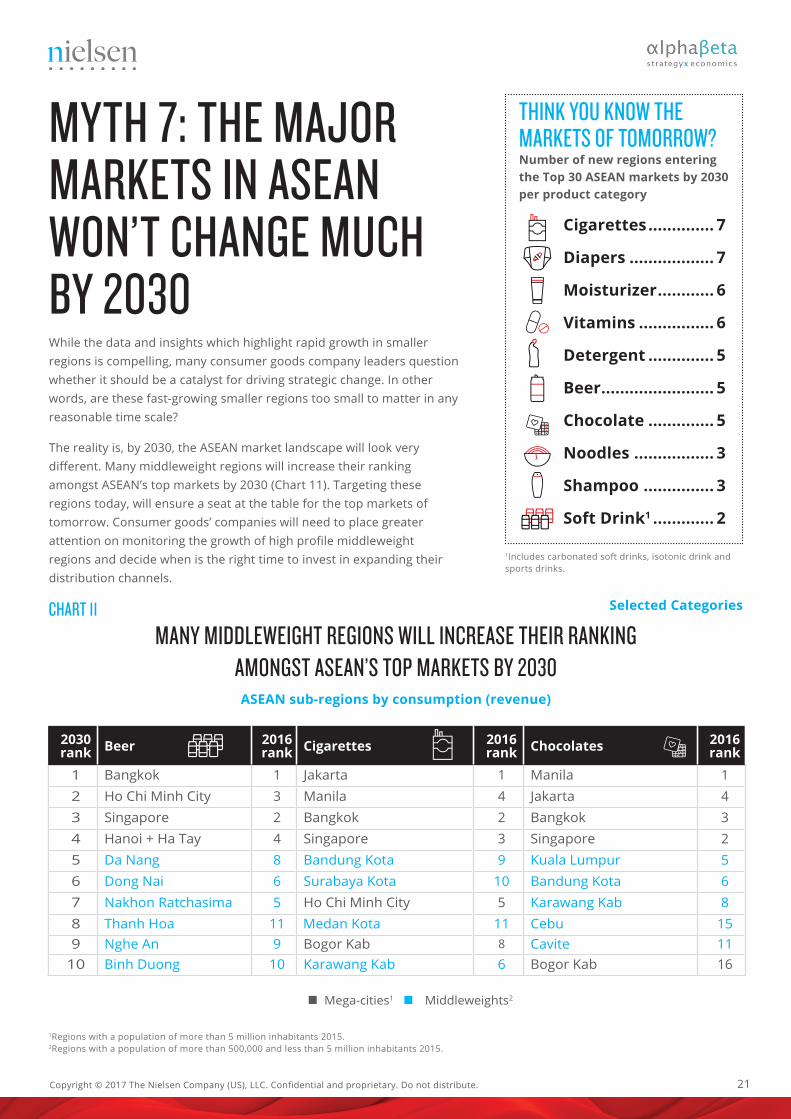
MYTH 7: THE MAJOR MARKETS IN ASEAN WON’T CHANGE MUCH BY 2030While the data and insights which highlight rapid growth in smaller regions is compelling, many consumer goods company leaders question whether it should be a catalyst for driving strategic change. In other words, are these fast-growing smaller regions too small to matter in any reasonable time scale?
The reality is, by 2030, the ASEAN market landscape will look very different. Many middleweight regions will increase their ranking amongst ASEAN’s top markets by 2030 (Chart 11). Targeting these regions today, will ensure a seat at the table for the top markets of tomorrow. Consumer goods’ companies will need to place greater attention on monitoring the growth of high profile middleweight regions and decide when is the right time to invest in expanding their distribution channels.
THINK YOU KNOW THE MARKETS OF TOMORROW?Number of new regions entering the Top 30 ASEAN markets by 2030 per product category
Cigarettes .............. 7
Diapers .................. 7
Moisturizer ............ 6
Vitamins ................ 6
Detergent .............. 5
Beer ........................ 5
Chocolate .............. 5
Noodles ................. 3
Shampoo ............... 3
Soft Drink1 ............. 2
MANY MIDDLEWEIGHT REGIONS WILL INCREASE THEIR RANKING AMONGST ASEAN’S TOP MARKETS BY 2030ASEAN sub-regions by consumption (revenue)
Selected Categories
2030 rank Beer 2016
rank Cigarettes 2016 rank Chocolates 2016
rank1 Bangkok 1 Jakarta 1 Manila 12 Ho Chi Minh City 3 Manila 4 Jakarta 43 Singapore 2 Bangkok 2 Bangkok 34 Hanoi + Ha Tay 4 Singapore 3 Singapore 25 Da Nang 8 Bandung Kota 9 Kuala Lumpur 56 Dong Nai 6 Surabaya Kota 10 Bandung Kota 67 Nakhon Ratchasima 5 Ho Chi Minh City 5 Karawang Kab 88 Thanh Hoa 11 Medan Kota 11 Cebu 159 Nghe An 9 Bogor Kab 8 Cavite 11
10 Binh Duong 10 Karawang Kab 6 Bogor Kab 16
Mega-cities1 Middleweights2
1Regions with a population of more than 5 million inhabitants 2015.2Regions with a population of more than 500,000 and less than 5 million inhabitants 2015.
CHART 11
1Includes carbonated soft drinks, isotonic drink and sports drinks.
22
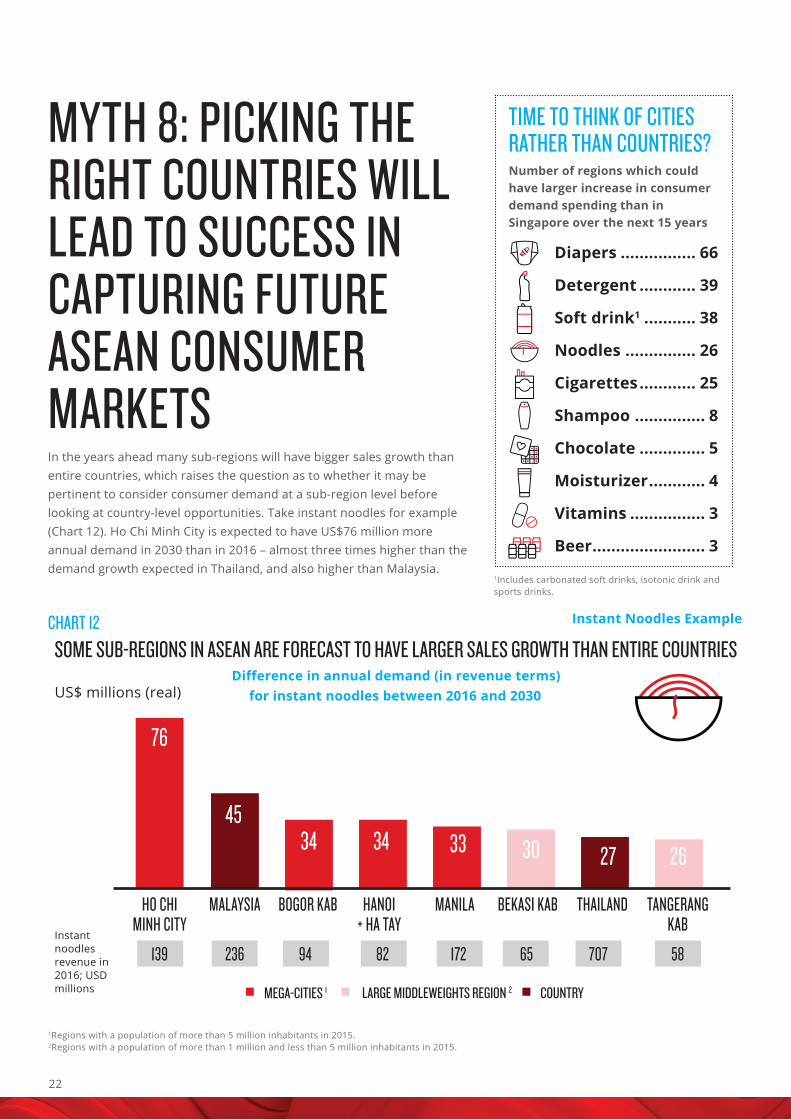
Difference in annual demand (in revenue terms)US$ millions (real) for instant noodles between 2016 and 2030
HO CHI MINH CITY
139
MALAYSIA
236
BOGOR KAB
94
MANILA
82
HANOI + HA TAY
172
BEKASI KAB
65
THAILAND
707
TANGERANG KAB
58
Instant Noodles Example
Instant noodles revenue in 2016; USD millions MEGA-CITIES 1 LARGE MIDDLEWEIGHTS REGION 2 COUNTRY
1Regions with a population of more than 5 million inhabitants in 2015.2Regions with a population of more than 1 million and less than 5 million inhabitants in 2015.
MYTH 8: PICKING THE RIGHT COUNTRIES WILL LEAD TO SUCCESS IN CAPTURING FUTURE ASEAN CONSUMER MARKETSIn the years ahead many sub-regions will have bigger sales growth than entire countries, which raises the question as to whether it may be pertinent to consider consumer demand at a sub-region level before looking at country-level opportunities. Take instant noodles for example (Chart 12). Ho Chi Minh City is expected to have US$76 million more annual demand in 2030 than in 2016 – almost three times higher than the demand growth expected in Thailand, and also higher than Malaysia.
TIME TO THINK OF CITIES RATHER THAN COUNTRIES?Number of regions which could have larger increase in consumer demand spending than in Singapore over the next 15 years
Diapers ................ 66
Detergent ............ 39
Soft drink1 ........... 38
Noodles ............... 26
Cigarettes ............ 25
Shampoo ............... 8
Chocolate .............. 5
Moisturizer ............ 4
Vitamins ................ 3
Beer ........................ 3
76
4534 34 33 30 27 26
CHART 12SOME SUB-REGIONS IN ASEAN ARE FORECAST TO HAVE LARGER SALES GROWTH THAN ENTIRE COUNTRIES
1Includes carbonated soft drinks, isotonic drink and sports drinks.
23Copyright © 2017 The Nielsen Company (US), LLC. Confidential and proprietary. Do not distribute.
HOW CAN COMPANIES NAVIGATE THE COMPLEX ASEAN LANDSCAPE AND TAP INTO GROWTH HOT SPOTS?ASEAN is incredibly diverse. Even at a country level, regions are extremely diverse. The standard deviation in average incomes between ASEAN countries is over seven times that of EU member states. The standard deviation within countries can be even larger. The region is also remarkably diverse in terms of language, culture and religion. Myanmar alone has more than 135 ethnic groups.
In such a complex landscape it is important to take a granular approach to understanding market opportunities in ASEAN. Moving beyond national averages to understand regional differences is crucial. Focus should be placed on establishing granular plans targeting specific customer segments and regions. In some cases, it may make more sense to prioritize middleweight regions above countries.
Identifying appropriate products for different income points is also crucial. This requires a detailed understanding of the “take off” points for different products across regions in ASEAN. This approach facilitates market-specific innovation to meet consumers’ evolving needs and purchasing power. For example, in the Philippines, small portion sized products (“tingi-tingi”) are particularly popular due to the low disposable incomes.
Finally, business model innovation is crucial. Given the diversity of regions in ASEAN and the fragmented distribution channels, it will be important for companies to think about innovative, low cost approaches to building market presence. For example, establishing early networks with local distributors and monitoring market developments in regions that are in the “warm-up” phase can help to prepare for the “take-off” phase. For more advanced regions, the business model could evolve to establishing a greater “on the ground” presence. And finally, for regions in the “cooldown” phase, focus should be placed on lowering cost to serve through driving efficiencies in the supply chain.
WANT TO FIND OUT MORE?CONTACT US AT:[email protected] [email protected]

24
ABOUT NIELSENNielsen Holdings plc (NYSE: NLSN) is a global performance management company that provides a comprehensive understanding of what consumers watch and buy. Nielsen’s Watch segment provides media and advertising clients with Nielsen Total Audience measurement services for all devices on which content — video, audio and text — is consumed. The Buy segment offers consumer packaged goods manufacturers and retailers the industry’s only global view of retail performance measurement. By integrating information from its Watch and Buy segments and other data sources, Nielsen also provides its clients with analytics that help improve performance. Nielsen, an S&P 500 company, has operations in over 100 countries, covering more than 90% of the world’s population. For more information, visit www.nielsen.com.
ABOUT ALPHABETAAlphaBeta is a strategy advisory business serving clients across Australia and Asia from offices in Singapore and Sydney. Our team of advisors are experts in both strategy and economics who partner with clients from the private, public, and not-for-profit sectors to identify the forces shaping their markets and develop practical plans to create prosperity and wellbeing.

25